

Abstract
Activation of the endoplasmic reticulum (ER)–resident adaptor protein STING, a component of a cytosolic DNA–sensing pathway, induces the transcription of genes encoding type I interferons (IFNs) and other proinflammatory factors. Because STING is activated at the Golgi apparatus, control of the localization and activation of STING is important in stimulating antiviral and antitumor immune responses. Through a genome-wide CRISPR interference screen, we found that STING activation required the Golgi-resident protein ACBD3, which promotes the generation of phosphatidylinositol 4-phosphate (PI4P) at the trans-Golgi network, as well as other PI4P-associated proteins. Appropriate localization and activation of STING at the Golgi apparatus required ACBD3 and the PI4P-generating kinase PI4KB. In contrast, STING activation was enhanced when the lipid-shuttling protein OSBP, which removes PI4P from the Golgi apparatus, was inhibited by the FDA-approved antifungal itraconazole. The increase in the abundance of STING-activating phospholipids at the trans-Golgi network resulted in the increased production of IFN-β and other cytokines in THP-1 cells. Furthermore, a mutant STING that could not bind to PI4P failed to traffic from the ER to the Golgi apparatus in response to a STING agonist, whereas relocalization of STING to PI4P-enriched areas elicited STING activation in the absence of stimulation with a STING agonist. Thus, PI4P is critical for STING activation and manipulating PI4P abundance may therapeutically modulate STING-dependent immune responses.
Introduction
Cytosolic DNA is a key danger signal that can be detected by various cytosolic DNA-sensing pathways, most notably the cGAS/STING pathway. Upon activation, this innate immune pathway promotes the expression of inflammatory molecules, including type I interferons, cytokines and chemokines, and is thereby critical for shaping the innate and adaptive immune response. The cGAS/STING pathway senses cytosolic DNA originating from viruses and bacteria1 as well as cyclic dinucleotides (CDN) produced by certain bacteria2–4. The STING pathway is also activated by cytosolic self-DNA, which accumulates in cells in certain autoinflammatory disorders5,6, and in cells subjected to DNA damage, as occurs in premalignant and tumour cells7,8. In addition, the cGAS/STING pathway plays a role in the immune response to certain RNA viruses, such as dengue virus9, influenza virus10, and coronaviruses11. RNA viruses may trigger the cGAS/STING pathway by stimulating the accumulation of host DNA in the cytosol of infected cells12. Moreover, STING can be activated by virus-induced lipid membrane remodelling events10. The critical role of STING in the immune response to virus infection is underlined by the observation that numerous viruses, including, herpes virus, vaccinia virus, dengue virus and SARS-coronavirus11, counteract STING activation, thereby evading the host immune response.
STING regulation is a complex process that starts with binding of ER-localized STING to its ligands, most notably cyclic dinucleotides (CDNs). The mammalian CDN 2’3’-cGAMP is produced endogenously by the enzyme cGAS upon detection of cytosolic DNA and binds STING with nanomolar affinity. In addition, 2’3’-cGAMP can be imported from the extracellular environment or neighbouring cells to activate STING13. Similarly, synthetic phosphodiesterase-resistant CDNs, like 2’3’-RR CDA (RR CDA) used in cancer immunotherapy, are transported into the cell and bind ER-localized STING with high affinity (nanomolar range)14. Upon CDN binding, STING translocates to the Golgi compartment by a poorly understood process that is dependent on an increase in the production of the phospholipid phosphatidylinositol 3-phosphate at the ER15. At the trans-Golgi network (TGN), STING oligomers are phosphorylated by TBK1, and STING subsequently activates the transcription factors IRF3 and NF-κB. To prevent sustained immune activation, activated STING is degraded in the endo-lysosomal compartment13.
Anomalies at any of these steps can lead to aberrant STING activation, resulting in auto inflammatory conditions16, or diminished STING signalling and immune escape, as observed in certain tumours and virus-infected cells17,18. Furthermore, STING activity can be redirected to generate a tumour- or virus-promoting environment19,20. Many of the factors orchestrating the quality and intensity of the STING response remain unknown.
To find factors regulating STING activity, we previously performed a genome-wide CRISPR interference (CRISPRi) screen21. Using this method, we successfully identified a transporter that imports STING agonists from the extracellular environment. In addition, we identified many host factors that may drive or dampen STING activation. One of the top hits in this screen that was necessary for strong activation of the STING pathway was the gene encoding ACBD3. This Golgi-resident protein is a multifunctional protein that promotes the distribution of phosphatidylinositol 4-phosphate (PI4P) to the Golgi by recruiting the PI4P kinase PI4KB22, and has not previously been implicated in STING activation. Here, we showed that ACBD3 increased STING activation by promoting STING mobilization to the Golgi. We further showed that STING signalling depends on other components that regulate PI4P levels or localization, including Sac1, PI4KB and the PI4P-cholesterol exchanger OSBP, underscoring the importance of PI4P in STING signalling. The phospholipid PI4P played a role in recruiting several proteins to the Golgi and the function of those proteins23, and our results indicated a role in STING recruitment and/or retention in the Golgi and STING signalling in the Golgi. The role of the PI4P pathway in STING signalling was especially interesting, as it demonstrated the therapeutic potential of modifying the immune response by STING by targeting the pathway with FDA and EMA-approved drugs.
Results
ACBD3 expression is necessary for efficient STING activation
To confirm the role of ACBD3 in STING activation, we depleted the expression of ACBD3 in THP-1 monocytes using CRISPRi gRNAs (fig. S1A). To measure STING activation in these cells, we expressed an ISRE-IFNb-tdTomato reporter, which robustly induces tdTomato expression in response to STING activation21. Indeed, control cells stimulated with the highly potent STING agonist 2’3’-RR CDA expressed the fluorescent tdTomato reporter, but the reporter response was diminished in cells transduced with gRNAs targeting ACBD3 or IRF3, the latter a STING activated transcription factor critical for reporter gene expression (Fig. 1A and 1B). STING-independent reporter activation by human interferon-beta was not affected. Restoration of ACBD3 expression rescued reporter activation in ACBD3-depleted cells (Fig. 1C).
Figure 1.
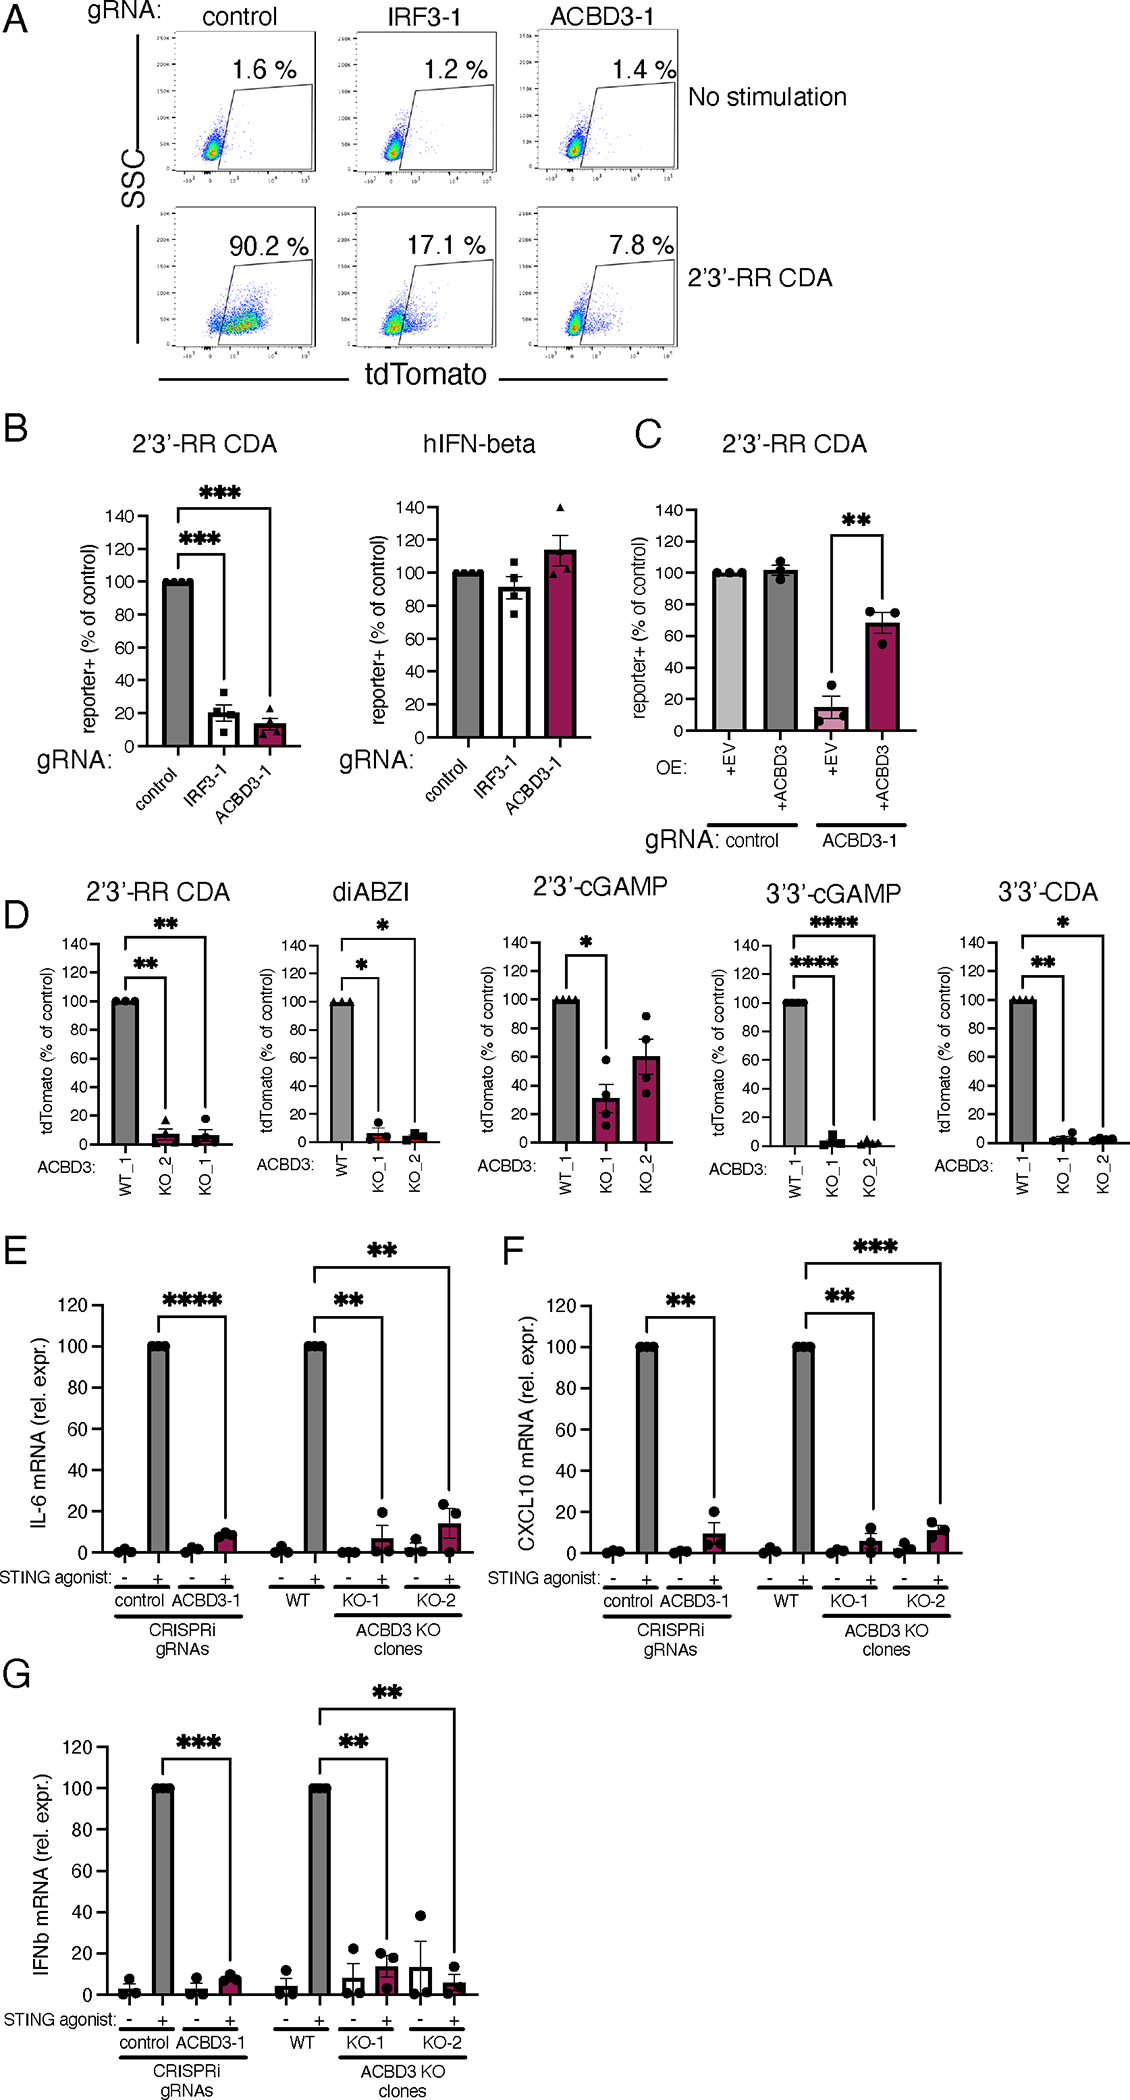
ACBD3 expression is necessary for tdTomato reporter activation and cytokine production induced by STING agonists
A. dCas9–KRAB-expressing THP-1 cells transduced with non-targeting gRNA (control), IRF-3-targeting gRNA (IRF3-1) or ACBD3-targeting gRNA (ACBD3-1) were exposed to 2′3′-RR CDA and, tdTomato expression was analyzed by flow cytometry. Representative dot plots of n=3 biological replicates out of 3 independent experiments are shown.
B. THP-1 cells expressing the indicated CRISPRi gRNAs or non-targeting gRNA (control), were stimulated with 2′3′-RR CDA or human interferon beta and tdTomato expression was quantified as in a.
C. Control THP-1 cells and THP-1 cells expressing ACBD3-1 CRISPRi gRNA transduced with ACBD3 or empty vector (EV) were stimulated with 2’3’-RR CDA analysed as in a.
D. THP-1 control clone (WT1) or two THP-1 clones lacking ACBD3 were stimulated with the indicated STING agonists and analyzed as in a.
E-G IL-6 (E) or CXCL10 (F) or IFNB1 (G) mRNA levels in THP-1 cells expressing control or ACBD3 CRISPRi gRNAs, or THP-1 WT or ACBD3 KO clones stimulated with 2’3’-RR CDA (RR-CDA).
B-G. Mean ± SEM of at least n = 3 biological replicates out of 3 independent experiments are shown. B,D Statistical tests were performed on unnormalized data. We performed paired one-way ANOVA followed by Dunnett’s multiple comparisons post-tests to compare each treatment group to the control group. * P< 0.05, *** P< 0.001, **** P< 0.0001, ns: not significant. C. A one-tailed paired t-test was performed on data that had not been normalized to the control sample. E-G. To compare each treatment group to the normalized control value (set at 100), we performed one-sample t-tests. * P< 0.05, ** P< 0.01, *** P< 0.001, **** P< 0.0001.
As further confirmation, we generated ACBD3 knockout cells in THP-1 cells using the conventional CRISPR-Cas9 system (fig. S1B). Two distinct knockout clones lacking ACBD3 expression showed highly reduced reporter activation to a variety of STING agonists, including 2’3’-cGAMP, 2’3’-RR-CDA, the bacterial CDNs 3’3’-cGAMP and 3’3’-CDA, and the non-cyclic dinucleotide STING agonist diABZI (Fig. 1D). Similarly, ACBD3-knockout 293T cells (transduced to express eGFP-mouse STING, eGFP-mSTING) had reduced reporter activation upon STING activation (fig. S2A–B). STING activation leads to downstream transcription of inflammatory genes, including IL-6, CXCL10 and IFNB1. ACBD3 knockdown and knockout THP-1 cells were defective for expression of all of these genes after stimulation with STING agonist (Fig. 1E–G).
ACBD3 is important for STING phosphorylation, clustering and relocalization.
To further investigate the role of ACBD3 in STING activation, we determined the effects of ACBD3 depletion on the different processes involved in STING activation. The uptake of 2’3’-cGAMP or 3’3’-CDA from the extracellular environment was not affected in cells lacking ACBD3, in contrast to cells lacking SLC19A1, one of the CDN transporters (Fig. 2A). A second critical step in immune activation by STING is STING phosphorylation at S366, which is required for downstream activation of IRF3. Upon depletion of ACBD3, STING phosphorylation in response to stimulation with 2’3-RR CDA was strongly reduced (Fig. 2B), whereas the downstream transcription factor IRF3 depletion had no effect on STING phosphorylation. As expected, depletion of the SLC19A1 transporter also diminished STING phosphorylation.
Figure 2.
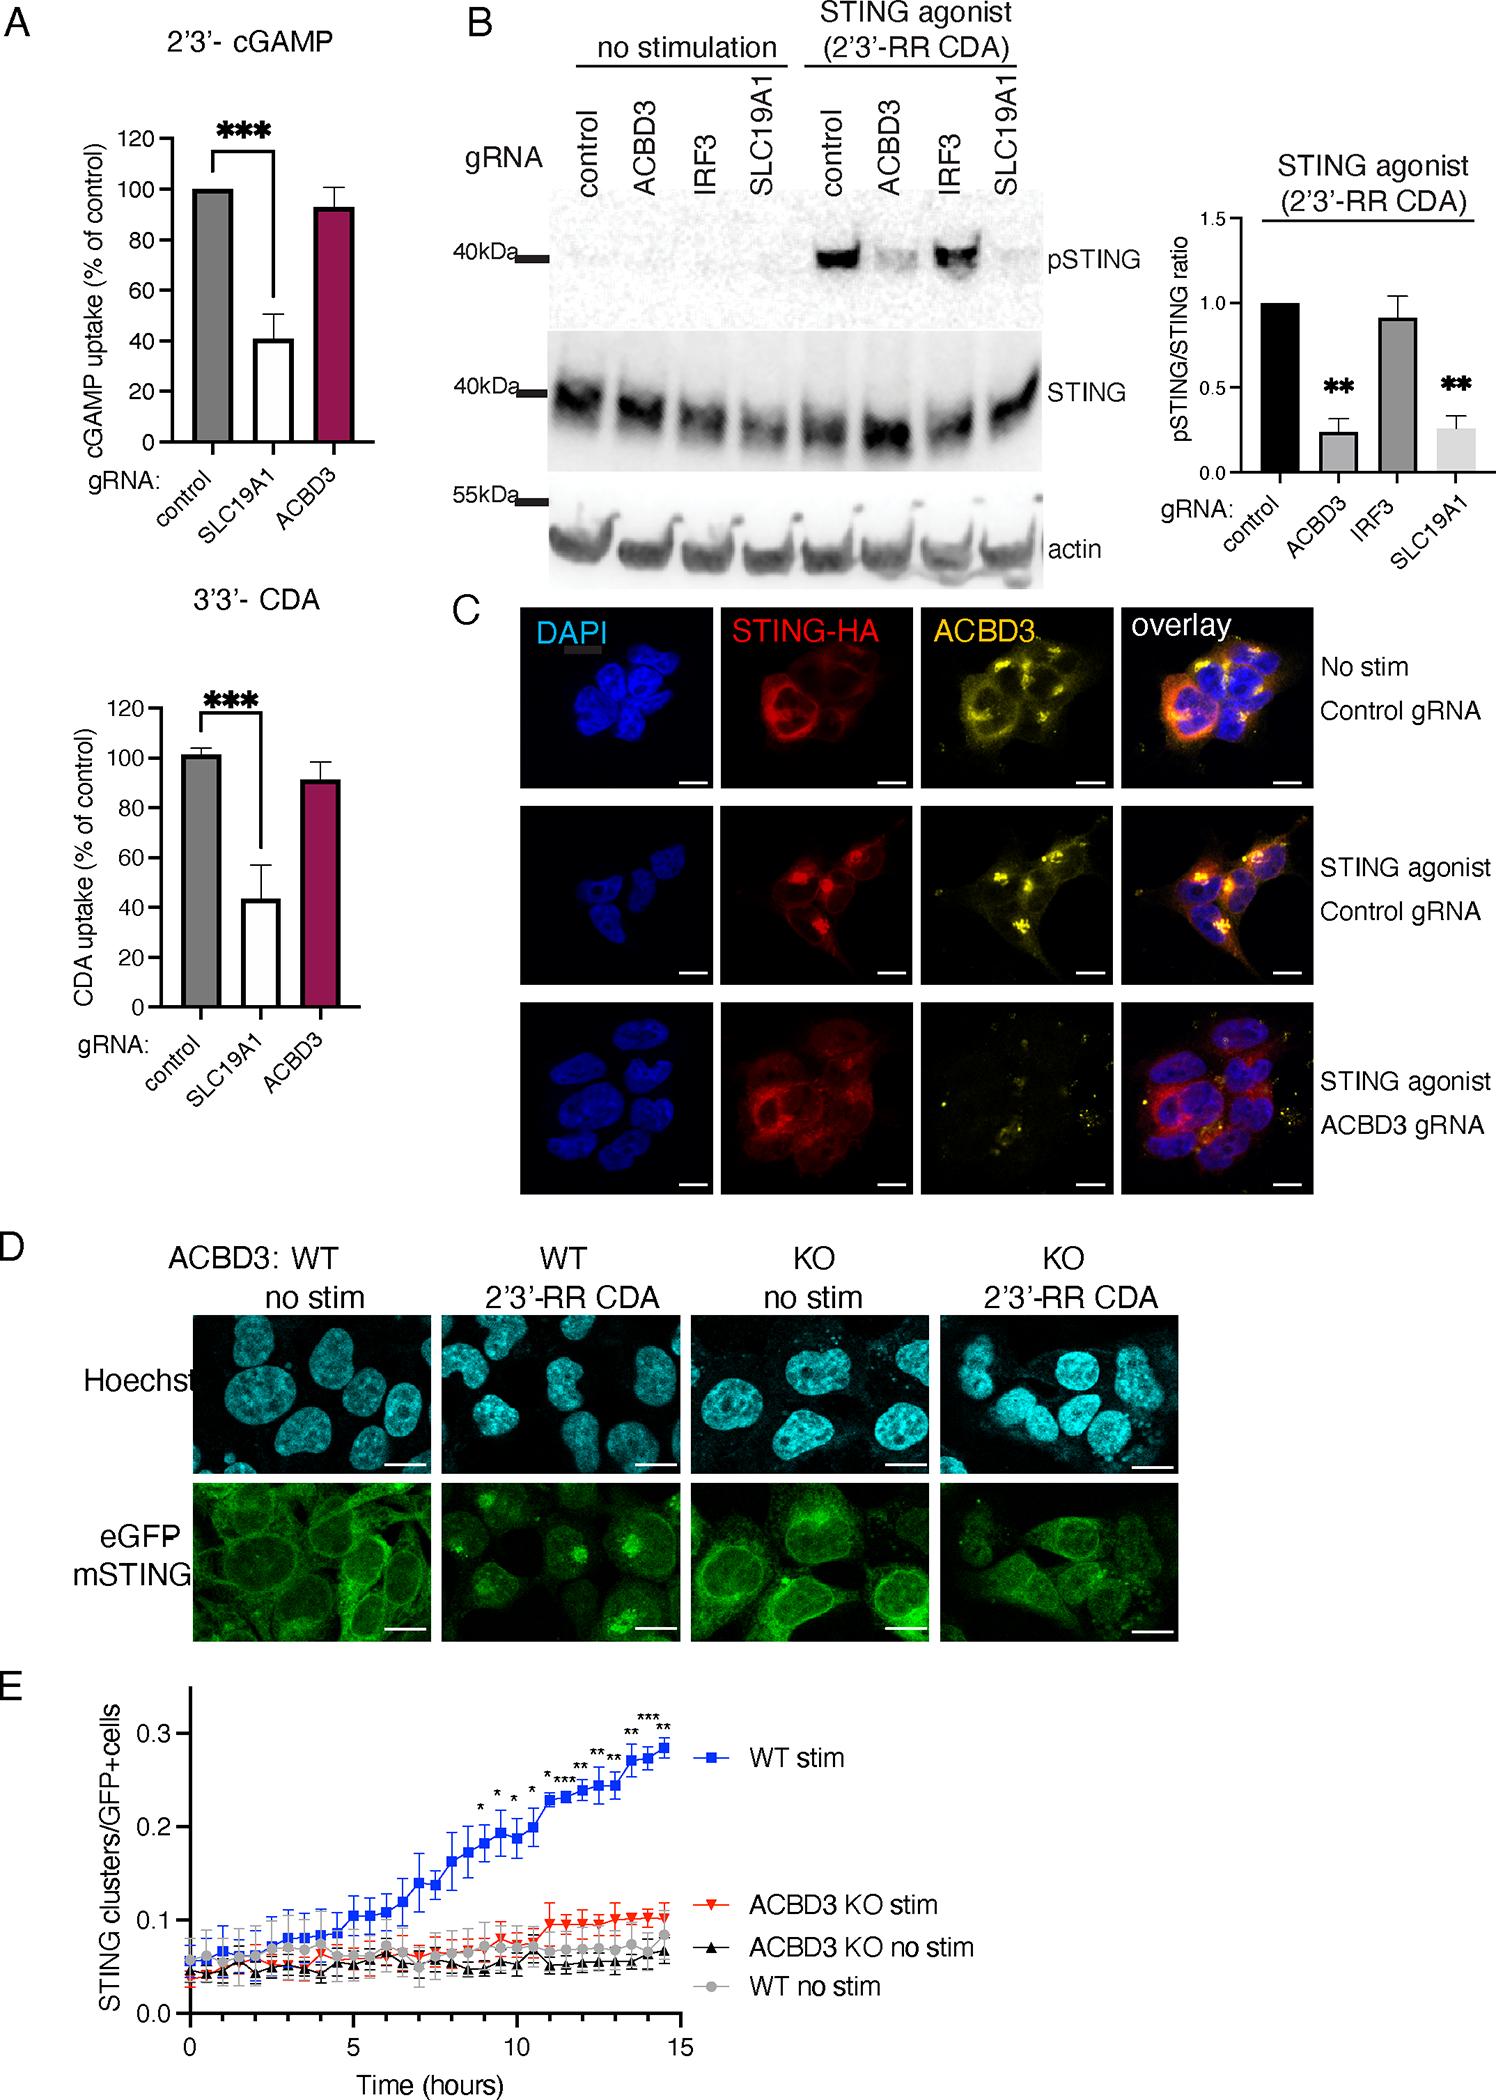
ACBD3 is important for STING phosphorylation, clustering and relocalization.
A. Normalized [32P]2′3′-cGAMP (cGAMP) and [32P]3′3′-c-di-AMP (CDA) uptake by THP-1 monocytes transduced with a non-targeting control CRISPRi gRNA, or SLC19A1 or ACBD3 CRISPRi gRNA. Mean ± SEM of n = 3 biological replicates out of 3 independent experiments are shown. To compare each treatment group to the normalized control value (set at 100), we performed one-sample t-tests. *** P< 0.001.
B. Immunoblot analysis of protein expression and phosphorylation in THP-1 cells expressing indicated CRISPRi gRNAs. Cells were stimulated for with 2’3’-RR CDA or left unstimulated. p-STING: STING phosphorylated on S366. Representative images of n = 3 biological replicates out of 3 independent experiments are shown. Bars show the relative ratios of pSTING over total STING expression in 2’3’-RR CDA-treated samples. Mean ± SEM of n = 3 biological replicates out of 3 independent experiments are shown. To compare each treatment group to the normalized control value (set at 1), we performed one-sample t-tests. ** P< 0.01
C. Immunofluorescence of 293T cells stably transduced with STING-HA and a control CRISPRi gRNA or an ACBD3-targeting CRISPRi gRNA. Cells were stimulated with 2’3’-RR CDA (STING agonist) and stained for HA or ACBD3. Representative images of n = 3 biological replicates out of 3 independent experiments are shown. Scale bar is 10μm
D. Immunofluorescence live-cell imaging of eGFP-tagged mouse-STING stably transduced in control 293T cells or 293T cells lacking ACBD3 (KO) stimulated with 2’3-RR CDA. Representative images of n = 4 biological replicates out of 4 independent experiments are shown. Scale bar is 10μm
E. The number of STING clusters/eGFP+ cells shown in d was quantified over time using the ‘particle analysis’ function of ImageJ. Mean ± SEM of n = 4 biological replicates out of 4 independent experiments are shown. We performed two-way ANOVA followed by Tukey’s multiple comparisons test to compare stimulated WT and stimulated ACBD3 KO treatment groups. * P< 0.05, ** P< 0.01, *** P< 0.001
STING phosphorylation requires STING trafficking from the ER to the trans-Golgi network (TGN), where STING palmitoylation promotes the formation of activation clusters needed for downstream signalling24. Indeed, STING is recruited to perinuclear clusters in HA-STING expressing 293T cells and THP-1 cells upon STING activation (Fig. 2C and S3). These clusters colocalized with the Golgi-resident protein ACBD3. Depletion of ACBD3 expression prevented STING clustering in cells stimulated with 2’3’-RR-CDA. Instead, STING localization was similar to that in unstimulated cells, presumably in the ER. Similarly, live-cell imaging of eGFP-tagged mouse STING (eGFP-mSTING) showed cluster formation in the Golgi region in control 293T cells, but not in knockout cells lacking ACBD3 (Fig. 2D and 2E). Thus, ACBD3 is required for the relocalization of STING upon activation.
STING localizes to PI4P-rich environments
ACBD3 binds and recruits PI4KB to the TGN25. In line with this, ACBD3 colocalized to TGN46 (a Golgi marker) and PI4KB-enriched perinuclear clusters in unstimulated THP-1 cells (Fig. 3A and 3B). In ACBD3 depleted THP-1 cells, perinuclear PI4KB clusters were absent (Fig. 3B). Similarly, PI4KB co-clustered with PI4P in control cells, whereas perinuclear clustering of PI4P and PI4KB was lost in ACBD3 depleted cells (Fig. 3C). PI4P and p-STING colocalized in perinuclear clusters upon STING activation in control cells, but not in ACBD3 depleted cells (Fig. 3D).
Figure 3.

STING localizes to PI4P-rich environments
A-D. Immunofluorescence images of THP-1 cells expressing control or ACBD3 CRISPRi gRNAs stained for the indicated proteins. During cell culturing, THP-1 cells were treated with PMA to make them adherent to the coverslips. In panel d, THP-1 cells were stimulated with 2’3’-RR CDA prior to staining. Scale bar is 10μm. Representative images of at least n = 3 biological replicates out of 3 independent experiments are shown.
PI4KB and OSBP inhibition have opposite effects on STING activation
The role of PI4KB in STING activation was supported by our genome wide screens for STING-associated factors, where PI4KB was identified in the screen for genes whose depletion resulted in weaker activation of the pathway21. We confirmed the role of PI4KB in STING pathway activation by treating cells with the PI4KB inhibitor BF73873526, which reduced STING pathway activation (Fig. 4A). Furthermore, when we depleted PI4KB expression using CRISPRi gRNAs we observed that gRNAs that depleted progressively more Pi4kb mRNA led to greater deficiency in reporter activation after stimulation with STING agonist (Fig. 4B and 4C).
Figure 4.

PI4KB and OSBP inhibition have opposite effects on STING activation
A. THP-1 cells were pre-incubated with the PI4KB inhibitor BF738735 and subsequently stimulated with the STING agonist 2’3’-RR CDA and tdTomato-reporter expression was quantified by flow cytometry. Mean ± SEM of n = 3 biological replicates out of 3 independent experiments are shown. A paired one-tailed t-test was performed on data that was not normalized to the controls.
B. PI4KB mRNA expression levels in THP-1 cells expressing a control gRNA or gRNAs targeting PI4KB. Mean ± SEM of n = 4 biological replicates out of 4 independent experiments are shown. One-sample t-tests were performed to compare each group to the normalized control value set at 1.
C. Cells in (b) were stimulated with 2’3’-RR CDA and tdTomato reporter expression was quantified by flow cytometry. Mean ± SEM of n = 5 biological replicates out of 5 independent experiments are shown. Statistical tests were performed on unnormalized data. We performed paired one-way ANOVA followed by Dunnett’s multiple comparisons post-tests to compare each treatment group to the control group.
D. 293T cells expressing eGFP-mSTING were transfected with a phosphatase-dead Sac1 (inactive), active Sac1 wt, or Sac1-kkaa mutant and stimulated or not with 2’3’-RR CDA (RR-CDA). After stimulation, cells were stained for phospho-STING and analyzed by flow cytometry. Mean ± SEM of n = 4 biological replicates out of 4 independent experiments are shown. One-sample t-tests were performed to compare each group to the normalized control value set at 100.
E. THP-1 cells were preincubated with DMSO or the OSBP inhibitors itraconazole (ITZ) or OSW-1 and stimulated with 2’3’-cGAMP or left untreated. Reporter expression was quantified by flow cytometry. Representative images of n = 3 biological replicates out of 3 independent experiments are shown.
F. Mean fluorescence intensity of tdTomato reporter in THP-1 cells stimulated with 2’3’-cGAMP in the presence of DMSO, itraconazole (ITZ), or OSW-1. Mean ± SEM of n = 3 biological replicates out of 3 independent experiments are shown. Statistical tests were performed on unnormalized data. We performed paired one-way ANOVA followed by Dunnett’s multiple comparisons post-tests to compare each treatment group to the control group.
G. CXCL10 mRNA levels in THP-1 cells pre-treated with DMSO or itraconazole (ITZ) and stimulated with 2’3’-RR CDA (RR-CDA). Mean ± SEM of n = 3 biological replicates out of 3 independent experiments are shown. A paired one-tailed t-test was used to compare the ITZ group to the DMSO control group.
H. tdTomato reporter expression of THP-1 cells pre-treated with the PI4KB inhibitor (PI4KBi) BF738735 followed by pre-treatment with itraconazole (ITZ) and stimulation with 2’3’-cGAMP. Mean ± SEM of n = 3 biological replicates out of 3 independent experiments are shown. We performed paired one-way ANOVA followed by Dunnett’s multiple comparisons post-tests to compare the indicated treatment groups to the control group.
* P< 0.05, ** P< 0.01, *** P< 0.001.
Upon shuttling to the ER, PI4P is ultimately hydrolysed by the phosphatase Sac1. Overexpression of wild type Sac1 (Sac1-wt) or a Sac1-K583A K585A double mutant that localizes to the TGN (Sac1-kkaa) effectively depletes PI4P at the TGN, in contrast to a phosphatase-dead version of Sac127. In 293T cells expressing eGFP-mSTING, overexpression of Sac1-wt or the Sac1-kkaa mutant significantly impaired STING activation by CDNs compared to overexpression of the phosphatase-dead mutant of Sac1 (Fig. 4D). Taken together, these results suggest that PI4P levels at the TGN are important for proper STING trafficking and activation.
Another protein that affects PI4P levels at the TGN is oxysterol binding protein (OSBP). This protein is localized at membrane contact sites between the TGN and the ER by interacting with VAP at the ER and PI4P at the TGN28. OSBP shuttles PI4P from the TGN to the ER and/or to lysosomes in exchange for cholesterol. Inhibition of OSBP by the plant-extract OSW-1 or the FDA-approved drug itraconazole results in the accumulation of PI4P at the TGN29,30. In light of our finding that STING activation was impaired when PI4P levels were reduced as a result of targeting ACBD3 or PI4KB, we hypothesized that increasing PI4P concentrations at the TGN by targeting or inhibiting OSBP might result in enhanced STING signalling. We tested this by combining limiting doses of RR-CDA or 2’3’-cGAMP, which induced only small responses in THP-1 cells, with itraconazole or OSW-1, which did not by themselves activate the STING pathway. Combining the OSBP inhibitors with limiting doses of STING agonist resulted in a dramatic increase in reporter activation (Fig. 4E, 4F, and fig. S4A). Synergistic pathway activation was also observed when we tested induction of the endogenous transcripts CXCL10 and IFNB1 (Fig. 4G and fig. S4B) or interferon-β1 protein secretion (fig. S4C). The effect was dependent on STING expression (fig. S4D). Finally, immune activation triggered by transfection of dsDNA, which induces endogenous production of 2’3’-cGAMP, was also enhanced in the presence of itraconazole (fig. S4E).
We investigated the role of PI4KB in STING activation by OSBP inhibitors using the PI4KB inhibitor BF738735. PI4KB inhibition completely reverted the amplifying effect of itraconazole on STING activation (Fig. 4H), thereby indicating that OSBP inhibition promotes STING activation via PI4P.
In addition to chemical inhibition of OSBP, we targeted OSBP functionally by expressing interferon-inducible transmembrane protein 3 (IFITM3) in 293T cells. IFITM3 disrupts the interaction between OSBP and VAP at membrane contact sites, thereby preventing OSBP-mediated cholesterol-PI4P exchange31,32. Expression of FLAG-tagged IFITM3 did not promote STING phosphorylation under resting conditions, but significantly promoted STING activation upon stimulation with 2’3’-cGAMP (fig. S4F). Overall, these results indicate that agents modulating PI4P levels may have promise for either boosting or restraining STING pathway activation.
OSBP inhibition increases STING activation and decreases STING degradation
To further dissect the mechanism by which OSBP inhibition increases STING activation, we tested the phosphorylation status of STING at different time points after stimulation (Fig. 5A). Relative to the results after stimulation with 2’3’ cGAMP alone, the addition of itraconazole resulted in a clear increase in STING phosphorylation at 8h (see Fig 5B for quantification). OSBP inhibition in the absence of STING agonists did not promote STING phosphorylation (fig. s5A). When combined with 2’3’ cGAMP, OSBP inhibitors also enhanced the phosphorylation of TBK-1 and IRF3, and the degradation of IκBα, the latter a hallmark of NF-κB activation (Fig. 5B). Furthermore, stimulating cells with limiting amounts of 2’3’-cGAMP in the presence of OSBP inhibitors promoted eGFP-mSTING clustering (Fig. 5C and 5D). The pronounced STING activation induced by itraconazole did not result from an increase in 2’3’-cGAMP taken up from the extracellular environment (fig. S5B).
Figure 5.

OSBP inhibition increases STING activation and decreases STING degradation
A. Immunoblot analysis of the indicated (phosphorylated) proteins expressed by THP-1 cells. Cells were pre-treated with DMSO (D) or itraconazole (I) and stimulated with 2’3’-cGAMP for the indicated time points. Representative images of n = 3 biological replicates out of 3 independent experiments are shown.
B. Immunoblot analysis of THP-1 cells pre-incubated as in panel A, and stimulated with 2’3’-cGAMP. Representative images of n = 3 biological replicates out of 3 independent experiments are shown. Bars show the relative ratios of pSTING over total STING expression in 2’3’-cGAMP-treated samples. Mean ± SEM of n = 3 biological replicates out of 3 independent experiments are shown. To compare each treatment group to the normalized control value (set at 1), we performed one-sample t-tests. * P< 0.05
C. Immunofluorescence live-cell imaging eGFP-tagged mouse-STING in 293T cells pre-treated with DMSO or itraconazole (ITZ) and stimulated with 2’3’-cGAMP. Representative images of n = 4 biological replicates out of 4 independent experiments are shown.
D. The number of STING clusters/GFP+ cells shown in c was quantified over time using the ‘particle analysis’ function of ImageJ. Quantification of n = 4 biological replicates out of 4 independent experiments is shown. We performed two-way ANOVA followed by Tukey’s multiple comparisons test to compare stimulated stimulated ITZ and stimulated DMSO groups. * P< 0.05, ** P< 0.01, *** P< 0.001, **** P< 0.0001
E. Expression of eGFP-tagged mouse STING in THP-1 cells pre-treated with DMSO or itraconazole for and stimulated with 2’3’-RR CDA or left unstimulated. Representative image of n = 3 biological replicates out of 3 independent experiments is shown.
F. Quantification of eGFP-STING in THP-1 cells shown in e. Mean ± SEM of n = 3 biological replicates out of 3 independent experiments are shown. A one-tailed paired t-test was used to compare the indicated groups. ** P< 0.01
After activation, STING traffics to the endolysosomal compartment for degradation33. To quantify STING degradation, eGFP-mSTING expression was measured 20h after activation in the presence of DMSO or itraconazole (Fig. 5E). Upon activation, eGFP-mSTING was degraded in control cells, but degradation was significantly reduced in the presence of itraconazole (Fig. 5F).
Mutating the PI4P binding site of STING prevents STING activation.
To understand how PI4P affects STING activation and localization, we performed a number of complementary experiments. First, we expressed a STING mutant incapable of binding PI4P due to the replacement of 4 positively-charged amino acids in the α3 helix of STING with glutamate residues (STING 4POSE)34. In contrast to wild type STING, the STING 4POSE mutant showed no phosphorylation upon stimulation with 2’3-RR CDA (Fig. 6A). Furthermore, upon stimulation, the PI4P-binding mutant did not form activation clusters over time (Fig. 6B).
Figure 6.

Mutating the PI4P binding site of STING prevents STING activation.
A. STING phosphorylation in 293T cells transfected with WT eGFP-STING or eGFP-STING 4POSE. Cells were stimulated with 2’3’-RR CDA prior to quantification of STING phosphorylation by flow cytometry. Mean ± SEM of n = 3 biological replicates out of 3 independent experiments are shown. A one-tailed paired t-test was performed on non-normalized data for the indicated samples. * P< 0.05
B. Microscope images of STING cluster formation in 293T cells transfected with WT eGFP-STING or eGFP-STING 4POSE stimulated for the indicated hours with 2’3’-RR CDA. Scale bar is 10μm. Nuclei were counterstained using Hoescht. Representative image of n = 3 biological replicates out of 3 independent experiments is shown.
C. Microscope images of STING cluster formation in 293T cells transfected with the indicated eGFP-STING variants. Scale bar is 10μm. Nuclei were counterstained using DAPI. Representative image of n = 3 biological replicates is shown.
D. STING phosphorylation in 293T cells transfected with indicated STING variants. Cells were stimulated with 2’3’-RR CDA prior to quantification of STING phosphorylation by flow cytometry. Mean ± SEM of n = 3 biological replicates out of 3 independent experiments are shown. A paired one-tailed t-test was performed to compare the indicated groups. *** P< 0.001
Second, we made use of the natural V155M mutation in human STING (V154M in mouse STING), which causes constitutive STING activation and localization at the Golgi,35 by mimicking a ligand-bound conformation of STING36. In line with this, STING V154M expressed in 293T cells formed clusters (Fig. 6C) and was phosphorylated in the absence of stimulation (Fig. 6D). Introduction of the V154M mutation in the STING 4POSE variant prevented constitutive STING clustering and phosphorylation. These results suggest that PI4P binding by STING is essential for activation of wild type STING and constitutive STING activation by the V154M variant.
Targeting STING to PI4P-enriched environments promotes STING activation.
Finally, we asked whether forced relocalization of WT STING to a PI4P-enriched environment would cause STING activation, even in the absence of STING agonist stimulation. To accomplish this, we targeted eGFP-STING to a PI4P-enriched environment using a Camelidae-derived nanobody specific for GFP37. This GFP-binding protein (GBP) was fused to the monomeric red fluorescent protein mScarlet-I38 to monitor expression and co-localization with eGFP-STING. mScarlet-GBP colocalized with eGFP-STING and formed clusters upon stimulation with STING agonists, unlike mScarlet lacking a GBP domain (fig. S6A). Next, we fused mScarlet-GBP to the pleckstrin homology (PH) domain of FAPP1, which is a well-defined PI4P-sensor39. Co-expression of mScarlet-GBP-FAPP1 and eGFP-STING dramatically promoted STING clustering (Fig. 7A, and S6A). FAPP1 and STING co-clusters colocalized in PI4P-enriched domains (fig. S6B). These PI4P-enriched clusters contained high levels of phosphorylated STING (Fig. 7A), suggesting robust activation even in the absence of stimulation. Quantification of STING phosphorylation by flow cytometry confirmed significant STING activation in the presence of mScarlet-GBP-FAPP1, but not by mScarlet-FAPP1 or mScarlet-GBP (Fig. 7B), Reciprocally, targeting FAPP1-eGFP with mScarlet-GBP-STING also promoted STING clustering (fig. S7A) and significantly increased STING phosphorylation (fig. S7B).
Figure 7.
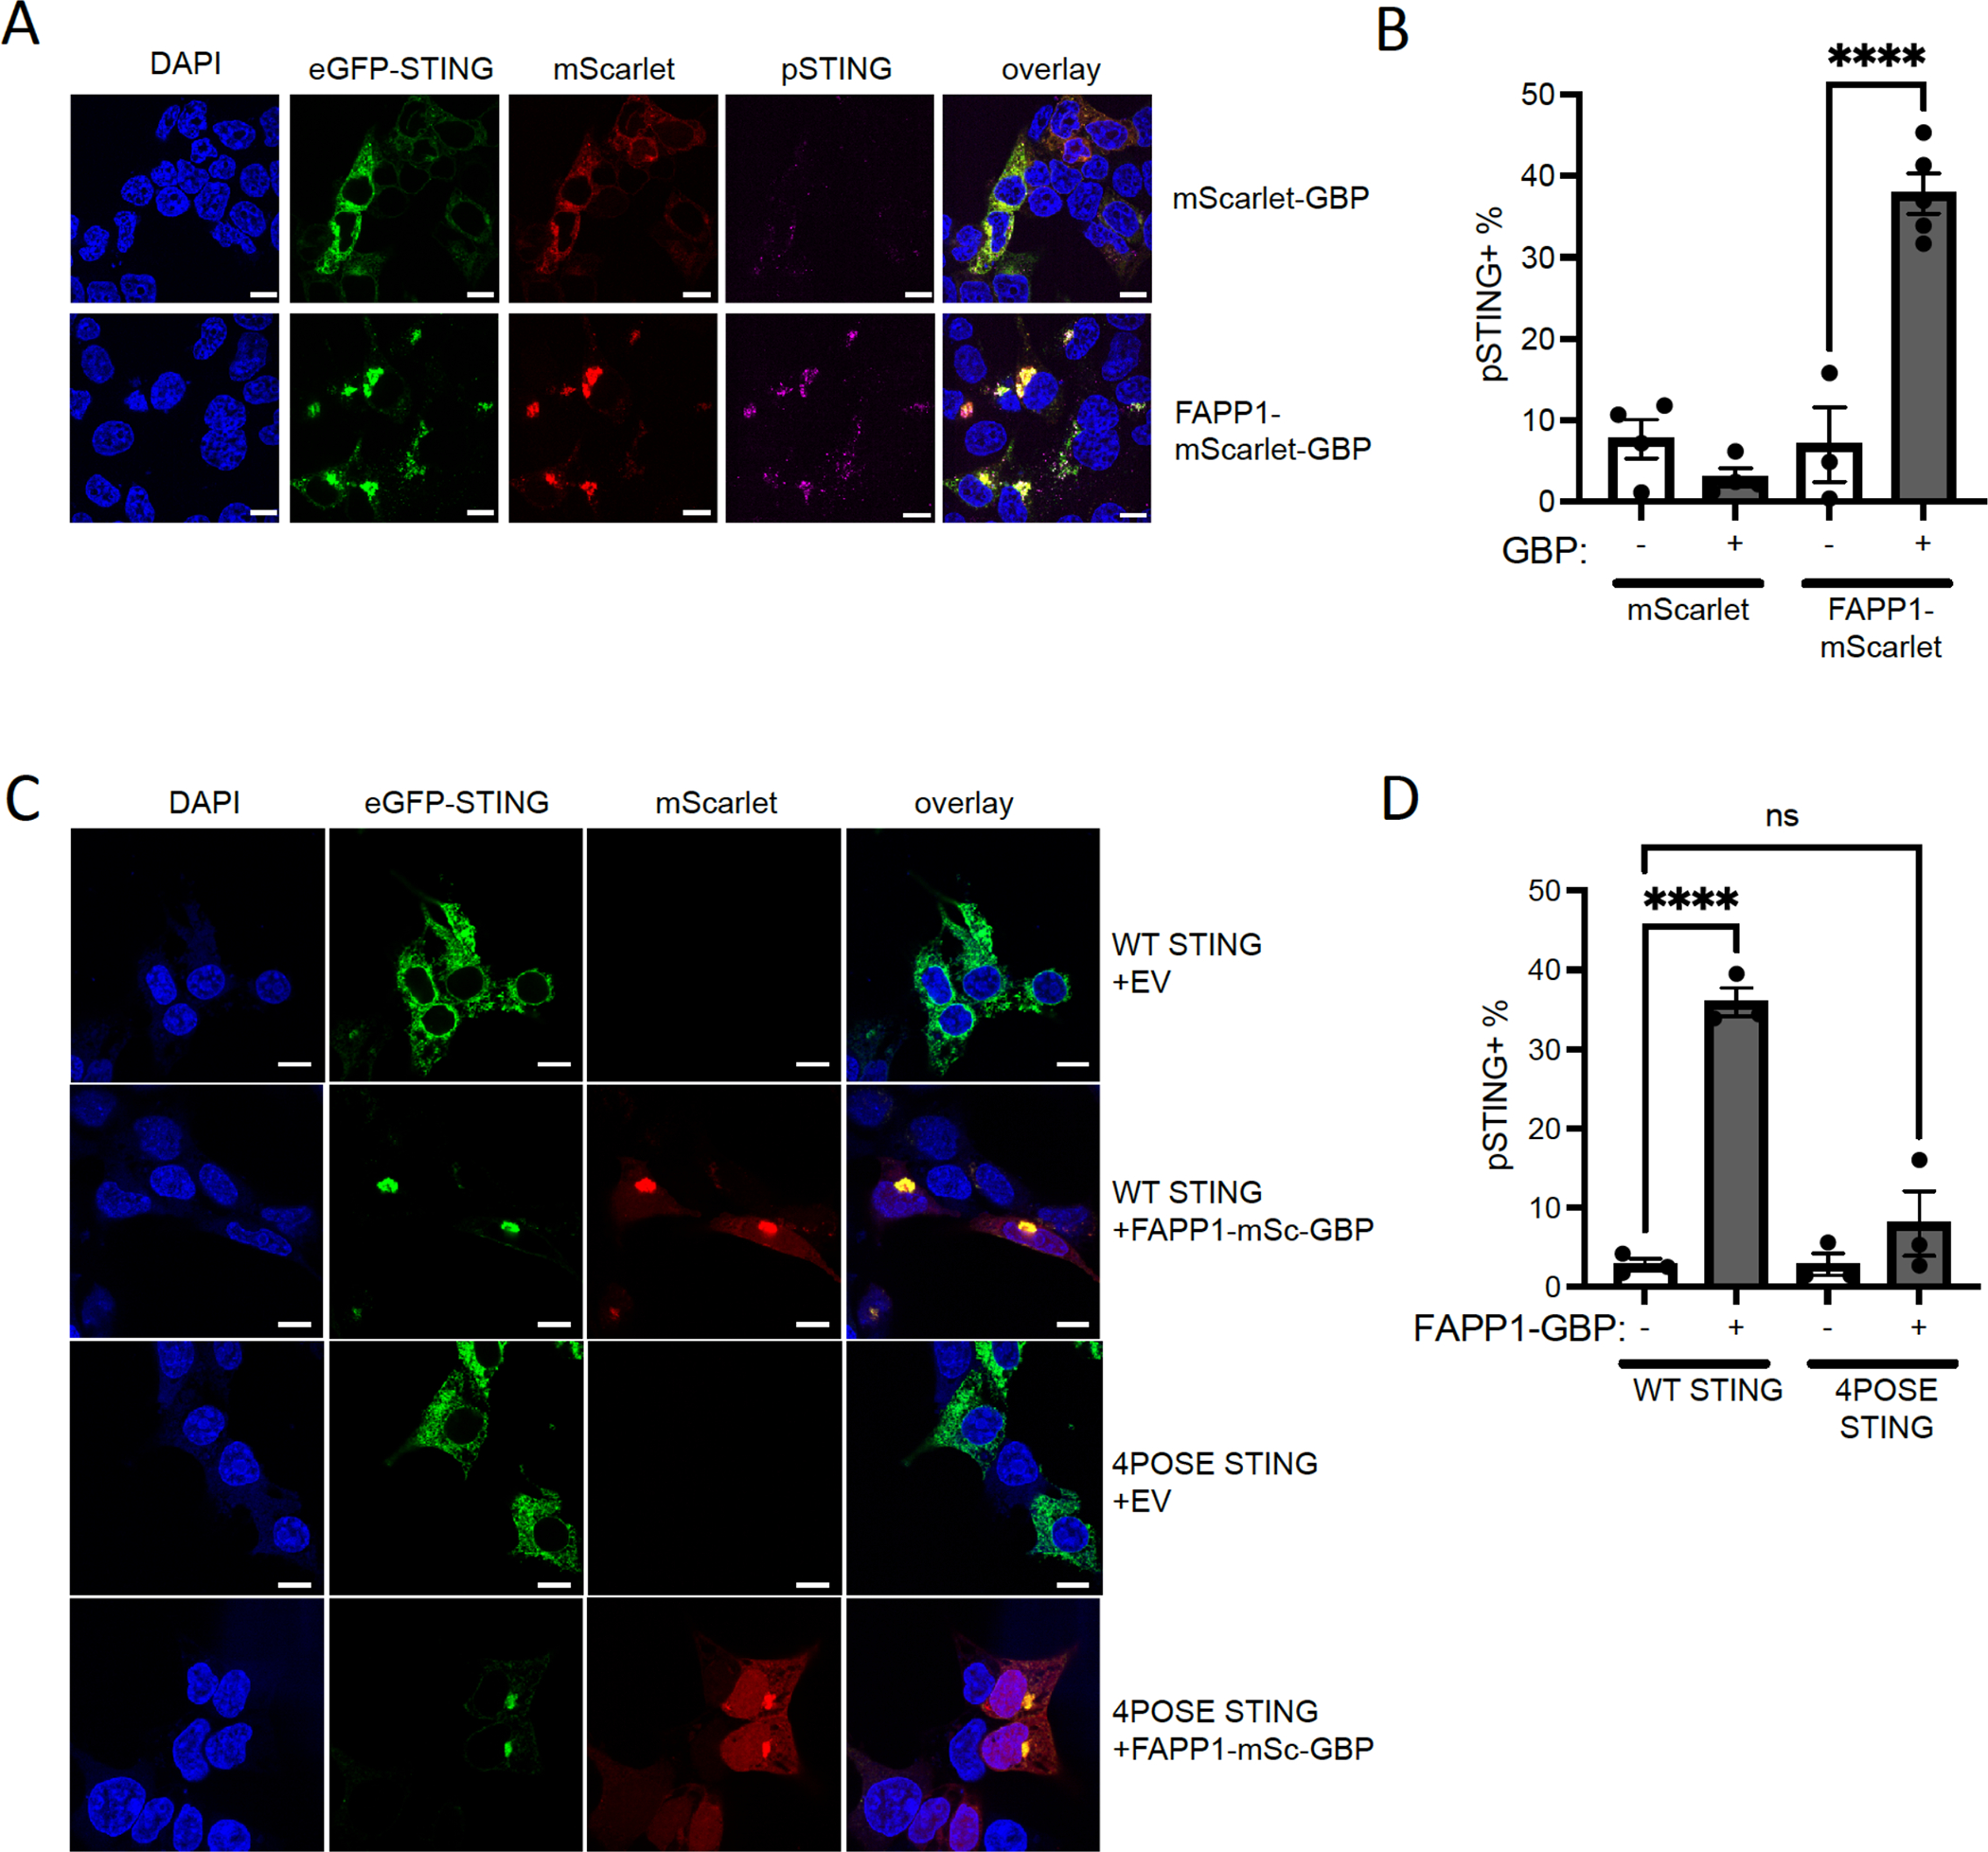
Targeting STING to PI4P-enriched areas promotes STING activation.
A. Microscope images of 293T cells transfected with eGFP-STING and indicated mScarlet-GFP-binding protein (GBP) fusion constructs. Scale bar is 10μm. Representative image of n = 3 biological replicates out of 3 independent experiments is shown.
STING phosphorylation in 293T cells transfected with eGFP-STING and mScarlet constructs. After transfection, STING phosphorylation was quantified by flow cytometry. Mean ± SEM of n = 4 biological replicates out of 4 independent experiments are shown. A paired one-tailed t-test was performed to compare the indicated groups. ** P< 0.01
B. Microscope images of 293T cells transfected with WT or 4POSE eGFP-STING and empty vector (EV) or FAPP1-mScarlet-GBP constructs. Scale bar is 10μm. Representative image of n = 3 biological replicates out of 3 independent experiments is shown.
C. STING phosphorylation in 293T cells transfected with WT or 4POSE eGFP-STING and EV or FAPP1-mScarlet (mSc)-GBP constructs constructs. After transfection, STING phosphorylation was quantified by flow cytometry. Mean ± SEM of at least n = 3 biological replicates out of 3 independent experiments are shown. A paired one-tailed t-test was performed to compare the indicated groups. ** P< 0.01
Expression of mScarlet-GBP-FAPP1 also promoted clustering of the eGFP-STING 4POSE mutant defective in PI4P binding (Fig. 7C), but in this mutant STING phosphorylation was not activated despite relocalization of the mutant STING to PI4P-enriched membranes (Fig. 7D). These results suggest that the interaction between PI4P and STING in PI4P-enriched membranes is essential for STING phosphorylation and activation (Fig. 8).
Figure 8.

Model of PI4P-dependent STING activation in the Golgi. In a WT situation, STING moves to PI4P-rich membranes of the Golgi, where it interacts with PI4P and forms activation clusters required for downstream immune signaling. After activation, STING is degraded by the lysosome. Upon ACBD3 depletion or PI4KB inhibition, PI4P levels in the Golgi are reduced an no STING activation clusters are formed, thereby preventing downstream immune activation. Upon OSBP inhibition, PI4P levels in the Golgi are increased and the formation of STING activation clusters is promoted, thereby enhancing downstream immune activation. Created with Biorender.com
Discussion
Here, we showed that the phospholipid PI4P plays a critical role in the STING-induced immune response. Upon activation, STING trafficked to PI4P-positive structures that were regulated by PI4KB and ACBD3, the latter being one of the top hits in our screen for genes required for STING activation40. Depleting ACBD3 blocked STING activation by various cyclic dinucleotides (CDNs) and other STING agonists by preventing STING trafficking to the TGN. STING trafficking from the ER to the TGN is critical for downstream immune activation. At the TGN, STING forms oligomers that interact with TBK141, leading to phosphorylation of TBK1, STING and IRF313. After immune activation, STING is degraded by the endolysosomal system or transported back to the ER to terminate immune signalling42. The mechanisms regulating trafficking and retention of STING in the Golgi, and subsequent egress from the Golgi are not well understood, though a role for AP-1 has been demonstrated in the process13. We showed that the intensity of STING activation and its subsequent degradation depended on proteins that affected PI4P levels at the TGN, including PI4KB, Sac1, OSBP, and ACBD3.
ACBD3 is a multifunctional protein involved in various cellular processes, including recruitment of PI4KB to the TGN43, hormone-induced steroid formation at mitochondria by binding to PKA44, and iron uptake by the divalent metal transporter DMT145. As PI4KB was also a hit in our primary screen for STING activation, but not any of the other known ACBD3 binding partners, we focussed on the role of ACBD3 and PI4KB in STING activation. As reported previously46, we observed that ACBD3 depletion dramatically altered the intracellular distribution of PI4KB and PI4P. The role of PI4P in STING activation was established by reducing PI4P production at the TGN either by inhibiting PI4KB or by increasing PI4P hydrolysis by Sac1. Conversely, increasing PI4P abundance by inhibiting the lipid transfer protein OSBP dramatically enhanced STING activation. Therefore, we concluded that PI4P levels at the TGN dictate the intensity of the STING-induced immune response. These results were in line with a work showing that hydrolysing PI4P in the vicinity of STING by Sac1 prevented STING activation47.
How PI4P affects STING activation remains poorly understood. PI4P lipids can anchor various proteins to the Golgi via their PI4P-interacting domains, such as pleckstrin homology (PH) domains. Binding is partly driven by electrostatic interactions between the inositol head-group of PI4P and cationic residues in PH domains48.. Although STING shows no homology to known PI4P-binding domains, the purified C-terminal domain of STING can bind PI4P lipids.34 Computational modelling of STING in an active conformation pointed to a patch of basic amino acids in close proximity to the transmembrane helices of STING that can accommodate PI4P34. Our results revealed that changing these basic amino acids to glutamate in the STING 4POSE mutant prevents STING cluster formation and activation, suggesting that STING may directly interact with PI4P at the TGN. Retargeting STING to PI4P-enriched membranes using the PH-domain of FAPP1 led to STING activation, even in the absence of a stimulus. A direct interaction between STING and PI4P at PI4P-enriched membranes seems to be required for activation, as the STING 4POSE mutant was not activated, despite its relocalization. Besides directly interacting with STING, PI4P may promote STING trafficking by facilitating the general process of ER-to-Golgi transport of proteins. In yeast, for example, COP-II vesicle fusion depends on cis-Golgi-localized PI4P49. In mammalian cells, however, the role of PI4P in COP-II vesicle transport remains to be elucidated.
The impact of ACBD3 on STING activation varied somewhat depending on the STING agonist examined. Specifically, although ACBD3 depletion substantially reduced the response to 2’3’-cGAMP, the impact was less dramatic than for the other STING agonists tested. This may be due to a slower rate of dissociation of 2’3’-cGAMP from the ligand binding domain of STING compared to the other STING agonists50. A lower dissociation rate may allow STING activation through a single binding event, whereas activation by other STING agonists may require multiple binding events of the ligand and continuous exposure to activating concentrations of the STING agonist50. The responses to STING agonists with faster dissociation rates may be more greatly affected when STING concentrations in the Golgi are limiting due to the absence of ACBD3. Stimulation or higher ligand concentrations diminishes the effect of ACBD3 on STING activation51.
OSBP shuttles TGN-localized PI4P to the ER in exchange for cholesterol, which moves in the opposite direction. Thus, OSBP inhibition not only increases PI4P at the TGN, but at the same time increases cholesterol levels at the ER membrane52. The subcellular distribution of cholesterol may also affect STING activation. For example, STING is constitutively active in cells lacking the lysosomal cholesterol transporter NPC1 due to a reduction in ER-cholesterol53. Similarly, STING was shown to be activated upon a decrease in ER-localized cholesterol in another study54. Although a build-up of cholesterol in the ER resulting from OSBP inhibition might then be predicted to dampen STING activation, our results demonstrated an increase in STING activation after OSBP inhibition. These findings indicated that the accumulation of PI4P is a dominant factor in STING activation. Indeed, we found that inhibiting PI4P production nullifies the boosting effect of OSBP inhibitors. Our results also suggested that the previously documented increase in STING activation upon ER-cholesterol depletion may be caused by PI4P accumulation at the TGN, as ER-cholesterol depletion prevents PI4P shuttling by OSBP, and has thus a similar effect as OSBP inhibition29.
Itraconazole is an established antifungal and is being evaluated as an anticancer drug55. Apart from OSBP30, itraconazole has several targets including the Hedgehog pathway56, VEGF257, VDAC158 and NPC159. Knockout of the lysosomal protein NPC1 results in tonic STING activation due to the depletion of ER cholesterol, which causes relocation of the cholesterol sensor SREBP2 and STING to the Golgi, and by preventing lysosomal degradation of STING, thereby boosting immune activation53. NPC1 deficiency also results in PI4P accumulation at the TGN, and may promote STING activation as a result, in accord with our findings60. Itraconazole may boost STING responses in part by inhibiting NPC1, although we did not observe STING activation in the absence of NPC1 in itraconazole-treated cells, inhibition of NPC1 may partially explain the boosting effect of itraconazole. In contrast, the structurally unrelated OSBP-inhibitor OSW-1 is highly specific for OSBP, and interacts with OSBP in the nanomolar range via a binding site that is different from itraconazole61. OSW-1 is not known to inhibit NPC1 or any other target of itraconazole. Thus, the major effect of OSW-1 or itraconazole on STING activation is likely via OSBP inhibition. Supporting this, NPC1, SREBP2, or other cholesterol-regulating factors were not identified as hits in our genome-wide screens for STING regulators21.
Enhancing STING activation by itraconazole or other OSBP inhibitors has therapeutic potential by promoting the immune response to virus-infected or cancer cells. In cancer cells, accumulation of cytosolic DNA can activate the cGAS/STING pathway and promote tumour clearance, although some cancer cells epigenetically silence STING or express STING mutants with reduced activity62. In these cases, increasing Golgi PI4P levels (e.g. via OSBP inhibition) may improve the endogenous STING response. Furthermore, treatment of tumours with DNA damaging agents63 or irradiation64,65 can provoke STING activation, which may be enhanced upon OSBP inhibition. OSBP inhibitors may also improve the antitumor effects of STING agonists used therapeutically. In line with this proposal, intratumoural injection of cGAMP in combination with bafilomycin A1, which prevented lysosomal degradation of STING, dramatically improved tumour cell clearance in vivo33. STING is also frequently targeted by viruses in infected cells, thereby dampening the innate immune response66. In that instance, inadequate STING activation may also be restored by treatment with itraconazole or other OSBP inhibitors.
In conclusion, in this study we demonstrated that STING activation is controlled by PI4P and we provide mechanistic insights into the important role of this phospholipid in STING-mediated immune activation. Targeting this pathway by (repurposed) drugs, may open new avenues for therapies that depend on STING activation.
Materials and Methods
Cell lines
All cell lines were cultured at 37 °C in humidified atmosphere containing 5% CO2 with medium supplemented with 100 U ml−1 penicillin, 100 μg ml−1 streptomycin, 0.2 mg ml−1 glutamine, 10 μg ml−1 gentamycin sulfate, 20 mM HEPES and 10% heat-inactivated FCS. Human monocytic THP-1 cells were cultured in RPMI medium, human embryonic kidney cells HEK 293T (293T), 293T transfected with human STING (293T+hSTING) were cultured in DMEM medium. THP-1 and 293T cells were from existing stocks in the laboratory. The 293T+hSTING cells were generated as described previously14. Cells were routinely tested for mycoplasma.
Antibodies and reagents
The following antibodies were obtained from Cell Signaling Technology: rabbit-anti-human TBK1 monoclonal (clone D1B4; 1:500 for immunoblot), rabbit-anti-human p-TBK1 monoclonal (clone D52C2; 1:1,000 for immunoblot), rabbit-anti-human STING monoclonal (clone D2P2F; 1:2,000 for immunoblot), rabbit-anti-human p-STING monoclonal (clone D7C3S; 1:1,000 for immunoblot and 1:800 for flow cytometry), rabbit-anti-human p-IRF3 monoclonal (clone 4D4G, 1:1,000 for immunoblot) rabbit-anti-IκBalpha (clone 9242S, used 1:500 for immunoblot). Antibodies obtained from LI-COR Biosciences: goat-anti-mouse IgG IRDye 680RD conjugated (cat. no. 926-68070; used at 1:5,000), donkey-anti-rabbit IgG IRDye 800CW conjugated (cat. no. 926-32213; used at 1:5,000), donkey-anti-rabbit IgG IRDye 680RD (cat. no. 926-68073; used at 1:5,000). Other antibodies: rabbit-anti-human IRF3 monoclonal (Abcam, cat. no. EP2419Y; 1:2,000 for immunoblot), mouse-anti-human transferrin receptor monoclonal (Thermo Fischer Scientific, clone H68.4; 1:1,000 for immunoblot), mouse-anti-Actin (Sigma cat. no A5441, 1:5,000 for immunoblot), rabbit-anti PI4KB (FineTest cat.no. FNab06427, 1:100 for immunofluorescence), mouse IgM-anti PI4P (Echelon Biosciences Z-P004; 1:100 for immunofluorescence), rabbit-anti TGN46 (Novus Biologicals cat. no. NBP1-49643, 1:400 for immunofluorescence), mouse-anti ACBD3 (Sigma cat. no. Sigma WH0064746M1, 1:100 for immunofluorescence and flow cytometry, 1:1000 for immunoblot), rat-anti-HA (clone 3F10, Roche cat. no. 11867423001, 1:500 for immunofluorescence). Secondary antibodies from Invitrogen: Goat-anti-mouse AlexaFluor 488-conjugated (cat. no. A11001), goat-anti-rat Alexa Fluor 568-conjugated (cat. no A11011), goat-anti-mouse-IgM Alexa Fluro 568-conjugated (cat. no. A21043), donkey-anti-rabbit AlexaFluor 647-conjugated (cat. no. A31573), donkey-anti-mouse AlexaFluor 568-conjugated (cat. no. A10037), and donkey-anti-mouse AlexaFluor 647-conjugated (cat. no. A10037).
Reagents used include itraconazole (Santa Cruz Biotechnology cat. no. sc-205724A), OSW-1 (a kind gift from M. Shair, Harvard University), BF738735 (Tocris cat.no. 6246/10), polybrene (EMD Millipore, cat. no. TR1003G), diABZI (Invivogen cat. no. tlrl-diabzi), 3′3′-cyclic-di-AMP (3′3′ CDA) (Invivogen, cat. no. tlrl-nacda), 2′3′-RR c-di-AMP (2′3′-RR-S2 CDA) (Invivogen cat. no. tlrl-nacda2r), 2′3′-cyclic-di-GMP-AMP (2′3′-cGAMP) (Invivogen cat. no. tlrl-nacga23), DMXAA (Invivogen cat. no. tlrl-dmx), VACV-70 dsDNA (Invivogen cat. no. tlrl-vav70n) and human IFN-β (PeproTech, cat. no. 300-02B). Antibiotic selection was carried out with puromycin (Sigma-Aldrich, cat. no. P8833, at 2 μg ml−1), blasticidin (Invivogen, cat. no. ant-bl-1, at 10 μg ml−1), and zeocin (Invivogen, cat. no. ant-zn-1, at 200 μg ml−1).
Plasmids and expression
The lentiviral vector encoding the tdTomato reporter gene driven by the ISREs and the minimal mouse IFN-β promoter was generated as described previously40. For rescue and overexpression, ACBD3 was cloned into a dual promoter lentiviral vector co-expressing the blasticidin resistance gene and the fluorescent gene mAmetrine67. For over-expression of mScarlet, mScarlet-GBP1, or eGFP-coupled to the N terminus of mouse STING (mSTING) via a linker sequence (amino acid sequence GAGAKLGTELGS), the fusion construct was cloned using Gibson assembly into a dual promoter lentiviral vector co-expressing the blasticidin gene. For CRISPR interference (CRISPRi)-mediated depletions, cells were transduced with a lentiviral dCas9-HA-BFP-KRAB-NLS expression vector (Addgene plasmid no.102244).
For gene depletions using individual CRISPRi gRNAs, top enriched gRNAs (Supplementary Table 1) from the screen for STING activation were cloned into the same expression plasmid used for the gRNA library (pCRISPRia-v2, Addgene plasmid no. 84832, a gift from J. Weissman). The lentiviral gRNA plasmid co-expressed a puromycin resistance gene and blue fluorescence protein (BFP) via a T2A ribosomal skipping sequence controlled by the human EF1A promoter. Conventional CRISPR gRNAs (see Supplementary Table 1) were cloned into a puromycin-selectable lentiviral CRISPR–Cas9 vector, as described previously68. Sac1 wild type (a generous gift from Peter Mayinger (OHSU), the catalytically-inactive C389S mutant, or the Golgi-directed K583A K585A double mutant (kkaa) was fused to the N-terminus of the fluorescent gene mTurquoise2 via a linker sequence (encoding MTSKSGGGGSGGGG) and cloned using NEBuilder Hifi DNA assembly (New England Biolabs) into a dual promoter lentiviral vector co-expressing a puromycin resistance gene. A plasmid encoding the FAPP1-PH domain (residues 1-101) fused to GFP via a linker sequence (DPPVAT) (a generous gift from Tamas Balla (NIH/NICHD) was used as template to generate the FAPP1-PH mScarlet-GBP and FAPP1-PH-mScarlet constructs via Gibson assembly into a dual promoter lentiviral vector co-expressing the puromycin resistance gene. Plasmids were transiently transfected into cells using lipofectamine 2000 (Invitrogen) or stably transduced upon lentivirus production (as indicated in the legends). Lentivirus was produced by transfecting lentiviral plasmids and second generation packaging and polymerase plasmids into 293T cells, as described previously40.
CDN and IFN-β stimulation reporter assays
Stimulation with CDNs or IFN-β were performed as described previously40. Briefly, the day before stimulation, cells were seeded to 0.5 × 10⁶ cells per ml. Cells were stimulated with CDNs or IFN-β in 96-well plates using 30,000 cells per well in 150 μl medium. After 18–24 h, cells were transferred to a 96-well plate and tdTomato expression was measured by flow cytometry using a high-throughput plate reader on a BD LSR Fortessa or a Beckman Coulter Cytoflex. For stimulations in the presence of itraconazole (10 μΜ), OSW-1 (10nM) and/or BF738735 (10 μΜ), cells were incubated with compounds or DMSO as vehicle 1h before stimulations with CDNs or IFN-β. 18–24h after stimulation, tdTomato reporter expression was quantified by flow cytometry using a high-throughput plate reader on a BD LSR Fortessa or a Beckman a Beckman Coulter Cytoflex.
IFN-β ELISA
THP-1 cells were seeded to 0.5 × 10⁶ cells in 250 μl. Cells were incubated for in the presence of DMSO or itraconazole (10 μM). After 1h, 2’3’-cGAMP (20 μg/ml) was added and cells were incubated for 20–22h. Supernatant was harvested and IFN-β concentrations were measured using the human IFN-β Quantikine ELISA kit (R&D systems cat. DIFNB0) according to manufacturer’s recommendations. Absorbance was measured using a Fluostar Omega microplate reader (BMG Labtech)
Production of ACBD3-knockout cell lines
As an alternative approach to corroborate the role of ACBD3 in CDN responses, ACBD3 was targeted in THP-1 or 293T cells using the conventional CRISPR–Cas9 system. THP-1 cells were transduced and 293T cells were transfected with a CRISPR–Cas9 lentiviral plasmid encoding a control gRNA or a gRNA targeting ACBD3 (see Supplementary Table 1). After transduction/transfection cells were selected using puromycin for two days and single-cell cloned by limited dilution (100 cells diluted in 50ml, and plated on 96W plates using 200 μl/well). Control cells and ACBD3-targeted cells were selected that had comparable forward and side scatter by flow cytometry analysis, and ACBD3-knockout cells were screened by measuring intracellular ACBD3-expression by flow cytometry.
CDN uptake
The production and uptake of [32P]2’3’-cGAMP and [32P]3’3’-CDA was performed as described previously40. For the uptake of 2’3’-cGAMP in cells treated with itraconazole (fig. S4C), cells were pre-treated for 1h with itraconazole, and subsequently stimulated for 8h in the presence of 2’3’-cGAMP (20 μg/ml). After stimulation, cells were washed twice with ice cold PBS and pellets were lysed in H2O. 2’3’-cGAMP levels in cell lysates were tested using a 2’3’-cGAMP ELISA kit (Cayman Chemical cat. no. 501700) according to the manufacturer’s recommendations.
Stimulation for RT-qPCR or immunoblotting
The day before stimulation, cells were seeded to 0.5 × 10⁶ cells per ml. Cells were stimulated with CDNs or transfected with VACV-70 immunostimulatory DNA using lipofectamine 2000 using 0.5 × 10⁶ cells per well in 500 μl medium. For stimulations in the presence of itraconazole or OSW-1, cells were incubated with compounds or DMSO as vehicle 1h before stimulations After stimulations, cells were further processed (see RT-qPCR and immunoblotting).
RT–qPCR
Cells were collected and washed in ice-cold PBS. Cells were transferred to RNase-free microcentrifuge tubes and RNA was isolated using the RNeasy mini kit (Qiagen, cat. no. 74104) including a DNase I step (Qiagen, cat. no. 79254). RNA concentration was measured by NanoDrop (Thermo Fischer), and 1 μg of RNA was used as input for cDNA synthesis using the iScript cDNA synthesis kit (Bio-rad, cat. no. 1708890) or Superscript III (Invitrogen cat. no. 18080) using random hexamers. cDNA was diluted to 20 ng μl−1 and 2.5 μl per reaction was used as input for the qPCR reaction. qPCR reactions were set up using SSOFast EvaGreen Supermix (Bio-Rad, cat. no. 1725200) or Fast SYBR Green master mix (Applied Biosystems cat. no. 4385612) according to the manufacturer’s recommendations, using 500 nM of each primer and following cycling conditions on a Bio-Rad C1000 Thermal Cycler or Roche Lightcycler 480 II: 2 min at 98 °C, 40 repeats of 2 s at 98°C and 5 s at 55°C. Primers used to amplify the PCR-products specific for the human genes HPRT1, YWHAZ, IFNB1, IL-6, CXCL10, and PI4KB are listed in Supplementary Table 2. The housekeeping genes HPRT1 and YWHAZ served as endogenous controls for cDNA samples.
Cell lysis and immunoblotting
For protein detection by immunoblotting, cells were washed with PBS and lysed in RIPA buffer (25 mM Tris-HCl pH 7.5, 150 mM NaCl, 1 mM EDTA, 1% NP-40 and 0.1% SDS) including cOmplete ULTRA protease inhibitors (Sigma-Aldrich cat. no. 05892791001), phosphatase inhibitors (Biomake, cat. no. B15001) and 50 mM DTT. Cell lysates were mixed with 4× NuPage LDS sample buffer (Invitrogen cat. no. NP0007), pulse sonicated and incubated at 75 °C for 5 min. Lysates were loaded onto Bolt 4–12% Bis-Tris Plus SDS–PAGE gels (Invitrogen cat. no. NW04125BOX). Proteins separated by SDS–PAGE were transferred onto Immobilon-FL PVDF membranes (EMD Millipore) at 100 V for 1 h at 4 °C. Membranes were blocked in 4% NFM, and probed in 1% NFM overnight at 4 °C with primary antibody. Membranes were subsequently washed three times in 1× TBS including Tween 20 (0.05%) (TBS-T) and probed with secondary antibody for 1 h at room temperature while protected from light. Membranes were washed two times in TBS-T, once in TBS and blots were imaged using an Odyssey CLx System (LI-COR).
Intracellular phospho-STING stainings upon transfection
293T cells were transfected with plasmids indicated in the legends. Twenty-four hours after transfection, cells were stimulated for 8h with 2’3’-RR CDA. After stimulation, cells were washed and blocked using Trustain Fc receptor blocking solution (Biolegend cat. no. 422302) for 10min at RT. Cells were fixed in 2% formaldehyde in PBS for 10min at 4 °C. Cells were permeabilized in perm/wash buffer (BD Biosciences cat. no. 554714) for 15min at 4 °C. Cells were incubated with primary antibody in perm/wash buffer for 30min at 4 °C, washed, and incubated in secondary antibody for 30min at 4 °C. Cells were washed and analyzed by flow cytometry (Beckman Coulter Cytoflex).
Confocal microscopy
The day before seeding onto microscopy slides, cells were seeded to 0.5 × 10⁶ cells per ml. For live-cell imaging, 293T cells were reseeded onto a Ibidi 4-well chambers (Ibidi cat. no. 80416) treated the day before with 5μg/ml fibronectin (Sigma Aldrich cat. no. F1141). Cells were allowed to recover for 2 days and used for live cell imaging in a humidified, temperature and CO2-controlled chamber using a Nikon A1R confocal microscope. For fixed-sample confocal microscopy, 293T or THP-1 cells were reseeded onto an Ibidi μ slide 18 well (cat.no. 81826) treated the day before with 5μg/ml fibronectin. 293T cells were allowed to recover for 2 days prior to stimulation and staining. Prior to stimulation and staining of THP-1 cells, cells were treated overnight with 30 ng/ml PMA (Sigma Aldrich cat. no. P1585) followed by overnight recovery in PMA-free medium. Cells were stimulated with CDNs for the indicated time points and fixed using 2% formaldehyde for 15min at RT. Samples were incubated with 50mM NH4Cl in PBS for 10min at RT and permeabilized with 0.2% Triton X100 in PBS for 15min at RT. Samples were blocked in 3% BSA and 0.2% Triton X-100 in PBS for 45min at RT. Cells were washed incubated with indicated primary antibodies for 1h at RT, washed, and incubated in secondary antibodies for 1h at RT in 0.3% BSA and 0.02% Triton X-100. Cells were washed and kept in PBS + DAPI at 4 °C until imaging on a Nikon A1R confocal microcope. For PI4P staining, after fixing, cells were permeabilized with 20 μM digitonin in buffer A (20mM Pipes, pH 6.8, 137mM NaCl, 2.7mM KCl). Cells were blocked using 5% normal goat serum (NGS) and 50mM NH4Cl in buffer A for 45min at RT. Cells were incubated in primary antibodies in buffer A supplemented with 5% NGS for 1h at RT, washed, and incubated in secondary antibodies in buffer A supplemented with 5% NGS for 1h at RT. Cells were incubated in 2% formaldehyde for 10min at RT, washed, and kept in PBS + DAPI at 4 °C until imaging on a Nikon A1R confocal microscope or Olympus IX SpinSR confocal microscope. Images were processed and eGFP-positive clusters were counted using Fiji.
Statistical analysis
Statistical analyses were performed using Graphpad Prism (version 10.0). Data are presented as means ±SEM at least 3 biological replicates (as indicated in the figure legends). For normalized (qPCR) data performed multiple times, one-sample t-tests were performed to compare treatment groups to a control value (usually 100, see legends). To compare multiple treatment groups to a control group using data that was not normalized to a control value (as indicated in the legends), we performed one-way ANOVA followed by Dunnett’s multiple comparison tests of each treatment group to the control group. To compare two treatment groups with data that passed normality tests, we performed paired or unpaired (depending on the circumstances) one-tailed t-tests. To compare multiple treatment groups over time we performed two-way ANOVA tests followed by Tukey’s multiple comparisons post-tests.
Supplementary Material
Acknowledgements:
We thank Esther van t Veld (Centre for Cell Imaging, Faculty of Veterinary Medicine, Utrecht University) and Denise Schichnes (the Biological imaging facility, UC Berkeley) for support with the fluorescent microscopy experiments, Ger Arkesteijn (Flow Cytometry Facility, Faculty of Veterinary Medicine, Utrecht University), Hector Nolla and Alma Valeros (Flow Cytometry Facility, UC Berkeley) for technical support with flow cytometry experiments, Matthew Shair and Peter Mayinger for sharing reagents, Lily Zhang (UC Berkeley) for lab support, and Yun Song (UC Berkeley), the members of the Raulet and van Kuppeveld labs for helpful discussions.
Funding:
R.D.L. was supported by the Cancer Research Institute Irvington Postdoctoral Fellowship and a Marie Skłodowska-Curie Individual Fellowship. The research was supported by grant AI113041 from the US National Institutes of Health to DHR. J.J.W. was supported by NIH grant R21-AI137758. S.A.Z. was supported by the University of Washington/Fred Hutchinson Cancer Research Center Viral Pathogenesis Training Program (AI083203), the University of Washington Medical Scientist Training Program (GM007266) and the Seattle ARCS foundation.
Footnotes
Conflicts of Interest: D.H.R. is a cofounder and SAB member of Dragonfly Therapeutics, and a member of the SAB of Vivere Pharmaceuticals.
Data and Materials Availability:
All data needed to evaluate the conclusions in the paper are present in the paper or the Supplementary Materials.
References:
- 1.Ishikawa H & Barber GN Nature 455, 674–8 (2008). [DOI] [PMC free article] [PubMed] [Google Scholar]
- 2.Dey RJ et al. Nat. Chem. Biol. 13, 210–217 (2017). [DOI] [PubMed] [Google Scholar]
- 3.Woodward JJ, Lavarone AT & Portnoy DA Science (80-.). 328, 1703–1705 (2010). [DOI] [PMC free article] [PubMed] [Google Scholar]
- 4.Barker JR et al. MBio 4, 1–11 (2013). [Google Scholar]
- 5.Ahn J, Gutman D, Saijo S & Barber GN (2012) doi: 10.1073/pnas.1215006109/-/DCSupplemental.www.pnas.org/cgi/doi/10.1073/pnas.1215006109. [DOI] [PMC free article] [PubMed] [Google Scholar]
- 6.Gall A et al. Immunity 36, 120–31 (2012). [DOI] [PMC free article] [PubMed] [Google Scholar]
- 7.Woo SR et al. Immunity 41, 830–842 (2014). [DOI] [PMC free article] [PubMed] [Google Scholar]
- 8.Lam AR et al. Cancer Res. 74, 2193–2203 (2014). [DOI] [PMC free article] [PubMed] [Google Scholar]
- 9.Green AM, Beatty PR, Hadjilaou A & Harris E J. Mol. Biol. 426, 1148–60 (2014). [DOI] [PMC free article] [PubMed] [Google Scholar]
- 10.Holm CK et al. Nat. Commun. 7, 1–9 (2016). [Google Scholar]
- 11.Maringer K & Fernandez-Sesma A Cytokine Growth Factor Rev. 25, 669–679 (2014). [DOI] [PMC free article] [PubMed] [Google Scholar]
- 12.Aguirre S & Fernandez-Sesma A J. Virol. 91, (2017). [DOI] [PMC free article] [PubMed] [Google Scholar]
- 13.Ablasser A & Hur S Nat. Immunol. 21, 17–29 (2020). [DOI] [PubMed] [Google Scholar]
- 14.Corrales L et al. Cell Rep. 11, 1018–30 (2015). [DOI] [PMC free article] [PubMed] [Google Scholar]
- 15.Zhang B-C et al. Nat. Immunol. 21, 868–879 (2020). [DOI] [PMC free article] [PubMed] [Google Scholar]
- 16.Dhanwani R, Takahashi M & Sharma S Curr. Opin. Immunol. 50, 82–87 (2018). [DOI] [PMC free article] [PubMed] [Google Scholar]
- 17.Ng KW, Marshall EA, Bell JC & Lam WL Trends Immunol. 39, 44–54 (2018). [DOI] [PubMed] [Google Scholar]
- 18.Eaglesham JB & Kranzusch PJ Curr. Opin. Immunol. 66, 27–34 (2020). [DOI] [PMC free article] [PubMed] [Google Scholar]
- 19.Stempel M et al. 1–22 (2019) doi: 10.15252/embj.2018100983. [DOI] [Google Scholar]
- 20.Won JK & Bakhoum SF Cancer Discov. 10, 26–39 (2020). [DOI] [PMC free article] [PubMed] [Google Scholar]
- 21.Luteijn RD et al. Nature 573, 434–438 (2019). [DOI] [PMC free article] [PubMed] [Google Scholar]
- 22.Yue X, Qian Y & Gim B 3, 12–21 (2019). [Google Scholar]
- 23.Dickson EJ & Hille B Biochem. J. 476, 1–23 (2019). [DOI] [PMC free article] [PubMed] [Google Scholar]
- 24.Mukai K et al. Nat. Commun. 7, (2016). [DOI] [PMC free article] [PubMed] [Google Scholar]
- 25.Yue X, Qian Y, Gim B & Lee I Int. J. Mol. Sci. 20, (2019). [DOI] [PMC free article] [PubMed] [Google Scholar]
- 26.Van Der Schaar HM et al. Antimicrob. Agents Chemother. 57, 4971–4981 (2013). [DOI] [PMC free article] [PubMed] [Google Scholar]
- 27.Blagoveshchenskaya A et al. J. Cell Biol. 180, 803–812 (2008). [DOI] [PMC free article] [PubMed] [Google Scholar]
- 28.Nakatsu F & Kawasaki A Front. cell Dev. Biol. 9, 664788 (2021). [DOI] [PMC free article] [PubMed] [Google Scholar]
- 29.Mesmin B et al. EMBO J. 36, 3156–3174 (2017). [DOI] [PMC free article] [PubMed] [Google Scholar]
- 30.Strating JRPM et al. Cell Rep. 10, 600–615 (2015). [DOI] [PMC free article] [PubMed] [Google Scholar]
- 31.Amini-Bavil-Olyaee S et al. Cell Host Microbe 13, 452–64 (2013). [DOI] [PMC free article] [PubMed] [Google Scholar]
- 32.Mesmin B et al. EMBO J. 36, 3156–3174 (2017). [DOI] [PMC free article] [PubMed] [Google Scholar]
- 33.Gonugunta VK et al. Cell Rep. 21, 3234–3242 (2017). [DOI] [PMC free article] [PubMed] [Google Scholar]
- 34.Triantafilou M et al. Nat. Commun. 13, 1406 (2022). [DOI] [PMC free article] [PubMed] [Google Scholar]
- 35.Jeremiah N et al. J. Clin. Invest. 124, 5516–20 (2014). [DOI] [PMC free article] [PubMed] [Google Scholar]
- 36.Shang G, Zhang C, Chen ZJ, Bai X-C & Zhang X Nature 567, 389–393 (2019). [DOI] [PMC free article] [PubMed] [Google Scholar]
- 37.Rothbauer U et al. Nat. Methods 3, 887–9 (2006). [DOI] [PubMed] [Google Scholar]
- 38.Bindels DS, Postma M, Haarbosch L, van Weeren L & Gadella TW J. Nat. Protoc. 15, 450–478 (2020). [DOI] [PubMed] [Google Scholar]
- 39.Balla T & Várnai P Curr. Protoc. cell Biol. Chapter 24, Unit 24.4 (2009). [DOI] [PMC free article] [PubMed] [Google Scholar]
- 40.Luteijn RD et al. Nature 573, (2019). [DOI] [PMC free article] [PubMed] [Google Scholar]
- 41.Kemmoku H, Kuchitsu Y, Mukai K & Taguchi T Cell Struct. Funct. 47, 19–30 (2022). [DOI] [PMC free article] [PubMed] [Google Scholar]
- 42.Taguchi T, Mukai K, Takaya E & Shindo R Front. Immunol. 12, 8–13 (2021). [DOI] [PMC free article] [PubMed] [Google Scholar]
- 43.McPhail JA & Burke JE Traffic (2022) doi: 10.1111/tra.12841. [DOI] [Google Scholar]
- 44.Liu J, Li H & Papadopoulos VJ Steroid Biochem. Mol. Biol. 85, 275–83 (2003). [DOI] [PubMed] [Google Scholar]
- 45.Okazaki Y et al. Am. J. Physiol. Gastrointest. Liver Physiol. 302, G1180–90 (2012). [DOI] [PMC free article] [PubMed] [Google Scholar]
- 46.Lyoo H et al. MBio 10, 1–15 (2019). [DOI] [PMC free article] [PubMed] [Google Scholar]
- 47.Fang R, Jiang Q, Jia X & Jiang Z Immunity 56, 500–515.e6 (2023). [DOI] [PubMed] [Google Scholar]
- 48.Pemberton JG & Balla T Adv. Exp. Med. Biol. 1111, 77–137 (2019). [DOI] [PMC free article] [PubMed] [Google Scholar]
- 49.Lorente-Rodríguez A & Barlowe C Mol. Biol. Cell 22, 216–229 (2011). [DOI] [PMC free article] [PubMed] [Google Scholar]
- 50.Pollock AJ, Zaver SA & Woodward JJ Nat. Commun. 11, 1–13 (2020). [DOI] [PMC free article] [PubMed] [Google Scholar]
- 51.Motani K et al. Cell Rep. 41, 111868 (2022). [DOI] [PubMed] [Google Scholar]
- 52.Lim CY et al. Nat. Cell Biol. 21, 1206–1218 (2019). [DOI] [PMC free article] [PubMed] [Google Scholar]
- 53.Chu TT et al. Nature 596, 570–575 (2021). [DOI] [PMC free article] [PubMed] [Google Scholar]
- 54.York AG et al. Cell 163, 1716–1729 (2015). [DOI] [PMC free article] [PubMed] [Google Scholar]
- 55.Tsubamoto H et al. Oncol. Lett. 14, 1240–1246 (2017). [DOI] [PMC free article] [PubMed] [Google Scholar]
- 56.Kim J et al. Cancer Cell 17, 388–99 (2010). [DOI] [PMC free article] [PubMed] [Google Scholar]
- 57.Nacev BA, Grassi P, Dell A, Haslam SM & Liu JO J. Biol. Chem. 286, 44045–44056 (2011). [DOI] [PMC free article] [PubMed] [Google Scholar]
- 58.Head SA et al. Proc. Natl. Acad. Sci. U. S. A. 112, E7276–E7285 (2015). [DOI] [PMC free article] [PubMed] [Google Scholar]
- 59.Trinh MN et al. Proc. Natl. Acad. Sci. U. S. A. 114, 89–94 (2017). [DOI] [PMC free article] [PubMed] [Google Scholar]
- 60.Kutchukian C et al. EMBO J. 40, 1–25 (2021). [Google Scholar]
- 61.Roberts BL et al. Antiviral Res. 170, 104548 (2019). [DOI] [PMC free article] [PubMed] [Google Scholar]
- 62.Konno H et al. Oncogene 37, 2037–2051 (2018). [DOI] [PMC free article] [PubMed] [Google Scholar]
- 63.Wang Z et al. J. Clin. Invest. 129, 4850–4862 (2019). [DOI] [PMC free article] [PubMed] [Google Scholar]
- 64.Deng L et al. Immunity 41, 843–852 (2014). [DOI] [PMC free article] [PubMed] [Google Scholar]
- 65.Storozynsky Q & Hitt MM Int. J. Mol. Sci. 21, 1–22 (2020). [DOI] [PMC free article] [PubMed] [Google Scholar]
- 66.Hu T et al. Front. Microbiol. 12, 1–14 (2021). [Google Scholar]
- 67.van de Weijer ML et al. Nat. Commun. 5, 3832 (2014). [DOI] [PMC free article] [PubMed] [Google Scholar]
- 68.van Diemen FR et al. PLoS Pathog. 12, e1005701 (2016). [DOI] [PMC free article] [PubMed] [Google Scholar]
Associated Data
This section collects any data citations, data availability statements, or supplementary materials included in this article.
Supplementary Materials
Data Availability Statement
All data needed to evaluate the conclusions in the paper are present in the paper or the Supplementary Materials.