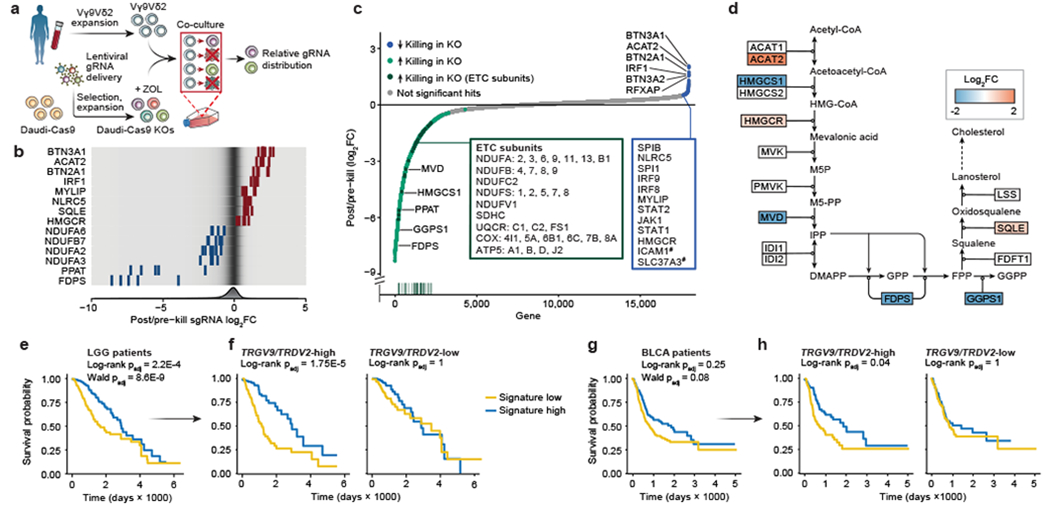
Figure 1. Vγ9Vδ2 T cell co-culture with genome-wide KO library of Daudi cells reveals killing-evasion and -enhancement KOs.

(a) Vγ9Vδ2 T cell co-culture screen with a genome-wide KO library of Daudi-Cas9 cells (ZOL = zoledronate). (b) Enrichment or depletion of individual single guide RNAs (sgRNA) for a selection of significant hits, overlaid on a gradient showing distribution of all sgRNAs (fold change [FC]). (c) All 18,010 genes ranked from negative to positive enrichment of Daudi-Cas9 KOs that change killing. Boxes show a subset of significant hits. Vertical line plot shows rank positions of electron transport chain (ETC) subunits listed in the green box. False-discovery rate (FDR) < 0.05, except #FDR<0.1. (d) Schematic of the enrichment and depletion of mevalonate pathway KOs. Shading indicating log2FC shown only for significant hits (FDR<0.05). (e-h) Survival of (e) low grade-glioma (LGG) (n=529) and (g) bladder urothelial carcinoma (BLCA) patients (n=433) split by the co-culture screen gene signature expression levels, (f, h) including after splitting each patient cohort by TRGV9/TRDV2 expression levels. (a-c) n=3 human PBMC donors; enrichment and statistics calculated by the MAGeCK algorithm. (e-h) Log-rank test (Kaplan-Meier survival analysis) and (e, g) Wald test (Cox regression), adjusted (padj) with Benjamini-Hochberg multiple comparisons correction.
