Abstract
目的
探索胶质母细胞瘤(glioblastoma, GBM)恶性进展过程中细胞亚群的动态轨迹以及免疫细胞亚群之间的通讯网络,结合GBM患者的转录组数据和临床信息,挖掘GBM恶性进展过程中的关键风险标志物,以期为该疾病的治疗和预后提供科学依据。
方法
基于单细胞测序数据分析方法,构建GBM恶性进展中的细胞亚群图谱,利用Monocle2技术构建GBM恶性进展中肿瘤细胞亚群的动态进展轨迹,基于基因富集分析,挖掘肿瘤细胞亚群随GBM恶性进展中显著变化的基因所富集的生物学过程,利用CellChat软件识别不同免疫细胞亚群间的复杂通讯网络,通过生存分析识别GBM恶性进展中影响患者预后的关键风险分子标记物。
结果
单细胞测序数据分析识别出6种不同的细胞类型,包括淋巴细胞、周细胞、少突神经胶质细胞、巨噬细胞、胶质瘤细胞、小胶质细胞,单细胞数据集中了27 151个细胞,其中包含3 881个来源于低级别胶质瘤患者的细胞,10 166个来源于新诊断GBM患者的细胞,13 104个来源于复发性胶质瘤患者的细胞。胶质瘤细胞亚群逆时序分析提示,胶质瘤细胞亚群在恶性进展中存在着明显的细胞异质性;免疫细胞亚群的细胞相互作用分析揭示,GBM恶性进展中不同免疫细胞亚群之间的通讯网络共识别出22条具有生物学意义的配体-受体对,涉及12条通路;生存分析识别出8个与GBM患者预后密切相关的基因,其中SERPINE1、COL6A1、SPP1、LTF、C1S、AEBP1、SAA1L是GBM患者的高风险基因,ABCC8是GBM患者的低风险基因。
结论
深入揭示了GBM恶性进展中胶质瘤细胞亚群的动态变化以及免疫细胞亚群之间的通讯模式,对于理解GBM的复杂生物学过程具有重要意义,为GBM的精准医疗和治疗决策提供了科学依据,也为GBM患者更准确的预后评估提供了新的线索。
Keywords: 胶质母细胞瘤, 单细胞测序, 拟时序分析, 细胞相互作用, 细胞间通讯
Abstract
Objective
To delve deeply into the dynamic trajectories of cell subpopulations and the communication network among immune cell subgroups during the malignant progression of glioblastoma (GBM), and to endeavor to unearth key risk biomarkers in the GBM malignancy progression, so as to provide a more profound understanding for the treatment and prognosis of this disease by integrating transcriptomic data and clinical information of the GBM patients.
Methods
Utilizing single-cell sequencing data analysis, we constructed a cell subgroup atlas during the malignant progression of GBM. The Monocle2 tool was employed to build dynamic progression trajectories of the tumor cell subgroups in GBM. Through gene enrichment analysis, we explored the biological processes enriched in genes that significantly changed with the malignancy progression of GBM tumor cell subpopulations. CellChat was used to identify the communication network between the different immune cell subgroups. Survival analysis helped in identifying risk molecular markers that impacted the patient prognosis during the malignant progression of GBM. This method ological approach offered a comprehensive and detailed examination of the cellular and molecular dynamics within GBM, providing a robust framework for understanding the disease' s progression and potential therapeutic targets.
Results
The analysis of single-cell sequencing data identified 6 different cell types, including lymphocytes, pericytes, oligodendrocytes, macrophages, glioma cells, and microglia. The 27 151 cells in the single-cell dataset included 3 881 cells from the patients with low-grade glioma (LGG), 10 166 cells from the patients with newly diagnosed GBM, and 13 104 cells from the patients with recurrent glioma (rGBM). The pseudo-time analysis of the glioma cell subgroups indicated significant cellular heterogeneity during malignant progression. The cell interaction analysis of immune cell subgroups revealed the communication network among the different immune subgroups in GBM malignancy, identifying 22 biologically significant ligand-receptor pairs across 12 key biological pathways. Survival analysis had identified 8 genes related to the prognosis of the GBM patients, among which SERPINE1, COL6A1, SPP1, LTF, C1S, AEBP1, and SAA1L were high-risk genes in the GBM patients, and ABCC8 was low-risk genes in the GBM patients. These findings not only provided new theoretical bases for the treatment of GBM, but also offered fresh insights for the prognosis assessment and treatment decision-making for the GBM patients.
Conclusion
This research comprehensively and profoundly reveals the dynamic changes in glioma cell subpopulations and the communication patterns among the immune cell subgroups during the malignant progression of GBM. These findings are of significant importance for understanding the complex biological processes of GBM, providing crucial new insights for precision medicine and treatment decisions in GBM. Through these studies, we hope to provide more effective treatment options and more accurate prognostic assessments for the patients with GBM.
Keywords: Glioblastoma, Single-cell sequencing, Pseudo-time analysis, Cell-cell interaction, Cell communication
胶质母细胞瘤(glioblastoma, GBM)是中枢神经系统中最常见的恶性肿瘤,严重影响人类健康。尽管目前GBM的临床多模式诊断和治疗取得了很大进展,但由于该病的高侵袭性和高度异质性,导致患者的临床预后极差[1]。近年来随着单细胞测序技术的发展,为在单细胞水平研究肿瘤疾病提供了可能。有研究表明,GBM中包含多种细胞亚群,它们具有不同的功能特性和生物学行为,形成了疾病发展和治疗反应的复杂性,例如,肿瘤细胞亚群可能具有较高的增殖活性,对疾病的恶性进展起主导作用[2]。此外,肿瘤相关巨噬细胞(tumor-associated macrophages, TAMs)作为GBM肿瘤微环境中常见的浸润免疫细胞,可能占肿瘤内浸润性免疫细胞的40%~50%[3]。TAMs在GBM中具有抗炎和促炎两种表型,其中抗炎表型巨噬细胞可以通过促进肿瘤增殖、迁移和抵抗药物治疗等方式促进肿瘤进展[4]。此外,T细胞和B细胞在肿瘤的免疫监视中起关键作用,GBM中免疫抑制的微环境常导致这些细胞的功能受损,上述研究表明,这些细胞亚群之间并非孤立存在,而是通过复杂的细胞间通讯机制相互影响,共同促进疾病的发展[5]。然而,目前对于这些细胞亚群在GBM中的作用机制研究仍不明确。近年来,随着生物信息学和单细胞测序技术的快速发展,更多的测序数据分析方法被应用于GBM中的细胞亚群异质性及它们之间交流机制的研究。本研究基于单细胞测序数据分析,识别GBM中的重要细胞亚群,分析细胞亚群在GBM恶性进展中的动态变化及通讯网络,挖掘GBM恶性进展中影响患者预后的风险分子标记物,以期探索GBM的病理特征和恶性进展轨迹,为开发新的治疗策略提供依据。
1. 资料与方法
1.1. 数据的来源、整合和标准化
使用来源于基因综合表达数据库(Gene Expression Omnibus, GEO)GSE182109数据集中6名GBM患者的单细胞测序数据,其中包含2名低级别胶质瘤患者,2名新诊断GBM患者,2名复发GBM患者[6]。
从癌症基因组图谱(The Cancer Genome Atlas, TCGA)数据库中下载156个GBM肿瘤样本和5个正常样本,从中国脑胶质瘤基因组图谱计划(Chinese Glioma Genome Atlas, CGGA)中下载283名GBM患者的基因表达数据和临床数据,为后续的差异表达基因识别和生存分析提供数据支持。针对基因表达数,本研究通过R包Limma对数据进行预处理,得到GBM患者的基因表达谱数据[7-8]。
1.2. 单细胞测序数据预处理
使用R包Seurat中的CreateSeuratObject函数创建单细胞测序数据分析对象。通过筛选单细胞内基因数目大于300但小于3 000、总基因表达量小于10 000且线粒体基因比例小于20%的细胞进行数据预处理,提取高质量细胞用于后续分析。去除低质量的细胞后,使用取对数标准化法进行全局缩放归一化,获得标准化的单细胞测序数据,以此构建GBM进展过程的单细胞图谱。考虑到多个样本的单细胞测序数据整合中可能存在的批次效应,使用Harmony包中的merge函数和RunHarmony函数对不同患者来源的单细胞测序数据进行整合[9]。
1.3. 细胞亚群注释
采用主成分分析(principal component analysis, PCA)对数据进行降维,采用统一流形逼近与投影(uniform manifold approximation and projection,UMAP)方法进行非线性降维[10-11]。采用Seurat包内置的图聚类方法,通过FindNeighbors函数和FindClusters函数对单细胞测序数据图谱进行聚类分析,设定聚类精度“resolution=0.5”,基于每个细胞亚群的特征基因在细胞亚群中的表达水平对每个细胞亚群进行注释[6]。每个细胞种类的特征基因如图 1所示。
图 1.
基于单细胞RNA测序数据的不同细胞亚群识别
Identification of different cell clusters based on single-cell RNA sequencing data
A, UMAP plots of 6 cellular clusters; B, heatmap of the marker genes across individual cell clusters. UMAP, uniform manifold approximation and projection.
1.4. 拟时序分析
运用R包Monocle2[12]对单细胞测序数据进行拟时序分析,通过构建细胞间变化轨迹,预测细胞随时间的变化,揭示细胞状态变化和发展过程中的动态趋势,并鉴定时序进展过程中的差异表达基因。采用newCellDataSet函数创建Monocle2分析所需的数据对象,设定P < 0.01为差异表达基因的统计学筛选标准。
1.5. 基因富集分析
采用注释、可视化和综合发现数据库(The Database for Annotation, Visualization and Integrated Discovery, DAVID)[13]分析基因在基因本体(Gene Ontology, GO)数据库中生物学过程(biological process, BP)的富集结果。
1.6. 细胞相互作用分析
采用R包CellChat[14]构建细胞通讯网络,从单细胞RNA测序数据定量推断和分析细胞间通讯网络,以细胞的表达矩阵和细胞分类信息为基础,参考配体-受体数据库CellChatDB,在信号基因的表达数据中识别过表达基因并确定配体-受体对[15]。将配体-受体投射到人的蛋白质相互作用(protein-protein interaction,PPI)网络,在细胞水平和信号通路水平上推断不同细胞之间的通讯,并计算形成细胞之间的聚合通讯网络。
1.7. 差异表达分析
使用R包Limma进行基因差异表达分析,利用normalizeBetweenArrays方法对基因表达数据进行归一化处理,利用Limma包中的lmFit函数对每个基因拟合线性模型,采用makeContrasts函数创建对比矩阵,应用eBayes函数中的经验贝叶斯(Bayes)方法对不同组别进行差异分析,得到差异表达结果后,通过设定显著性阈值P < 0.05和log2FC>1筛选差异表达基因[16],FC(fold change)为差异倍数。
1.8. 生存分析
采用Kaplan-Meier曲线进行生存分析,采用Log-rank检验比较生存过程[17]。根据生存曲线和Log-rank检验对应的P值,筛选P < 0.05水平上对患者生存预后有显著影响的分子标志物,作为GBM肿瘤微环境中的疾病风险标志物。
2. 结果
2.1. 基于单细胞RNA测序数据的不同细胞亚群识别
为了准确构建GBM恶性进展过程中的单细胞图谱,通过对单细胞测序数据进行质量控制和预处理,共获得了27 151个高质量细胞和13个不同的细胞亚群。基于细胞亚群的特征基因表达水平,将13个细胞亚群标记为6种主要的细胞类型,包括淋巴细胞、周细胞、少突神经胶质细胞、巨噬细胞、胶质瘤细胞、小胶质细胞(图 1A、B)。单细胞数据集中27 151个细胞,包含3 881个来源于低级别胶质瘤患者的细胞,10 166个来源于新诊断GBM患者的细胞,13 104个来源于复发性胶质瘤患者的细胞,这些细胞组成了GBM恶性进展过程的单细胞图谱。
2.2. 胶质瘤细胞亚群的拟时序分析
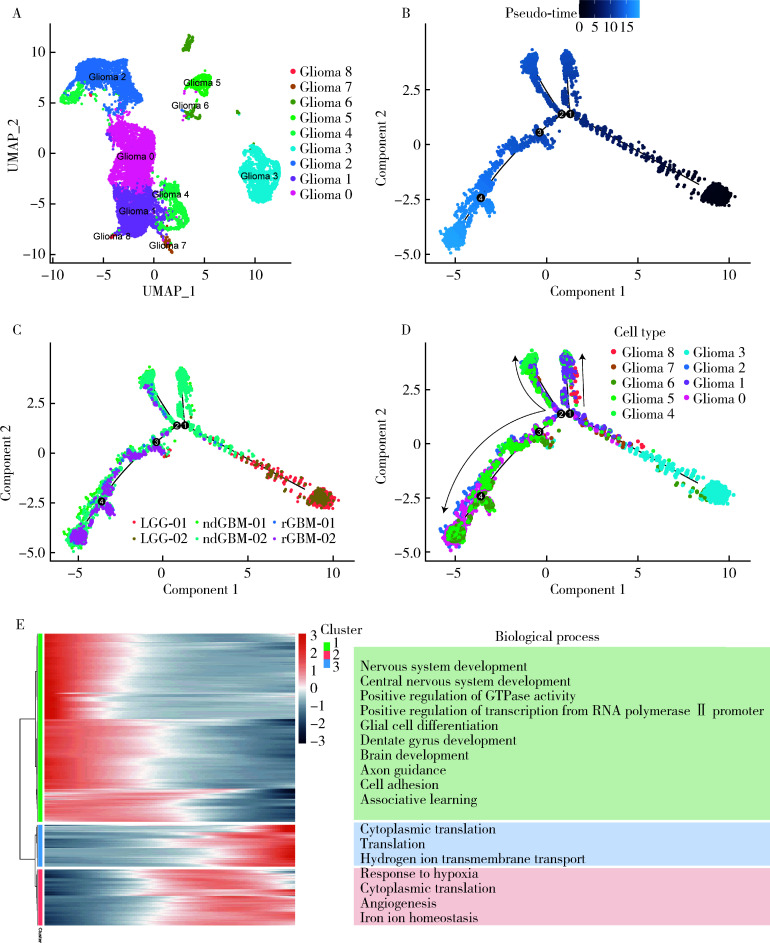
为探索GBM恶性进展过程中肿瘤细胞亚群的动态变化和发展轨迹,从单细胞测序数据图谱的27 151个细胞中提取了11 793个胶质瘤细胞进行拟时序分析(图 2)。
图 2.
胶质瘤细胞亚群的拟时序分析
Pseudo-time analysis of glioma cell subgroups
A, UMAP plot of glioma cells, colored for the 6 cell clusters; B-D, monocle plot of glioma cells in 2D-PCA space, with colors representing time, patient origin, and cell clusters; E, heatmap representing the expression of differentially expressed genes along pseudo-timeline, with enrichment analysis of biological processes from GO database modules on the right. UMAP, uniform manifold approximation and projection; PCA, principal component analysis; GO, Gene Ontology; LGG, lower grade glioma; ndGBM, newly diagnosed GBM; rGBM, recurrence of primary GBM.
重新对胶质瘤细胞亚群进行降维、聚类分析,结果表明胶质瘤细胞亚群可以进一步分成6个亚群(图 2A)。基于Monocle2拟时序分析结果,构建胶质瘤细胞亚群恶性进展的全景视图(图 2B)。以颜色深浅来描绘时间进程,深色细胞代表时间的起始点,浅色细胞代表时间的终点,发展轨迹与低级别胶质瘤向复发性胶质瘤的进展轨迹同步(图 2C)。从胶质瘤亚群角度,Glioma 3亚群是低级别胶质瘤患者主要的肿瘤细胞亚群,主要出现在肿瘤进展的初期;Glioma 0、1、4亚群是新诊断GBM患者主要的肿瘤亚群,在节点1和节点2处向不同方向进展;Glioma 5、6亚群是复发性胶质瘤患者的主要肿瘤亚群,出现在时间轴的末端。Glioma 0虽然是新诊断GBM患者的肿瘤细胞亚群,但Glioma 0与Glioma 5、6的进展轨迹一致,提示Glioma 0亚群存在与复发性胶质瘤患者肿瘤细胞亚群类似的特征(图 2D),提示尽管这些细胞在表面上被归类为胶质瘤细胞,但它们随着疾病进展,展现出显著的异质性。基于拟时序基因差异表达分析识别Glioma亚群在发展过程中基因表达模式发生显著变化的基因,选择差异性排名前500的基因绘制热图(P < 0.01,图 2E)。进一步对每个热图聚类结果中的每个基因模块进行基因富集分析,明确每个模块影响的生物学过程,结果表明第一组基因主要富集在神经系统发展、中枢神经系统发展、正调控GTP酶活性、正调控RNA聚合酶Ⅱ启动子的正调控、神经胶质细胞分化等生物学过程;第二组基因主要涉及细胞质翻译、氢离子跨膜传输;第三组基因主要富集在应对低氧、细胞质翻译、血管生成、铁离子稳态等(图 2E),这对于理解胶质瘤恶性进展的生物学机制具有重要的指导价值。
2.3. 免疫细胞亚群的细胞相互作用分析
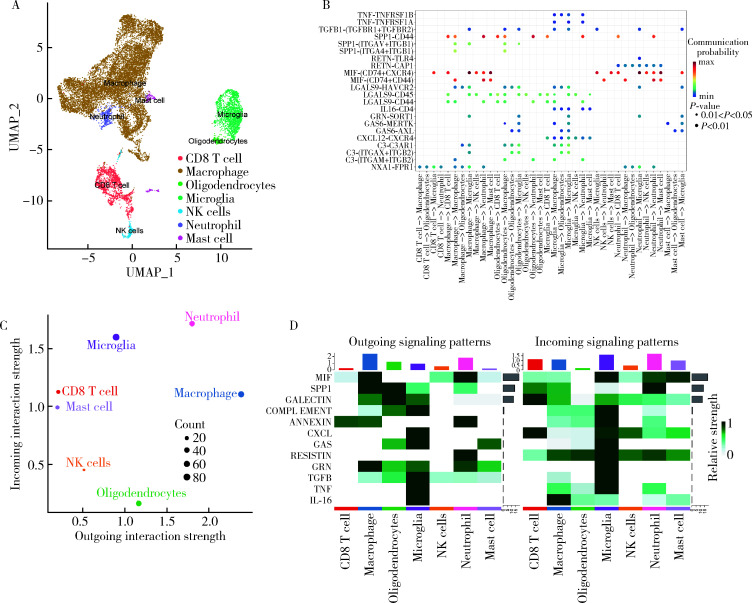
为进一步探索GBM恶性进展中免疫细胞群体之间的相互作用,从单细胞测序数据图谱中提取了15 265个免疫细胞,通过降维、聚类分析将其重新划分为13个免疫细胞亚群。通过对特征基因表达水平的细致分析,将这些亚群注释为7种细胞类型,包括少突胶质细胞(OLIG2、MBP)、中性粒细胞(IL1R2、CXCR2、FPR2)、巨噬细胞(APOC1、CYBB、CD68、CD163、F13A1)、CD8 T细胞(GZMK、CD8A、CD8B)、小神经胶质细胞(CX3CR1、P2RY12、P2RY13、SLC1A3)、肥大细胞(TPSB2、TPSAB1)、自然杀伤(natural killer, NK)细胞(NKG7、GNLY、NCAM1、KLRD1)(图 3A)。使用R包CellChat进行细胞间通讯网络的分析,通过计算配体-受体水平上的通讯概率及信号通路水平上的通讯概率,得到细胞间的聚合通讯网络,共识别出22条具有生物学意义的配体-受体对,涉及12条通路(图 3B)。巨噬细胞是输出信号模式的主导细胞,CD8 T细胞、小神经胶质细胞是输入信号模式的主导细胞,中性粒细胞在输入信号模式和输出信号模式均发挥重要作用,这意味着中性粒细胞在GBM恶性进展中的免疫细胞相互作用中发挥重要作用(图 3C)。进一步整理输入信号模式和输出信号模式的相关通路发现,MIF、SPP1、GALECTIN在输入和输出信号模式中的通讯强度最高(图 3D)。
图 3.
免疫细胞亚群的细胞相互作用分析
Analysis of cellular interactions in immune cell subgroups
A, UMAP plot of immune cells, colored for the 7 cell clusters; B, dot plot of the significant signaling pathways and ligand-receptor pairs, where the dot color indicates the probabilities of communication and the dot size indicates the corresponding P values; C, dot plot of interaction strength of different cell clusters; D, heatmap representing the outgoing and incoming signaling patterns. UMAP, uniform manifold approximation and projection; NK, natural killer.
2.4. GBM恶性进展过程中风险分子标志物的识别
基于TCGA数据库基因表达数据识别在GBM患者中的差异表达基因,共得到3 529个差异表达基因,将这些差异表达基因与单细胞测序数据分析得到的胶质瘤细胞亚群恶性进展过程中表达水平发生显著变化的基因取交集,共得到537个基因。对于交集后的基因进行生存分析,评估这些基因是否可以作为GBM患者的预后因子,根据基因表达水平的中位值将患者分为高表达组和低表达组进行生存情况的比较。此外,为了验证结果的可靠性,进一步基于CGGA数据库进行验证,最终获得了8个与GBM患者预后相关的胶质瘤恶性进展的差异表达基因,具体见表 1,表中标注了生存分析Log-rank检验得到的P值(P < 0.05),其中,SERPINE1、COL6A1、SPP1、LTF、C1S、AEBP1、SAA1基因是GBM患者的高风险基因,ABCC8是GBM患者的低风险基因(图 4)。多数据集的预后分析结果为挖掘单细胞测序分析得到的胶质瘤恶性进展相关基因的临床意义提供了有力证据。
表 1.
拟时序差异表达基因在TCGA、CGGA数据库中的预后分析
Prognostic analysis of pseudo-time differential expression genes in TCGA and CGGA databases
| Gene | P (TCGA) | P (CGGA) |
| TCGA, The Cancer Genome Atlas; CGGA, Chinese Glioma Genome Atlas. | ||
| SERPINE1 | 0.047 | 0.038 |
| ABCC8 | 0.016 | 0.039 |
| COL6A1 | 0.009 | 0.021 |
| SPP1 | 0.047 | 0.016 |
| LTF | 0.024 | 0.014 |
| C1S | 0.046 | 0.037 |
| AEBP1 | 0.019 | 5.861×10⁻⁴ |
| SAA1 | 0.020 | 0.028 |
图 4.
分子标志物生存分析
Molecular marker survival analysis
3. 讨论
本研究使用单细胞测序数据,揭示了胶质瘤细胞亚群在低级别胶质瘤向复发GBM恶性进展过程中基因转录水平的动态变化,并识别了可能影响患者预后的风险分子标志物,构建了GBM恶性进展中免疫细胞亚群之间的细胞通讯网络,为制定更为精准的治疗方案提供了重要指导价值。
本研究结果显示,胶质瘤细胞亚群在恶性进展中存在着明显的细胞异质性,揭示了低级别胶质瘤向复发GBM进展的发展轨迹,基于拟时序基因差异表达分析显示出胶质瘤细胞在发展过程中基因表达模式的变化,为诠释GBM的进展过程提供了全新的视角。本研究结果表明,尽管在表面上这些细胞被归类为胶质瘤细胞,但在恶性进展中它们仍然呈现出显著的异质性,这可能解释了在临床治疗中GBM对治疗反应的不同[18]。此外,通过识别免疫细胞间的通讯配体-受体对,发现巨噬细胞在输出信号模式中起主导作用,而CD8 T细胞则在输入信号模式中起主导作用,表明免疫细胞在GBM恶性进展中可能发挥着不同的作用,并可能对肿瘤的发展和预后产生重要影响。
特别值得关注的是,肥大细胞和中性粒细胞在免疫细胞间通讯中发挥着重要作用,提示它们在GBM治疗中具有潜在价值。Xiong等[19]基于单细胞测序数据,并结合TCGA数据库中下载的具有临床信息的GBM患者转录组数据,比较了不同亚型GBM患者之间的异质性,证明肿瘤间异质性主要影响GBM的异质性和细胞分子特性,相同亚型的细胞具有细胞通信相似性。Põlajeva等[20]的研究证实,肥大细胞可以通过CXCL12/CXCR4轴被吸引到肿瘤中,并在人胶质瘤中检测到肥大细胞的大量浸润。Xiong等[21]系统地分析了来自各种人类和小鼠研究的GBM单细胞测序数据,发现源自巨噬细胞的非转移性糖蛋白通过免疫细胞与肿瘤相互作用,调节肿瘤细胞由神经祖细胞(neural progenitor cell,NPC)样亚型向间充质(mesenchymal, MES)样亚型转变。由此可见,单细胞测序分析已成为深入了解GBM发展的动态过程,帮助制定阻断肿瘤进展的靶向治疗策略的有力工具。
此外,通过识别与GBM预后相关的基因,可以帮助发现潜在的治疗靶点和生物标志物,为精准医学治疗提供新线索,为人们更好地理解GBM的发展机制、制定个体化的治疗策略以及改善患者的预后质量提供重要依据。有研究表明,SPP1与GBM患者较高的巨噬细胞密度和较低的总生存期呈正相关[22]。COL6A1是GBM队列分析中鉴定出的9种与预后不良和抗原呈递、细胞浸润相关的潜在肿瘤抗原之一[23]。上述结果表明本研究结果与已有研究存在相互佐证的关系,然而本研究仍存在一定的局限性,GBM恶性进展的单细胞样本仍需要补充,仍需进一步的临床研究验证这些标志物的可靠性和准确性,并将这些研究成果转化为实际的临床应用。
综上,本研究通过单细胞RNA测序技术全面阐述了GBM的肿瘤异质性,揭示了GBM内部细胞类型的动态变化以及相互之间的通讯网络,为深入了解GBM的发展机制、提高治疗精准性以及发现新的治疗目标提供了重要依据。
Footnotes
利益冲突 所有作者均声明不存在利益冲突。
作者贡献声明 蔡祥、李冬果:提出研究思路和设计研究方案;王世佳、任梓齐、于秋红:收集整理数据;蔡祥、王仁东:分析解释数据;所有作者审阅并修改论文,李冬果总体把关和审定论文。
References
- 1.Lee E, Yong RL, Paddison P, et al. Comparison of glioblastoma (GBM) molecular classification methods. Semin Cancer Biol. 2018;53:201–211. doi: 10.1016/j.semcancer.2018.07.006. [DOI] [PubMed] [Google Scholar]
- 2.Hernández Martínez A, Madurga R, García-Romero N, et al. Unravelling glioblastoma heterogeneity by means of single-cell RNA sequencing. Cancer Lett. 2022;527:66–79. doi: 10.1016/j.canlet.2021.12.008. [DOI] [PubMed] [Google Scholar]
- 3.Suvà ML, Tirosh I. The glioma stem cell model in the era of single-cell genomics. Cancer Cell. 2020;37(5):630–636. doi: 10.1016/j.ccell.2020.04.001. [DOI] [PubMed] [Google Scholar]
- 4.Ochocka N, Segit P, Walentynowicz KA, et al. Single-cell RNA sequencing reveals functional heterogeneity of glioma-associated brain macrophages. Nat Commun. 2021;12(1):1151. doi: 10.1038/s41467-021-21407-w. doi: 10.1038/s41467-021-21407-w. [DOI] [PMC free article] [PubMed] [Google Scholar]
- 5.Zhang H, Wang Y, Zhao Y, et al. PTX3 mediates the infiltration, migration, and inflammation-resolving-polarization of macrophages in glioblastoma. CNS Neurosci Ther. 2022;28(11):1748–1766. doi: 10.1111/cns.13913. [DOI] [PMC free article] [PubMed] [Google Scholar]
- 6.Abdelfattah N, Kumar P, Wang C, et al. Single-cell analysis of human glioma and immune cells identifies S100A4 as an immunotherapy target. Nat Commun. 2022;13(1):767. doi: 10.1038/s41467-022-28372-y. [DOI] [PMC free article] [PubMed] [Google Scholar]
- 7.Hara T, Chanoch-Myers R, Mathewson ND, et al. Interactions between cancer cells and immune cells drive transitions to mesenchymal-like states in glioblastoma. Cancer Cell. 2021;39(6):779–792. e11. doi: 10.1016/j.ccell.2021.05.002. [DOI] [PMC free article] [PubMed] [Google Scholar]
- 8.Liu S, Wang Z, Zhu R, et al. Three differential expression analysis methods for RNA sequencing: Limma, EdgeR, DESeq2. J Vis Exp. 2021;175:e62528. doi: 10.3791/62528. [DOI] [PubMed] [Google Scholar]
- 9.Korsunsky I, Millard N, Fan J, et al. Fast, sensitive and accurate integration of single-cell data with Harmony. Nat Methods. 2019;16(12):1289–1296. doi: 10.1038/s41592-019-0619-0. [DOI] [PMC free article] [PubMed] [Google Scholar]
- 10.Slovin S, Carissimo A, Panariello F, et al. Single-cell RNA sequencing analysis: A step-by-step overview. Methods Mol Biol. 2021;2284:343–365. doi: 10.1007/978-1-0716-1307-8_19. [DOI] [PubMed] [Google Scholar]
- 11.Butler A, Hoffman P, Smibert P, et al. Integrating single-cell transcriptomic data across different conditions, technologies, and species. Nat Biotechnol. 2018;36(5):411–420. doi: 10.1038/nbt.4096. [DOI] [PMC free article] [PubMed] [Google Scholar]
- 12.Cao J, Spielmann M, Qiu X, et al. The single-cell transcriptional landscape of mammalian organogenesis. Nature. 2019;566(7745):496–502. doi: 10.1038/s41586-019-0969-x. [DOI] [PMC free article] [PubMed] [Google Scholar]
- 13.Dennis G, Jr Sherman BT, Hosack DA, et al. DAVID: Database for annotation, visualization, and integrated discovery. Genome Biol. 2003;4(5):P3. doi: 10.1186/gb-2003-4-5-p3. [DOI] [PubMed] [Google Scholar]
- 14.Jin S, Guerrero-Juarez CF, Zhang L, et al. Inference and analysis of cell-cell communication using CellChat. Nat Commun. 2021;12(1):1088. doi: 10.1038/s41467-021-21246-9. [DOI] [PMC free article] [PubMed] [Google Scholar]
- 15.Lin J, Cai Y, Wang Z, et al. Novel biomarkers predict prognosis and drug-induced neuroendocrine differentiation in patients with prostate cancer. Front Endocrinol (Lausanne) 2023;13:1005916. doi: 10.3389/fendo.2022.1005916. [DOI] [PMC free article] [PubMed] [Google Scholar]
- 16.Costa-Silva J, Domingues D, Lopes FM. RNA-Seq differential expression analysis: An extended review and a software tool. PLoS One. 2017;12(12):e0190152. doi: 10.1371/journal.pone.0190152. [DOI] [PMC free article] [PubMed] [Google Scholar]
- 17.D'Arrigo G, Leonardis D, Abd ElHafeez S, et al. Methods to analyse time-to-event data: The Kaplan-Meier survival curve. Oxid Med Cell Longev. 2021;2021:2290120. doi: 10.1155/2021/2290120. [DOI] [PMC free article] [PubMed] [Google Scholar]
- 18.DeCordova S, Shastri A, Tsolaki AG, et al. Molecular heterogeneity and immunosuppressive microenvironment in glioblastoma. Front Immunol. 2020;11:1402. doi: 10.3389/fimmu.2020.01402. [DOI] [PMC free article] [PubMed] [Google Scholar]
- 19.Xiong Z, Yang Q, Li X. Effect of intra- and inter-tumoral heterogeneity on molecular characteristics of primary IDH-wild type glioblastoma revealed by single-cell analysis. CNS Neurosci Ther. 2020;26(9):981–989. doi: 10.1111/cns.13396. [DOI] [PMC free article] [PubMed] [Google Scholar]
- 20.Põlajeva J, Sjösten AM, Lager N, et al. Mast cell accumulation in glioblastoma with a potential role for stem cell factor and chemokine CXCL12. PLoS One. 2011;6(9):e25222. doi: 10.1371/journal.pone.0025222. [DOI] [PMC free article] [PubMed] [Google Scholar]
- 21.Xiong A, Zhang J, Chen Y, et al. Integrated single-cell transcriptomic analyses reveal that GPNMB-high macrophages promote PN-MES transition and impede T cell activation in GBM. EBioMedicine. 2022;83:104239. doi: 10.1016/j.ebiom.2022.104239. [DOI] [PMC free article] [PubMed] [Google Scholar]
- 22.Chen P, Zhao D, Li J, et al. Symbiotic macrophage-glioma cell interactions reveal synthetic lethality in PTEN-null glioma. Cancer Cell. 2019;35(6):868–884. e6. doi: 10.1016/j.ccell.2019.05.003. [DOI] [PMC free article] [PubMed] [Google Scholar]
- 23.Wu C, Qin C, Long W, et al. Tumor antigens and immune subtypes of glioblastoma: The fundamentals of mRNA vaccine and individualized immunotherapy development. J Big Data. 2022;9(1):92. doi: 10.1186/s40537-022-00643-x. [DOI] [PMC free article] [PubMed] [Google Scholar]


