Abstract
Wood is a natural composite widely employed as a residential building interior finishing. Although wood is readily available and offers benefits to the occupants, such as enhanced well-being, it is rarely employed in commercial construction due, amongst others, to the potential hazard of fire propagation. The application of flame retardant (FR) treatments leads to a reduction of wood flammability and supports wood as interior finishing. Polyelectrolyte complexes (PECs) deposition is an innovative surface treatment that has already proven its efficiency for fabrics. For wood, recent studies have highlighted that the weight gain impacted the fire-retardancy, and a minimum of 2 wt.-% was set to obtain fire protection. This study explored the potential of surface delignification to activate the wood surface and facilitate the PEC impregnation. Yellow birch (Betula alleghaniensis, Britt.) was surface delignified (0.3 mm) using sodium chlorite. The treatment impact on wood was evaluated by spectroscopy analysis (FTIR, Raman), and the increase in wood wettability was demonstrated (contact angle decreases from 50° to 35° after the surface delignification). Then, PECs consisting of polyethyleneimine and sodium phytate were surface impregnated in wood and delignified wood. The flame retardancy was evaluated using a cone calorimeter. Despite the increase in weight gain (1.5 wt.-% ± 0.3 wt.-% to 4.3 wt.-% ± 2.5 wt.-%), fire performance was not improved. This study demonstrates that lignin strongly affects char formation, even in the presence of PECs.
Keywords: fire retardancy, wood, delignification
1. Introduction
Wood is a natural composite widely used in interior finishing due to its esthetic, availability, and processability (Lowe 2020). Also, it stores carbon during its service life (Fahey et al. 2010). Incorporating wood elements in both residential and non-residential buildings is thus a strategy to fight against global warming. However, one of the main limitations of wood use in non-residential buildings is its flammability and high flame spread rates. Today, stringent regulations exist to limit fire risks in construction, especially for exits and corridors (Canadian Wood Council 1996; White and Dietenberger 2010). So, to mitigate the risks, insurance companies require the installation of numerous passive (e.g., gypsum walls) or active (e.g., sprinklers) protection systems (Gosselin et al. 2017; McLain and Brodahl 2021). As such, improvements in the flame retardant (FR) properties of wood are required to promote its use.
For years, the wood flame-retardancy research work has focused on two approaches (Lowden and Hull 2013). First, the coating approach involves depositing a polymer layer containing a flame-retardant compound (Mariappan 2017). The fire-retardant function can be obtained using chemicals that covalently react with the polymer constituting the coating, or FR additives can be added to the coating formulation to reduce the overall flammability (Arao 2015; Joseph and Ebdon 2009). They are respectively called reactive or additive strategy. Coating technologies are very efficient, especially in the case of intumescent ones (Wladyka-Przybylak and Kozlowski 1999). However, thick coatings are required to obtain a high level of performance, which increases the cost of the treatment and the use of fossil-origin chemicals (White 1983). The second FR approach relies on the impregnation of wood with FR (Barnes 2008). Several phosphorus based FR were impregnated by a vacuum-pressure process (Kishore et al. 1980; Stevens et al. 2006). Although these treatments are effective, they have poor leaching resistance, and affect mechanical properties (LeVan and Collet 1989; Östman et al. 2001).
Thin coating treatments are an alternative to classic approaches that concentrate the FR treatment at the surface exposed to the fire (Davesne et al. 2021). This approach aims to limit chemical consumption while getting good fire-retardancy and preserving wood properties. The layer-by-layer deposition of polyelectrolytes is one of the treatments described in the literature. FR performance is promising, but the treatment time due to the deposition-drying cycle process required by the technology is prohibitive for industrial applications (Tang and Fu 2020; Yang et al. 2020). As an alternative, the polyelectrolyte complex deposition for wood FR applications was proposed by Kolibaba and Grunlan (2019), and few articles were since published (Huang et al. 2020; Kolibaba et al. 2022; Soula et al. 2021). In a previous work, the weight gain was identified as a limiting factor for FR performance, and a lower limit of 2 wt-% weight gain was set (Soula et al. 2022).
To increase weight gain following impregnation, various physical and chemical wood surface activation were described in the literature (Petrič 2013). Amongst them, the delignification consists in removing lignin present in the compound middle lamella to increase the wood porosity and facilitate the access to reactive hydroxyl bounds of the cellulose and the hemicellulose (Berglund and Burgert 2018; Yang et al. 2019). The delignification process has been widely used to produce transparent wood, which requires long treatment times to remove the lignin on the entire sample thickness (Fink 1992; Li et al. 2016; Li et al. 2019; Qin et al. 2018; Wu et al. 2019). For FR applications, wood was delignified and impregnated with montmorillonite to produce an FR hybrid material (Fu et al. 2017). Phytic acid impregnation was also performed on delignified Chinese fir wood (Cunninghamia lanceolata, Lamb.). The thermal stability improvement was attributed to the increase in weight gain compared to wood and the cross-linking between cellulose and phytic acid (Wang et al. 2022).
In this study, yellow birch (Betula alleghaniensis, Britt.) was surface delignified to increase its wettability and ensure a good FR weight gain. The objective was to determine if the delignification treatment impacts the FR of wood treated with PECs. The delignification process was studied by colorimetry and spectroscopy techniques, including ATR-FTIR and Raman spectroscopy. The wood surface wettability was assessed by contact angle measurements. Then, the wood was surface-impregnated at reduced pressure with a PEC consisting of polyethyleneimine and sodium phytate. The phosphate titration and phosphorus quantification by ICP analysis have confirmed the increase in weight gain. Finally, wood FR properties were evaluated by a cone calorimeter.
2. Materials and methods
Yellow birch (B. alleghaniensis, Britt.) boards (120 cm × 10 cm × 0.4 cm) were provided by Mirage (Saint-Georges, Québec, Canada). Samples were sanded with the following sequence using sandpaper grit: P-120, P-150, and P-180 (Dagher et al. 2023). Samples were cut into 10 cm × 10 cm × 0.4 cm pieces for the cone calorimeter and into 5 cm × 5 cm × 0.4 cm pieces for the other tests. All samples were conditioned until mass equilibrium was reached (temperature (T) = 20 °C, relative humidity (RH) = 40 %) before being treated or analyzed. For every sample, the original dried mass was measured and noted as m i .
Three boards were used for this study. Each board was cut into 7 cone calorimeter samples and 9 smaller samples. Samples were identified as presented in Table 1.
Table 1:
Abbreviations used in the study.
| REF | Yellow birch reference |
|---|---|
| D-REF | Delignified yellow birch |
| PEISPA | PEC surface impregnated yellow birch |
| D-PEISPA | PEC surface impregnated delignified yellow birch |
2.1. Wood surface delignification
The surface delignification was proceed using acidified sodium chlorite method due to its high selectivity (Jin et al. 2019). Lignin is dissolved by the breaking of carbohydrate linkages (Wang et al. 2017). This technique is classically used for the delignification of materials. The chlorite is not reactive, but the releases chlorine as well as hypochlorite acid that permits oxidation of the lignin. Those chemicals preferentiallt reacts wioth the phenol functions and the C–C double bounds. Sodium chlorite (Purity > 80 %) was purchased from Sigma-Aldrich (St. Louis, Missouri, USA) and used as received. A 4 wt.-% solution of sodium chlorite was prepared, and the pH was adjusted to 4 using acetic acid. The solution was heated up to 60 °C, and the wood samples were disposed face down<in the solution for 30 min to proceed to the unilateral surface delignification. This method allowed only one side of the wood sample to be delignified. The wood samples were then rinsed for 15 min in a water/ethanol solution. Each wood sample was weighed before and after delignification and conditioning.
The wood moisture content (MC) was calculated using the mass of the conditioned sample (noted m c ) and m i according to the following equation (Equation (1)). The MC was increased after delignification (REF: 7.4 wt.-% ± 0.3 wt.-%; D-REF: 8.5 wt.-% ± 0.1 wt.-%), as described in the literature (Yang et al. 2018).
| (1) |
2.1.1 Colorimetry
Five color measurements were taken on each wood sample using a Ci6x spectrophotometer (X-rite, Grand Rapids, United States). The colors were expressed in the CIELab color space, and the parameters chosen for the color measurements were the standard illuminant D65, an angle of observation of 10 in SPIN mode. L i , a i , and b i correspond to the chromatic coordinates of the untreated wood, and Ldeli, adeli, and bdeli to the chromatic coordinates of the delignified wood. From these coordinates, color modifications on the axis green/red (Δa*), on the axis blue/yellow (Δb*), the lightness evolution (ΔL*), and the total color change (ΔE) are expressed according to the equations Equation (2) to Equation (5):
| (2) |
| (3) |
| (4) |
| (5) |
2.1.2. Confocal Raman spectroscopy
For each board, a delignified 20 µm thick wood cross-section was prepared using an automatic rotary microtome (HistoCore AUTOCUT, Leica Biosystems, Buffalo Grove, USA). Cross sections were placed on glass slides with deionized water, covered with a glass cover slip, and sealed with nail polish to avoid water evaporation. Raman measurements were conducted using a Senterra II Raman microscope (Bruker Optics Inc., Billerica, USA), equipped with a motorized table (Märzhäuser Wetzlar, Wetzlar, Germany) and a × 100 immersion oil objective with a 1.3 numerical aperture (Olympus, Waltham, USA). Spectra were collected with a 532 nm laser at 12.5 mW with 500 ms integration time and 12 coadditions per spectrum. For each cross-section, 3 areas at the delignified surface were analyzed and compared to 3 areas in the wood depth. At least 5 spectra were collected on each area on the secondary wood cell wall. For chemical mapping, an area of 35 μm × 35 μm was scanned with 50 × 50 points.
2.1.3. Water contact angles
Water contact angles were measured over time on conditioned samples (T = 20 °C, RH = 40 %). Measurements were performed at 22 °C using an FTA D200 imaging goniometer (Folio Instruments Inc., Kitchener, Canada). The contact angles over time of an approximately 3 µL drop deposited on the wood surface were measured for 60 s. Measurements were performed in the longitudinal direction of the fibers. Image recording was started (t = 0 s) once the droplet was stabilized on the wood surface. Contact angles were measured on both sides of the droplets every 0.5 s. Measurements were repeated three times on each sample, with five samples used per condition.
2.1.4. Attenuated total reflectance Fourier transform infrared (ATR-FTIR)
The surface chemical composition of 3 random samples per condition was compared using ATR-FTIR INVENIO R spectrometer (Bruker Optics Inc., Billerica, USA) in the 4000–400 cm−1 range with 64 scans and a resolution of 4 cm−1. Spectra were baseline corrected and normalized at 1030 cm−1, corresponding to the C–O vibration in cellulose and hemicellulose (Naumann et al. 2007).
2.1.5. Thermogravimetric analysis (TGA)
The thermal stability of wood and delignified wood was studied using a thermogravimetric analyzer from Mettler Toledo (model TGA 851e, Greifense, Switzerland). Three samples, approximately 10 mg (2 mm × 2 mm × 4 mm) each, were analyzed per condition from a same board. For each sample, an isotherm of 35 °C was applied for 60 min followed by a heating ramp of 10 °C.min−1 up to 800 °C. All experiments were conducted under nitrogen.
2.2. Polyelectrolyte solution preparation
Branched PEI (M w = 25,000 g mol−1) and SPA (Phytic acid sodium salt hydrate, from rice), hydrochloric acid (HCl, 37 %), sodium hydroxide (NaOH, 97 %) and citric acid monohydrate (CA, reagent grade, 98 %) were purchased from Sigma-Aldrich (St. Louis, Missouri, USA) and used as received.
PEI and SPA solutions, at 7.5 wt.-% and 22.5 wt.-%, respectively, were prepared separately. The pH of the PEI solution was adjusted from 10.8 to 9 by adding 1 M HCl. SPA solution was used at its natural pH of 3.4. An acid solution of citric acid at 500 mM was prepared, and pH was adjusted to 3 using 2 M NaOH.
2.3. Wood surface impregnation
First, PEC solution was deposited on the wood surface (10 mL for 10 cm × 10 cm × 0.4 cm samples and 2.5 mL for 5 cm × 5 cm × 0.4 cm samples). Samples were placed in a desiccator, and a vacuum pump was used to reduce pressure to 55 mbar for 40 s (pump time); then samples were left at atmospheric pressure for 5 min (absorption time). The solution excess was removed with a paper towel. The process (pump time + absorption time) was repeated with a citric acid solution to form insoluble PEC. The solution excess was removed with a paper towel. The treated samples were stored in a conditioning room (T = 20 °C, RH = 40 %) prior to any characterization to ensure mass stabilization (Figure 1).
Figure 1:
Schematic representation of the wood treatment.
2.4. Wood characterization
2.4.1 Weight gain (WG)
The final weight gain (WG) was calculated based on the initial mass of oven-dried samples (m i or mdeli for delignified samples) and the mass (m f ) of samples after impregnation and oven-drying (Equation (6)).
| (6) |
2.4.2 Phosphate titration
The phosphate content after impregnation was determined based on a colorimetric titration of PO43− with ammonium molybdate tetrahydrate (99.98 % trace metals basis, Sigma-Aldrich, St. Louis, USA) (Pradhan and Pokhrel 2013). In the presence of ammonium molybdate, PO43− forms a yellow hetero molybdophosphoric polyacid, which becomes blue after reduction and the formation of phosphomolybdenic complex (Equations (7), (8)). The color intensity of the solution is proportional to the concentration of phosphate according to Beer–Lambert’s equation.
| (7) |
| (8) |
The calibration curve was determined using a 1 g L−1 potassium phosphate monobasic solution (KH2PO4, ACS reagent grade, ≥99.0 %, Sigma-Aldrich, St. Louis, USA). The 10 mL etalon solutions were prepared by adding successively: appropriate volume of KH2PO4 to get a final concentration of PO43− between 1 ppm and 60 ppm, 2 mL of sulfuric acid 1 N, 0.5 mL of ammonium molybdate tetrahydrate 0.055 M, 1 mL of sodium sulfite 10 m.v-% and deionized water to complete the 10 mL. The control solution was prepared by replacing KH2PO4 by water. The absorbance was measured using an UV–Vis spectrophotometer (Cary 60, Agilent Technologies, Santa Clara, USA) after 24 h at 715 nm.
Three samples, each taken from a different board, were analyzed for the REF and D-REF conditions. For the PEC-treated samples, eight samples were analyzed for each condition. To evaluate the phosphate content, samples were ground into a 2 mm powder using a rotor mill (ZM 300, Retsch, Haan, Germany). One gram of powder was placed in a beaker, and 10 mL of concentrated sulfuric acid (97 %, Sigma-Aldrich, St. Louis, USA) was added to dissolve the powder. A black paste was formed after 15 min. Ten milliliters of hydrogen peroxide (30 % w/w in H2O, Sigma-Aldrich, St. Louis, USA) were added slowly to oxidize the organics. Finally, the solution was diluted with 50 mL of deionized water and boiled for 15 min. Once at room temperature, the solution was filtered and the volume was corrected to 100 mL using a graduated flask. One mL of solution was used to prepare the solution for the spectrophotometer analysis.
2.4.3. Phosphorus titration by inductively coupled optical emission spectrometry (ICP-OES)
The same wood samples were used for the phosphate titration. Ground wood samples (2 mm powder) were digested using microwave-assisted extraction with concentrated hydrochloric acid. The sample was placed in a closed container and heated by the microwave, which caused a temperature rise and analyte extraction. An ICP-OES system (model 5110, Agilent Technologies, Santa Clara, CA, USA) was used under argon plasma.
2.4.4. Cone calorimetry
Fire properties of materials were characterized by a Dual cone calorimeter (Fire testing technology, East Grinstead, England), following ISO5660 standard (ISO 5660-1 2015). The following parameters were obtained: time of ignition (TTI), heat release rate (HRR), peak of heat release rate (pHRR), total heat release (THR), and total smoke released (TSR). A 10 cm × 10 cm × 0.4 cm horizontal wood sample previously stored in a conditioning room (T = 20 °C and RH = 40 %) was placed 2.5 cm below a conic heater. The back of the sample was wrapped in aluminum foil, and isolated by rock wool. A metal frame was used to fix the sample, the wood surface exposed was limited to 88.4 cm2. The heating of the cone part was monitored to impose a specific irradiance at the top of the sample of 50 kW m−2. An ignition source above the sample causes ignition. The heat release rate was calculated from the quantity of oxygen consumed during the combustion and detected via calibrated gas analyzers.
2.4.5. Optical microscopy
Cone calorimeter residues were observed using a VHX-7000 digital microscope (Keyence, Japan) at ×100 magnification. Full ring lighting was used to allow dark field observation, preferred for heterogeneous samples.
3. Results and discussion
3.1. Wood surface delignification
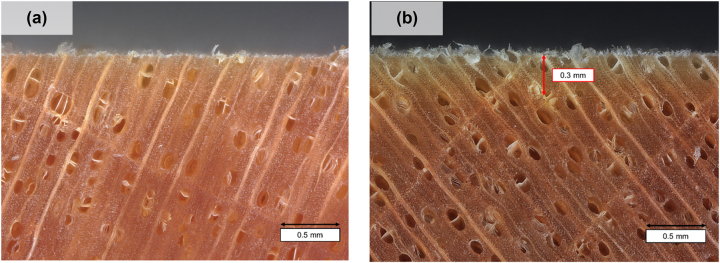
The color changes due to delignification were studied using the total color change (ΔE), the lightness change (ΔL*), the green-red color change (Δa*), and the blue-yellow color change (Δb*) parameters for D-REF. The lignin removal led to a visible color change (ΔE > 2). The lignin is a light-absorbing compound due to its aromatic cycles and its removal led to the lightning of wood surfaces as cellulose and hemicellulose are white (ΔL* = 8 ± 2) (Chen and Hu 2021). The samples became greener (Δa* = −5.5 ± 0.8) and there was no change in the blue-yellow axis (Δb* = 0.02 ± 1.13). In this study, the objective was to partially delignified the wood on its surface, which led to a limited color change (compared to other intensive treatments reported in the literature that could reach ΔL* = +22; Δa* = −14; Δb* = −37 for Basswood [Tilia] submerged in 2 % NaClO2 during 150 min) (Wu et al. 2019). Surface whitening enabled the determination of the delignification depth, which was approximately 0.3 mm (Figure 2).
Figure 2:
Microscopic observation of a reference (a) and a delignified sample (b).
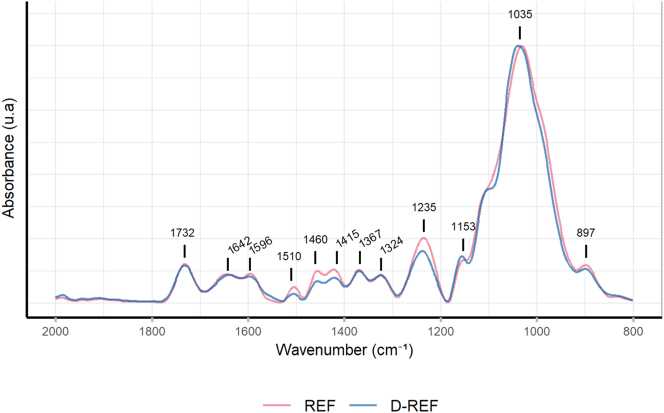
The REF and D-REF surface chemical composition was compared using ATR-FTIR spectroscopy (Figure 3). The characteristic bands of the wood were identified and are described in Table 2.
Figure 3:
ATR-FTIR spectrum of REF and D-REF surface; identification in Table 2.
Table 2:
Assignment of bands in FTIR for wood.
| Wavenumber (cm−1) | Identification | References |
|---|---|---|
| 1732 | C=O stretch of acetyl or carboxylic acid (hemicellulose) | Colom et al. (2003) |
| 1642 | C=O stretching conjugated (cellulose) | Müller et al. (2003) |
| 1596 | Aromatic skeletal vibration (lignin) | Müller et al. (2003) |
| 1510 | Aromatic skeletal vibration (lignin) | Pandey (1999) |
| 1460 | C–H deformation (lignin) | Colom et al. (2003) |
| 1415 | C–H in-plane deformation with aromatic ring stretching (lignin) | Pandey (1999) |
| 1367 | C–H deformation (cellulose and hemicellulose) | Ganne-Chédeville et al. (2012) |
| 1324 | CH2 wagging (cellulose) | Colom et al. (2003) |
| 1235 | C–O of guaiacyl ring (lignin) | Ganne-Chédeville et al. (2012) |
| 1153 | C–O–C asymmetric vibration (cellulose and hemicellulose) | Colom et al. (2003) |
| 1035 | C–O stretching (cellulose and hemicellulose) | Ganne-Chédeville et al. (2012) |
| 897 | C–H deformation (cellulose) | Colom et al. (2003) |
A decrease in intensity of 1235 cm−1, 1415 cm−1, 1460 cm−1, and 1510 cm−1 bands, corresponding respectively to the guaiacyl ring, the C–H deformation in lignin, and the aromatic skeletal vibration of lignin, were observed in D-REF compared to REF (Naumann et al. 2007). The bands characteristic of the cellulose (1642 cm−1, 1324 cm−1, 897 cm−1) and the hemicellulose (1732 cm−1, 1367 cm−1, 1153 cm−1, and 1035 cm−1) were unmodified. These results suggest that the delignification process partially degraded the lignin, while the cellulose and the hemicellulose were preserved.
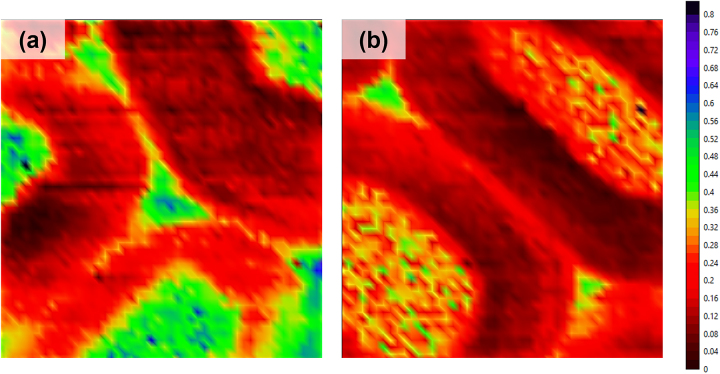
The Raman chemical mapping was used to compare the bulk material (Figure 4a) and the delignified surface (Figure 4b) of a D-REF sample based on the integration of the aryl ring symmetric stretching band of the lignin at 1606 cm−1. Higher lignin content was found in the middle lamella of the wood (Figure 4a) (Cogulet et al. 2016). After delignification, the color intensity of the lignin band decreased (Figure 4b), confirming the partial lignin dissolution by sodium hypochlorite.
Figure 4:
Chemical mapping by Raman confocal spectroscopy of D-REF center (a) and D-REF surface (b) from the band at 1606 cm−1.
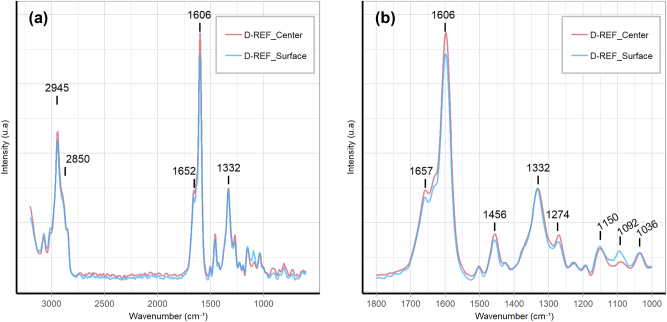
The spectra of the center and of the surface of the delignified wood samples confirmed the partial lignin dissolution in the middle lamella (Figure 5). The assignments of the 10 characteristic bands are listed in Table 3. The lignin is characterized by its bands at 2945 cm−1, 1652 cm−1, 1606 cm−1, 1274 cm−1, and 1036 cm−1. The intensity of these bands is lower on the surface of D-REF. The band characteristic of the cellulose (2850 cm−1, 1456 cm−1, 1332 cm−1, and 1150 cm−1) were unmodified compared to the sample center.
Figure 5:
Raman confocal spectroscopy spectra of D-REF center and D-REF surface (a); a zoom into the region from 1000 to 1800 cm−1 (b); identification in Table 3.
Table 3:
Assignment of bands in Raman confocal spectroscopy for wood.
| Wavenumber (cm−1) | Identification | References |
|---|---|---|
| 2945 | C–H stretching in O–CH3 asymmetric (lignin) | Agarwal and Ralph (1997) |
| 2850 | C–H and C–H2 stretching (cellulose) | Gierlinger and Schwanninger (2006) |
| 1652 | Ring conjugated C=C stretching (lignin) | Pandey and Vuorinen (2008) |
| 1606 | Aryl ring symmetric stretching (lignin) | Pandey and Vuorinen (2008) |
| 1456 | HCH and HOC bending (cellulose and lignin) | Agarwal and Ralph (1997) |
| 1332 | C–OH bending (cellulose) | Agarwal and Ralph (1997) |
| 1274 | Aliphatic CH deformation (lignin) | Agarwal and Ralph (1997) |
| 1150 | C–O stretching (cellulose) | Agarwal and Ralph (1997) |
| 1092 | C–O–C stretching (cellulose) | Agarwal and Ralph (1997) |
| 1036 | C–H bending in guaiacyl (lignin) | Lewis et al. (1994) |
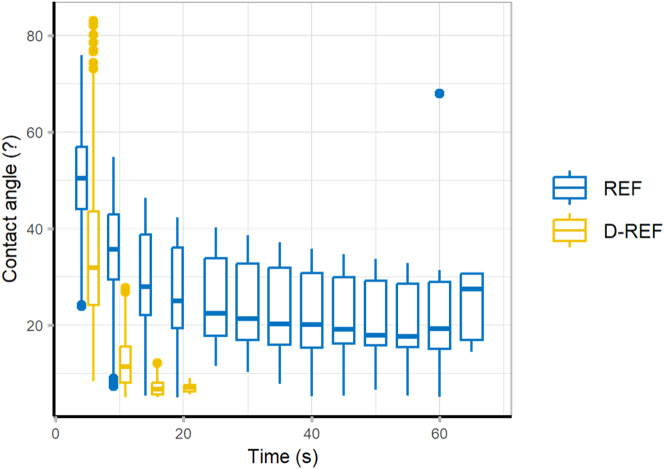
The wettability of wood and delignified wood was evaluated by measuring contact angle over time (Figure 6). The surface delignification reduced the initial contact angle (REF: 50 s ± 10 s; D-REF: 35 s ± 15 s). The D-REF samples absorbed water more quickly (REF: >60 s; D-REF: <20 s), proving that the partial removal of hydrophobic lignin increased the wood wettability. Moreover, the increase in wood wettability is also due to the larger mesopores formed in D-REF, which increased the number of accessible hydroxyl groups (Yang et al. 2019).
Figure 6:
Dynamic contact angle of wood and delignified wood.
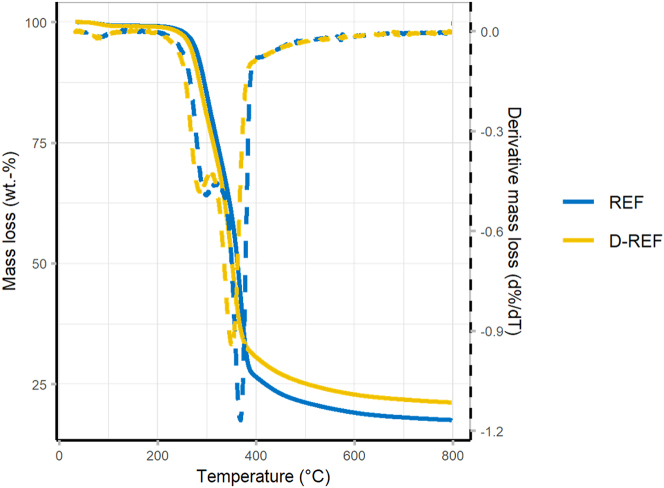
The thermal stability of wood and delignified wood was compared using TGA under nitrogen (Figure 7 and Table 4). The temperature of maximal decomposition rate (T m ) and the corresponding residual mass (M m ) characterize the cellulose decomposition. Both samples displayed the characteristic thermal degradation of wood divided in three steps: drying, charring, and final decomposition (Grønli et al. 2002). A first mass loss occurred around 100 °C due to the residual water evaporation. The three main components then successfully underwent pyrolysis: the hemicellulose from 180 °C, the cellulose from 200 °C, and the lignin from 280 °C (Beall and Eickner 1970). The cellulose decomposition peak, characterizing the charring process, was shifted to a lower temperature after the delignification (REF: 368 °C ± 0.7 °C; D-REF: 350 °C ± 1.8 °C). The lignin decomposes over a wide range of temperatures (280 °C–400 °C) and is known as the most thermally stable component in wood, mainly due to its aromatic structure (Yang et al. 2007). However, its partial removal led to an increase in residual mass compared to untreated wood (REF: 17.3 wt.-% ± 0.4 wt.-%; D-REF: 21.2 wt.-% ± 0.3 wt.-%). Similar results were presented in the literature (Ding et al. 2022; Kuai et al. 2022; Liu et al. 2023; Wang et al. 2023) and the increase could be due to the partial removal of hemicellulose and extractables, which have a lower thermal stability. The increased mass at the cellulose decomposition step (REF: 26.3 wt.-% ± 0.6 wt.-%; D-REF: 30.6 wt.-% ± 0.6 wt.-%) suggested that the delignification process had an effect on the thermal stability of cellulose (Wang et al. 2021).
Figure 7:
Mass loss (solid line) and derivative mass loss (dashed line) for REF and D-REF in N2 atmosphere.
Table 4:
Results of thermogravimetric analysis for REF and D-REF.
| REF | D-REF | |
|---|---|---|
| M100°C (wt.-%) | 99.4 ± 0.1 | 99.3 ± 0.1 |
| Tm (°C) | 368 ± 0.7 | 350 ± 1.8 |
| Mm (wt.-%) | 26.3 ± 0.6 | 30.6 ± 0.6 |
| M800°C (wt.-%) | 17.3 ± 0.4 | 21.2 ± 0.3 |
3.2. Wood surface impregnation
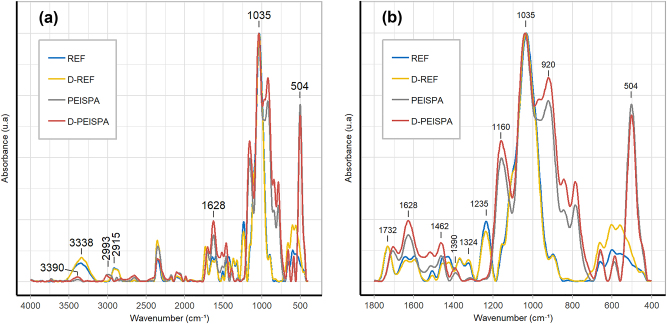
The chemical composition of REF, D-REF, PEISPA, and D-PEISPA surfaces were evaluated and compared using ATR-FTIR spectroscopy (Figure 8). The assignments for PEI and SPA peaks are listed in Table 5.
Figure 8:
FTIR spectra of REF, D-REF, PEISPA, and D-PEISPA (a); a zoom into the region from 400 to 1800 cm−1 (b).
Table 5:
Assignment of the bands for PEI and SPA in ATR-FTIR.
| Wavenumber (cm−1) | Identification |
|---|---|
| 3390 | N–H vibration (PEI) |
| 2993 | C–H stretching (PEI) |
| 1628 | N–H bending (PEI) |
| 1462 | CH2 vibrations (PEI) |
| 1390 | PEI – SPA interaction |
| 1160 | C–O–C asymmetric bridge stretching (SPA) |
| 1035 | C–O–P vibrations (SPA) |
| 920 | C–O–P vibrations (SPA) |
| 504 | PO32− asymmetric bending (SPA) |
The PEC deposition on wood was characterized by the peaks of SPA (1160 cm−1, 1035 cm−1, 920 cm−1, and 504 cm−1) and PEI (3390 cm−1, 2993 cm−1, 1628 cm−1, 1462 cm−1) (He et al. 2017; Koleva and Stefov 2013; Liu et al. 2018; Qi et al. 2011). The presence of the band at 1390 cm−1, characteristic of the interactions between PEI and SPA, confirmed the PEC’s formation (Soula et al. 2021). All the wood characteristic bands, previously described in Figure 1 and Table 2, were covered after the PEC deposition, suggesting that PEC was successfully deposited on the surface (Figure 7).
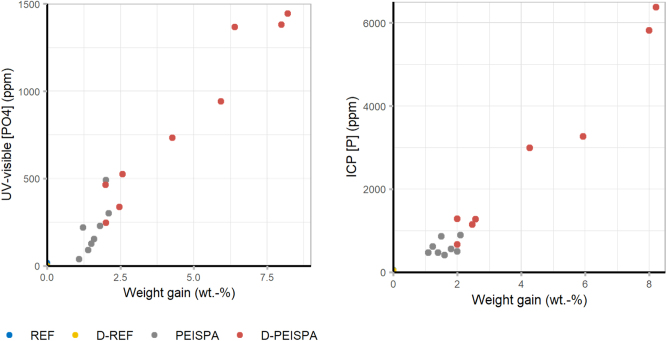
The phosphate concentration, determined by the UV-visible titration method, and the phosphorus concentration, determined by ICP titration, were plotted against weight gains (Figure 9). Very low phosphate and phosphorus concentrations were detected in REF (UV visible: 5 ± 8 ppm; ICP: 40 ± 4 ppm) and D-REF (UV visible: 0 ppm; ICP: 33 ± 1 ppm) samples. As expected, the surface delignification led to an increase of weight gain compared to the traditional treatment (PEISPA: 1.5 wt.-% ± 0.3 wt.-%; D-PEISPA: 4.3 wt.-% ± 2.5 wt.-%) (Figure 9). The phosphate and the phosphorus concentration are proportional to weight gain. It is also important to note that the weight gain for D-REF samples is more variable than for REF samples. This variability is mainly explained because surface delignification is a process that is currently difficult to control, despite the precautions taken (temperature and time control). A different delignification levels probably modified the wood’s wettability, and therefore its impregnability.
Figure 9:
Phosphate concentration against weight gain by UV-visible titration (left) and phosphorus concentration against weight gain ICP titration (right).
3.3. Fire performance
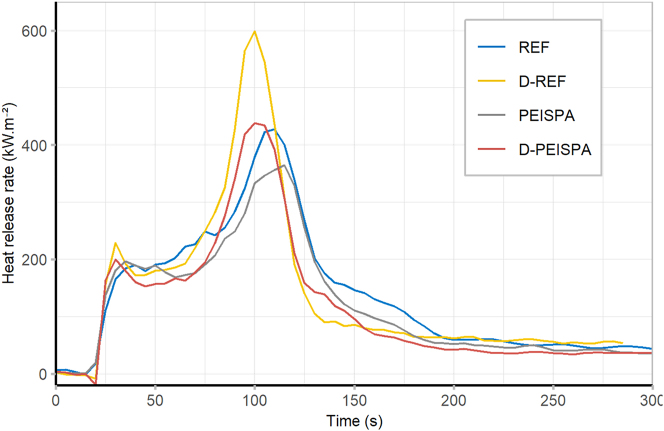
The cone calorimeter was used to evaluate the fire performance of reference yellow birch (REF), delignified yellow birch (D-REF), PEC surface impregnated yellow birch (PEISPA), and PEC surface impregnated delignified yellow birch (D-PEISPA). The HRR curves and the characteristic data are presented respectively in Figure 10 and Table 6. The heat release rate (HRR) curve for REF presented a typical shape for wood. First, after ignition (∼25 s), a first step was visible, which characterizes the primary pyrolysis of wood, forming a natural protective char. The porous structure slowed down the wood pyrolysis, and the HRR became constant for ∼30 s. Due to the thermal gradient between the wood surface, exposed to the flame, and the wood depth, protected by the char, mechanical stresses led to the formation of char cracks and a recovery of the pyrolysis (Baroudi et al. 2017). A peak of HRR (PHRR) was then displayed. After this peak, the HRR decreased and the flame extinction occurred shortly after. The remaining HRR is due to the non-flaming combustion of the wood residue.
Figure 10:
Heat release rate for REF, D-REF, PEISPA, and D-PEISPA.
Table 6:
Cone calorimeter results for REF, D-REF, PEISPA, and D-PEISPA.
| REF | D-REF | PEISPA | D-PEISPA | |
|---|---|---|---|---|
| WG (wt.-%) | 3.3 ± 0.5 | 5.4 ± 1.0 | ||
| TTI (s) | 26 ± 3 | 22 ± 3 | 22 ± 1 | 22 ± 2 |
| PHRR (kW.m−2) | 440 ± 10 | 570 ± 70 | 390 ± 20 | 480 ± 40 |
| THR (MJ.m−2) | 43 ± 2 | 38 ± 2 | 38 ± 2 | 36 ± 1 |
| TSR (m2.m−2) | 150 ± 20 | 150 ± 20 | 160 ± 20 | 150 ± 10 |
| Residue (wt.-%) | 10 ± 2 | 11 ± 2 | 13 ± 2 | 16 ± 1 |
The surface delignification did not change the HRR curve shape. The dip of the HRR curve for D-REF was slightly more pronounced, suggesting a change in the charring process, as documented in the literature (Fu et al. 2017). This char was less resistant than for the non-delignified samples as the PHRR is time-shifted by ∼10 s for the delignified samples. The PHRR was increased after the surface delignification, and a substantial variability was observed, which confirmed that the delignification process was not homogenous.
The surface impregnation of PEISPA on non-delignified samples led to a decrease of PHRR, THR and an increase of the residual weight. These results are consistent with a previous study (Soula et al. 2021). For D-PEISPA, the PHRR and the residual weight were increased compared to the REF and PEISPA samples. THR was slightly impacted. These results suggested that even if the FR content increased in D-PEISPA promoting char formation by catalyzing cellulose degradation (Wang et al. 2022), the char was less solid due to the lignin removal, and it cracked easily. The partial surface delignification has no benefits compared to the classic PEC deposition process and the role of the lignin in the char formation of wood is crucial.
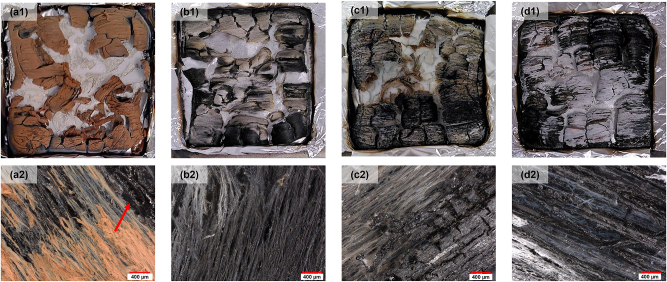
The residual samples were photographed just after cone calorimeter testing (Figure 11a1–d1) and further observed using an optical microscope (Figure 11a2–d2). The REF sample (Figure 11a1–a2) was covered by brown ashes. Under the brown layer, shiny black char was visible. The combustion of D-REF (Figure 11b1–b2) did not produce any char, and the residual samples consisted of very fragile fiber assemblies, as described in the literature (Fu et al. 2017). The treatment with PEC increased the residual mass on both wood and delignified wood. The PEISPA sample (Figure 11c1–c2) had a thick black protective char that covered its white fibrous structure. Due to the partial lignin removal, no thick char was visible at the D-PEISPA sample surface (Figure 11d1–d2). The fibers were directly coated by the PEC instead of forming a protective layer over the sample.
Figure 11:
Pictures of residual samples: REF (a1), D-REF (b1), PEISPA (c1), and D-PEISPA (d1). Observations in optical microscopy of residual samples: REF (a2), D-REF (b2), PEISPA (c2), and D-PEISPA (d2). Magnification: 100x.
4. Conclusions
This study aimed to assess the impact of surface delignification on yellow birch wettability, impregnability, and fire retardancy. The partial surface delignification was characterized by the lightening of the wood surface and chemical changes analyzed through FTIR and Raman spectroscopy. It was demonstrated that this technique allows for an increase in wood’s wettability, while having a limited effect on its appearance. The improved wettability facilitated a higher mass gain during the aqueous treatment involving the deposition of polyelectrolyte complexes (PECs). The studied PEC contained a phosphate compound, sodium phytate, and it was expected that an increase in phosphorus would lead to enhanced char formation during the combustion process.
The fire-retardancy of wood samples was evaluated by cone calorimetry. The partial delignification led to notable changes in the combustion behavior of the wood. The char formation during combustion was less efficient, and cracks occurred at shorter time intervals, suggesting a diminished char-formation capacity in the delignified wood. The PECs studied have a chemical action in the fire-retardancy of wood, by catalyzing the char formation due to phosphorus compound. This effect is limited with the reduction of the lignin content, whose decomposition allows for the formation of char. On delignified wood with PECs, char formation is limited to the fibers and does not allow for the formation of a uniform protective layer.
Further investigation on the optimal degree of delignification that would improve the wettability, while having a sufficient rate of lignin to maintain an efficient char formation, could be performed. This study should include in-depth analysis of the char formation process. A mechanical surface densification step could also be added to the process to both improve the fire-retardancy and the mechanical properties of wood.
Acknowledgments
This work is part of the research program of Natural Sciences and Engineering Research Council of Canada (NSERC) Canlak Industrial Research Chair in Finishes for Interior wood products (CRIF). The authors are grateful to the NSERC-Canlak Industrial Research Chair in Finishes for Interior wood products (CRIF) Industrial partners for their help and support. The authors would also like to acknowledge collaborators who provided technical support: Yves Bédard, Luc Germain, and Daniel Bourgault from the Renewable Materials Research Center (CRMR – Université Laval). The assistance provided by Julia B. Grenier and Solène Pellerin for the phosphate titration and the thermogravimetric analysis, respectively, was greatly appreciated.
Footnotes
Research ethics: Not applicable.
Author contributions: Conceptualization, Marie Soula, Fabienne Samyn, Sophie Duquesne and Véronic Landry; methodology, Marie Soula, Fabienne Samyn, Sophie Duquesne and Véronic Landry; software, Marie Soula; validation, Marie Soula; formal analysis, Marie Soula; investigation, Marie Soula; writing – original draft preparation, Marie Soula; writing – review and editing, Marie Soula, Fabienne Samyn, Sophie Duquesne, and Véronic Landry; supervision, Fabienne Samyn, Sophie Duquesne, and Véronic Landry; project administration, Fabienne Samyn, Sophie Duquesne, and Véronic Landry; funding acquisition, Véronic Landry. All authors have read and agreed to the published version of the manuscript.
Competing interests: The authors declare no conflict of interest. The funders had no role in the design of the study; in the collection, analyses or interpretation of data; in the writing of the manuscript, or in the decision to publish the results.
Research funding: This work is part of the research program of Natural Sciences and Engineering Research Council of Canada (NSERC) Canlak Industrial Research Chair in Finishes for Interior wood products (CRIF) through programs CRD (RDCPJ 500,157–16) and PCI (PCISA 514,917–16).
Data availability: The raw data can be obtained on request from the corresponding author.
References
- Agarwal U.P., Ralph S.A. FT-Raman spectroscopy of wood: identifying contributions of lignin and carbohydrate polymers in the spectrum of black spruce (Picea mariana) Appl. Spectrosc. . 1997;51:1648–1655. doi: 10.1366/0003702971939316. [DOI] [Google Scholar]
- Arao Y. Flame retardancy of polymer nanocomposite. In: Visakh P.M., Arao Y., editors. Flame retardants: polymer blends, composites and nanocomposites. Engineering materials. Springer International Publishing; Cham: 2015. pp. 15–44. [Google Scholar]
- Barnes H.M. Development of commercial wood preservatives. ACS symposium series . American Chemical Society; Washington: 2008. Wood preservation trends in North America; pp. 583–597. [Google Scholar]
- Baroudi D., Ferrantelli A., Li K.Y., Hostikka S. A thermomechanical explanation for the topology of crack patterns observed on the surface of charred wood and particle fibreboard. Combust. Flame . 2017;182:206–215. doi: 10.1016/j.combustflame.2017.04.017. [DOI] [Google Scholar]
- Beall F.C., Eickner H.W. Thermal degradation of wood components: a review of the literature . USDA Forest Service Forest Prob. Lab., Madison, Wisconsin; 1970. FPL Res. Paper No. 130. [Google Scholar]
- Berglund L.A., Burgert I. Bioinspired wood nanotechnology for functional materials. Adv. Mater. . 2018;30:1704285. doi: 10.1002/adma.201704285. [DOI] [PubMed] [Google Scholar]
- Canadian Wood Council . Fire safety design in buildings: a reference for applying the National Building Code of Canada fire safety requirements in building design . Canadian Wood Council = Conseil canadien du bois; Ottawa, ON: 1996. [Google Scholar]
- Chen C., Hu L. Nanoscale ion regulation in wood-based structures and their device applications. Adv. Mater. . 2021;33:2002890. doi: 10.1002/adma.202002890. [DOI] [PubMed] [Google Scholar]
- Cogulet A., Blanchet P., Landry V. Wood degradation under UV irradiation: a lignin characterization. J. Photochem. Photobiol. B Biol. . 2016;158:184–191. doi: 10.1016/j.jphotobiol.2016.02.030. [DOI] [PubMed] [Google Scholar]
- Colom X., Carrillo F., Nogués F., Garriga P. Structural analysis of photodegraded wood by means of FTIR spectroscopy. Polym. Degrad. Stab. . 2003;80:543–549. doi: 10.1016/S0141-3910(03)00051-X. [DOI] [Google Scholar]
- Dagher R., Stevanovic T., Landry V. Wood color modification with iron salts aqueous solutions: effect on wood grain contrast and surface roughness. Holzforschung . 2023;77:356–367. doi: 10.1515/hf-2022-0189. [DOI] [PMC free article] [PubMed] [Google Scholar]
- Davesne A.-L., Jimenez M., Samyn F., Bourbigot S. Thin coatings for fire protection: an overview of the existing strategies, with an emphasis on layer-by-layer surface treatments and promising new solutions. Prog. Org. Coat. . 2021;154:106217. doi: 10.1016/j.porgcoat.2021.106217. [DOI] [Google Scholar]
- Ding L., Han X., Chen L., Jiang S. Preparation and properties of hydrophobic and transparent wood. J. Bioresour. Bioproducts . 2022;7:295–305. doi: 10.1016/j.jobab.2022.02.001. [DOI] [Google Scholar]
- Fahey T.J., Woodbury P.B., Battles J.J., Goodale C.L., Hamburg S.P., Ollinger S.V., Woodall C.W. Forest carbon storage: ecology, management, and policy. Front. Ecol. Environ. . 2010;8:245–252. doi: 10.1890/080169. [DOI] [Google Scholar]
- Fink S. Transparent wood – a new approach in the functional study of wood structure. Holzforschung . 1992;46:403–408. doi: 10.1515/hfsg.1992.46.5.403. [DOI] [Google Scholar]
- Fu Q., Medina L., Li Y., Carosio F., Hajian A., Berglund L.A. Nanostructured wood hybrids for fire-retardancy prepared by clay impregnation into the cell wall. ACS Appl. Mater. Interfaces . 2017;9:36154–36163. doi: 10.1021/acsami.7b10008. [DOI] [PubMed] [Google Scholar]
- Ganne-Chédeville C., Jääskeläinen A.-S., Froidevaux J., Hughes M., Navi P. Natural and artificial ageing of spruce wood as observed by FTIR-ATR and UVRR spectroscopy. Holzforschung . 2012;66:163–170. doi: 10.1515/HF.2011.148. [DOI] [Google Scholar]
- Gierlinger N., Schwanninger M. Chemical imaging of poplar wood cell walls by confocal Raman microscopy. Plant Physiol. . 2006;140:1246–1254. doi: 10.1104/pp.105.066993. [DOI] [PMC free article] [PubMed] [Google Scholar]
- Gosselin A., Blanchet P., Lehoux N., Cimon Y. Main motivations and barriers for using wood in multi-story and non-residential construction projects. Bioresources . 2017;12:546–570. doi: 10.15376/biores.12.1.546-570. [DOI] [Google Scholar]
- Grønli M.G., Várhegyi G., Di Blasi C. Thermogravimetric analysis and devolatilization kinetics of wood. Ind. Eng. Chem. Res. . 2002;41:4201–4208. doi: 10.1021/ie0201157. [DOI] [Google Scholar]
- He Q., Rodrigues Reis C.E., Wang F., Hu B. Phytate extraction from coproducts of the dry-grind corn ethanol process. RSC Adv. . 2017;7:5466–5472. doi: 10.1039/C6RA27409A. [DOI] [Google Scholar]
- Huang Y., Zhang S., Chen H., Ding C., Xuan Y., Pan M., Mei C. A branched polyelectrolyte complex enables efficient flame retardant and excellent robustness for wood/polymer composites. Polymers . 2020;12:2438. doi: 10.3390/polym12112438. [DOI] [PMC free article] [PubMed] [Google Scholar]
- ISO 5660-1 . . ISO; 2015. https://www.iso.org/cms/render/live/en/sites/isoorg/contents/data/standard/05/79/57957.html 2015 [WWW Document] Accessed 25 May 2022. [Google Scholar]
- Jin K., Liu X., Jiang Z., Tian G., Yang S., Shang L., Ma J. Delignification kinetics and selectivity in poplar cell wall with acidified sodium chlorite. Ind. Crops Prod. . 2019;136:87–92. doi: 10.1016/j.indcrop.2019.04.067. [DOI] [Google Scholar]
- Joseph P., Ebdon J.R. Phosphorus-based flame retardants. In: Wilkie C.A., Morgan A.B., editors. Fire retardancy of polymeric materials . 2nd ed. Taylor and Francis Group; Wilkie, CA: 2009. pp. 107–128. [Google Scholar]
- Kishore K., Mohandas K., Sagar D.K. Effect of diammonium phosphate on the flammability of wood and wood–polymethylmethacrylate composites. Fire Mater. 1980;4:115–118. doi: 10.1002/fam.810040303. [DOI] [Google Scholar]
- Koleva V., Stefov V. Phosphate ion vibrations in dihydrogen phosphate salts of the type M(H2PO4)2·2H2O (M=Mg, Mn, Co, Ni, Zn, Cd): spectra–structure correlations. Vib. Spectrosc. . 2013;64:89–100. doi: 10.1016/j.vibspec.2012.11.004. [DOI] [Google Scholar]
- Kolibaba T.J., Grunlan J.C. Environmentally benign polyelectrolyte complex that renders wood flame retardant and mechanically strengthened. Macromol. Mater. Eng. . 2019;30:1900179. doi: 10.1002/mame.201900179. [DOI] [Google Scholar]
- Kolibaba T.J., Vest N.A., Grunlan J.C. Polyelectrolyte photopolymer complexes for flame retardant wood. Mater. Chem. Front. . 2022;6:1630–1636. doi: 10.1039/D2QM00257D. [DOI] [Google Scholar]
- Kuai B., Wang Z., Gao J., Tong J., Zhan T., Zhang Y., Lu J., Cai L. Development of densified wood with high strength and excellent dimensional stability by impregnating delignified poplar by sodium silicate. Constr. Build. Mater. . 2022;344:128282. doi: 10.1016/j.conbuildmat.2022.128282. [DOI] [Google Scholar]
- LeVan S.L., Collet M. Choosing and applying fire-retardant-treated plywood and lumber for roof designs. U.S. Department of Agriculture, Forest Service, Forest Products Laboratory; 1989. General technical report FPL. [Google Scholar]
- Lewis I.R., Daniel N.W., Chaffin N.C., Griffiths P.R. Raman spectrometry and neural networks for the classification of wood types — 1. Spectrochim. Acta A Mol. Spectrosc. . 1994;50:1943–1958. doi: 10.1016/0584-8539(94)80207-6. [DOI] [Google Scholar]
- Li H., Guo X., He Y., Zheng R. A green steam-modified delignification method to prepare low-lignin delignified wood for thick, large highly transparent wood composites. J. Mater. Res. . 2019;34:932–940. doi: 10.1557/jmr.2018.466. [DOI] [Google Scholar]
- Li Y., Fu Q., Yu S., Yan M., Berglund L. Optically transparent wood from a nanoporous cellulosic template: combining functional and structural performance. Biomacromolecules . 2016;17:1358–1364. doi: 10.1021/acs.biomac.6b00145. [DOI] [PubMed] [Google Scholar]
- Liu X., Fang X., Sun C., Zhang T., Wang K., Dong Y. Hybrid wood composites with improved mechanical strength and fire retardance due to a delignification–mineralization–densification strategy. Forests . 2023;14:1567. doi: 10.3390/f14081567. [DOI] [Google Scholar]
- Liu Y., Wang Q.-Q., Jiang Z.-M., Zhang C.-J., Li Z.-F., Chen H.-Q., Zhu P. Effect of chitosan on the fire retardancy and thermal degradation properties of coated cotton fabrics with sodium phytate and APTES by LBL assembly. J. Anal. Appl. Pyrolysis . 2018;135:289–298. doi: 10.1016/j.jaap.2018.08.024. [DOI] [Google Scholar]
- Lowden L., Hull T. Flammability behaviour of wood and a review of the methods for its reduction. Fire Sci. Rev. . 2013;2:4. doi: 10.1186/2193-0414-2-4. [DOI] [Google Scholar]
- Lowe G. Wood, well-being and performance: the human and organizational benefits of wood buildings . Forestry innovation Investment; British Columbia: 2020. [Google Scholar]
- Mariappan T. Fire retardant coatings. New technologies in protective coatings . IntechOpen; 2017. [Google Scholar]
- McLain R., Brodahl S.G. Insurance for mass timber construction: assessing risk and providing answers . 2021. [Google Scholar]
- Müller U., Rätzsch M., Schwanninger M., Steiner M., Zöbl H. Yellowing and IR-changes of spruce wood as result of UV-irradiation. J. Photochem. Photobiol. B Biol. . 2003;69:97–105. doi: 10.1016/S1011-1344(02)00412-8. [DOI] [PubMed] [Google Scholar]
- Naumann A., Peddireddi S., Kües U., Polle A. Wood production, wood technology, and biotechnological impacts . Universitätsverlag Göttingen; Göttingen: 2007. Fourier transform infrared microscopy in wood analysis; pp. 179–196. [Google Scholar]
- Östman B., Voss A., Hughes A., Jostein Hovde P., Grexa O. Durability of fire retardant treated wood products at humid and exterior conditions review of literature. Fire Mater. . 2001;25:95–104. doi: 10.1002/fam.758. [DOI] [Google Scholar]
- Pandey K.K. A study of chemical structure of soft and hardwood and wood polymers by FTIR spectroscopy. J. Appl. Polym. Sci. . 1999;71:1969–1975. doi: 10.1002/(SICI)1097-4628(19990321)71:12<1969::AID-APP6>3.0.CO;2-D. [DOI] [Google Scholar]
- Pandey K.K., Vuorinen T. UV resonance Raman spectroscopic study of photodegradation of hardwood and softwood lignins by UV laser. Holzforschung . 2008;62:183–188. doi: 10.1515/HF.2008.046. [DOI] [Google Scholar]
- Petrič M. Surface modification of wood. Rev. Adhes. . 2013;1:216–247. doi: 10.7569/RAA.2013.097308. [DOI] [Google Scholar]
- Pradhan S., Pokhrel M.R. Spectrophotometric determination of phosphate in sugarcane juice, fertilizer, detergent and water samples by molybdenum blue method. Sci. World . 2013;11:58–62. doi: 10.3126/sw.v11i11.9139. [DOI] [Google Scholar]
- Qi G., Wang Y., Estevez L., Duan X., Anako N., Park A.-H.A., Li W., Jones C.W., Giannelis E.P. High efficiency nanocomposite sorbents for CO2 capture based on amine-functionalized mesoporous capsules. Energy Environ. Sci. . 2011;4:444–452. doi: 10.1039/C0EE00213E. [DOI] [Google Scholar]
- Qin J., Li X., Shao Y., Shi K., Zhao X., Feng T., Hu Y. Optimization of delignification process for efficient preparation of transparent wood with high strength and high transmittance. Vacuum . 2018;158:158–165. doi: 10.1016/j.vacuum.2018.09.058. [DOI] [Google Scholar]
- Soula M., Samyn F., Duquesne S., Landry V. Innovative polyelectrolyte treatment to flame-retard wood. Polymers . 2021;13:2884. doi: 10.3390/polym13172884. [DOI] [PMC free article] [PubMed] [Google Scholar]
- Soula M., Grenier J.B., Duquesne S., Samyn F., Landry V. Proceedings IRG Annual Meeting 53, Bled Slovenia . IRG-WP; 2022. Impact of wetting agents on polyelectrolyte complex impregnation for wood fire-retardancy. [Google Scholar]
- Stevens R., van Es D.S., Bezemer R., Kranenbarg A. The structure–activity relationship of fire retardant phosphorus compounds in wood. Polym. Degrad. Stab. . 2006;91:832–841. doi: 10.1016/j.polymdegradstab.2005.06.014. [DOI] [Google Scholar]
- Tang T., Fu Y. Formation of chitosan/sodium phytate/nano-Fe3O4 magnetic coatings on wood surfaces via layer-by-layer self-assembly. Coatings . 2020;10:51. doi: 10.3390/coatings10010051. [DOI] [Google Scholar]
- Wang J., Minami E., Asmadi M., Kawamoto H. Effect of delignification on thermal degradation reactivities of hemicellulose and cellulose in wood cell walls. J. Wood Sci. . 2021;67:19. doi: 10.1186/s10086-021-01952-0. [DOI] [Google Scholar]
- Wang K., Meng D., Wang S., Sun J., Li H., Gu X., Zhang S. Impregnation of phytic acid into the delignified wood to realize excellent flame retardant. Ind. Crops Prod. . 2022;176:114364. doi: 10.1016/j.indcrop.2021.114364. [DOI] [Google Scholar]
- Wang Q., Xiao S., Shi S.Q., Cai L. Mechanical strength, thermal stability, and hydrophobicity of fiber materials after removal of residual lignin. Bioresources . 2017;13:71–85. doi: 10.15376/biores.13.1.71-85. [DOI] [Google Scholar]
- Wang Z., Gao Y., Zhou Y., Fan C., Zhou P., Gong J. Pyrolysis and combustion behaviors of densified wood. Proc. Combust. Inst. . 2023;39:4175–4184. doi: 10.1016/j.proci.2022.08.057. [DOI] [Google Scholar]
- White R. Use of coatings to improve fire resistance of wood . ASTM International; West Conshohocken, PA: 1983. [Google Scholar]
- White R.H., Dietenberger M.A. Fire safety of wood construction. In: Ross R.J., editor. Wood handbook: wood as an engineering material . U.S. Department of Agriculture, Forest Service, Forest Products Laboratory; WI, USA: 2010. pp. 18.1–18.22. [Google Scholar]
- Wladyka-Przybylak M., Kozlowski R. The thermal characteristics of different intumescent coatings. Fire Mater. . 1999;23:33–43. doi: 10.1002/(SICI)1099-1018(199901/02)23:1<33::AID-FAM667>3.0.CO;2-Z. [DOI] [Google Scholar]
- Wu J., Wu Y., Yang F., Tang C., Huang Q., Zhang J. Impact of delignification on morphological, optical and mechanical properties of transparent wood. Composites A Appl. Sci. Manufact. . 2019;117:324–331. doi: 10.1016/j.compositesa.2018.12.004. [DOI] [Google Scholar]
- Yang H., Yan R., Chen H., Lee D.H., Zheng C. Characteristics of hemicellulose, cellulose and lignin pyrolysis. Fuel . 2007;86:1781–1788. doi: 10.1016/j.fuel.2006.12.013. [DOI] [Google Scholar]
- Yang T., Ma E., Cao J. Effects of lignin in wood on moisture sorption and hygroexpansion tested under dynamic conditions. Holzforschung . 2018;72:943–950. doi: 10.1515/hf-2017-0198. [DOI] [Google Scholar]
- Yang T., Cao J., Ma E. How does delignification influence the furfurylation of wood? Ind. Crops Prod. . 2019;135:91–98. doi: 10.1016/j.indcrop.2019.04.019. [DOI] [Google Scholar]
- Yang T., Xia M., Chen S., Mu M., Yuan G. Enhancing the thermal stability of silica-mineralized wood via layer-by-layer self-assembly. J. Therm. Anal. Calorim. . 2020;145:309–318. doi: 10.1007/s10973-020-09786-6. [DOI] [Google Scholar]


