

Abstract
Introduction
Lipidomics is an emerging field with great promise for biomarker and mechanistic studies due to lipids diverse biological roles. Clinical research applying lipidomics is drastically increasing, with research methods and tools developed for clinical applications equally promising for wildlife studies.
Objectives
Limited research to date has applied lipidomics, especially of the intact lipidome, to wildlife studies. Therefore, we examine the application of lipidomics for in situ studies on Mozambique tilapia (Oreochromis mossambicus) in Loskop Dam, South Africa. Wide-scale mortality events of aquatic life associated with an environmentally-derived inflammatory disease, pansteatitis, have occurred in this area.
Methods
The lipidome of adipose tissue (n = 31) and plasma (n = 51) from tilapia collected from Loskop Dam were characterized using state of the art liquid chromatography coupled to high-resolution tandem mass spectrometry.
Results
Lipid profiles reflected pansteatitis severity and were significantly different between diseased and healthy individuals. Over 13 classes of lipids associated with inflammation, cell death, and/or oxidative damage were upregulated in pansteatitis-affected adipose tissue, including ether-lipids, short-chained triglyceride oxidation products, sphingolipids, and acylcarnitines. Ceramides showed a 1000-fold increase in the most affected adipose tissues and were sensitive to disease severity. In plasma, triglycerides were found to be downregulated in pansteatitis-affected tilapia.
Conclusion
Intact lipidomics provided useful mechanistic data and possible biomarkers of pansteatitis. Lipids pointed to upregulated inflammatory pathways, and ceramides serve as promising biomarker candidates for pansteatitis. As comprehensive coverage of the lipidome aids in the elucidation of possible disease mechanisms, application of lipidomics could be applied to the understanding of other environmentally-derived inflammatory conditions, such as those caused by obesogens.
Keywords: Pansteatitis, Lipidomics, Environmental metabolomics, Inflammation, Obesity, Oxidation
Graphical Abstract
1. Introduction
Lipids have diverse biological functions and are ubiquitous across nearly all life forms. Biological changes due to external stimuli (such as those resulting from disease) are often reflected in lipid profile fluctuations. By tracking lipid profile changes, clinical scientists can determine markers of health status and mechanisms of disease (Stephenson et al. 2017). Recent advances in mass spectrometric technology and data processing software have drastically increased the number of lipids which can be measured simultaneously within a system (Blanksby and Mitchell 2010). This broad coverage of lipids, termed lipidomics, has drastically increased the number of applications and scope of use within the clinical field (Sethi and Brietzke 2017; Stephenson et al. 2017).
While the emerging field of lipidomics has been widely accepted in clinical science, applications in wildlife and environmental studies are scarce and pose unique challenges. For example, new lipids are discovered weekly in various organisms (Christie 2017), and as a consequence, these lipids will be absent within the databases of most lipidomic identification software. In addition, lipid profiles can drastically change due to natural changes across time and geography such as life-cycle, dietary, and seasonal changes (Mayzaud et al. 2011). Therefore, in situ studies are needed to establish lipid baselines that can distinguish lipid profile changes due to natural occurring phenomena versus the studied environmental change.
Recent in situ lipidomics applications focus on fatty acids indicative of exposure to different environmental contaminants in marine mussels (Albergamo et al. 2016), clams (Rocchetta et al. 2014), and manatees (Wetzel et al. 2010). However, fatty acids are only one class out of over 60 lipid classes that can be evaluated using modern lipidomics technology, and hence the application and implementation of more comprehensive lipidomics studies in situ could provide additional information. In order to determine the utility of a more comprehensive lipidomics approach in wildlife studies, we applied state-of-the-art lipidomics methods to study the mortality events in Loskop Dam, South Africa. Attention to this potential outbreak occurred after hundreds of Nile crocodiles (Crocodylus niloticus) were found dead at Olifants River Gorge in 2008 (Huchzermeyer 2012), and a population in Loskop Dam was entirely killed off following a large fish kill (Dabrowski et al. 2014). The mass mortality events of fish and Nile crocodiles were attributed to an unidentified etiology that resulted in the development of an environmentally-derived form of pansteatitis. Pansteatitis, a disease characterized by inflammation of adipose tissue, build-up of oxidative-associated pigments, and necrosis within adipose tissue, is generally considered a nutritional disorder caused by a diet high in unsaturated fat and/or deficiency in vitamin E (Huchzermeyer 2012). However, in certain cases, like what was observed along the Olifants River, pansteatitis is also believed to be caused by additional environmental factors, such as trace metals or other xenobiotics, which affect oxidative stress pathways (Truter et al. 2016). Proposed causes for the pansteatitis outbreak in Kruger National Park, South Africa, consisted of exposure to mining runoff, change in diet due to invasive species, eutrophication (due to phosphate mine, municipal sewage, and fly ash runoff from coalmines), cyanobacteria, and parasites (Dabrowski et al. 2014; Huchzermeyer 2012; Huchzermeyer et al. 2011, 2013; Jooste et al. 2015; Lane et al. 2013).
Potential negative impacts of pansteatitis on the indigenous human population include a decrease in ecotourism (especially due to mass mortalities of the Nile crocodile) and the potential health effects of consumption of pansteatitis-affected animals, especially since it has been proposed that diet is one route of origination of pansteatitis (Huchzermeyer et al. 2013; Osthoff et al. 2010). For the present study, Mozambique tilapia (Oreochromis mossambicus), a common food source of the Nile crocodile (and humans), were selected as a model species to evaluate the practical application of plasma lipidomics as a means to ascertain lipid markers that can differentiate between pansteatitis-affected and healthy specimens. The tissue lipidome (in this case, adipose) was characterized to understand the metabolism of the disease and a potential mechanism for improving classification of disease severity. In general, we postulate that the findings from this pansteatitis outbreak study may be expanded to other environmental studies aimed at better identifying pathways involved with inflammatory diseases due to xenobiotic exposure.
2. Materials and methods
2.1. Sample collection and metadata
Fifty-one (n = 51) Mozambique tilapia (Oreochromis mossambicus) were captured at various locations along the inflow of Loskop Dam, Mpumalanga, South Africa (25°28′22.8″S: 29°15′25.2″E) between May 2–6, 2016. On capture, blood was immediately drawn and collected in lithium heparin 3 mL vacutainers (BD vacutainer, Franklin Lakes, NJ). After the first blood draw, fish were kept in aerated tanks and transported back to the field station for necropsy. All fish work was conducted using the permit and animal handling protocol that was reviewed and approved by the Medical University of South Carolina (AR#: 3429) and the Mpumalanga Tourism and Parks Agency (Project #ES 6/1).
Upon arrival to the field station, blood was immediately centrifuged in collection tubes and 500 μL of plasma was aliquoted into cryogenic storage vials (Corning, Corning, NY) for lipidomic studies (n = 51). Adipose tissue was removed during dissection and flash frozen and stored for lipidomics analysis. Juvenile fish with an ambiguous sex assignment were excluded. Pictures of the whole fish and individual biopsied tissues were taken under consistent lighting in a photo box for documentation. A subset of the sampled fish, representing individuals with varying degrees of disease severity with matched age, size, and weight, were selected for lipidomics of adipose tissue (n = 31).
2.2. Assessment of health status
On-site visual scores (current technique to diagnose pansteatitis in the field), ranging from 0 to 5 (0 being no sign of pansteatitis and 5 being most severely affected), were assigned for the adipose tissues for each fish by at least two trained personnel (including one local veterinarian). Photographs of the adipose tissue from a select number of individuals and their corresponding resulting visual scores are shown in Online Resource 1: Figure S1. In brief, scoring was based on the size, distribution, and amount of yellow/brown/orange pigmentation visually observed in the tissue, as this specific pigmentation is a hallmark of pansteatitis-affected necrotic tissue. In addition to the visual disease scoring, thin slices of adipose tissue were placed in formalin and a histological examination was also performed to generate an alternative disease score. The histological based scores (0–5) (Bowden et al. 2016) regarding disease severity were assigned. For this study, fish were assigned a health status of “diseased” if histological scores were greater than 1, and “healthy” if histological scores were 1 or less. To compare scoring methods, both the histological score and the average of histological and visual scores were used for regression analysis.
2.3. Lipidomics sample preparation and data acquisition
Plasma samples were extracted using the Bligh–Dyer method (Bligh and Dyer 1959) and adipose tissue samples were extracted using the Folch method (Folch et al. 1957). A Thermo Scientific Vanquish UHPLC system (Thermo Scientific, San Jose, CA) was coupled to an Orbitrap Fusion Lumos Tribrid (Thermo Scientific, San Jose, CA) for the chromatographic separation and mass spectral measurements of lipids in positive and negative ion mode, respectively. A Waters Acquity C18 BEH column (2.1 × 100 mm, 1.7 μm particle size, Waters, Milford, MA) with a gradient program consisting of mobile phase C [60:40 acetonitrile/water] and mobile phase D [90:8:2 isopropanol/acetonitrile/water], each containing 10 mmol/L ammonium formate and 0.1% (v/v) formic acid, was employed for chromatographic separation of all lipid samples. An in-depth description of sample preparation and data-acquisition methods and parameters can be found in the Online Resource 1.
2.4. Lipidomics data processing
Lipid features were obtained using MZmine as described in (Koelmel et al. 2017). Features observed in the blanks were removed using the blank feature filtration method (Patterson et al. 2017). The blank feature filtration method compared to various other filtering methods has been shown to increase the removal of true negatives while decreasing the removal of true positives (Patterson et al. 2017). The resulting MZmine features were annotated using both AIF and ddMS2-top10 data with LipidMatch (Koelmel et al. 2017) and LipidSearch (Thermo Scientific, San Jose, CA). These annotations are putative, as annotations are based on in-silico MS/MS spectral libraries without matching internal standards for validation and without confirmation using orthogonal approaches (Sumner et al. 2007). Normalization to lipid standards was performed using LipidMatch Quant. This program provides a single point calibration using an exogenous lipid internal calibrant that best represents the lipid feature (based on lipid class, adduct, and retention time). An in-house R script was applied that combined multiple lipid features (adducts) into one feature representing a unique lipid molecule. This script also combined negative and positive polarity data into a single dataset. All open source lipidomics tools are available at http://secim.ufl.edu/secim-tools/.
2.5. Statistical analyses
Multivariate statistical analysis was performed using Meta-boanalyst 3.0 (Xia et al. 2015). Briefly semi-quantified values [mg lipid per kg tissue (dry weight) and mg lipid per kg plasma (wet weight)] were normalized by sum, log transformed, and mean centered. Principal components analysis (PCA) was performed on the resulting normalized lipid values, with samples color-coded by sex and disease status. For univariate analysis, a t-test was performed on “diseased” versus “healthy” tilapia for males and females in plasma and adipose tissue samples. To account for multiple comparison errors, the Benjamini-Hochberg method (Benjamini and Hochberg 1995) was used to obtain false discovery rate (FDR) corrected p-values. To determine trends across lipid classes, a fisher’s exact test was performed using the fisher. test function in R (R Development Core Team 2016) script and function. An in-depth description of statistical methods can be found in Online Resource 1.
3. Results and discussion
In this work, we show the utility of comprehensive lipidomics for discovering mechanisms and biomarkers of wildlife disease in situ. We determined over 13 lipid classes that significantly changed across different levels of disease severity in adipose tissue, all of which were related to either cell death, inflammation, and/or oxidative damage. These data could not only be used to better diagnose and determine mechanisms and treatments of pansteatitis-affected aquatic life in South Africa, but also may be extrapolated to general mechanisms and effects of other inflammatory diseases.
3.1. Field observations and measurements
Field observation and measurements revealed major drought conditions (Online Resource 1: Figure S2), green algal blooms (Online Resource 1: Figure S3), and alkaline water (average pH of 8.85 ± 0.50) with the following averaged values between May 2–6, 2016: conductivity of 534 ± 67 μmhos/cm, total dissolved solids at 375 ± 43 mg/L, salinity at 0.26 ± 0.03 ppt, and temperature of 22.2 ± 1.5 °C. Satellite imagery from Google Earth showed numerous coal mining operations near the river system and coal mining refuse without any buffer feeding into Loskop dam (Online Resource 1: Figure S4 and Figure S5). This finding may serve as a possible reason for the elevated pH levels of the river system. Elevated pH from coal mining, nutrient overload from modern farming practices (Online Resource 1: Figure S6 and Figure S7) and sewage release from poorly operating waste water treatment plants (Dabrowski et al. 2013; Dabrowski and de Klerk 2013) are likely contributors to the observed eutrophication (Online Resource 1: Figure S3). Eutrophication can produce phytoplankton blooms, which can cause an increase in the amount of polyunsaturated fats in the diet of aquatic organisms (Huchzermeyer et al. 2013). Polyunsaturated fats are more easily oxidized and many organisms have not evolved to accommodate large amounts in their diet, hence potentially leading to pansteatitis development (Huchzermeyer et al. 2013). Pansteatitis-affected Mozambique tilapia have been shown to consume significantly more plankton high in polyunsaturated fats as compared to healthy tilapia (Dabrowski et al. 2014). In addition, microcystins released from the algal blooms can lead to, or exacerbate, pansteatitis. A map showing the distribution of anthropogenic activities possibly leading to contamination in the region is shown in Online Resource 1: Figure S8.
3.2. Pansteatitis‑affected fish morphology and histology
Metadata on morphology and histology of fish examined in this study can be obtained in Online Resource 2, as well as on the metabolomics workbench along with all data files, feature tables, and meta data (http://www.metabolomicsworkbench.org/data/DRCCStudySummary.php) under ST001052 (plasma) and ST001059 (tissue). Most fish captured at Loskop Dam exhibited visual signs of pansteatitis in tissue (ceroid pigments), with only 8 of 51 Mozambique tilapia showing no signs of pansteatitis by both histology and visual scoring of adipose tissue (score of 0). These 8 fish were significantly (p < 0.001) younger (4.8 ± 2.0 years, examining otolith rings) compared to the fish with signs of pansteatitis (9.1 ± 2.7 years), and weighed significantly less (p < 0.001) at 1.3 ± 0.2 kg as compared to 1.7 ± 0.4 kg. These findings indicate a correlation with age, potentially due to the accumulation of toxins, increased polyunsaturated fats from the diet, or other exposure occurring overtime. This trend of older, heavier fish having more severe pansteatitis has been previously reported (Bowden et al. 2016).
Histology was used both to characterize disease progression and correlate lipid profile shifts across disease states. Histological analysis of adipose tissue is shown in Online Resource 1: Figure S10 with a more in-depth description of histology provided in Online Resource 1 and Online Resource 2. A distinct progression of disease was observed. The initial stage of pansteatitis results in the swelling of individual adipocytes (adipose cells) and breakdown of the clear intracytoplasmic lipid vacuole into numerous smaller foamy vacuoles (Online Resource 1: Figure S10A). Following adipose degeneration (loss off function and eventual death of adipose cells), either fibrous connective tissue surrounds the degenerate adipocyte and/ or there is a discrete influx of histiocytic inflammation into the tissue (lipoid granuloma formation). The inflammation is characterized by infiltration of macrophages (Online Resource 1: Figure S10B - Figure S10D), which have a distinctly different lipid profile (lipidome) compared to the normal adipose cell lipidome.
3.3. Lipidomics: overview of results
The evaluated plasma revealed 590 lipid molecules across 23 lipid classes. Furthermore, 963 lipid molecules from 37 lipid classes were identified in adipose tissue. Lipid concentrations across samples, annotations, and statistics are provided in Online Resource 3 and Online Resource 4 and on the metabolomics workbench. While there was overlap between groups, principal component analysis (PCA) showed significant differences between the lipid profiles of diseased and healthy fish for both males and females in both plasma and tissue samples based on a t-test of scores (Fig. 1a, b). Scores plots show that grouping by health and disease status was more apparent in adipose tissue samples when compared to the plasma samples. This is most likely due to the use of adipose as a proxy to score health status (which is the traditional scoring method employed) (Bowden et al. 2016). Plasma is a mixture of secretions from other organs, which were also affected by pansteatitis, but not always to the same extent as adipose tissue. In addition, plasma lipid concentrations are more transient, changing depending on short temporal phenomena such as diet. A more detailed explanation of sample inclusion and exclusion criteria, and the minimal grouping of plasma samples based on health status in the PCA scores, is discussed in Online Resource 1.
Fig. 1.

PCA scores plots for plasma (a) and adipose (b) color coded by sex and health status. FDR corrected p values of the scores for diseased females (FD) versus healthy females (FH) and diseased males (MD) versus healthy males (MH) are shown in the bottom left corners of both panels
Triglyceride down-regulation in diseased individuals (Table 1 and Online Resource 1: Figure S9) was the only significant class-based trend observed in the plasma samples, and further supports anorexia in animals affected by pansteatitis, which is demonstrated by reduced lipid content in plasma. On the contrary, numerous lipid classes were up-regulated in diseased individuals in adipose tissues; these lipids were general indicators of a heightened inflammatory response and will be discussed in more detail below.
Table 1.
Fisher’s exact test p values for the most significantly upregulated and downregulated lipid classes (see table of acronyms for lipids)
| Adipose tissue |
Plasma TG | ||||||
|---|---|---|---|---|---|---|---|
| Cer | CerGl | SM | ether-LPC | ether-PC | ether-PE | ||
| M Up D | 0.001 | 0.000 | 0.000 | 0.004 | 0.000 | 0.002 | 1.000 |
| F Up D | 0.000 | 0.000 | 0.000 | 0.000 | 0.000 | 0.004 | 1.000 |
| M Down D | 1.000 | 1.000 | 1.000 | 1.000 | 1.000 | 1.000 | 0.000 |
| F Down D | 1.000 | 1.000 | 1.000 | 1.000 | 1.000 | 1.000 | 0.000 |
The p values are for upregulated in diseased males (M Up D), upregulated in diseased female (F Up D), downregulated in diseased males (M Down D), and downregulated in diseased females (F Down D)
3.4. Lipid profiles in adipose tissue indicate an increased inflammatory response
Univariate analysis using Fisher’s exact test showed that upregulated lipids in more severely affected adipose tissue (p < 0.005) generally consisted of the following sphingolipids as shown in Table 1: ceramides (CER), glyco-ceramides (CerG1), and sphingomyelins (SM), and the following ether-linked lipids: plasmenyl and plasmanyl lysophosphatidylcholines (ether-LPC), plasmenyl and plasmanyl phosphatidylcholines (ether-PC), and plasmenyl and plasmanyl phosphatidylethanolamines (ether-PE). Acyl carnitines were significantly upregulated in diseased male tilapia adipose tissue, with all three identified acyl carnitines significant at an FDR corrected p-value less than 0.05. A visual representation of significance and fold change by lipid class is shown in Fig. 2 for female adipose samples and Online Resource 1: Figure S9 for males.
Fig. 2.

Volcano plot color coded by lipid class for female adipose samples. Fold change and p-values are based on comparison of diseased (FD) and healthy (FH) females. Red squares signify FDR corrected p-values less than 0.2 and fold changes greater than 2 (or less than 0.5). Definitions of lipid acronyms are provided in the table of acronyms
Severely affected male and female tilapia adipose tissue contained significantly upregulated ceramides and sphingomyelins (Fig. 2 and Online Resource 1: Figure S9B), with the most drastic changes observed in males. In male fish, fold changes over 50 were observed for most ceramide, glyco-ceramide, and oxidized ceramide species, whereas fold changes over 10 for most SM species was observed (Online Resource 1: Figure S9B). Ceramides play an important role in signaling cascades related to inflammatory response, (Maceyka and Spiegel 2014) and are also upregulated in programmed cell death (Mullen and Obeid 2012). In a study analyzing the mouse macrophage lipidome, Dennis et al. 2010 found that macrophage cells undergoing pro-inflammatory Kdo2-lipid A treatment had increased sphingolipid content, including ceramides, glycol-ceramides, and sphingomyelin. Therefore, this drastic increase in sphingolipids, especially ceramides, in adipose tissue of more severely affected fish, may be attributed to the microscopically observed histiocytic inflammatory components associated with adipocyte degeneration and necrosis.
One possible alternative interpretation is that age and/or weight, both of which were correlated with disease severity, were responsible for the drastic change in ceramide concentration in adipose tissue. Therefore, the subset of adipose samples with tilapia ages ranging from 8 to 11 were selected. For this subgroup of tilapia samples, the tilapia did not differ significantly in age or weight between diseased (n = 7) and healthy (n = 6) individuals (Student t test p value > 0.1). The total ceramide concentration remained significantly different between healthy and diseased individuals of similar age and weight (p-value < 0.05), with average concentrations of 14.1 ± 10.2 mg/kg versus 140.1 ± 128.7 mg/kg, respectively.
In addition to sphingolipids, a significant increase in ether-linked lipids were observed in diseased tilapia adipose tissues. Ether-lipids are a major component of macrophage membranes and macrophages contain a significantly higher level of ether-lipids when compared to the levels found in adipose cells (Ivanova et al. 2010). Therefore, the increase in ether-lipids could be indicative of an increase in macrophage cells in diseased adipose tissue. Ether-lipids are targets of oxidation, preventing the chain propagating step of oxidation reactions in membranes, and hence can be considered antioxidants (Engelmann 2004). Increased oxidation would be expected to show the reverse trend as a decrease in ether-lipid levels, and hence would not explain the observed levels (Engelmann 2004). Therefore, changes in ether-lipids may be predominated by increased histiocytic inflammatory components, rather than direct oxidative damage.
Acylcarnitines were also elevated in severely affected tissues and have been shown to increase with histiocytic inflammation as well as play key roles in the inflammatory response (Adlouni et al. 1988; Johnson et al. 2012; Sampey et al. 2012; Schmerler et al. 2012). Most acyl-carnitines, ether-linked lipids, and sphingolipids were positively correlated across adipose samples (Pearson correlations greater than 0.95) and grouped together in a correlation matrix (Online Resource 1: Figure S11 and Online Resource 5). This strong correlation suggests, although does not prove, that all of these lipids are associated with the same phenomenon, most likely the previously discussed macrophage infiltration and host inflammatory response. Furthermore, lipids that tightly group and correlate to these lipid species may be involved in, or indicate, macrophage infiltration and pansteatitis severity. Other lipids which correlated significantly were the majority of short-chained triglyceride oxidation products, phosphatidylinositol (PI), phosphatidylserine (PS), and phosphatidylglycerol (PG) species (Online Resource 1: Figure S11 and Online Resource 5). Short-chained oxidation products of triglycerides (TGs) may be direct products of oxidative damage indicative of pansteatitis, while PI, PS, and PG have been found in significant quantities in mice macrophage cell membranes (Dennis et al. 2010).
3.5. A more quantitative and sensitive approach to assessing disease severity using lipidomics data
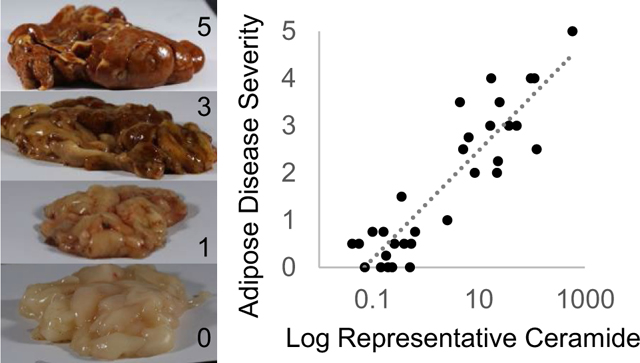
Categorizing fish as “healthy” and “diseased” is helpful to determine the major lipids differing across health status, but in reality, fish varied within these groupings based on disease progression and severity. Therefore, the resulting biomarkers were correlated against the average of histological and visual scores to determine lipid change across disease progression/severity. All the above-mentioned lipid species exponentially increased across disease severity, with sphingolipids, especially ceramides, being the most sensitive to changes in health status. An example is shown for Cer(d18:0 + pO/22:0), a ceramide with a phytosphingosine base with an additional oxygen, in Fig. 3a with a correlation coefficient of 0.81. Cer(d18:0 + pO/22:0) was the most abundant phytosphingosine containing lipid identified in adipose tissue. As an example of sensitivity to changes in disease severity, Cer(d18:0 + pO/22:0) changed over 3 orders of magnitude (greater than 1000-fold) from the least diseased to most severely affected individuals. Previous research has reported phytosphingosine lipids, produced in fish leukocytes, to concentrate in inflamed tissues (Bodennec et al. 2000, 1998).
Fig. 3.

Correlation of adipose Cer(d18:0 + pO/22:0) semi-quantitative amounts with the average of histological and visual scores, and tissue and blood parameters indicative of disease severity. Note x-axis is log scaled
Currently there are no methods to quantitatively determine disease severity in pansteatitis-affected animals, and even qualitative characterization of disease severity is problematic. Visual scoring is subjective and conclusions derived from histological studies are based on only a small portion of very heterogeneously affected tissues that often do not represent the entire tissue. Differences in limitations for determining health status may explain the surprising finding that visual and histological scores of disease severity were only minimally correlated (R2 = 0.39; Online Resource 1: Figure S12). Using the visual and histological scores separately provided even lower R2 values than the average of both scoring systems in all cases above. The high degree of correlation of sphingolipids with the average of histological and visual scoring and drastic change with disease severity suggests that sphingolipids may serve as molecular markers to better quantitatively indicate disease severity.
We therefore compared the use of ceramide as a proxy for disease status against histological and visual scores for predicting total TG content in plasma, percent moisture in adipose tissues, and protein levels in plasma. Plasma protein and percent moisture have previously been associated with pansteatitis (Bowden et al. 2016; Osthoff et al. 2010). Both plasma protein and TG levels were expected to decrease in starved fish (Costas et al. 2011; Pérez-Jiménez et al. 2007). Starvation has been observed in pansteatitis-affected crocodiles in the region with adipose inflammation leading to rigid immobility, an inability to hunt, a reduction in TG levels, and ultimately death (Woodborne et al. 2012). Using Cer(d18:0 + pO/22:0) relative concentrations as an indicator of disease severity, disease severity correlated with total plasma TG content (R2 = 0.55, power function), total plasma protein (R2 = 0.64, power function), and adipose tissue moisture content (R2 = 0.83, power function) (Fig. 3b–d). Cer(d18:0 + pO/22:0) explained 5% more of the variance in plasma total TG, 10% more of the variance in plasma total protein, and 25% more of the variance in percent moisture content than the average of visual and histological scores (Online Resource 1: Figure S13). These findings provide evidence that lipids serve as better indicators of disease severity than traditional visual and histological approaches in adipose tissue.
A number of lipids (e.g., PS, PG, and PI species) were highly correlated across samples with Cer(d18:0 + pO/22:0), having Pearson correlation coefficients greater than 0.98 (Online Resource 5). Therefore, any of these molecules could be used as a molecular marker to determine disease severity in adipose tissue. An individual lipid species or a panel of lipid species can be chosen which provide the most robust, low cost, and sensitive measurements indicative of health status. Caution should be used when employing biomarkers from this study, as many can be indicators of inflammation and cell death, which are associated with numerous other disease states and may lead to false positive diagnoses. In addition, the ideal biomarker would be acquired using less invasive techniques such as collection of plasma, especially since translation to crocodiles affected in the region necessitates non-invasive approaches, although tissue plugs are possible to acquire with appropriate permits.
While mass spectrometry was used in this study, changes are observed at the class level as well as the species level making thin layer chromatography (Jurowski et al. 2017) or other low cost methods viable options for direct application in the field for class level biomarkers. Characterizing pansteatitis using one or more of these lipid markers at either the class or species level has many advantages compared to histological or visual examination. Advantages include procurement of a quantitative (less subjective) result, ability to detect subtle changes in disease severity (especially in ceramides), detection of biological molecules provides insight into disease pathogenesis, and allows for a non-lethal approach when collecting field samples.
Supplementary Material
Acknowledgements
Authors would like to thank Andrew C. Patt for developing the R script for combining negative and positive polarity data and combining multiple adducts representing one lipid species. Mr. AC Hoffman is sincerely thanked for his assistance with fish collection and his keen interested in our research. Part of this work is based on the research supported by the South African Research Chairs Initiative of the Department of Science and Technology and National Research Foundation of South Africa (Grant No 101054). In addition, part of this work was funded by Core 1 of the Southeast Center for Metabolomics (SECIM) (http://secim.ufl.edu/) (National Institute for Health Grant #U24 DK097209), the U.S. National Science Foundation under Award No. DBI-1359079, and the Medical University of South Carolina Center for Global Health.
Funding
This study was funded in by the South African Research Chairs Initiative of the Department of Science and Technology and National Research Foundation of South Africa (Grant No 101054), by Core 1 of the Southeast Center for Metabolomics (SECIM) (http://secim.ufl.edu/) (National Institute for Health Grant #U24 DK097209), the U.S. National Science Foundation under Award No. DBI-1359079, and the Medical University of South Carolina Center for Global Health.
Abbreviations
- AcCa
Acylcarnitine
- AIF
All-ion fragmentation
- BEH
Ethylene bridged hybrid
- CE
Cholesterol ester
- Cer
Ceramide
- ddMS2
Data-dependent tandem mass spectrometry
- DG
Diglyceride
- DMPE
Dimethyl-phosphatidylethanolamine
- FDR
False discovery rate
- FFA
Free fatty acid
- GalCer
Galactosylceramide
- GlcCer
Glucosylceramide
- GPL
Glycerophospholipid
- CerG1
Glycoceramide
- HESI
Heated electrospray ionization
- HRMS
High resolution mass spectrometry
- LPA
Lysophosphatidic acid
- LPC
Lysophosphatidylcholine
- LPE
Lysophosphatidylethanolamine
- LPL
Lysophospholipid
- LSM
Lysosphingomyelin
- MG
Monoglyceride
- Ox
Oxidized
- PA
Phosphatidic acid
- PC
Phosphatidylcholine
- PCA
Principle components analysis
- PE
Phosphatidylethanolamine
- PG
Phosphatidylglycerol
- PI
Phosphatidylinositol
- PS
Phosphatidylserine
- SM
Sphingomyelin
- TG
Triglyceride
- UHPLC
Ultra-high performance liquid chromatography
Footnotes
Compliance with ethical standards
Conflict of interest Jeremy P. Koelmel declares no conflict of interest, Candice Z. Ulmer declares no conflict of interest, Susan Fogelson declares no conflict of interest, Christina M. Jones declares no conflict of interest, Hannes Botha declares no conflict of interest, Jacqueline T. Bangma declares no conflict of interest, Theresa C. Guillette declares no conflict of interest, Wilmien J. Luus-Powell declares no conflict of interest, Joseph R. Sara declares no conflict of interest, Willem J. Smit declares no conflict of interest, Korin Albert declares no conflict of interest, Harmony A. Miller declares no conflict of interest, Matthew P. Guillette declares no conflict of interest, Berkley C. Olsen declares no conflict of interest, Jason A. Cochran declares no conflict of interest, Timothy J. Garrett declares no conflict of interest, Richard A. Yost declares no conflict of interest, and John A. Bowden declares no conflict of interest.
Ethical guidelines All applicable international, national, and/or institutional guidelines for the care and use of animals were followed.
Software availability statement: All “in-house” software used and/or developed during this study are available at: http://secim.ufl.edu/secim-tools/.
Disclaimer Certain commercial equipment or instruments are identified in the paper to specify adequately the experimental procedures. Such identification does not imply recommendations or endorsement by NIST; nor does it imply that the equipment or instruments are the best available for the purpose. Any opinion, finding and conclusion or recommendation expressed in this material is that of the author(s) and the NRF does not accept any liability in this regard.
Electronic supplementary material The online version of this article (https://doi.org/10.1007/s11306-019-1490-9) contains supplementary material, which is available to authorized users.
Data availability
The lipidomics .raw files, normalized feature tables, and metadata reported in this paper are available via the National Institute for Health’s (NIH) metabolomics workbench: (http://www.metabolomicsworkbench.org/data/DRCCStudySummary.php) under ST001052 (plasma samples) and ST001059 (tissue samples).
References
- Adlouni HA, Katrib K, & Férard G. (1988). Changes in carnitine in polymorphonuclear leukocytes, mononuclear cells, and plasma from patients with inflammatory disorders. Clinical Chemistry, 34(1), 40–43. [PubMed] [Google Scholar]
- Albergamo A, Rigano F, Purcaro G, Mauceri A, Fasulo S, & Mondello L. (2016). Free fatty acid profiling of marine sentinels by nanoLC-EI-MS for the assessment of environmental pollution effects. Science of The Total Environment, 571, 955–962. 10.1016/j.scitotenv.2016.07.082. [DOI] [PubMed] [Google Scholar]
- Benjamini Y, & Hochberg Y. (1995). Controlling the false discovery rate: A practical and powerful approach to multiple testing. Journal of the Royal Statistical Society. Series B (Methodological), 57(1), 289–300. [Google Scholar]
- Blanksby SJ, & Mitchell TW (2010). Advances in mass spectrometry for lipidomics. Annual Review of Analytical Chemistry, 3(1), 433–465. 10.1146/annurev.anchem.111808.073705. [DOI] [PubMed] [Google Scholar]
- Bligh EG, & Dyer WJ (1959). A rapid method of total lipid extraction and purification. Canadian Journal of Biochemistry and Physiology, 37(8), 911–917. 10.1139/059-099. [DOI] [PubMed] [Google Scholar]
- Bodennec J, Brichon G, Koul O, Portoukalian J, & Zwingelstein G. (2000). Differential labelling of sphingolipids by [3H] serine and ([3H]methyl)-methionine in fish leukocytes. Comparative Biochemistry and Physiology. Part B, Biochemistry & Molecular Biology, 125(4), 523–531. [DOI] [PubMed] [Google Scholar]
- Bodennec J, Zwingelstein G, Koul O, Brichon G, & Portoukalian J. (1998). Phytosphingosine biosynthesis differs from sphingosine in fish leukocytes and involves a transfer of methyl groups from [3H-methyl]methionine precursor. Biochemical and Biophysical Research Communications, 250(1), 88–93. 10.1006/bbrc.1998.9273. [DOI] [PubMed] [Google Scholar]
- Bowden JA, Cantu TM, Chapman RW, Somerville SE, Guillette MP, Botha H, et al. (2016). Predictive blood chemistry parameters for pansteatitis-affected mozambique tilapia (Oreochromis mossambicus). PLoS ONE, 11(4). 10.1371/journal.pone.0153874. [DOI] [PMC free article] [PubMed] [Google Scholar]
- Costas B, Aragão C, Ruiz-Jarabo I, Vargas-Chacoff L, Arjona FJ, Dinis MT, et al. (2011). Feed deprivation in Senegalese sole (Solea senegalensis Kaup, 1858) juveniles: effects on blood plasma metabolites and free amino acid levels. Fish Physiology and Biochemistry, 37(3), 495–504. 10.1007/s10695-010-9451-2. [DOI] [PubMed] [Google Scholar]
- Dabrowski J, Hall G, Lübcker N, Oberholster PJ, Phillips DL, & Woodborne S. (2014). Piscivory does not cause pansteatitis (yellow fat disease) in Oreochromis mossambicus from an African subtropical reservoir. Freshwater Biology, 59(7), 1484–1496. 10.1111/fwb.12360. [DOI] [Google Scholar]
- Dabrowski J, Oberholster PJ, Dabrowski JM, Le Brasseur J, & Gieskes J. (2013). Chemical characteristics and limnology of Loskop Dam on the Olifants River (South Africa), in light of recent fish and crocodile mortalities. Water SA, 39(5), 675–686. [Google Scholar]
- Dabrowski JM, & de Klerk LP (2013). An assessment of the impact of different land use activities on water quality in the upper Olifants River catchment. Water SA, 39(2), 231–244. [Google Scholar]
- Dennis EA, Deems RA, Harkewicz R, Quehenberger O, Brown HA, Milne SB, et al. (2010). A mouse macrophage lipidome. The Journal of Biological Chemistry, 285(51), 39976–39985. 10.1074/jbc.M110.182915. [DOI] [PMC free article] [PubMed] [Google Scholar]
- Engelmann B. (2004). Plasmalogens: targets for oxidants and major lipophilic antioxidants. Biochemical Society Transactions, 32(1), 147–150. 10.1042/bst0320147. [DOI] [PubMed] [Google Scholar]
- Folch J, Lees M, & Sloane Stanley GH (1957). A simple method for the isolation and purification of total lipides from animal tissues. The Journal of Biological Chemistry, 226(1), 497–509. [PubMed] [Google Scholar]
- Huchzermeyer DA (2012). Prevalence of pansteatitis in African sharptooth catfish, Clarias gariepinus (Burchell), in the Kruger National Park, South Africa. Journal of the South African Veterinary Association, 83(1), 916. [DOI] [PubMed] [Google Scholar]
- Huchzermeyer KDA, Govender D, Pienaar DJ, & Deacon AR (2011). Steatitis in wild sharptooth catfish, Clarias gariepinus (Burchell), in the Olifants and lower Letaba Rivers in the Kruger National Park, South Africa. Journal of Fish Diseases, 34(7), 489–498. 10.1111/j.1365-2761.2011.01267.x. [DOI] [PubMed] [Google Scholar]
- Huchzermeyer KDA, Osthoff G, Hugo A, & Govender D. (2013). Comparison of the lipid properties of healthy and pansteatitis-affected African sharptooth catfish, Clarias gariepinus (Burchell), and the role of diet in pansteatitis outbreaks in the Olifants River in the Kruger National Park, South Africa. Journal of Fish Diseases, 36(11), 897–909. 10.1111/jfd.12010. [DOI] [PubMed] [Google Scholar]
- Ivanova PT, Milne SB, & Brown HA (2010). Identification of atypical ether-linked glycerophospholipid species in macrophages by mass spectrometry. Journal of Lipid Research, 51(6), 1581–1590. 10.1194/jlr.D003715. [DOI] [PMC free article] [PubMed] [Google Scholar]
- Johnson AR, Milner JJ, & Makowski L. (2012). The inflammation highway: metabolism accelerates inflammatory traffic in obesity. Immunological Reviews, 249(1), 218–238. 10.1111/j.1600-065X.2012.01151.x. [DOI] [PMC free article] [PubMed] [Google Scholar]
- Jooste A, Marr SM, Addo-Bediako A, & Luus-Powell WJ (2015). Sharptooth catfish shows its metal: A case study of metal contamination at two impoundments in the Olifants River, Limpopo river system, South Africa. Ecotoxicology and Environmental Safety, 112, 96–104. 10.1016/j.ecoenv.2014.10.033. [DOI] [PubMed] [Google Scholar]
- Jurowski K, Kochan K, Walczak J, Barańska M, Piekoszewski W, & Buszewski B. (2017). Analytical techniques in lipidomics: State of the art. Critical Reviews in Analytical Chemistry, 47(5), 418–437. 10.1080/10408347.2017.1310613. [DOI] [PubMed] [Google Scholar]
- Koelmel JP, Kroeger NM, Gill EL, Ulmer CZ, Bowden JA, Patterson RE, et al. (2017). Expanding lipidome coverage using LC-MS/MS data-dependent acquisition with automated exclusion list generation. Journal of the American Society for Mass Spectrometry, 28(5), 908–917. 10.1007/s13361-017-1608-0. [DOI] [PMC free article] [PubMed] [Google Scholar]
- Koelmel JP, Kroeger NM, Ulmer CZ, Bowden JA, Patterson RE, Cochran JA, et al. (2017). LipidMatch: An automated workflow for rule-based lipid identification using untargeted high-resolution tandem mass spectrometry data. BMC Bioinformatics. 10.1186/s12859-017-1744-3. [DOI] [PMC free article] [PubMed] [Google Scholar]
- Lane EP, Huchzermeyer FW, Govender D, Bengis RG, Buss PE, Hofmeyr M, et al. (2013). Pansteatitis of unknown etiology associated with large-scale Nile crocodile (Crocodylus niloticus) mortality in Kruger National Park, South Africa: pathologic findings. Journal of Zoo and Wildlife Medicine: Official Publication of the American Association of Zoo Veterinarians, 44(4), 899– 910. 10.1638/2012-0264R.1. [DOI] [PubMed] [Google Scholar]
- Christie WW (2017). LIPID MAPS Lipidomics Gateway. Lipidomics Update http://www.lipidmaps.org/lipidmatters/blog.html. Accessed 5 May 2018.
- Maceyka M, & Spiegel S. (2014). Sphingolipid metabolites in inflammatory disease. Nature, 510(7503), 58–67. 10.1038/nature13475. [DOI] [PMC free article] [PubMed] [Google Scholar]
- Mayzaud P, Lacombre S, & Boutoute M. (2011). Seasonal and growth stage changes in lipid and fatty acid composition in the multigeneration copepod Drepanopus pectinatus from Iles Kerguelen. Antarctic Science, 23(1), 3–17. 10.1017/S0954102010000519. [DOI] [Google Scholar]
- Mullen TD, & Obeid LM (2012). Ceramide and apoptosis: exploring the enigmatic connections between sphingolipid metabolism and programmed cell death. Anti-Cancer Agents in Medicinal Chemistry, 12(4), 340–363. [DOI] [PubMed] [Google Scholar]
- Osthoff G, Hugo A, Bouwman H, Buss P, Govender D, Joubert CC, & Swarts JC (2010). Comparison of the lipid properties of captive, healthy wild, and pansteatitis-affected wild Nile crocodiles (Crocodylus niloticus). Comparative Biochemistry and Physiology. Part A, Molecular & Integrative Physiology, 155(1), 64–69. 10.1016/j.cbpa.2009.09.025. [DOI] [PubMed] [Google Scholar]
- Patterson RE, Kirpich AS, Koelmel JP, Kalavalapalli S, Morse AM, Cusi K, et al. (2017). Improved experimental data processing for UHPLC–HRMS/MS lipidomics applied to nonalcoholic fatty liver disease. Metabolomics, 13(11), 142. 10.1007/s11306-017-1280-1. [DOI] [Google Scholar]
- Pérez-Jiménez A, Guedes MJ, Morales AE, & Oliva-Teles A. (2007). Metabolic responses to short starvation and refeeding in Dicentrarchus labrax. Effect of dietary composition. Aquaculture, 265(1), 325–335. 10.1016/j.aquaculture.2007.01.021. [DOI] [Google Scholar]
- R Development Core Team. (2016). R: A Language and Environment for Statistical Computing. Vienna: R Foundation for Statistical Computing. [Google Scholar]
- Rocchetta I, Pasquevich MY, Heras H, Ríos de Molina M. del C, & Luquet CM (2014). Effects of sewage discharges on lipid and fatty acid composition of the Patagonian bivalve Diplodon chilensis. Marine Pollution Bulletin, 79(1), 211–219. 10.1016/j.marpolbul.2013.12.011. [DOI] [PubMed] [Google Scholar]
- Sampey BP, Freemerman AJ, Zhang J, Kuan P-F, Galanko JA, O’Connell TM, et al. (2012). Metabolomic profiling reveals mitochondrial-derived lipid biomarkers that drive obesity-associated inflammation. PLOS One, 7(6), e38812. 10.1371/journal.pone.0038812. [DOI] [PMC free article] [PubMed] [Google Scholar]
- Schmerler D, Neugebauer S, Ludewig K, Bremer-Streck S, Brunkhorst FM, & Kiehntopf M. (2012). Targeted Metabolomics for discrimination of systemic inflammatory disorders in critically ill patients. Journal of Lipid Research, jlr.P023309. 10.1194/jlr.P023309. [DOI] [PMC free article] [PubMed] [Google Scholar]
- Sethi S, & Brietzke E. (2017). Recent advances in lipidomics: Analytical and clinical perspectives. Prostaglandins & Other Lipid Mediators, 128–129, 8–16. 10.1016/j.prostaglandins.2016.12.002. [DOI] [PubMed] [Google Scholar]
- Stephenson DJ, Hoeferlin LA, & Chalfant CE (2017). Lipidomics in translational research and the clinical significance of lipid-based biomarkers. Translational Research: The Journal of Laboratory and Clinical Medicine, 189, 13–29. 10.1016/j.trsl.2017.06.006. [DOI] [PMC free article] [PubMed] [Google Scholar]
- Sumner LW, Amberg A, Barrett D, Beale MH, Beger R, Daykin CA, et al. (2007). Proposed minimum reporting standards for chemical analysis Chemical Analysis Working Group (CAWG) Metabolomics Standards Initiative (MSI). Metabolomics: Official Journal of the Metabolomic Society, 3(3), 211–221. 10.1007/s11306-007-0082-2. [DOI] [PMC free article] [PubMed] [Google Scholar]
- Truter JC, van Wyk JH, Oberholster PJ, Botha A-M, & Luus-Powell WJ (2016). The expression of selected genes linked to metabolic homeostasis in obese pansteatitis-suffering Mozambique tilapia, Oreochromis mossambicus (Peters). Journal of Fish Diseases, 39(1), 69–85. 10.1111/jfd.12324. [DOI] [PubMed] [Google Scholar]
- Wetzel DL, Reynolds JE, Sprinkel JM, Schwacke L, Mercurio P, & Rommel SA (2010). Fatty acid profiles as a potential lipidomic biomarker of exposure to brevetoxin for endangered Florida manatees (Trichechus manatus latirostris). The Science of the Total Environment, 408(24), 6124–6133. 10.1016/j.scitotenv.2010.08.043. [DOI] [PubMed] [Google Scholar]
- Woodborne S, Huchzermeyer KDA, Govender D, Pienaar DJ, Hall G, Myburgh JG, et al. (2012) Ecosystem change and the Olifants River crocodile mass mortality events. Ecosphere, 3(10), art87. [Google Scholar]
- Xia J, Sinelnikov IV, Han B, & Wishart DS (2015). Metabo-Analyst 3.0—making metabolomics more meaningful. Nucleic Acids Research, 43(W1), W251–W257. 10.1093/nar/gkv380. [DOI] [PMC free article] [PubMed] [Google Scholar]
Associated Data
This section collects any data citations, data availability statements, or supplementary materials included in this article.
Supplementary Materials
Data Availability Statement
The lipidomics .raw files, normalized feature tables, and metadata reported in this paper are available via the National Institute for Health’s (NIH) metabolomics workbench: (http://www.metabolomicsworkbench.org/data/DRCCStudySummary.php) under ST001052 (plasma samples) and ST001059 (tissue samples).