

Abstract
Skin color is highly variable in Africans, yet little is known about the underlying molecular mechanism. We applied massively parallel reporter assays to screen 1,157 candidate variants influencing skin pigmentation in Africans and identified 165 SNPs showing differential regulatory activities between alleles. Combining Hi-C, CRISPR-based editing, and melanin assays, we identified regulatory elements for MFSD12, HMG20B, OCA2, MITF, LEF1, TRPS1, BLOC1S6, and CYB561A3 that impact melanin levels in vitro and modulate human skin color. We found that independent mutations in an OCA2 enhancer contribute to the evolution of human skin color diversity and detect signals of local adaptation at enhancers of MITF, LEF1 and TRPS1 which may contribute to the light skin color of southern Khoesan-speaking populations. Additionally, we identified CYB561A3 as a novel pigmentation regulator that impacts genes involved in oxidative phosphorylation and melanogenesis. These results provide insights into the mechanisms underlying human skin color diversity and adaptive evolution.
Human skin color displays remarkable diversity across different populations and is hypothesized to be an adaptation to solar ultraviolet radiation 1,2. Recent genome-wide association studies (GWAS) have shed light on the genetic basis of human skin color variation 3–12. However, there have been relatively few GWAS in ethnically diverse Africans 5,13 despite the high levels of variation in skin pigmentation in Africa. Indeed, the genetic basis and evolutionary history of skin color in the Khoesan-speaking populations from Southern Africa (San), who have the oldest genetic lineages and the most lightly pigmented skin observed in Africa 5,13, remain an enigma. Additionally, only a few of the candidate variants associated with human skin pigmentation have been thoroughly investigated through functional experiments 14–17. Furthermore, previous functional studies mainly focused on variants identified in Europeans, and the molecular mechanisms underlying skin color diversity in diverse Africans are still poorly defined 5,13.
Here, we utilized functional genomics to identify new regulatory variants and genes that influence skin pigmentation in geographically and ethnically diverse Africans. We first selected 29,419 candidate variants, comprised of 9,913 variants identified from genome-wide association studies (GWAS) of African skin color 13, and 19,553 genetic variants showing extreme allele frequency differences between the lightly pigmented Khoesan-speaking populations (San) and other darkly pigmented African populations 18. We then applied massively parallel reporter assays (MPRA)19 to measure the regulatory activities of 1,157 SNPs residing in open chromatin regions of melanocyte-derived cells and identified 165 variants with significant differential regulatory effects. Using chromosome conformation capture assays and CRISPR-based experiments, we characterized the enhancers and variants regulating the expression of genes related to pigmentation, and demonstrated their impact on melanin levels in vitro. Overall, these findings offer valuable insights into the genetic basis of skin pigmentation in African populations.
Results
Identification of candidate regulatory variants impacting skin color
To identify SNPs associated with skin pigmentation in Africa, we first performed genome-wide association studies (GWAS) of skin color using imputed dataset from 1544 eastern and southern African individuals 13 (GWAS-All, Supplementary Fig. 1, Supplementary Table 1 and Supplementary Note 1) or a subset of 500 individuals form Botswana (GWAS-Bots, Supplementary Fig. 2 and Supplementary Table 2). We further identified SNPs with significant allele frequency differences in the lightly pigmented southern African San compared to other darkly pigmented African populations based on the Di statistic 18,20 (Di-SNPs, Supplementary Fig. 3 and Supplementary Note 2), which may be enriched for SNPs that are targets of local adaptation and impact the light skin color of the San. To identify variants that may impact enhancer activity, we overlapped the top GWAS-SNPs and Di-SNPs with open chromatin regions from melanocyte-derived cell lines (Fig. 1a and Methods). After filtering, we obtained a total of 1157 SNPs for MPRA, including 340 GWAS-All SNPs, 289 GWAS-Bots SNPs, and 536 Di-SNPs (Fig. 1a).
Fig. 1: Massively parallel screening of genetic variants associated with African skin pigmentation.
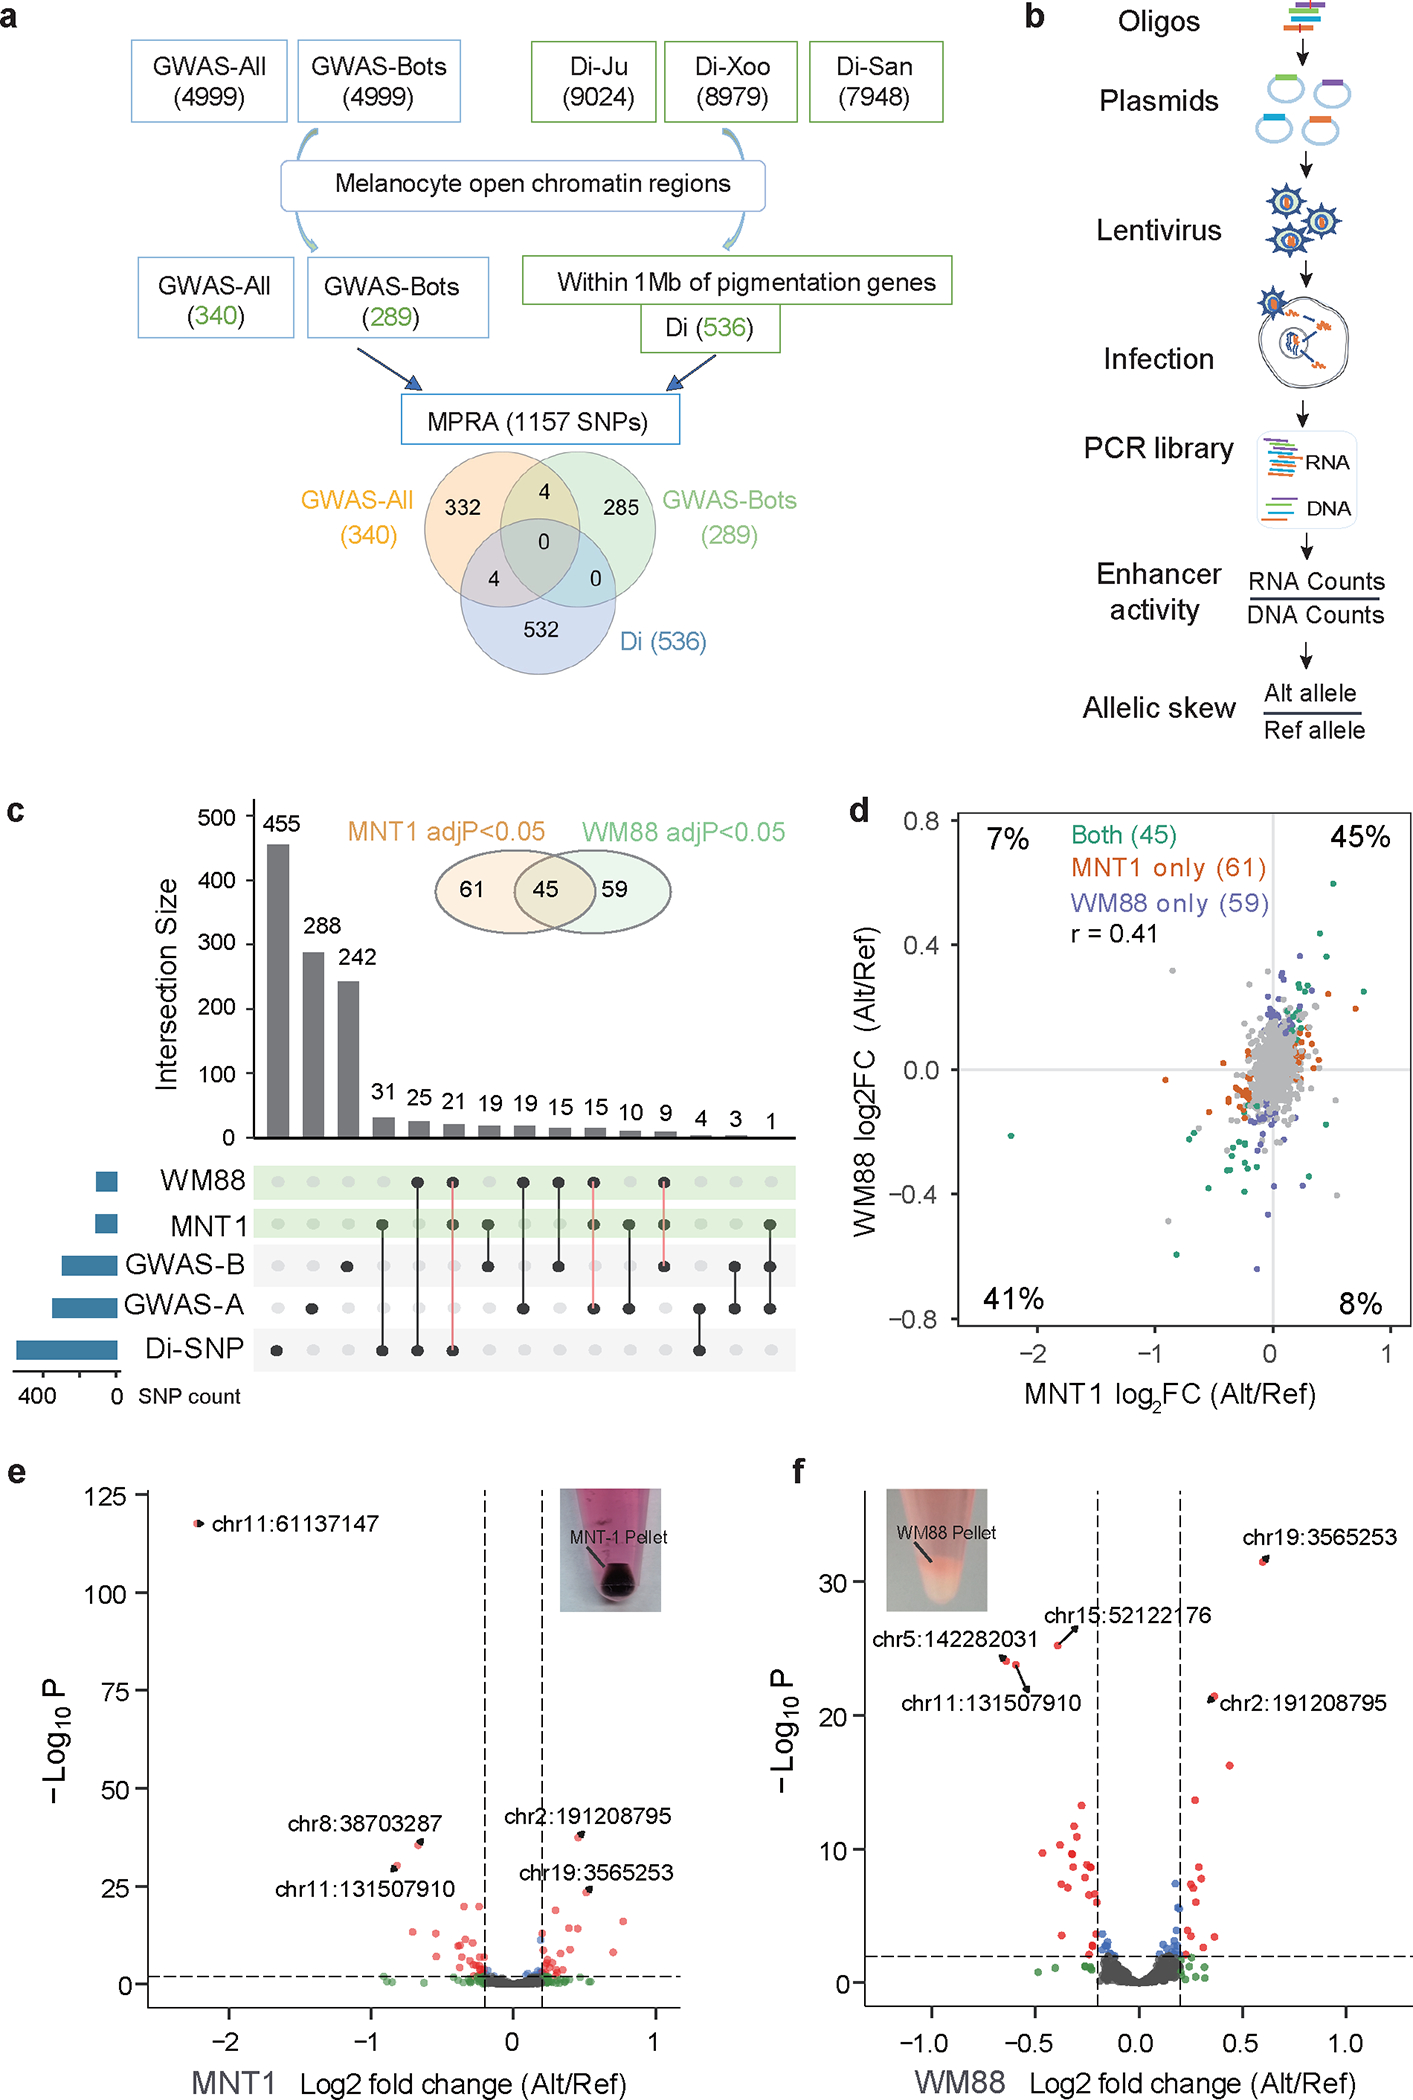
(a) Selection of candidate regulatory variants. GWAS-All, top 4999 SNPs from GWAS of skin pigmentation in Africans (p < 2.3×10⁻⁴); GWAS-Bots, top 4999 SNPs from GWAS of skin pigmentation in Botswana (p < 1.7×10⁻⁴); Di-Ju are top 0.1% Di-SNPs from the Ju|hoansi versus other populations without inclusion of the !Xoo; Di-Xoo are top 0.1% Di-SNPs from the !Xoo versus other populations without inclusion of the Ju|hoansi; Di-San are top 0.1% Di-SNPs from the Ju|hoansi and the !Xoo versus other populations. (b) Schematic of lentiMPRA workflow. (c) Upset plot showing the intersections of significant allelic skewed variants from GWAS and Di analysis in MNT-1 and WM88. Alleles with significant differential regulatory activities (adjusted p-value < 0.05) in both MNT-1 and WM88 are highlighted with orange solid lines. GWAS_A represents GWAS-All; GWAS_B represents GWAS-Bots. (d) Comparison of allelic skews in two melanoma cell lines (MNT-1 and WM88). The percentages are defined by the number of SNPs in each quadrant / total number of SNPs. Alleles with significant differential regulatory activities (adjusted p-value < 0.05) in both cell lines (green), MNT-1 (orange), and WM88 (blue) are highlighted. Nonsignificant alleles are colored in gray. The correlation of allelic skews in MNT-1 and WM88 is estimated by Pearson’s r = 0.41, p = 2.6×10−46. (e-f) Volcano plots showing allelic skewed variants in MNT-1 and WM88. Allelic skew is defined as the log2 fold change of the enhancer activity between the alternative and reference alleles (reference alleles match the genome hg19). The location of the top 5 SNPs based on the hg19 reference genome are highlighted. Pictures of the cell pellets of MNT-1 and WM88 showing that MNT-1 are darkly pigmented and WM88 are near non-pigmented.
We applied MPRA to screen for enhancer elements and identify SNPs with variants that show significant differential regulatory activity (Methods, Supplementary Notes. 3 and 4). Specifically, we constructed a MPRA library using synthesized 200-bp oligos centered on each of the two alleles of the 1157 candidate SNPs, along with 150 negative control and 32 positive control oligos (Supplementary Table 3 and Extended Data Fig. 1). We used this library to perform MPRA in two melanoma cell lines: darkly pigmented MNT-1 cells and lightly pigmented WM88 cells (Fig. 1b and Supplementary Figs. 4 and 5). To identify regulatory regions in MNT-1, we conducted CUT&RUN assays using antibodies against H3K4me3, H3K27ac, MITF and SOX10 (Supplementary Fig. 6). We further performed ATAC-seq in both MNT-1 and WM88, and identified 99,718 and 118,486 open chromatin regions, respectively. We found that only 35% of ATAC-seq peaks are shared between these two cell lines (Supplementary Fig. 6b). To decipher the target genes of the candidate SNPs, we constructed a high-resolution chromatin interaction map of MNT-1 cells using Hi-C and H3K27ac HiChIP (Methods, Supplementary Note. 5 and Supplementary Figs. 7–9).
We used “mpralm” 21 to identify MPRA functional variants (MFVs), which show significant differential regulatory activity between alternative and reference alleles (“allelic skew”). Out of the 1157 tested SNPs, we identified 106 MFVs in MNT-1 and 104 MFVs in WM88, with 45 MFVs shared in both cell lines, for a total of 165 MFVs (Fig. 1c and Supplementary Table 4). Of the 165 MFVs, 77 are Di-SNPs and 88 are GWAS-SNPs (Fig. 1c), indicating that Di analysis and GWAS are complementary methods for identifying potential functional variants related to skin pigmentation. We observed a moderate correlation between the variant effect sizes in MNT-1 and WM88 (R = 0.41, p = 2.6×10−46) and 86% of the tested variants showed the same direction of allelic skew (determined by log2-fold change, log2FC) in both cell lines (Fig. 1d). Interestingly, rs7948623 (chr11:61137147) near DDB1 and rs6510760 (chr19:3565253) near MFSD12 had the largest effect size in MNT-1 and WM88, respectively (Fig. 1e and 1f), suggesting that these two GWAS SNPs may be causal variants at these loci 13. To validate the allelic skews, we performed luciferase reporter assays (LRA) on 16 MFVs. Among the 16 tested MFVs, 15 MFVs show significant allelic skew in both MPRA and LRA in at least one cell line (MNT-1 or WM88, Supplementary Table 5 and Supplementary Fig. 10). These results indicate that employing two cell lines for the MPRA may enhance the sensitivity for discovering allelic skewed variants that may show differential activity under different trans-environments.
MFSD12 and HMG20B are the target genes of rs6510760
MFSD12 facilitates organellar cysteine transport and impacts melanin levels in melanocytes 13,22. MPRA identified six GWAS MFVs (rs6510759, rs734454, rs10416746, rs7246261, rs142317543 and rs6510760) near MFSD12 that are not in LD with each other (R2 < 0.2; Extended Data Fig. 2 and Supplementary Figs. 11). The previously reported SNP rs112332856, in strong LD with rs6510760 (R2 = 0.8), showed no effect on enhancer activity. Notably, rs6510760 had the largest allelic skew in WM88 (log2FC = 0.6, p =3.4×10⁻³²) and the sixth most significant allelic skew in MNT-1 (log2FC = 0.51, p = 4×10⁻²⁴; Supplementary Table 4). In-silico analysis revealed that rs6510760 disrupts the binding motif of aryl hydrocarbon receptor (AHR) (Extended Data Fig. 2l), a vital transcription factor involved in melanogenesis 23.
We validated the allelic enhancer activities of four SNPs overlapping regulatory elements upstream of MFSD12 (rs734454, rs10416746, rs6510760 and rs7246261) using LRA. We found all four SNPs to have significant allelic skew in at least one of the cell lines (Extended Data Fig. 2 and Supplementary Table 5) and all of them are expression quantitative trait loci (eQTLs) of MFSD12 based on GTEx data (Supplementary Fig. 12). SNPs rs6510760 and rs7246261 in enhancer 4 (E4) are 104 bp apart but not in LD. We explored their combinatorial effects (GC, AC, GT and AT) using LRA. The derived haplotype AT, associated with dark skin color, exhibits reduced enhancer activity compared to the GC haplotype (Supplementary Fig. 13). The results suggests that rs6510760 is the major regulator of enhancer activity, while rs7246261 only has marginal additive effects.
We further applied Hi-C and CRISPR experiments to identify the target genes of rs6510760. Hi-C showed interactions between E4 and the promoters of MFSD12 and HMG20B genes (Extended Data Fig. 3a and 3b, Supplementary Table 6). Compared to controls, CRISPR-inhibition (CRISPRi) of E4 significantly reduced the expression of MFSD12 and HMG20B (Extended Data Fig. 3c–3e), confirming that E4 interacts with both genes. Downregulation of MFSD12 expression slightly increased melanin levels in MNT-1 (Extended Data Fig. 3f), consistent with previous reports 13,22. CRISPR-knockout (CRISPR-KO) of E4 in MNT-1 significantly reduced the expression of MFSD12 and HMG20B (Extended Data Fig. 3g). Together, we validated that rs6510760 is the major regulatory variant affecting the activity of E4, which impacts the expression of MFSD12 and HMG20B genes and contributes to African skin color variation.
Identification of enhancers and regulatory variants near OCA2
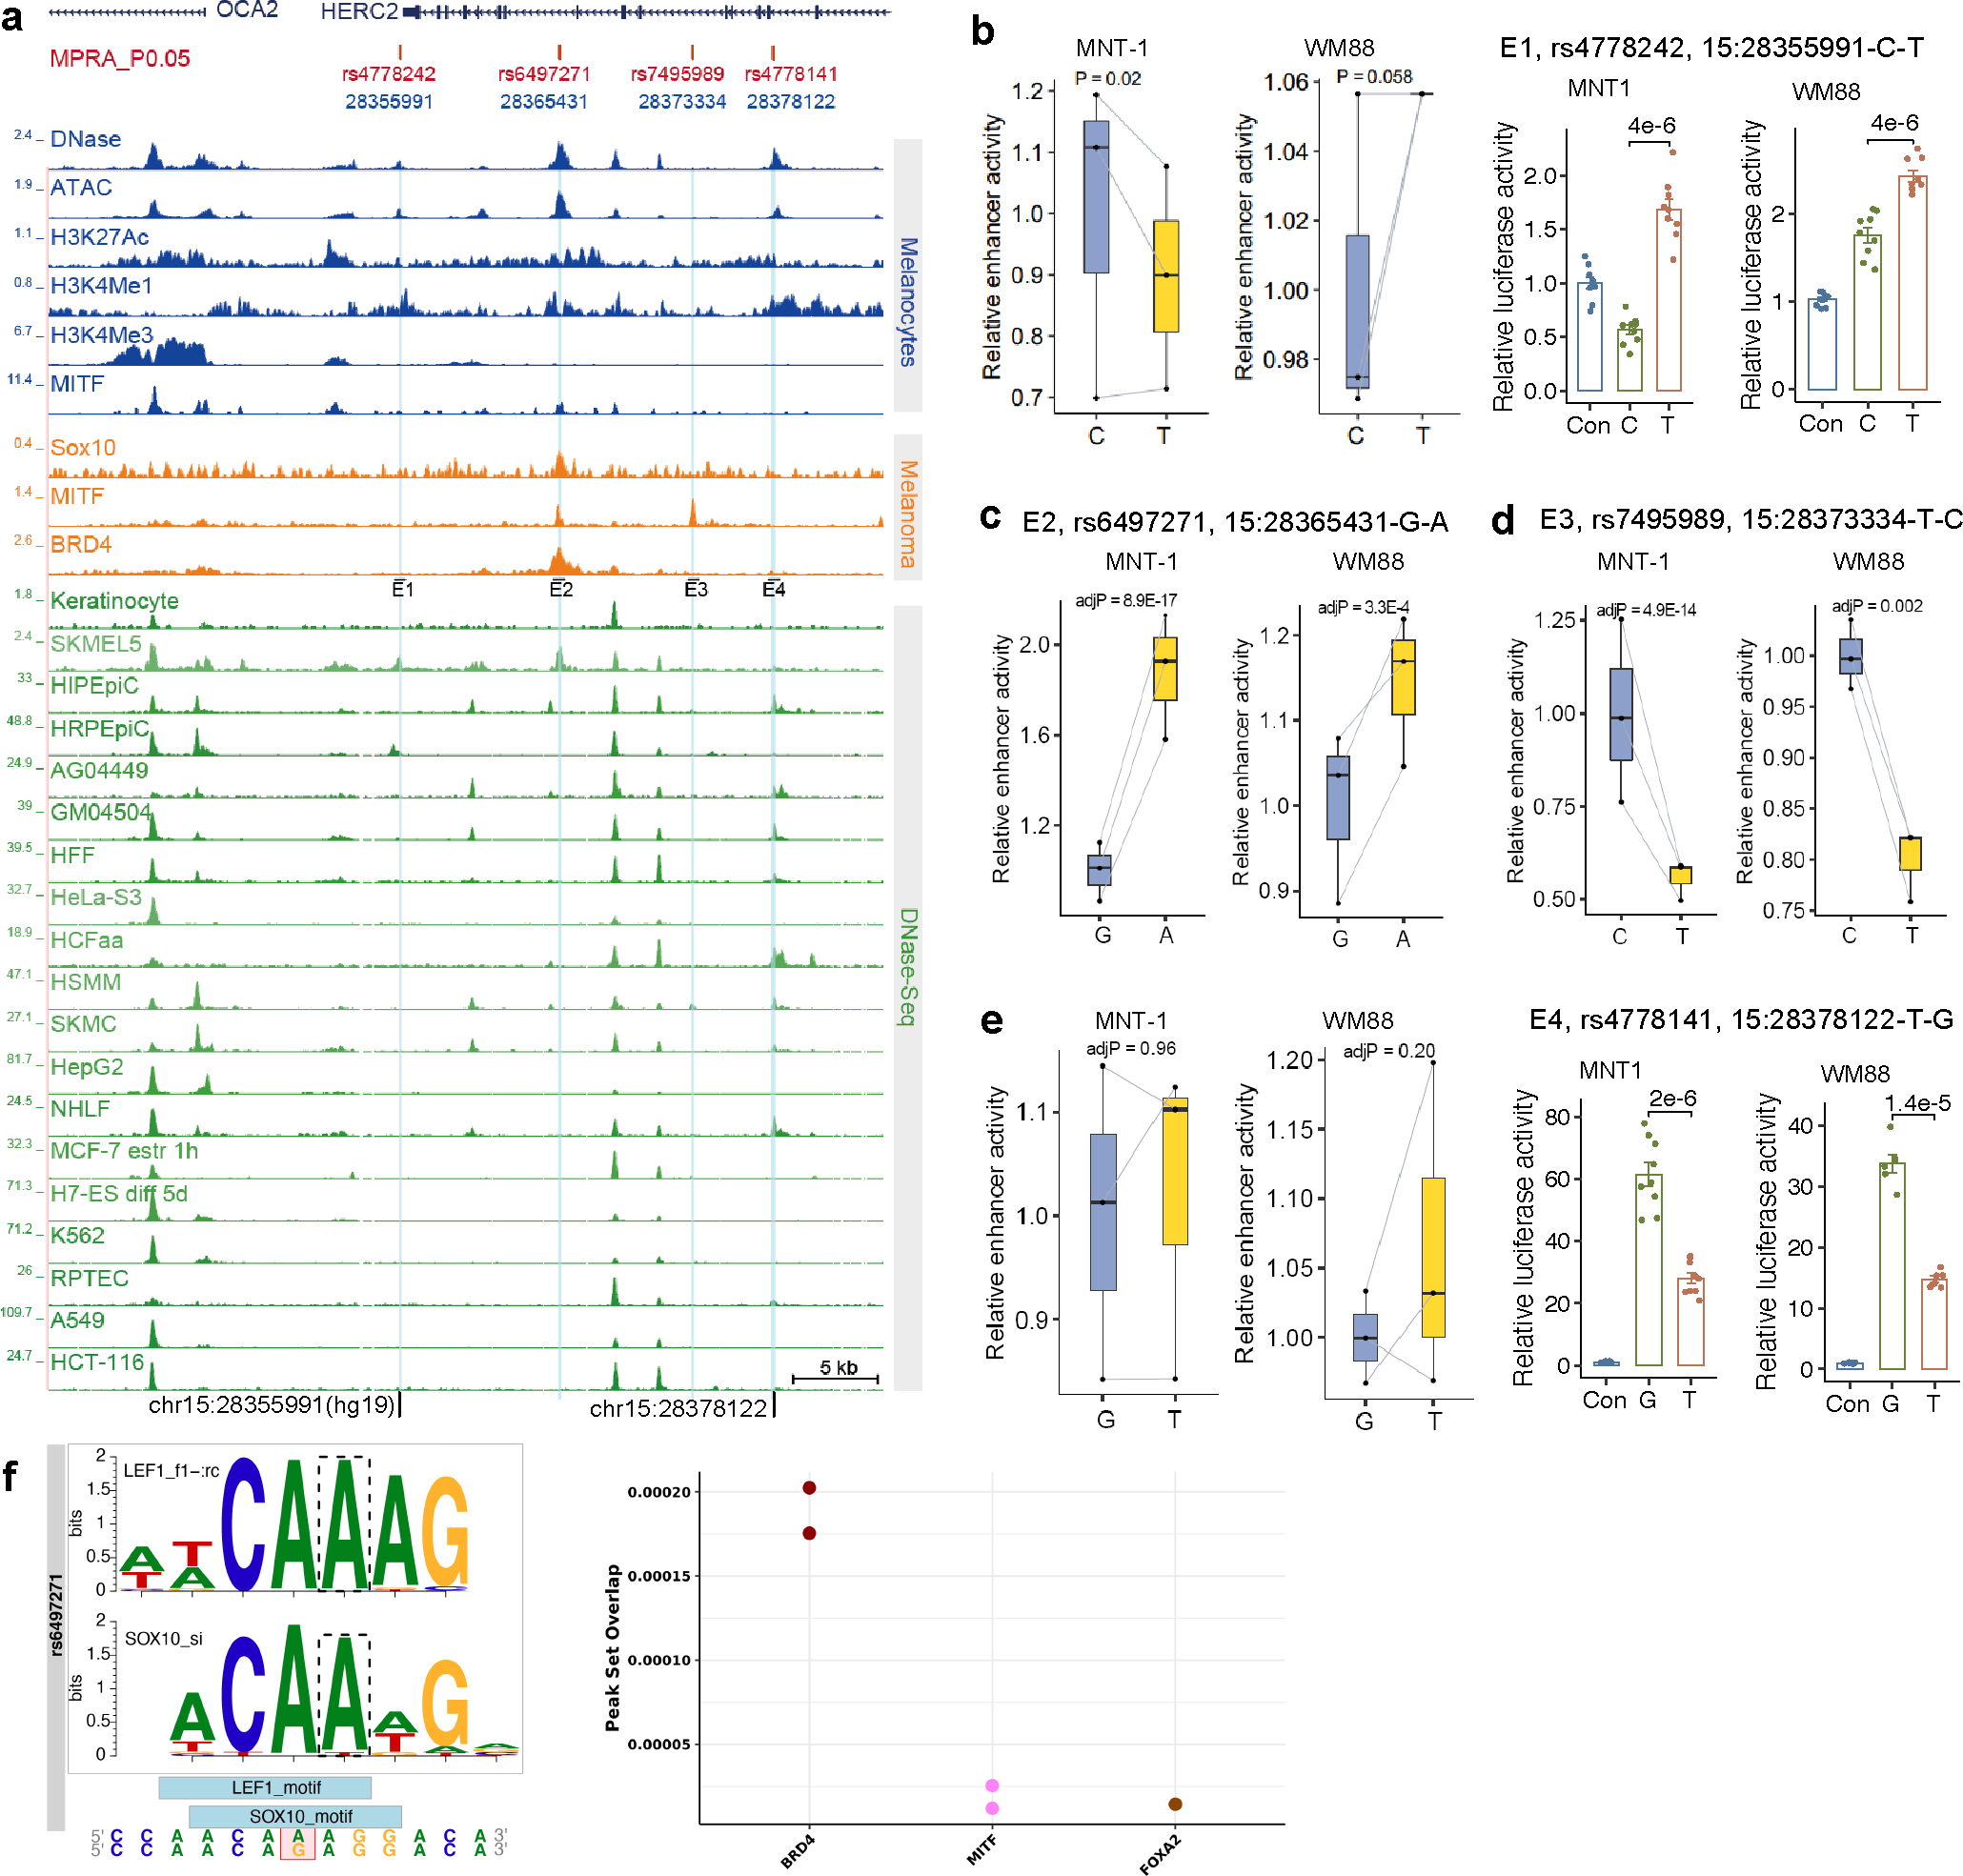
OCA2 is the causal gene for oculocutaneous albinism II, which affects human skin, hair, and eye color 8,13,24–26. We examined the regulatory activities of 10 Di-SNPs and 16 GWAS-SNPs near OCA2 using MPRA and identified 4 MFVs (rs4778242 in E1, rs6497271 in E2, rs7495989 in E3, and rs4778141 in E4) (Fig. 2a and Extended Data Fig. 4). These four MFVs showed strong associations with African skin color (p < 3.4×10⁻⁵, Fig. 2b and Supplementary Fig. 14), but were not in LD (R2 < 0.2, Supplementary Fig. 15) with the previously reported functional SNPs rs12913832 16 and rs1800404 13. Among these SNPs, rs6497271 showed the greatest allelic skew in both MNT-1 (p = 8.9×10⁻¹⁷, Fig. 2c) and WM88 (p = 3.2×10⁻⁴).
Fig. 2: rs6497271 impacts OCA2 expression and contributes to human skin color variations.
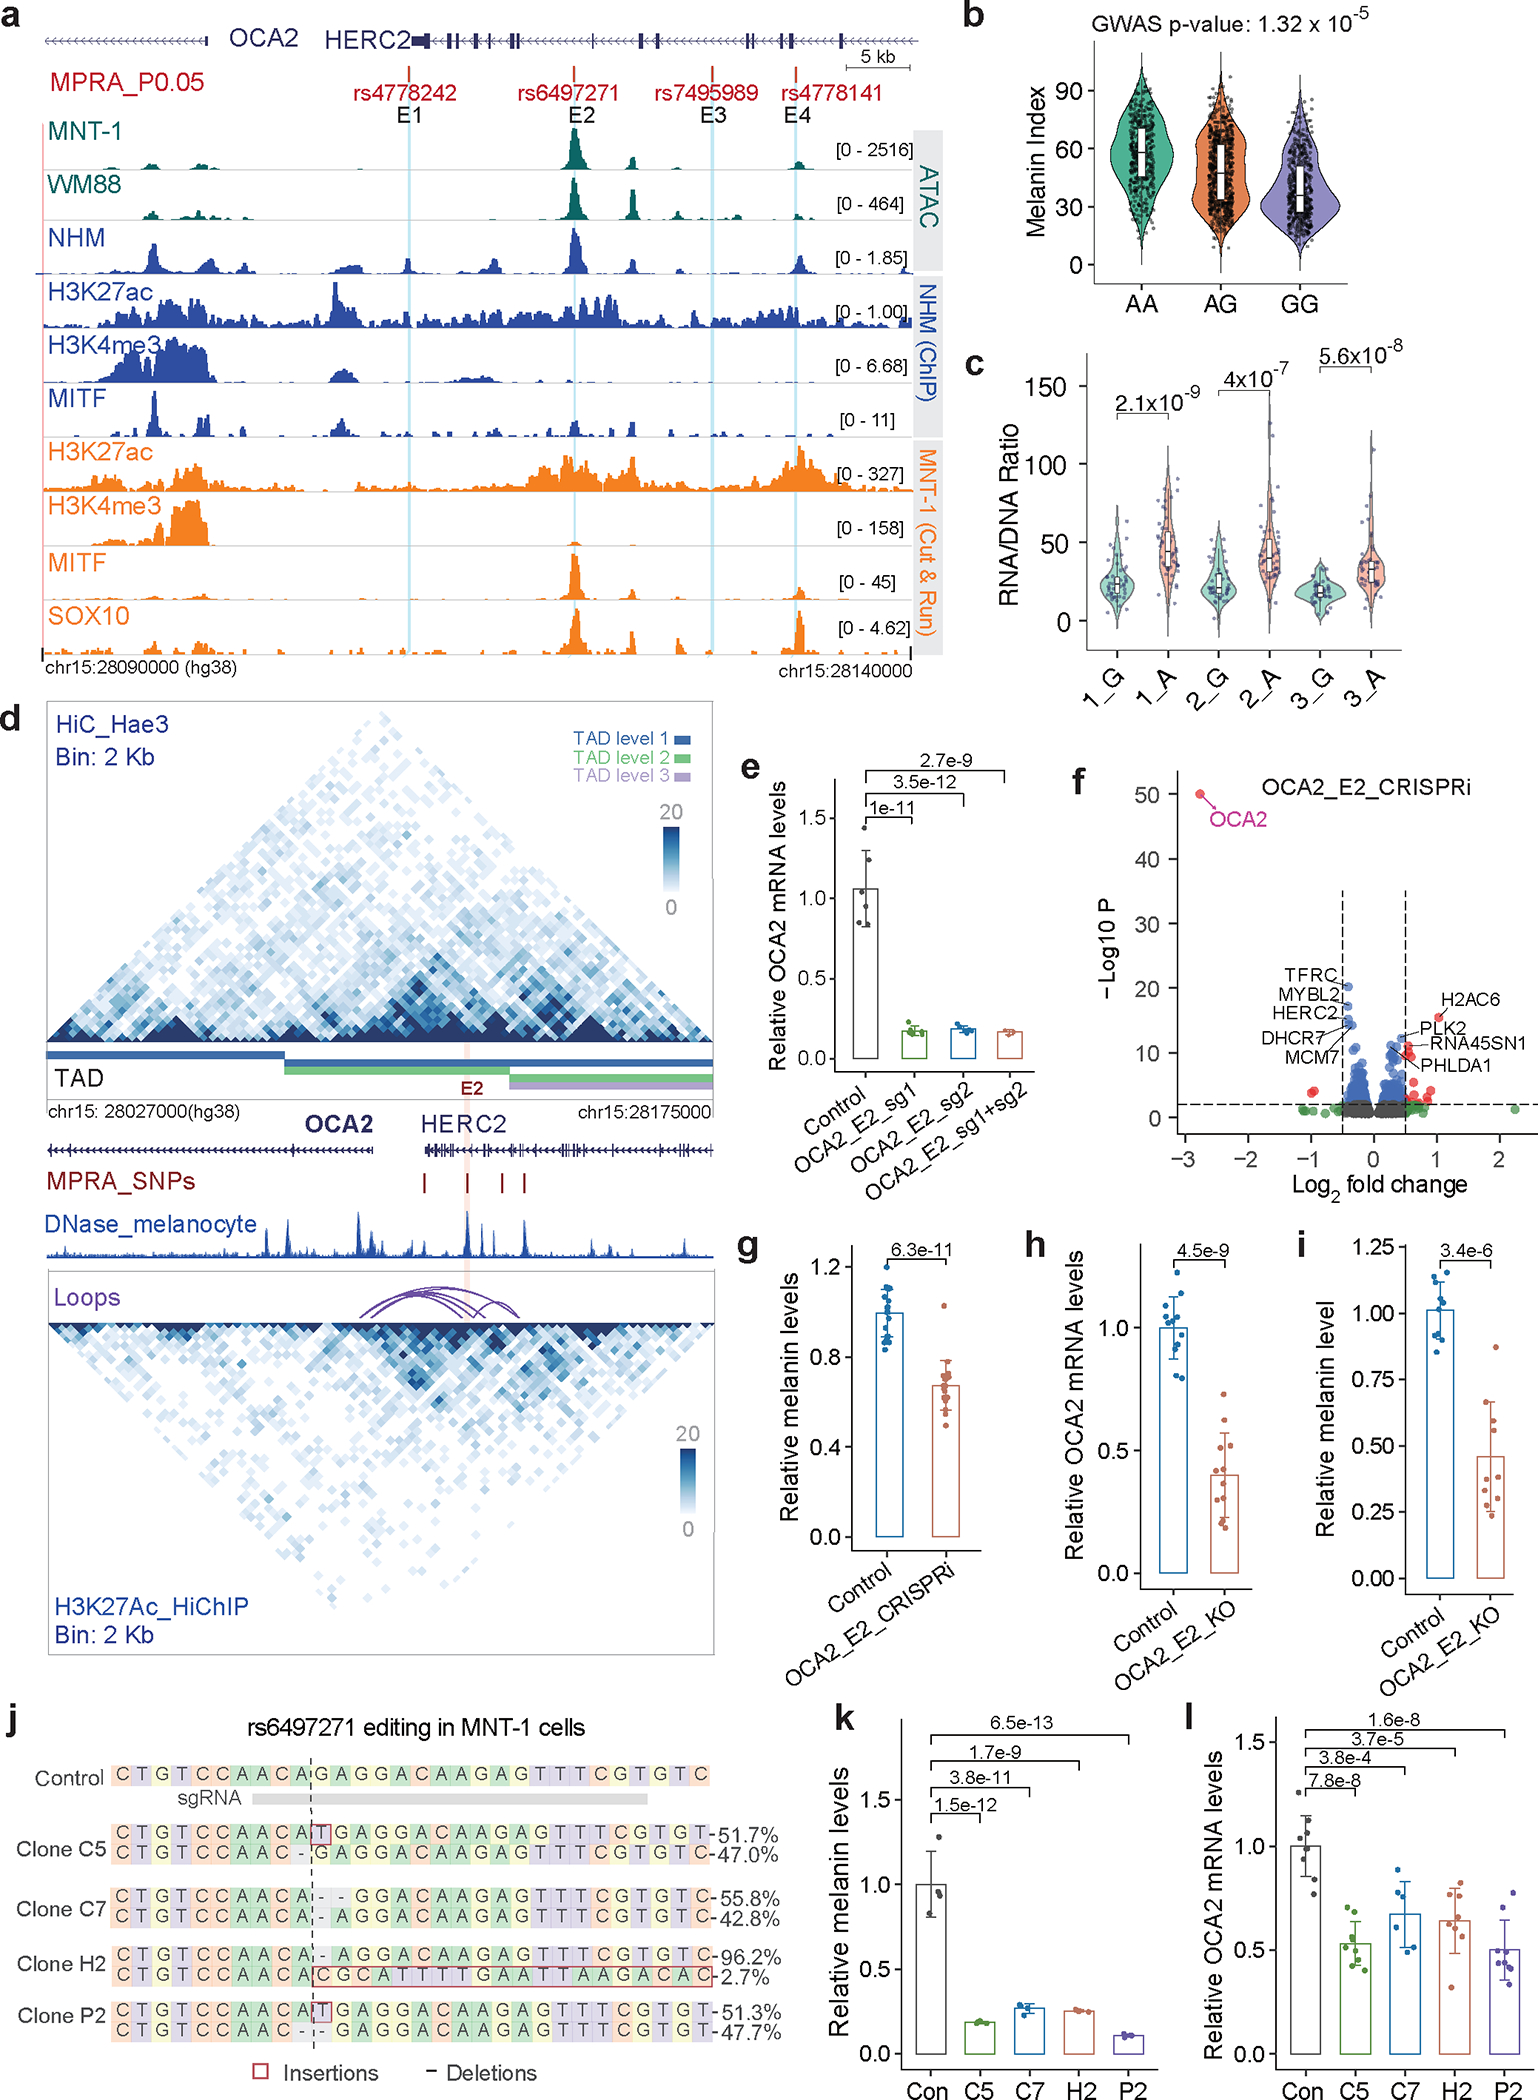
(a) MPRA identified four regulatory variants near OCA2. (b) rs6497271 is associated with African skin pigmentation (n = 1544), p-value was calculated using EPACTS “q. emmax” method. (c) MPRA showed that rs6497271 significantly changed the enhancer activities in MNT-1. Two-tailed unpaired t-tests (three biological replicates). (d) Chromatin interactions near OCA2 identified by Hi-C and H3K27ac HiChIP using Hae3 digestion. The purple arches are chromatin loops, the four vertical red lines are MFVs, the pink shadowed line represents enhancer E2. (e) qPCR showed that CRISPRi of E2 significantly reduces the expression of OCA2. CRISPRi was performed in MNT-1. Two-sided Dunnett’s test with adjustments for multiple comparisons (group OCA2_E2_sg1+sg2, n = 3; other groups, n= 6). (f) RNA-Seq data showing CRISPRi of E2 inhibits OCA2 gene expression. The p-value of OCA2 (p = 0) was set to 1×10−50 to be shown in the plot. p-values were calculated using DESeq2. (g) CRISPRi of E2 significantly reduced melanin levels. The CRISPRi was performed in MNT-1 using two sgRNAs. Two-tailed unpaired t-tests (n = 19). (h) qPCR showed that CRISPR-KO of E2 significantly decreases the expression level of OCA2. The CRISPR-KO was performed in MNT-1 using two sgRNAs. Two-tailed unpaired t-tests (n = 12). (i) CRISPR-KO of E2 significantly reduced melanin levels. Two-tailed unpaired t-tests (n = 10). (j) Genotyping of four CRISPR-edited MNT-1 clones at rs6497271. The 395bp amplicons flanking rs6497271 were amplified and sequenced using MiSeq. Top 2 genotypes in each clone are shown. (k) Mutations near rs6497271 significantly decreased melanin levels in MNT-1. Four clones were selected and compared with non-edited control cells. Two-sided Dunnett’s test with adjustments for multiple comparisons (n = 4). (l) Mutations near rs6497271 significantly reduced the expression of OCA2 in MNT-1. Two-sided Dunnett’s test with adjustments for multiple comparisons (OCA2-E2_C7, n = 6; OCA2-E2_H2, n = 8; others, n = 9). Data were presented as mean ± SEM. P values were listed above the bars. For boxplots, central lines are median, with boxes extending from the 25th to the 75th percentiles. Whiskers further extend by ±1.5 times the interquartile range from the limits of each box.
Using Hi-C 27 and H3K27ac HiChIP 28, we generated a high-resolution (2 kb) chromatin interaction map at the OCA2/HERC2 locus. We identified a TAD encompassing the OCA2 promoter and its upstream enhancer regions (Fig. 2d and Supplementary Fig. 16) and detected significant interactions between the promoter and enhancer E2 of OCA2 by FitHiChIP 29 (FDR < 0.05, Supplementary Table 6). CRISPRi of E2 caused a 20% decrease of OCA2 expression (Fig. 2e), validating the promoter-enhancer interaction. Furthermore, RNA-Seq showed that CRISPRi of E2 had a significant effect on OCA2 expression (log2FC = −2.76) but only a marginal effect on HERC2 expression (log2FC = −0.40), and it altered the expression of melanogenesis-related genes, such as DCT, PMEL, and TYRP1 (Fig. 2f and Supplementary Fig. 17). Notably, CRISPRi of E2 decreased the melanin level in MNT-1 (Fig. 2g). CRISPR-KO of E2 in MNT-1 decreased the expression of OCA2 and melanin levels by more than 50% (Figs. 2h and 2i, Supplementary Fig. 18). Together, these data highlight the strong effect of E2 on OCA2 expression.
We further conducted CRISPR/Cas9-mediated genome editing and obtained four clones with SNPs at or next to rs6497271 (Fig. 2j). Notably, all four clones show a significant reduction of OCA2 expression and melanin levels compared to control (Figs. 2k and 2l). In-silico analysis showed that rs6497271 disrupts the binding motifs of SOX10 and LEF1 (Extended Data Fig. 4f), which are key transcription factors in melanocytes. In addition, rs6497271 overlaps a SOX10 binding peak in MNT-1 (Fig. 2a). Thus, the substitution from A to G and the indels at rs6497271 may affect the binding of SOX10, reducing the enhancer activity and subsequent OCA2 expression. In addition, UKBB GWAS data 7,30 showed that rs6497271-G is associated with both light skin color and light hair color, indicating that rs6497271 has pleiotropic effects (Supplementary Fig. 19). Collectively, we identified rs6497271 at OCA2 as a major functional variant affecting human skin pigmentation.
Repeated mutation of an OCA2 enhancer during human evolution
SNP rs12913832 is a known functional variant associated with blue eye color in Europeans 16 and is 187 bp away from rs6497271. Based on 1000G 31 and 5M 13 datasets, the derived allele rs6497271-G is almost fixed (0.984) in Europeans, whereas the ancestral allele rs12913832-A is nearly fixed (0.976) in Africans (Fig. 3a). rs6497271 and rs12913832 form 4 haplotypes (AA, AG, GA, and GG) and we tested the combinatorial effects of these haplotypes using LRA. Haplotype AA showed the highest enhancer activity (75-fold of control in MNT-1); haplotypes AG and GA reduced the enhancer activity to 50–70% of AA; and haplotype GG exhibited the lowest enhancer activity (~25% of AA, Fig. 3b). Consistent with these results, haplotype AA is common in Africans (0.24–0.79) and South Asians (0.16) who have relatively dark skin color; haplotype GA is common in global populations (> 0.21) and has the highest frequency in East Asians (0.98) who have moderately pigmented skin; haplotype GG is at high frequency only in Europeans (0.64) who have light skin color (Figs. 3c and 3d). To determine when these haplotypes formed during human history, we extracted the estimated ages of these two variants from a dataset based on genealogical inference 32. The data revealed that the derived allele G at rs6497271 emerged as early as 1.2 million years ago, while the derived allele G at rs12913832 emerged about 57 thousand years ago, coinciding with the migration of modern humans out of Africa (Fig. 3e). These observations suggest that the continuous evolution of the E2 enhancer during human history contributes to current human skin color diversity.
Fig. 3: Continuing evolution of OCA2 enhancer E2 contributes to African skin pigmentation diversity.
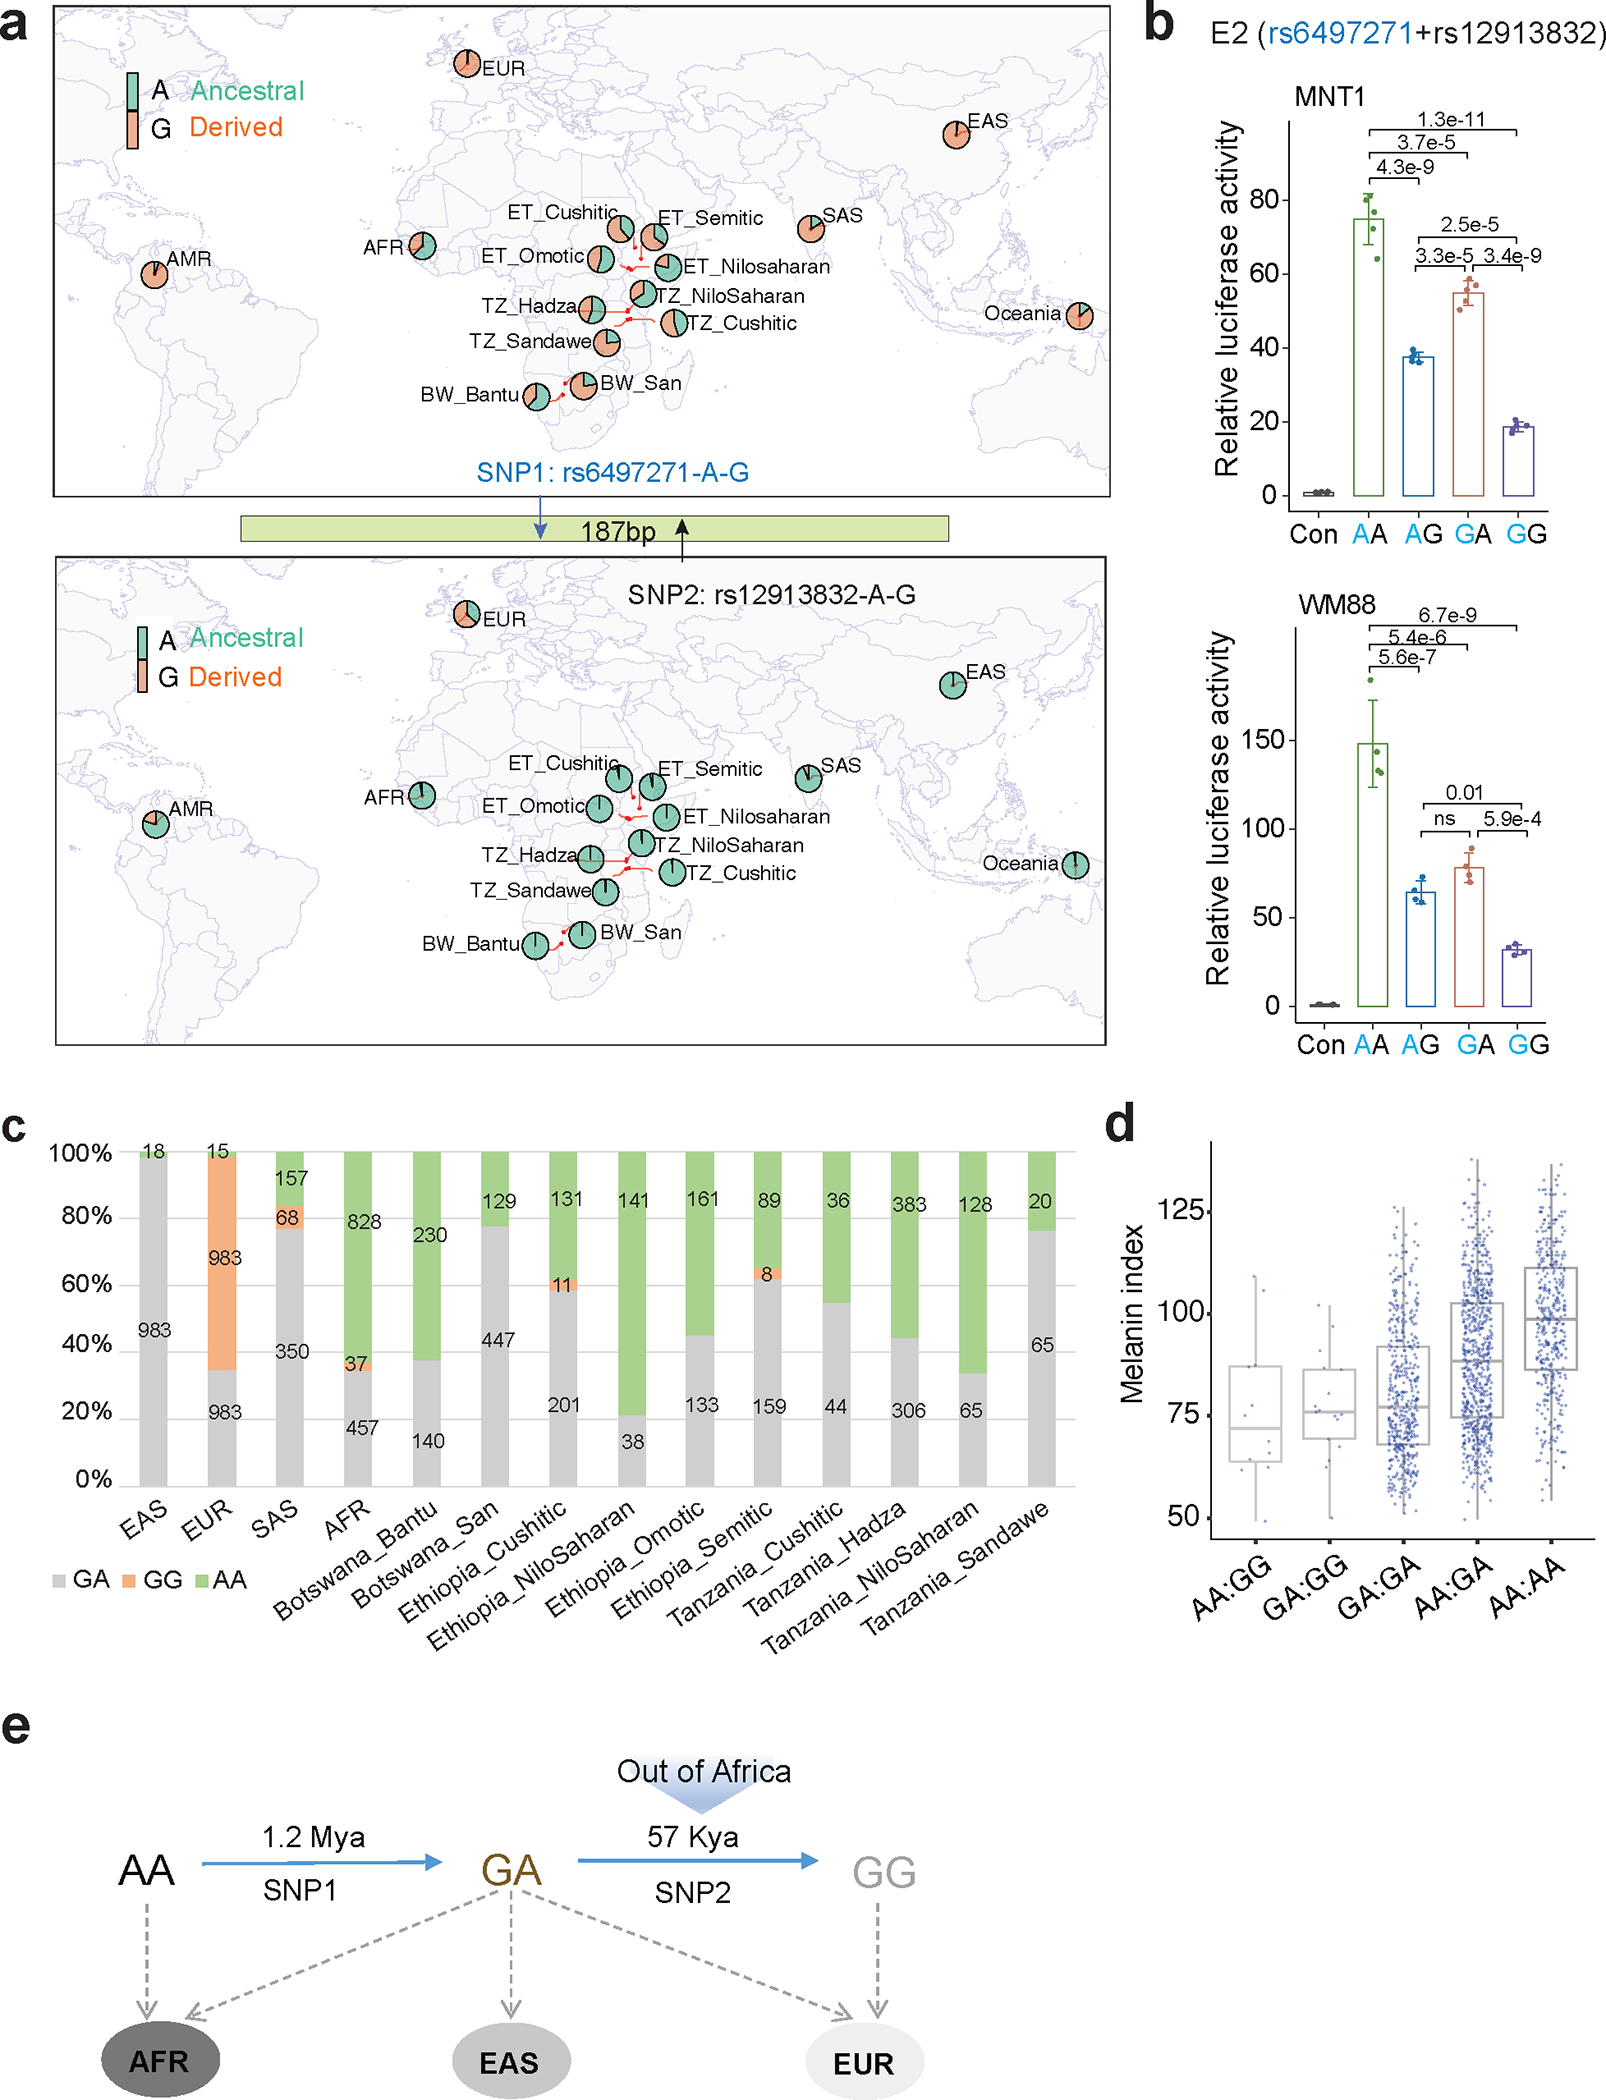
(a) Allele frequencies at rs6497271 and rs12913832 in global populations. Derived alleles are colored in orange. Data was merged from 1000G 31, African 5M 13 and SGDP 49 datasets. (b) The enhancer activities of 4 haplotypes containing rs6497271 and rs12913832 in MNT-1 and WM88 estimated by LRA. Two-sided Tukey’s test with adjustments for multiple comparisons (n = 4). Data were presented as mean ± SEM. ns p > 0.05. (c) The frequencies of haplotypes containing rs6497271 and rs12913832 in global populations. Data was merged from 1000G, African 5M array and SGDP datasets. (d) Melanin indexes of individuals with different haplotype combinations at rs6497271 and rs12913832. Data was from GWAS-All (n = 1544). (e) Estimated ages of SNP rs6497271 and rs12913832. Data was from https://human.genome.dating/. For boxplots, central lines are median, with boxes extending from the 25th to the 75th percentiles. Whiskers further extend by ±1.5 times the interquartile range from the limits of each box.
A Di-SNP in MITF contributes to light skin color in the San
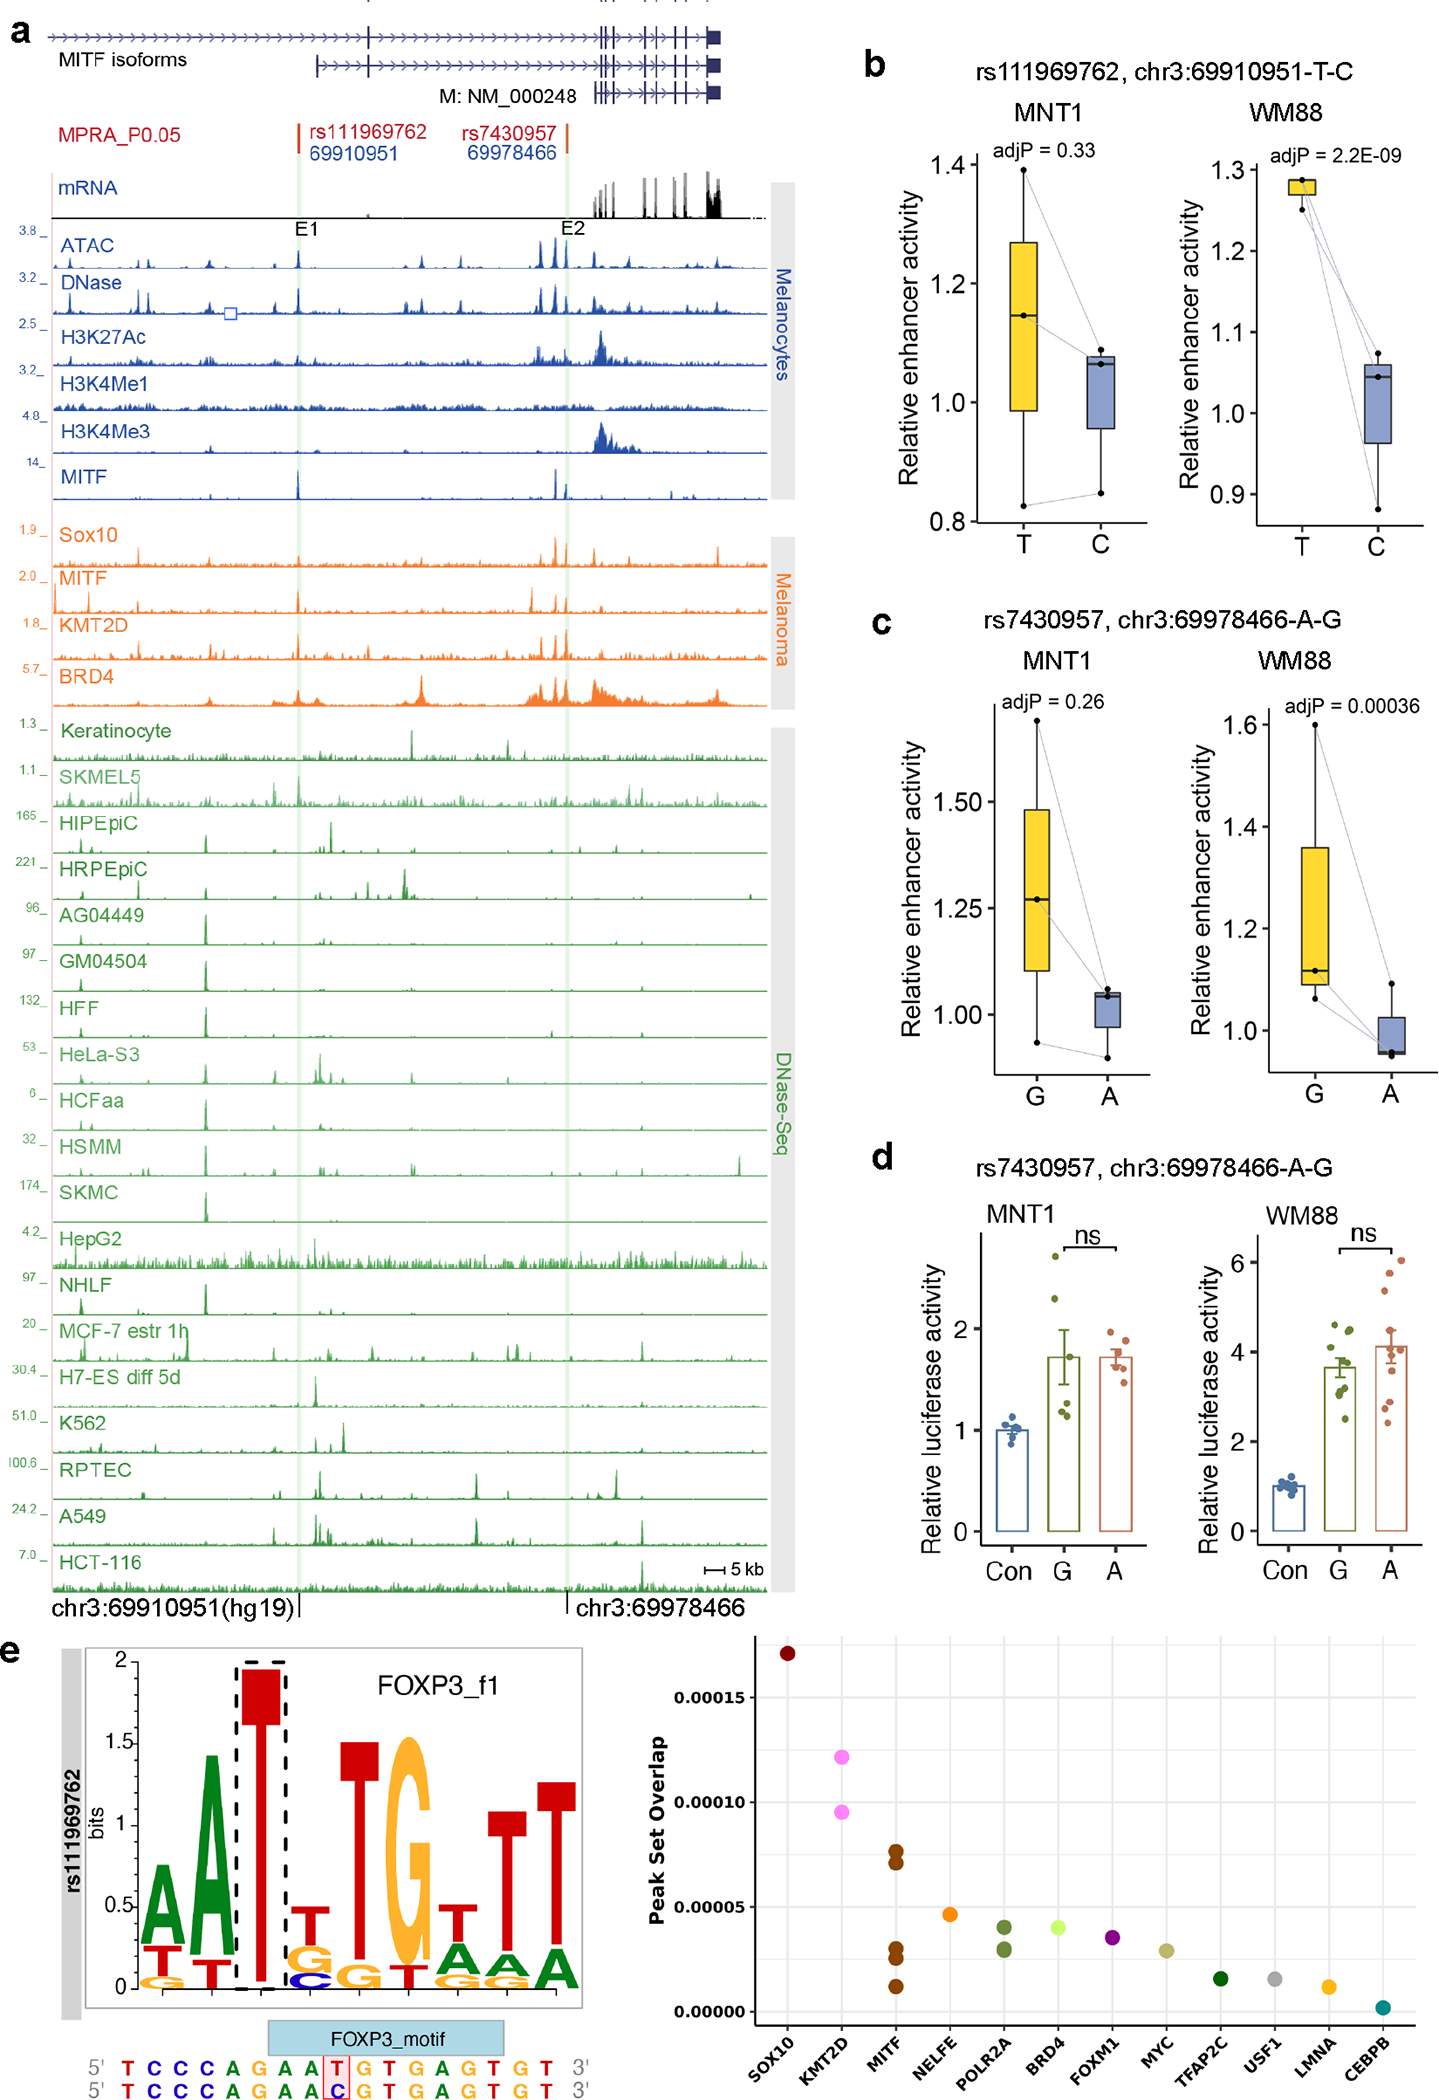
MITF is a master regulator of melanocyte development and proliferation 33. A cluster of 44 Di-SNPs was identified in the introns of MITF, indicating a signature of local adaptation18 (Fig. 4a and Supplementary Fig. 20). We identified two MFVs: rs111969762 (in E1) and rs7430957 (in E2). Both MFVs are in melanocyte-specific enhancers and colocalize with MITF and SOX10 ChIP-Seq peaks (Fig. 4a and Extended Data Fig. 5a). However, LRA showed that only rs111969762 exhibits regulatory activity, but not rs7430957 (Figs. 4b and 4c, Extended Data Fig. 5d). The discrepancy in enhancer activity for rs7430957 in MPRA and LRA could be due to the difference in enhancer lengths or trans-environment between the two methods 34. The enhancer activity of the derived allele rs111969762-T is about 3-fold higher than that of rs111969762-C (Figs. 4b and 4c). In addition, the T-to-C mutation at rs111969762 disrupts the binding motif of FOXP3 (Extended Data Fig. 5e), which is a transcription factor affecting pigmentation 35. The ancestral allele rs111969762-C is rare (frequency < 0.05) in most populations but is common in the San (0.47 in Ju|hoansi and 0.63 in !Xoo; Supplementary Fig. 21 and Supplementary Table 7).
Fig. 4: Regulatory variant rs111969762 near MITF contributes to the light skin color of the San.
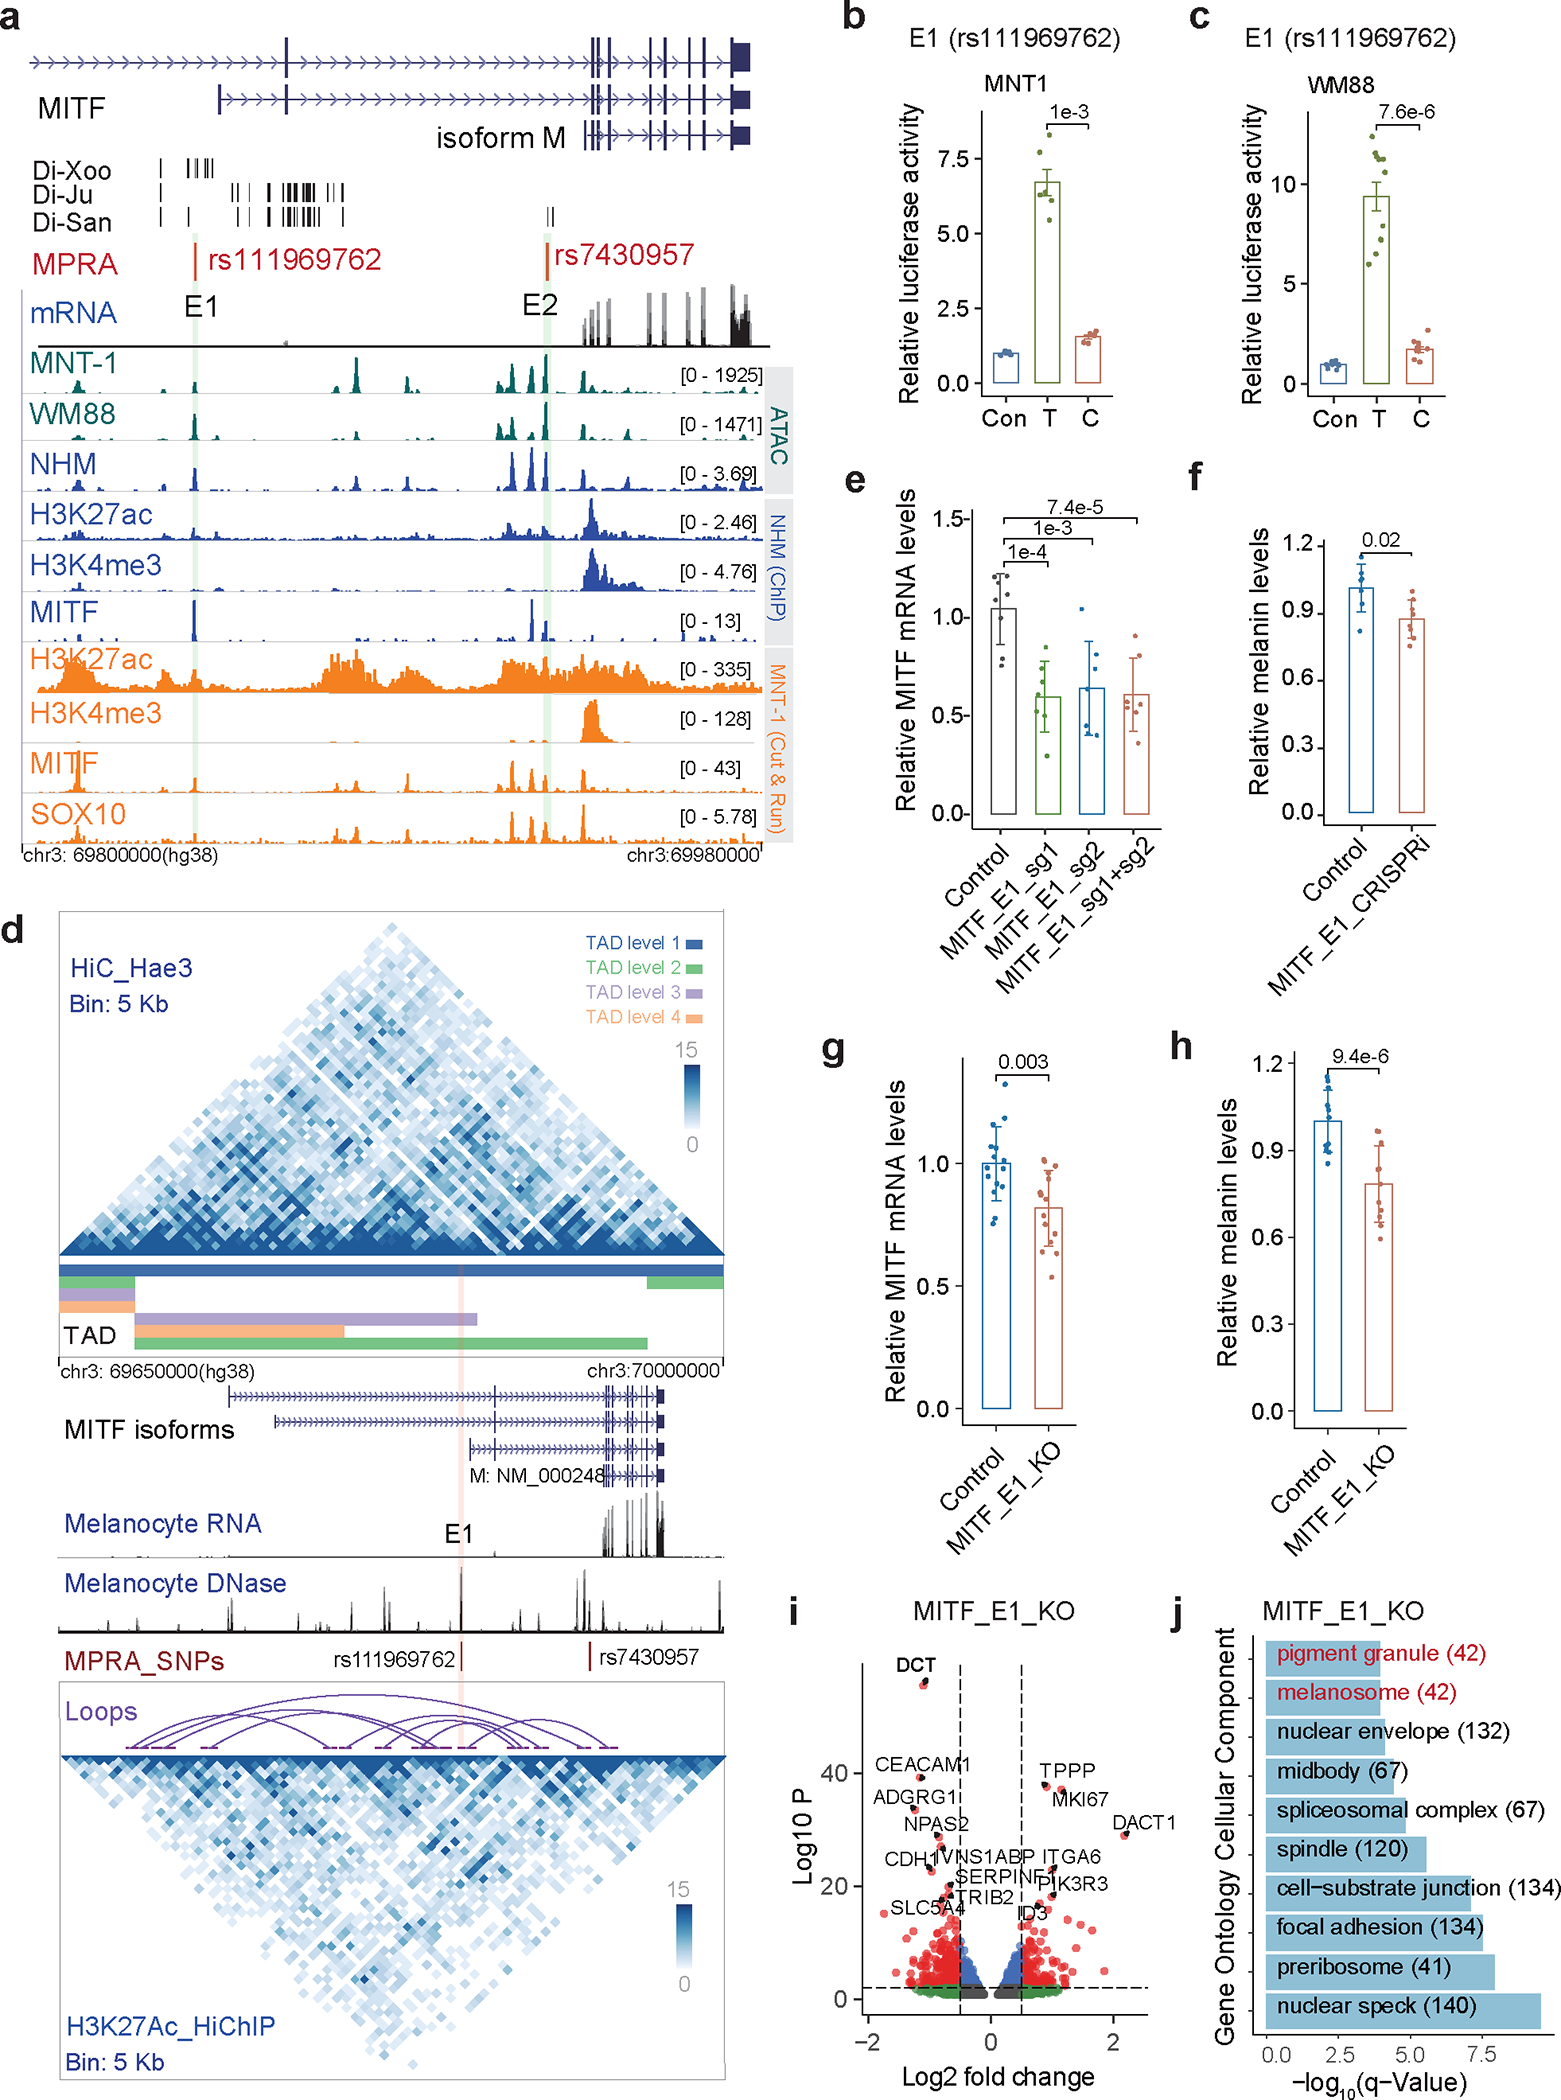
(a) MPRA identified two MFVs in regulatory elements near MITF. Di-Ju, Di-Xoo and Di-San are Di-SNPs. Green tracks represent ATAC-seq for MNT-1 and WM88; blue tracks show ATAC-Seq and ChIP-Seq data from normal human melanocytes (NHM); orange tracks indicate CUT&RUN data from MNT-1. The black dashes are Di-SNPs, the light green shadowed regions represent enhancers E1 and E2. (b-c) LRAs showed that rs111969762 located in E1 affects enhancer activity in both MNT-1 and WM88. Two-tailed paired t-tests (MNT-1, n = 6; WM88, n = 11). (d) Chromatin interactions at the MITF locus identified by Hi-C and H3K27ac HiChIP using Hae3 digestion. The upper matrix is from MNT-1 Hi-C data, and the lower matrix is from MNT-1 H3K27ac HiChIP data. TADs were called by onTAD and colored by nested TAD levels. The purple arches were loops called by cLoops. Melanocyte RNA-Seq and DNase-Seq tracks were downloaded from ENCODE 68. The pink shadowed region represents enhancers E1. (e) qPCR showed that CRISPRi of E1 significantly reduces the gene expression of MITF. Two-sided Dunnett’s test with adjustments for multiple comparisons (control, n = 8; others, n = 7). (f) CRISPRi of E1 significantly reduces melanin levels. Two-tailed unpaired t-tests (control, n = 7; MITF_E1_CRISPRi, n = 8). (g) qPCR showed that CRISPR-mediated deletion of E1 significantly decreased the gene expression of MITF. Two-tailed unpaired t-tests (n = 15). (h) CRISPR-mediated deletion of E1 significantly reduced melanin levels (two-tailed unpaired t-tests (n = 8)). CRISPR was performed in MNT-1 using two sgRNAs. (i) RNA-Seq data showing differentially expressed genes in E1-deleted MNT-1. Genes plotted in this figure were selected using DESeq2 (p<0.05, three biological replicates). (J) Gene ontology analysis of differentially expressed genes in E1-deleted MNT-1. Data were presented as mean ± SEM. P values were listed above the bars.
Hi-C identified nested TADs at the MITF locus and H3K27ac HiChIP detected multiple loops within MITF (Fig. 4d and Supplementary Fig. 22). Specifically, we observed a significant interaction (FDR < 0.05 by cLoops 36, Supplementary Table 6) between rs111969762 and the TSS of the melanocyte-enriched isoform of MITF (MITF-M, Fig. 4d). CRISPRi of E1 significantly reduced the expression of MITF and melanin levels in MNT-1 (Figs. 4e and 4f), further validating that E1 interacts with the MITF promoter by chromatin looping. CRISPR-KO of E1 also significantly reduced the expression of MITF and melanin levels in MNT-1 (Figs. 4g and 4h, Supplementary Fig. 23a). RNA-Seq revealed that the E1-knockout affected the expression of genes in melanosome and melanogenesis pathways (Figs. 4i and 4j, and Supplementary Figs. 23b and 23c). For example, we observed downregulation of DCT, MC1R, PMEL, and SLC24A5, which are involved in melanogenesis and pigmentation, and upregulation of LEF1 and PAX3, which are upstream transcriptional activators of MITF 37,38. Collectively, these results indicate that rs111969762 contributes to the relatively light skin color of the San by decreasing the enhancer activity and expression of MITF.
The role of Di-SNPs near LEF1, TRPS1 and BLOC1S6 in pigmentation
We further investigated other regulatory Di-SNPs that could potentially impact skin color in the San. These Di-SNPs include rs11939273 and rs17038630 near LEF1; rs75827647, rs10468581, rs113940275 near NLK; rs11985280 near TRPS1 and rs72713175 near BLOC1S6 (Fig. 5 and Extended Data Figs. 6–9). Based on MPRA and LRA, these Di-SNPs significantly affect enhancer activity in MNT-1 or WM88 (Supplementary Table 5). Among all these SNPs, only rs17038630 near LEF1, rs11985280 near TRPS1, and rs72713175 near BLOC1S6 overlap open chromatin regions in MNT-1, WM88 and normal melanocytes (Fig. 5). Importantly, the LEF1 locus is associated with hair color 39,40; the TRPS1 locus is associated with sunburns 39 and tanning 41; and inactivating mutations in BLOC1S6 cause reduced hair pigmentation in mice42. Thus, we further investigated the roles of these loci in pigmentation.
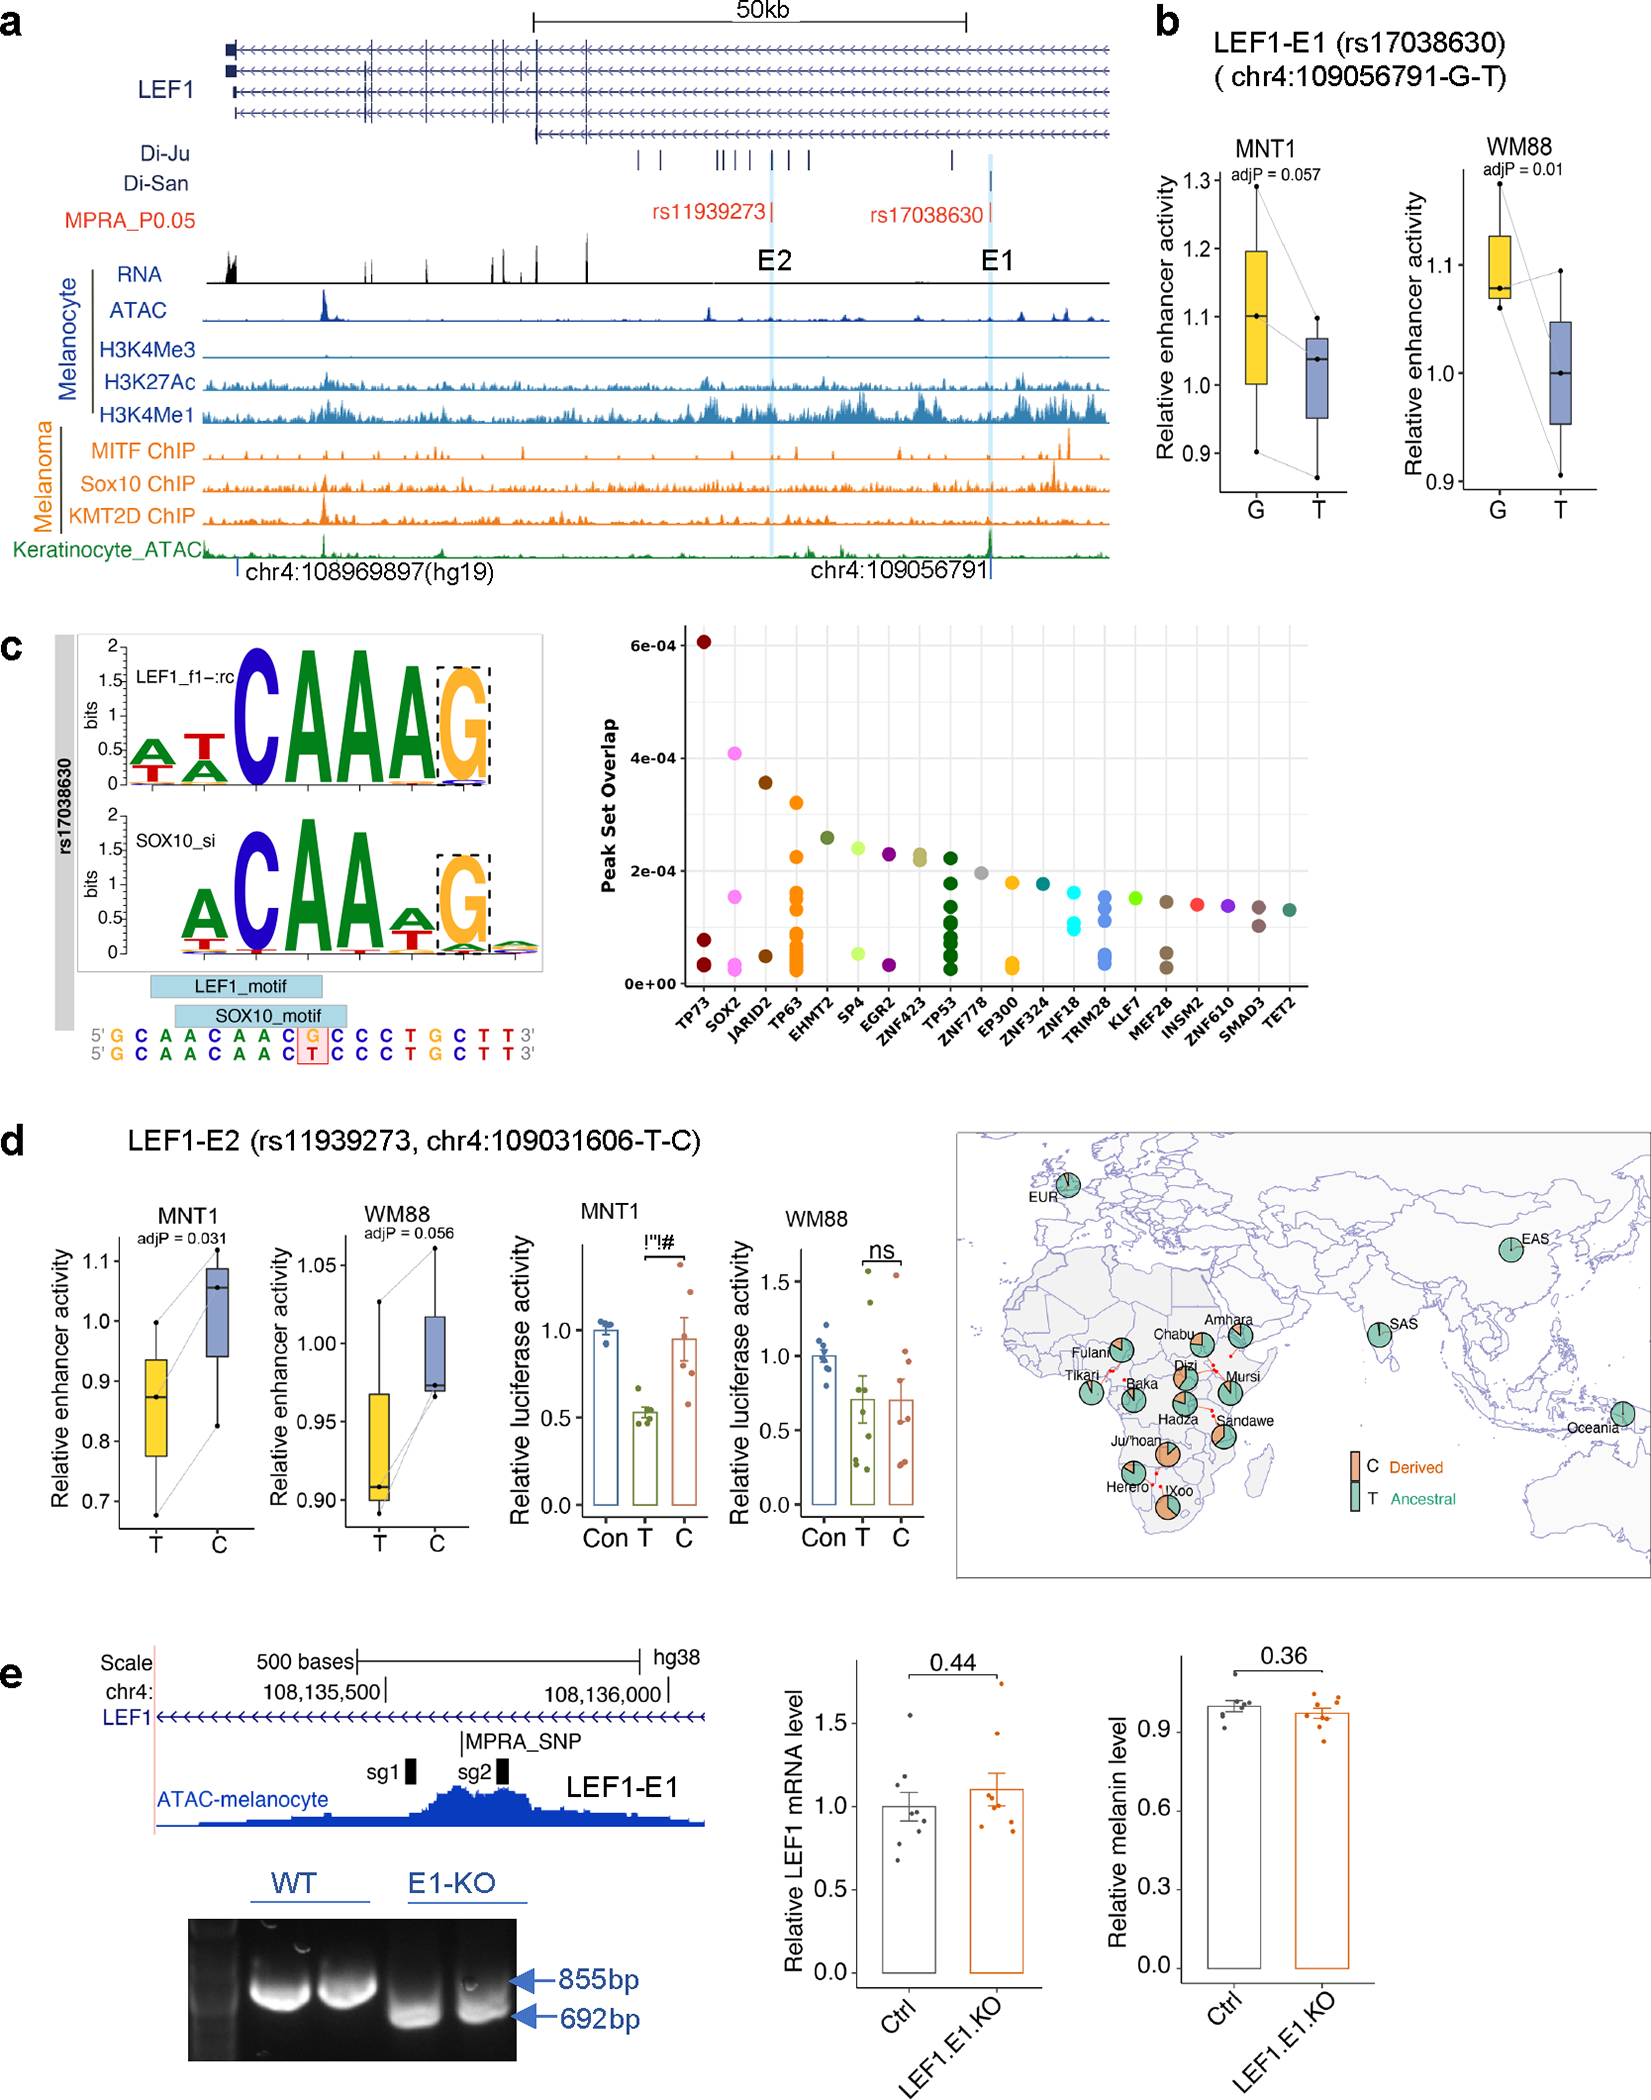
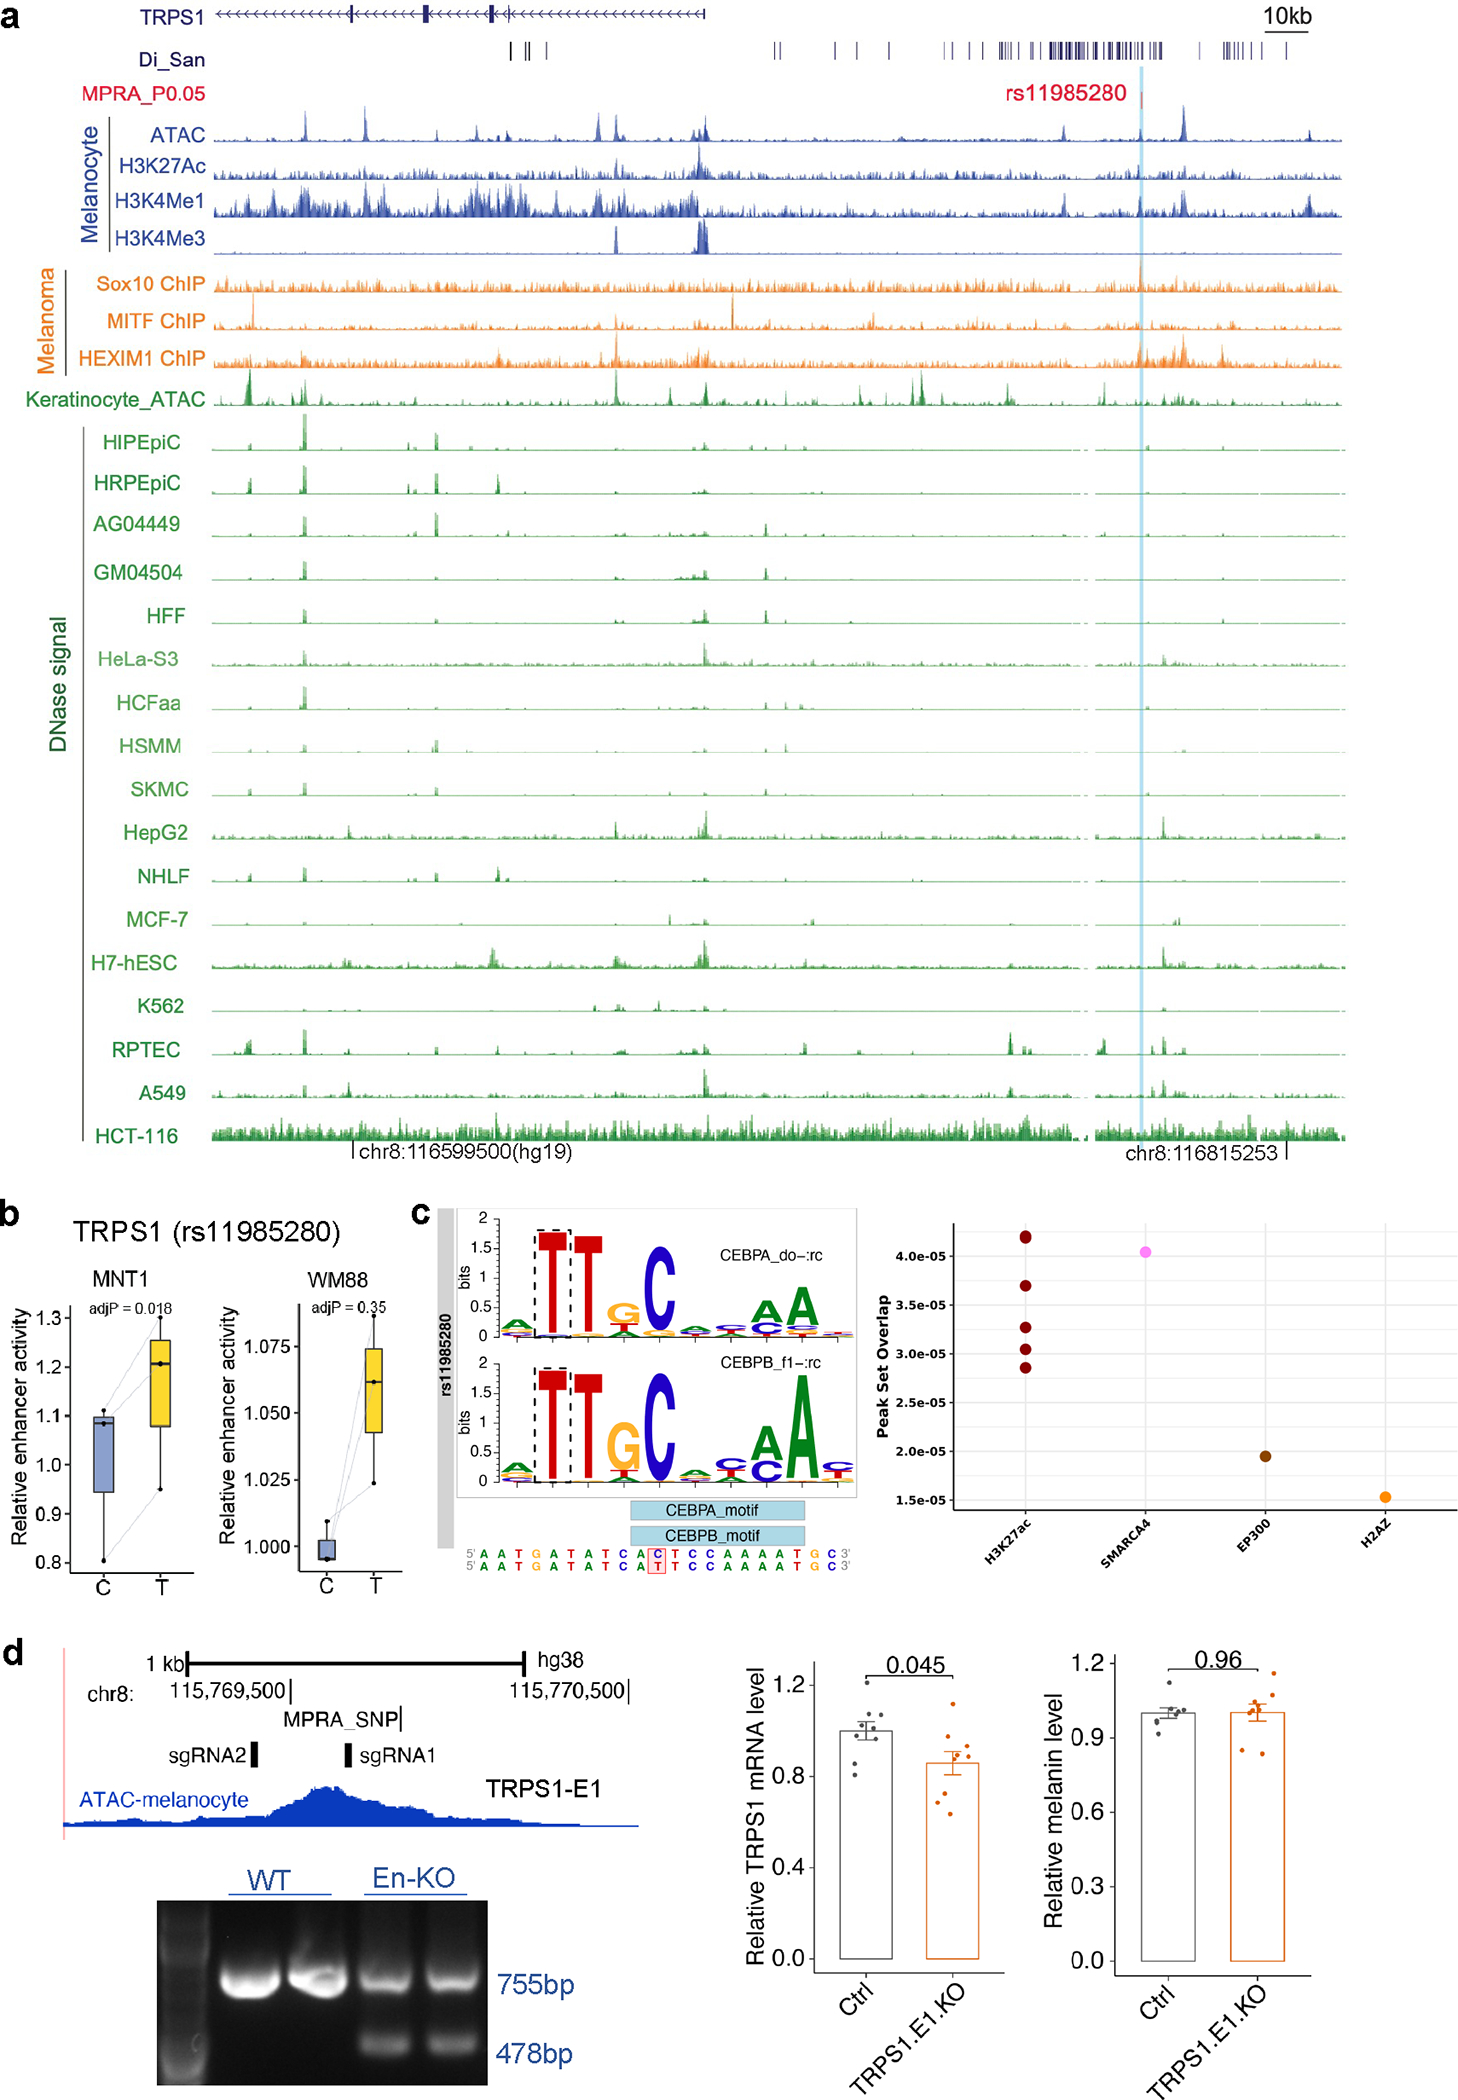
Fig. 5: Regulatory SNPs of LEF1 and TRPS1 contribute to the light skin color of the San.
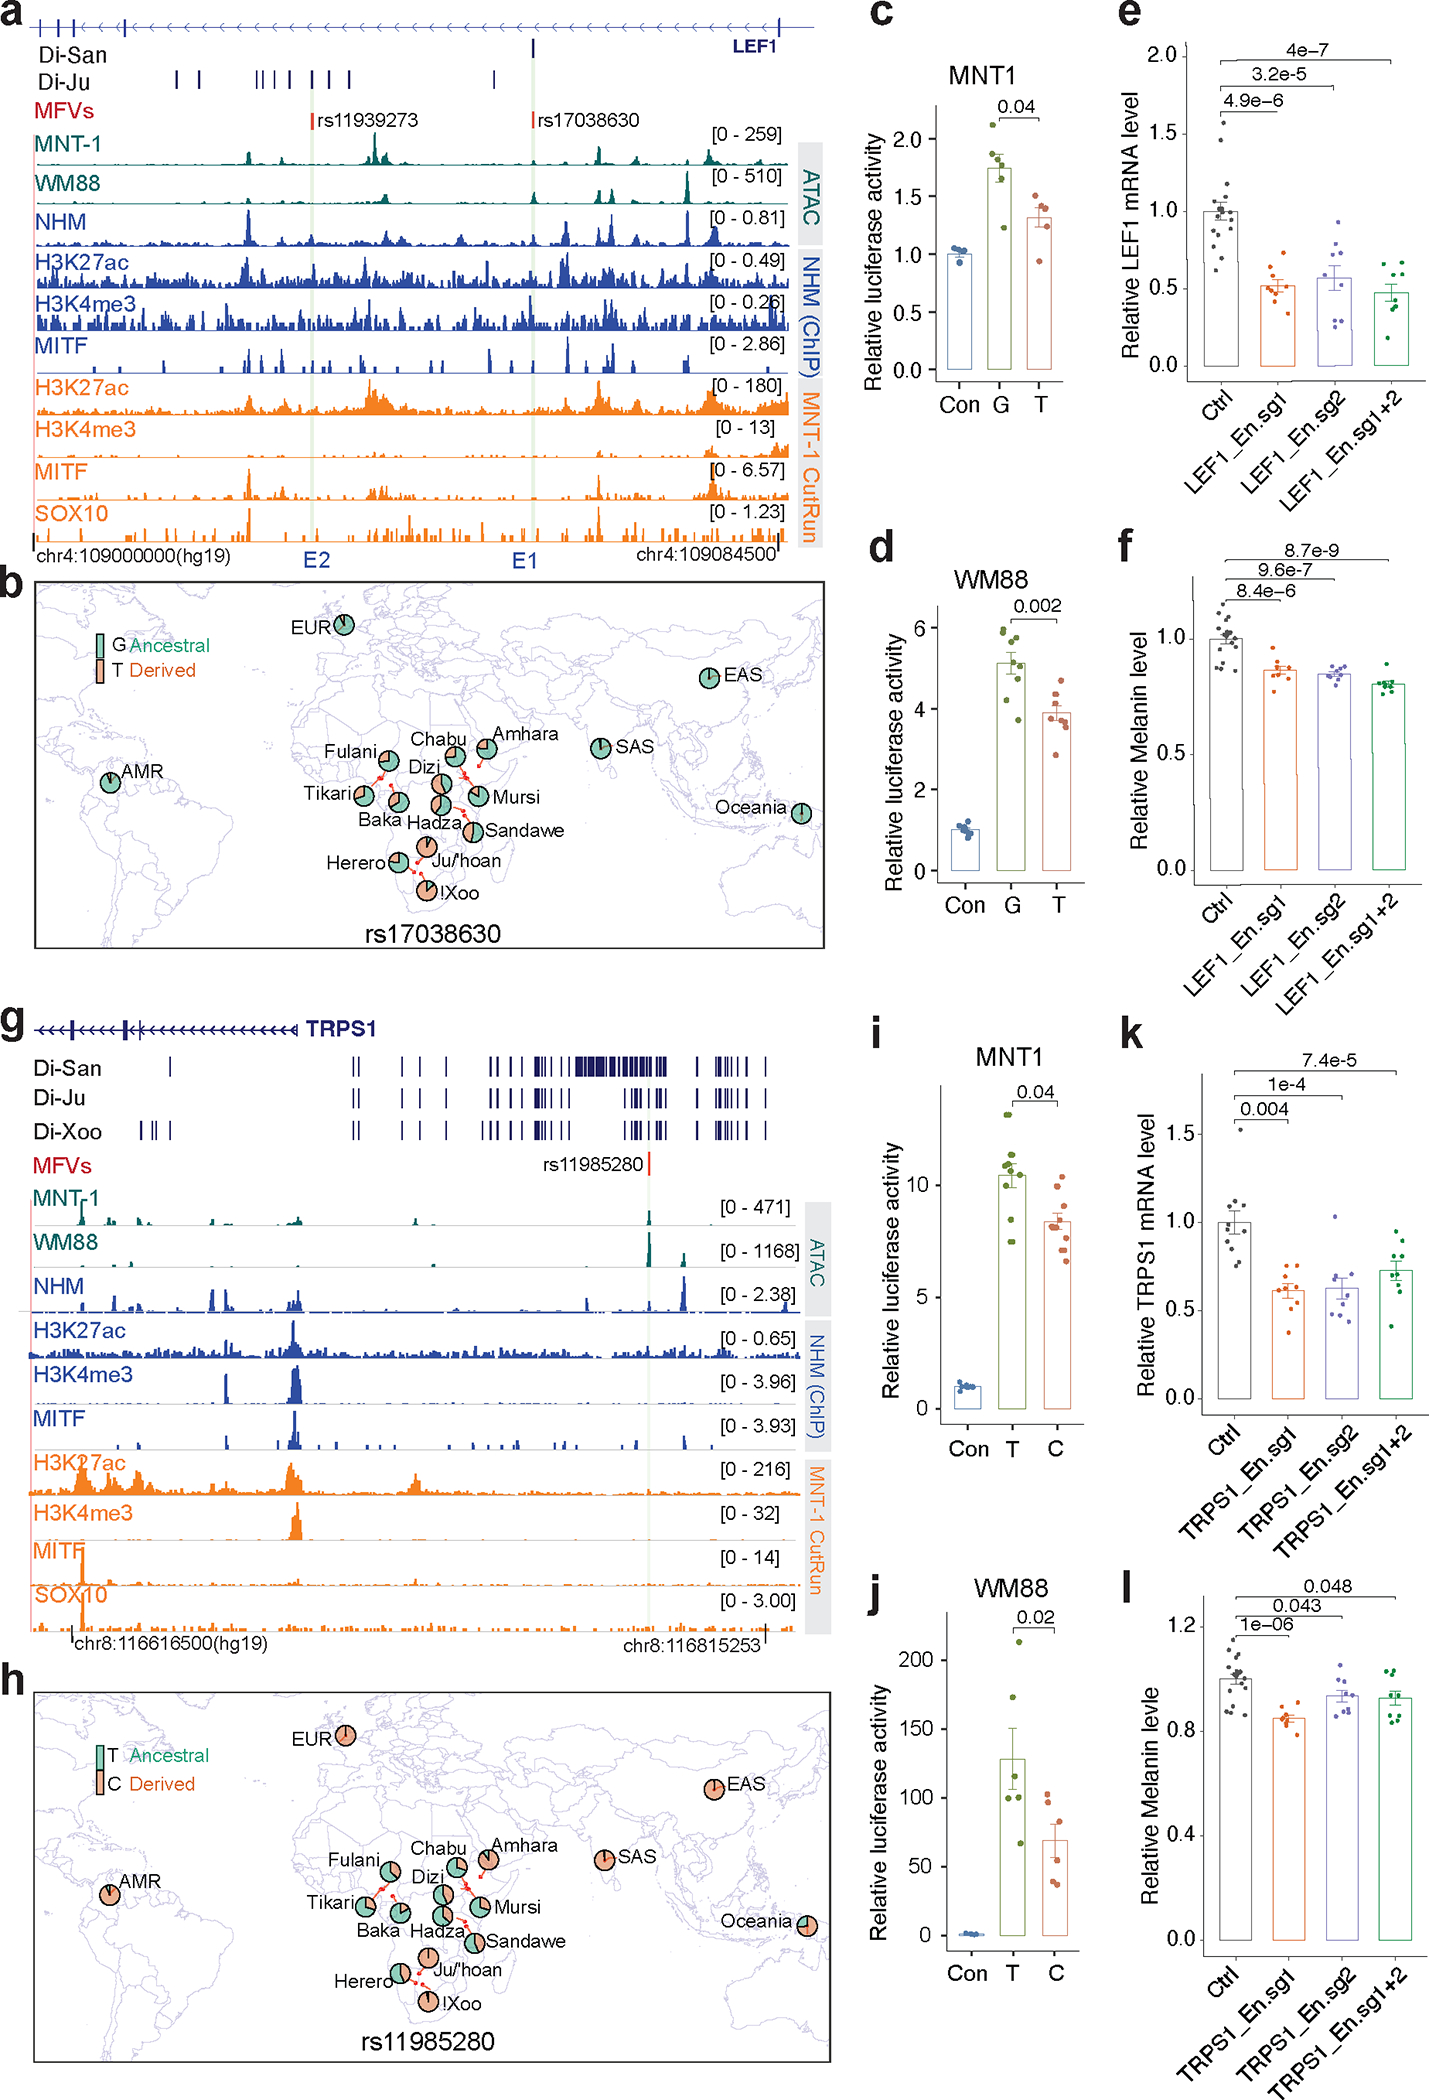
(a) MPRA identified two MFVs near the LEF1 locus. Green tracks represent ATAC-seq for MNT-1 and WM88; blue tracks show ATAC-Seq and ChIP-Seq data from normal human melanocytes (NHM); orange tracks indicate CUT&RUN data from MNT-1. The black dashes are Di-SNPs, the light green shadowed regions represent the locations of enhancers E1 and E2. (b) The allele frequency at rs17038630 in global populations using data from the 1000G 31, African 5M 13 and SGDP 49 datasets. (c-d) LRAs showed that rs17038630 located in E1 affects enhancer activity in both MNT-1 and WM88 (two-tailed paired t-tests (MNT-1, n = 6; WM88, n = 9)). (e) qPCR showed that CRISPRi of E1 significantly reduces the gene expression of LEF1. Two-sided Dunnett’s test with adjustments for multiple comparisons (control, n=17; others, n = 9). (f) CRISPRi of E1 significantly reduces melanin levels. Two-sided Dunnett’s test with adjustments for multiple comparisons (control, n=18; others, n = 9). (g) MPRA identified one MFV near the TRPS1 locus. (h) The allele frequency at rs11985280 in global populations, data were from the 180G 18, SGDP 49 and 1000G 31 datasets. (i-j) LRAs showed that rs11985280 located in E1 affects enhancer activity in both MNT-1 and WM88 (Two-tailed paired t-tests (MNT-1, n = 9; WM88, n = 6)). (k) qPCR showed that CRISPRi of the enhancer harboring rs11985280 significantly reduces the gene expression of TRPS1. Two-sided Dunnett’s test with adjustments for multiple comparisons (control, n=11; others, n = 9). (l) CRISPRi of the enhancer harboring rs11985280 significantly reduces melanin levels. Two-tailed unpaired t-tests (control, n=18; others, n = 9). Data were presented as mean ± SEM, P values were listed above the bars.
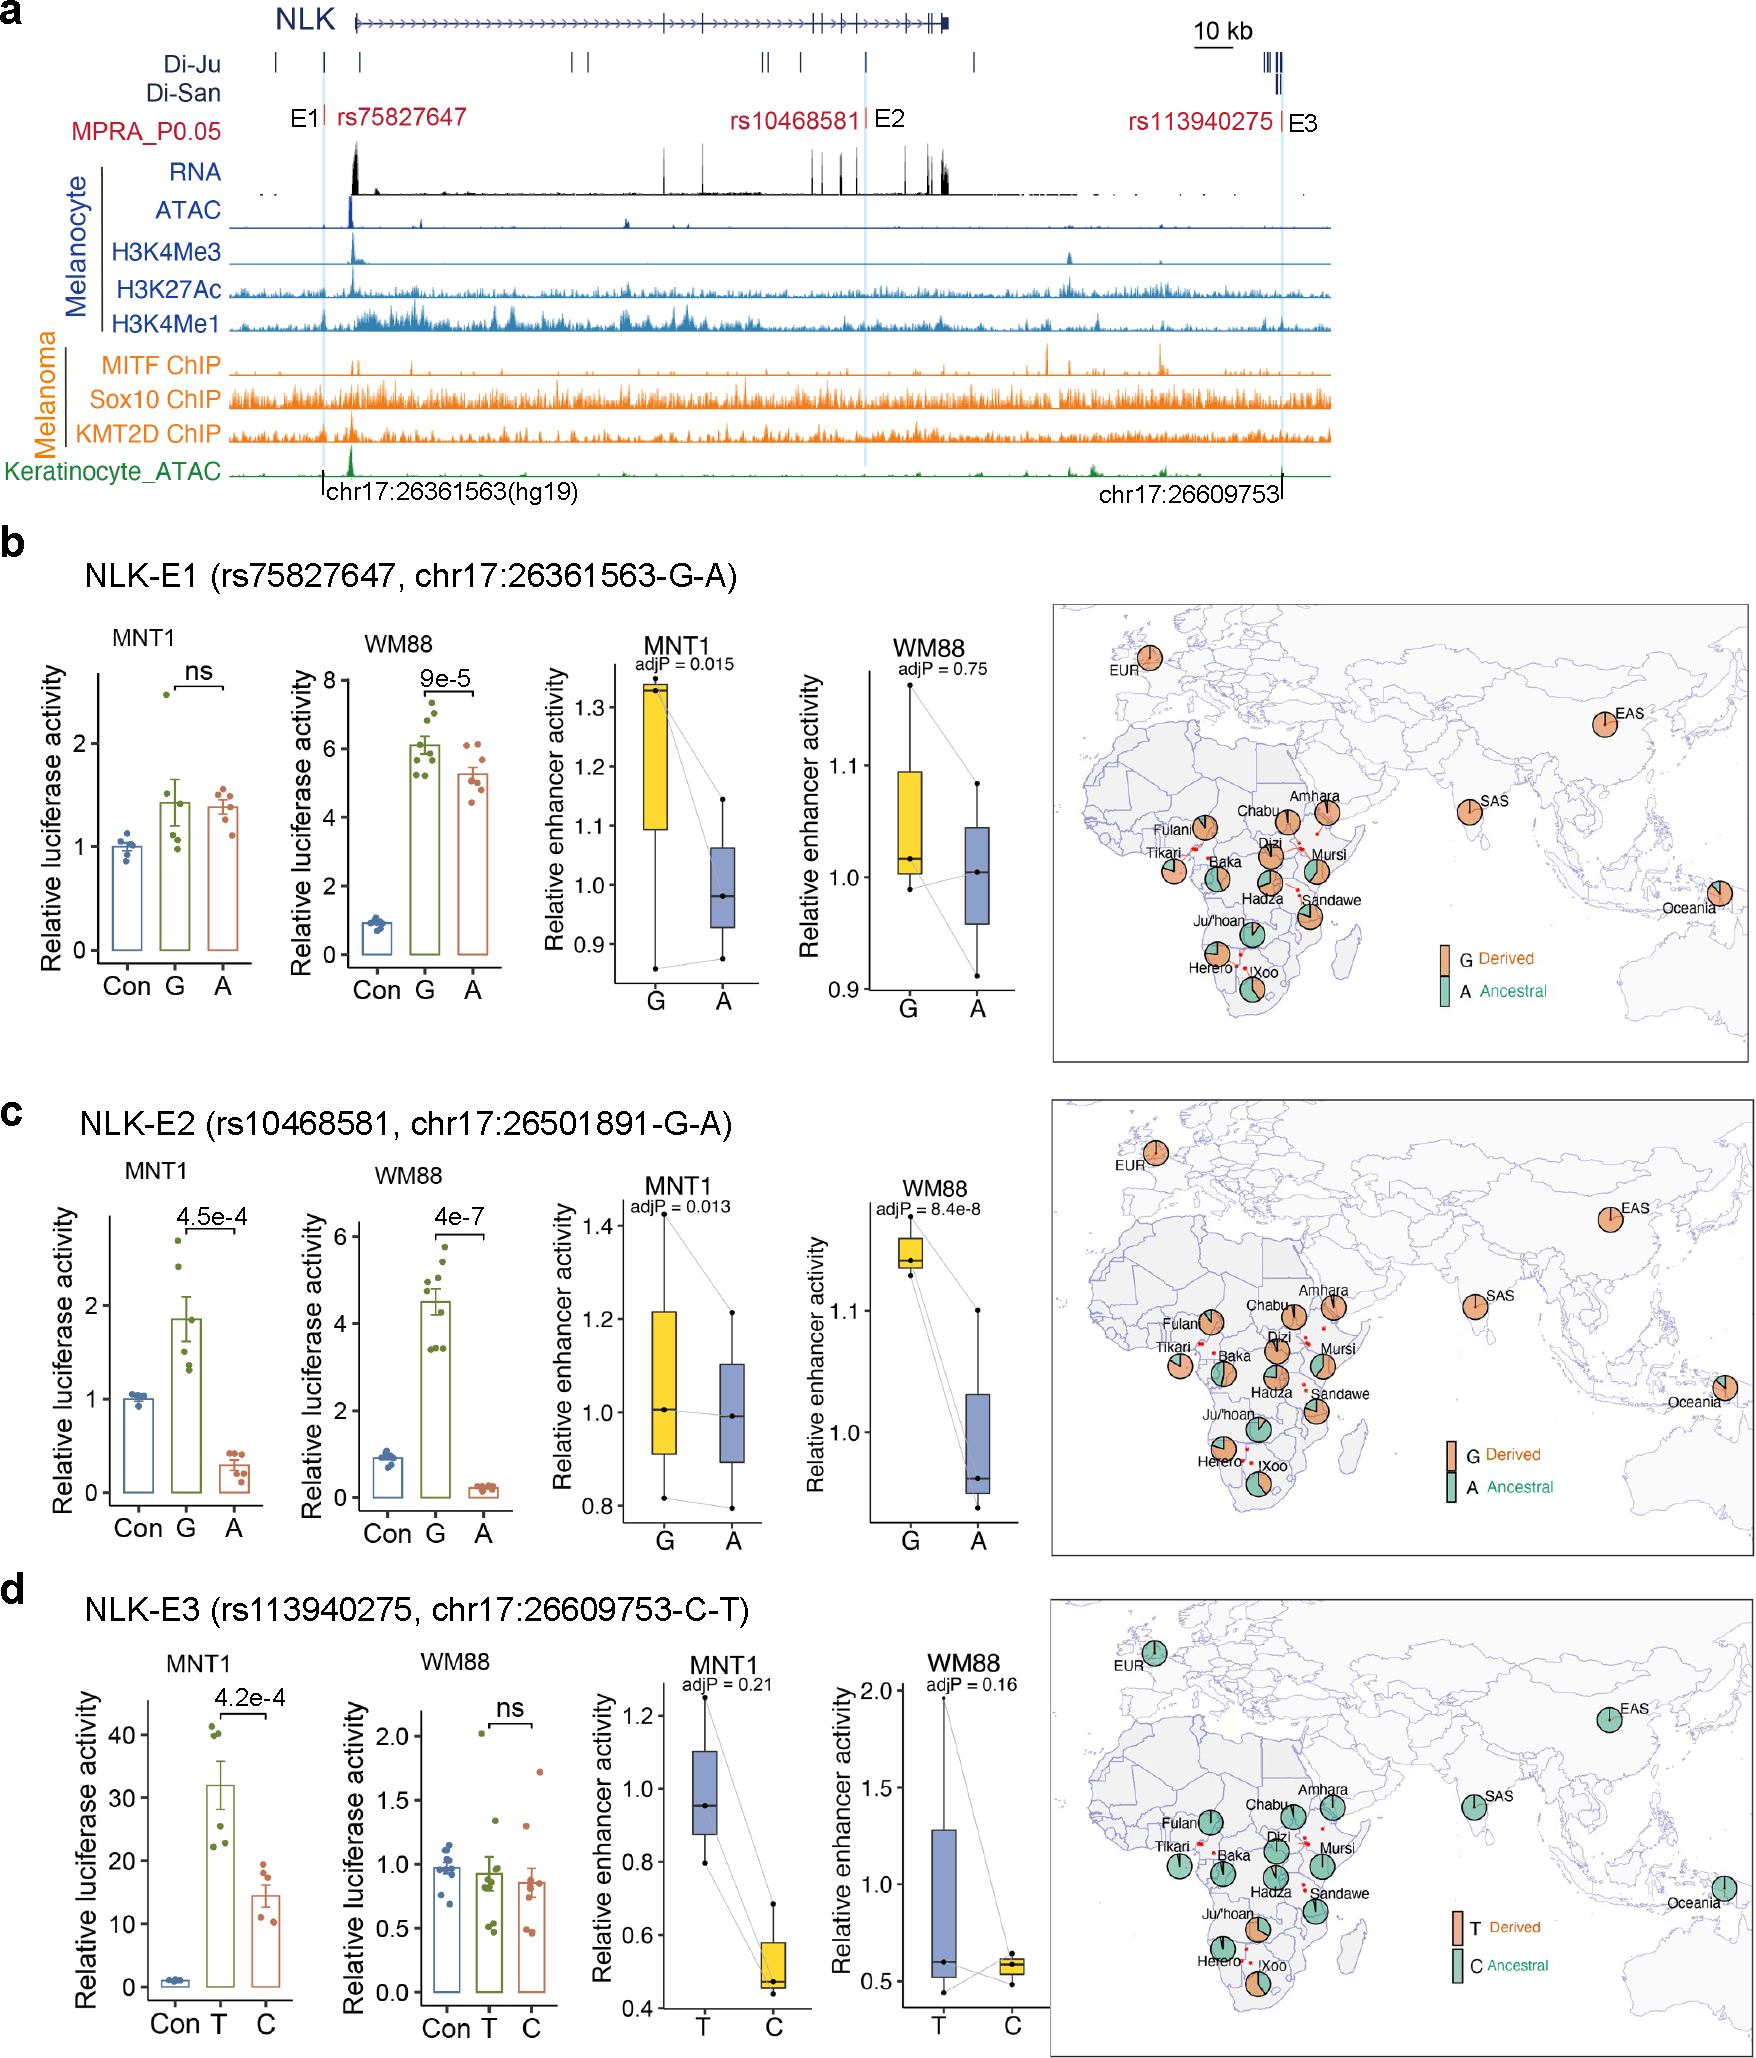
LEF1 is a transcription factor that regulates the expression of MITF and TYR 43,44. Di-SNP rs17038630 is in the third intron of LEF1 and its derived allele, rs17038630-T, shows higher frequencies in the San (0.80) compared with other populations (< 0.4) (Figs. 5a and 5b). rs17038630-T is associated with decreased enhancer activity compared to rs17038630-G in both MNT-1 and WM88 (Figs. 5c, 5d and Extended Data Fig. 6b), consistent with the observation that the G-to-T mutation at rs17038630 disrupts the binding motif of LEF1 and SOX10 (Extended Data Fig. 6c). CRISPRi of enhancer E1 significantly reduced LEF1 expression and melanin levels in MNT-1 (p < 0.001, Figs. 5e and 5f). However, CRISPR-KO of E1 did not significantly impact LEF1 expression and melanin levels in MNT-1 (Extended Data Fig. 6e). We also identified three functional Di-SNPs near NLK by MPRA and LRA (Extended Data Fig. 7 and Supplementary Table. 5). NLK is a serine/threonine-protein kinase that phosphorylates LEF1 45,46 and is associated with sunburns 39. In summary, we identified regulatory variants near LEF1 and NLK, which may impact pigmentation.
TRPS1 is a transcription factor impacting the development of various tissues, including kidney, bone and hair follicles 47. We observed that 161 Di-SNPs are located upstream of TRPS1 and only rs11985280 overlaps a melanocyte-specific ATAC-seq peak (Fig. 5g and Extended Data Fig. 8a). The derived allele rs11985280-C is associated with decreased enhancer activity in both MNT-1 and WM88 (Figs. 5i, 5j and Extended Data Fig. 8b). Consistent with this observation, the T-to-C mutation at rs11985280 disrupts the binding motif of CCAAT/enhancer-binding proteins CEBPA/B (Extended Data Fig. 8c). CEBPA/B are downstream targets of STAT3 and loss of STAT3 enhances pigmentation 48. CRISPRi of the enhancer containing rs11985280 significantly reduced the expression of TRPS1 and melanin levels in MNT-1 (Figs. 5k and 5l). CRISPR-KO of the enhancer of TRPS1 significantly decreased its expression but not the melanin level in MNT-1 (Extended Data Fig. 8d). Based on 180G 18 and SGDP 49 datasets, the San populations exhibit the highest frequency of rs11985280-C in Africa, with a frequency of 1.00 in Ju|hoansi and 0.97 in !Xoo, followed by the relatively lightly pigmented Ethiopian Amhara population at 0.90. Furthermore, rs11985280-C is nearly fixed in the European (0.997), East Asian (0.997), and South Asian (0.983) populations based on the 1000G 31 dataset (Fig. 5h). In comparison, in populations that are relatively more darkly pigmented, including the Baka, Chabu, Dizi, Fulani, Hadza, Herero, Mursi, Sandawe, Tikari and Oceanians, have a lower frequency ranging from 0.17 to 0.43 (Fig. 5h). Indeed, the FST value for CEU versus YRI (0.714) and CHB versus YRI (0.725) rank in the top 0.05% and 0.1% across the genome, respectively. The GWAS-All dataset shows rs11985280-C is associated with light skin color (p = 0.088), although the association is not significant, possibly due to limited power because of lack of variability in the San and Amhara populations. However, the region encompassing TRPS1 is significantly associated with skin color in the UKBB 7 dataset (leading SNP rs2721954; p = 1.2×10−91). Together, these results suggest that TRPS1 plays a role in human skin pigmentation in global populations.
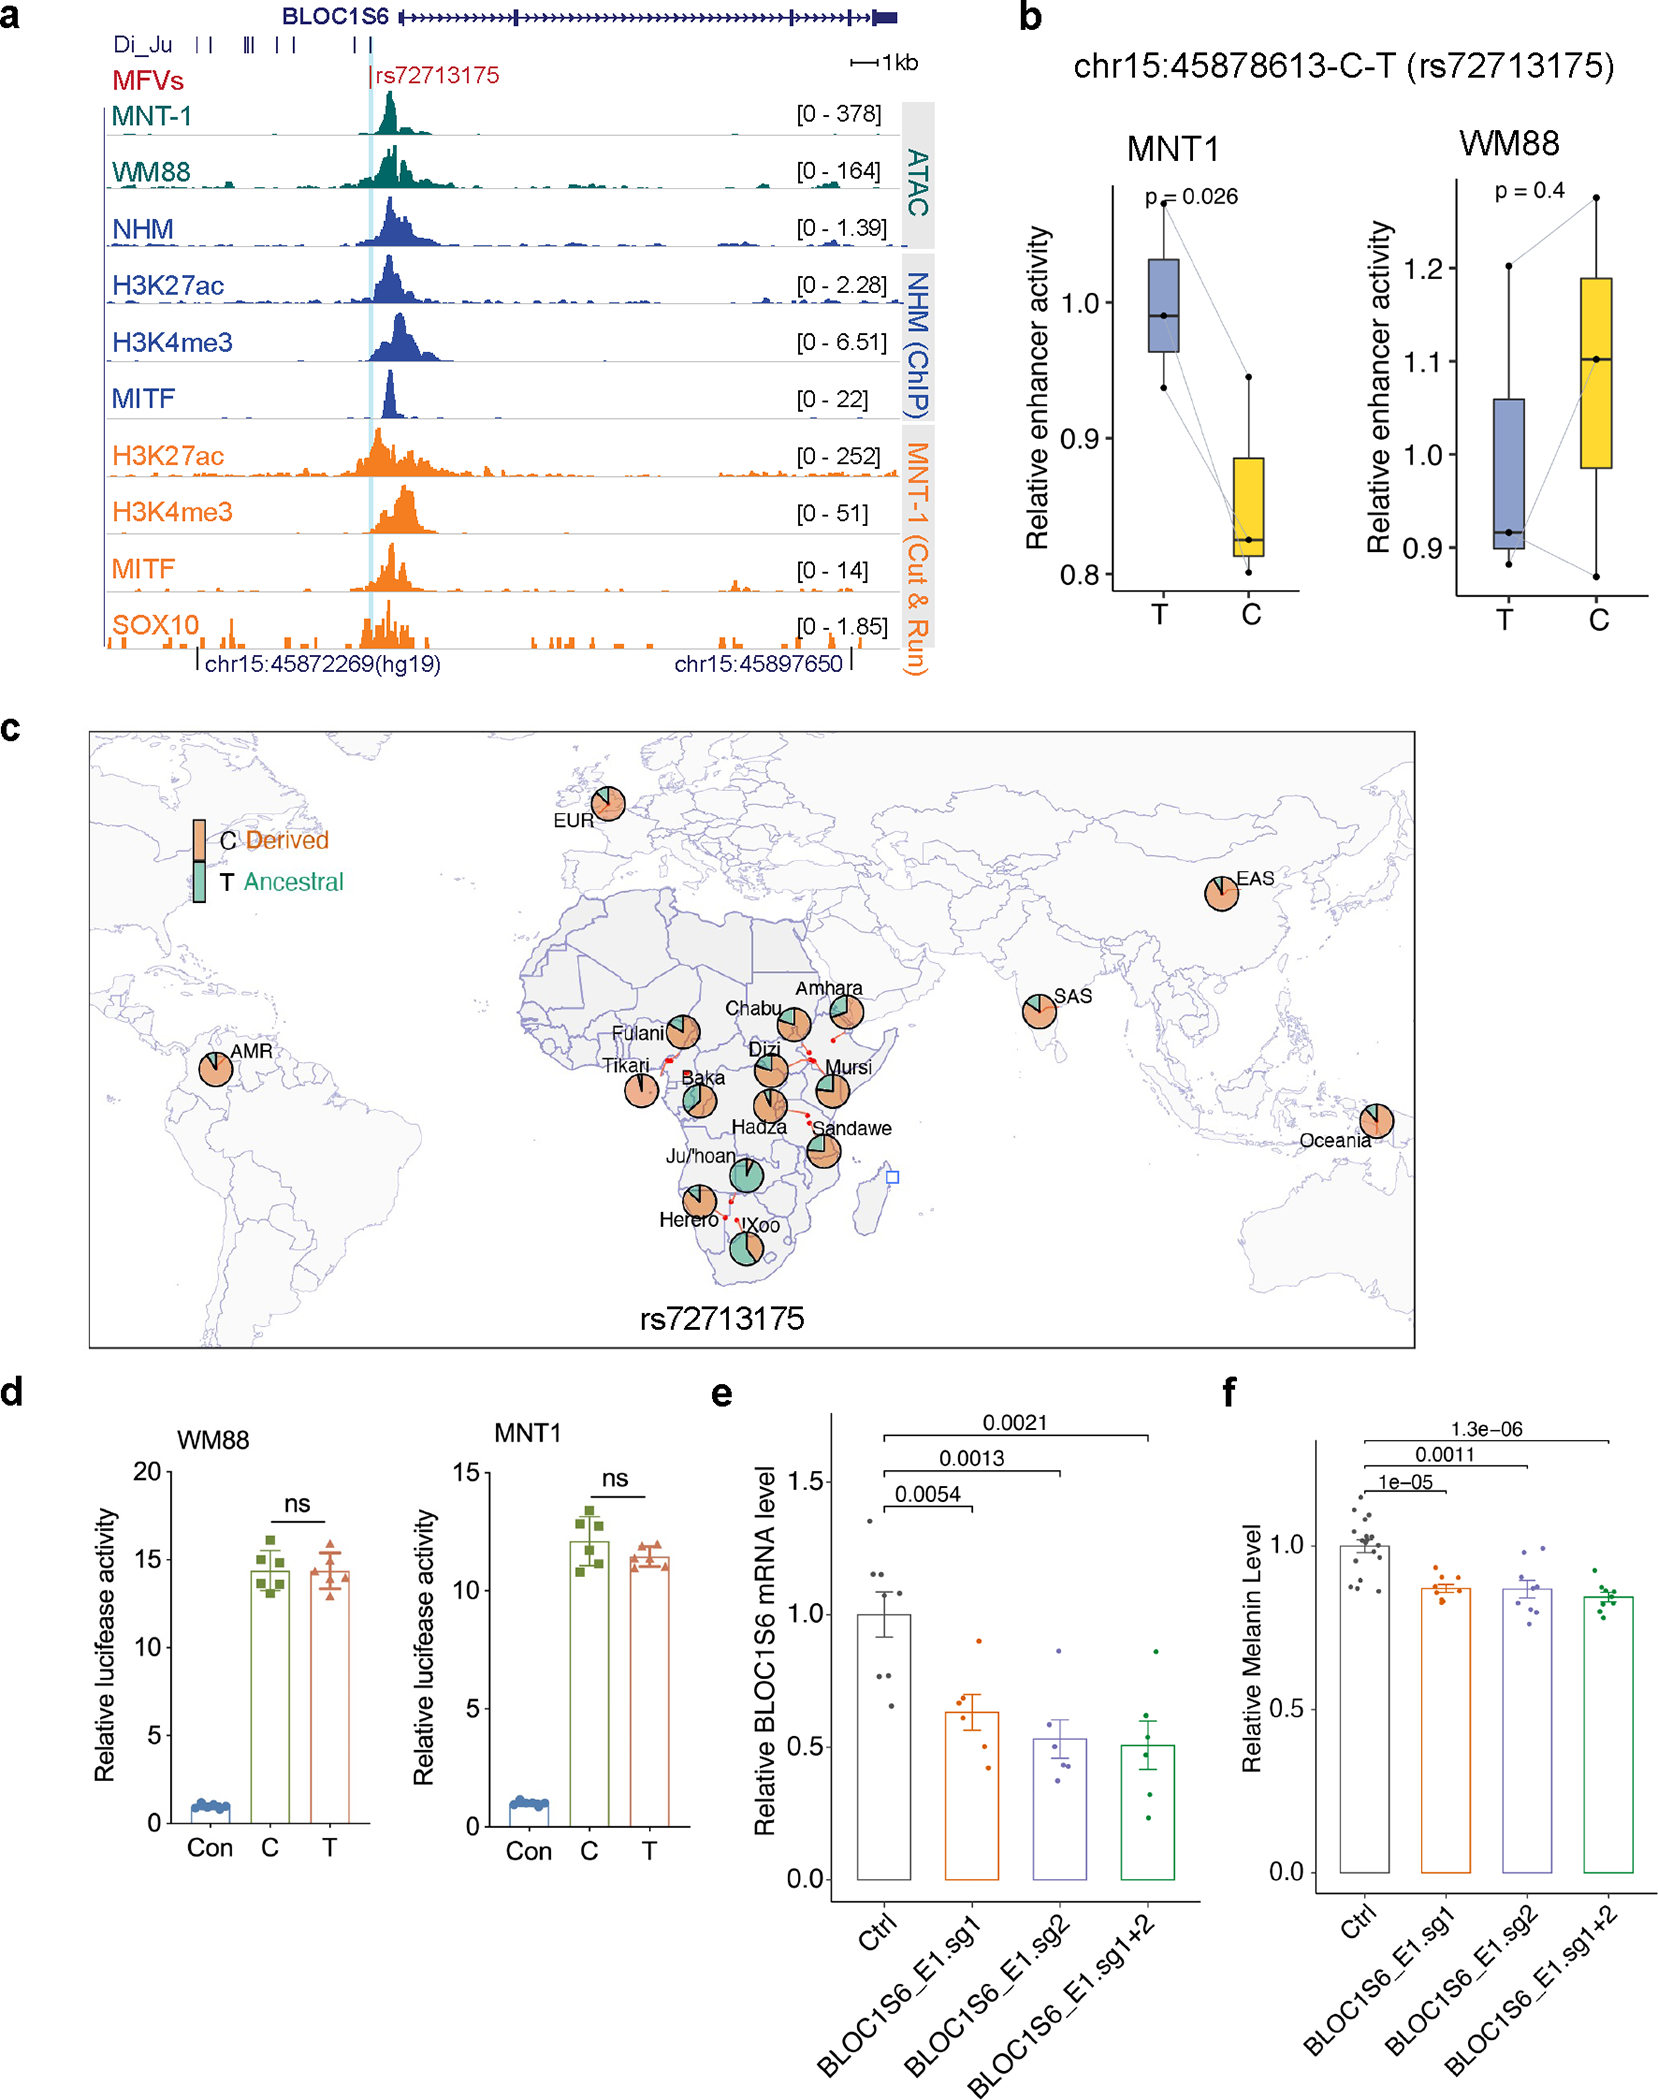
BLOC1S6 is involved in intracellular vesicle trafficking and melanosome biogenesis 50. Using MPRA, we identified a Di-SNP, rs72713175, located 1 kb upstream of BLOC1S6, impacting enhancer activity in WM88 (Extended Data Figs. 9a and 9b). The frequency of rs72713175-T, which is correlated with decreased enhancer activity, is much higher in the San (0.61) than in other populations (< 0.31) (Extended Data Fig. 9c). When we tested a 1.8 kb region (including rs72713175 and the promoter of BLOC1S6) using luciferase reporter assays, rs72713175 did not significantly affect the enhancer activity in either MNT-1 or WM88, indicating that the effect of rs72713175 on gene expression is negligible relative to the effect of the promoter (Extended Data Fig. 9d). However, CRISPRi of this region significantly reduced BLOC1S6 expression and pigmentation in MNT-1 (Extended Data Figs. 9e and 9f), suggesting that this SNP lies within a functional enhancer and that BLOC1S6 impacts pigmentation in human cells, consistent with the observation of decreased pigmentation in a mouse knock-out model.
TMEM138 and CYB561A3 are target genes of rs7948623
Previous studies reported that GWAS-SNP rs7948623 affects the activity of an enhancer interacting with the DDB1 promoter and hypothesized that DDB1 may impact skin color variation 13. In this study, we used MPRA to study 17 GWAS SNPs near DDB1 and identified 3 MFVs (rs7948623 in E1, rs2277285 in E2 and rs2943806 in E3) in either MNT-1 or WM88 (Fig. 6a and Extended Data Fig. 10). Among the 3 MFVs, rs7948623 had the strongest association with skin color (p = 1.42×10⁻¹⁰ in GWAS-All) and showed the most significant allelic skew (log2FC = −2.2, p = 2.6×10−118 in MNT-1; log2FC = −0.2, p = 2.3×10⁻⁷ in WM88) as estimated by MPRA and validated by LRA (Fig. 6b and Extended Data Figs. 10b–10d). The ancestral allele rs7948623-A, associated with lighter skin pigmentation, shows higher enhancer activity than the derived allele T (Fig. 6c), indicating that higher activity of E1 is associated with lighter skin pigmentation. Consistently, rs7948623 is located within a MITF binding site in melanocytes and mutation from A to T could disrupt the MITF binding motif (Fig. 6a and Extended Data Fig. 10e). SNPs rs2277285 and rs2943806 are in strong LD with each other (R2 = 0.89) but are in moderate LD with rs7948623 (R2 = 0.62, Extended Data Fig. 10f and 10g). Given that rs7948623 shows the strongest GWAS association and the highest allelic skew, further studies were focused on this SNP.
Fig. 6: CYB561A3 and TMEM138 are the primary target genes of GWAS-SNP rs7948623.
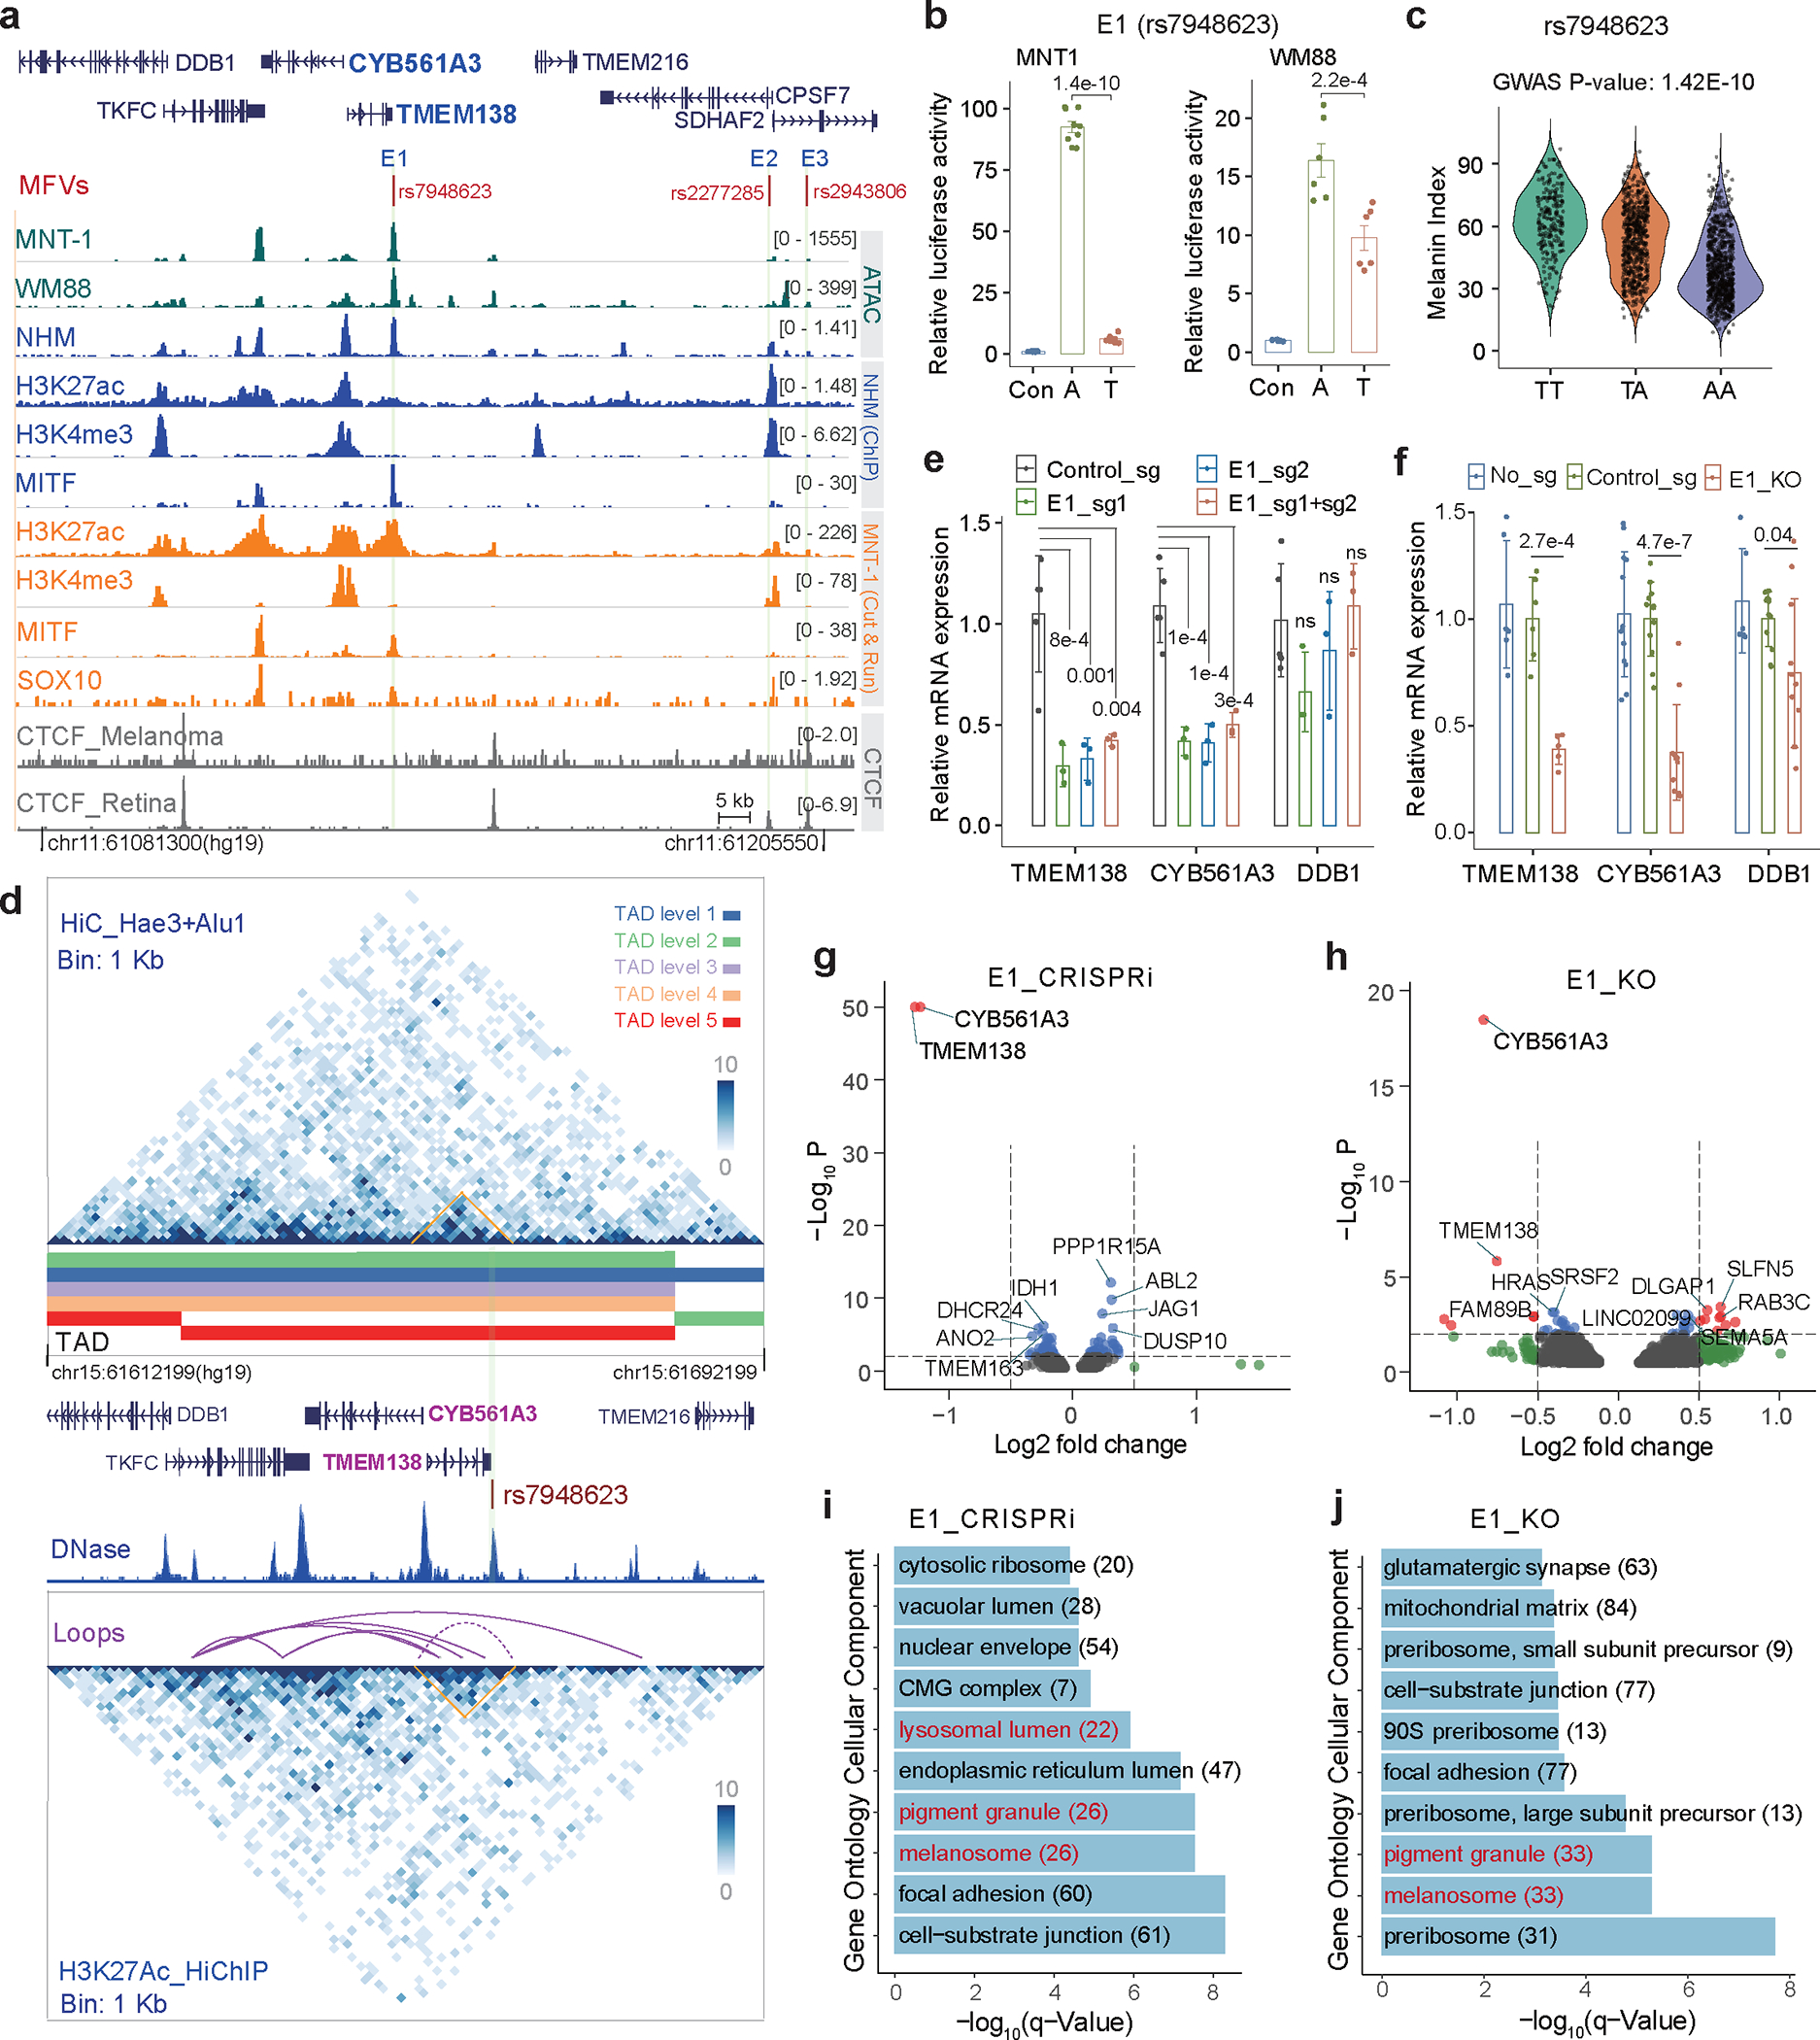
(a) Three regulatory variants identified by MPRA near the DDB1 locus. The red dashes are MFVs, and the light green shadowed regions represent enhancers E1, E2 and E3. (b) LRA showed that rs7948623 affects enhancer activity. Two-tailed paired t-tests, MNT-1 (n = 9), WM88 (n = 6). (c) The allele A at rs7948623 is associated with light skin color in Africans (n = 1544), p-value was calculated using EPACTS “q. emmax” method. (d) Chromatin interactions near DDB1 identified by Hi-C and H3K27ac HiChIP. The light green shadowed regions represent enhancers E1 and the interaction matrix between E1 and its targets were highlighted by orange triangles. (e) qPCR showed that CRISPRi of E1 in MNT-1 significantly decreases the expression of CYB561A3 and TMEM138 (Two-sided Dunnett’s test with adjustments for multiple comparisons (control sgRNA n = 5; others n = 3)). (f) qPCR showed that CRISPR-mediated deletion of E1 significantly decreases the gene expression of CYB561A3, TMEM138 and DDB1. Two-tailed unpaired t-tests without adjustments for multiple comparisons (in group No_sg, TMEM138 (n = 6), CYB561A3 (n = 12), DDB1 (n = 6); in group Control_sg, TMEM138 (n = 6), CYB561A3 (n = 12), DDB1 (n = 12); in group E1_KO, TMEM138 (n = 5), CYB561A3 (n = 11), DDB1 (n = 11)). (g) CRISPRi of E1 inhibits the gene expression of CYB561A3 and TMEM138 based on RNA-Seq data. The top 10 differentially expressed genes were labeled, P was calculated by Wald’s test with multiple testing correction in DESeq2. (h) Volcano plot showed that CRISPR-mediated deletion of E1 reduces the gene expression of CYB561A3 and TMEM138. The top 10 differentially expressed genes were labeled, P was calculated by Wald’s test with multiple testing correction in DESeq2. (i) Gene ontology analysis of RNA-Seq data showed CRISPRi of E1 affects the expression of genes in pigmentation-related pathways. (j) Gene ontology analysis of RNA-Seq data showed CRISPR-mediated deletion of E1 affects the expression of genes in pigmentation-related pathways. Data were presented as mean ± SEM. ns p > 0.05.
Using Hi-C and HiChIP, we detected interactions between the E1 enhancer containing rs7948623 and the promoters of DDB1 (36.5 kb upstream of rs7948623), CYB561A, and TMEM138 (7.8 kb upstream of rs7948623), with the latter two promoters showing stronger interactions (Fig. 6d and Supplementary Fig. 24). CRISPRi or CRISPR-KO of E1 significantly decreased the expression of TMEM138 and CYB561A3, but had only minor effects on DDB1 expression (p > 0.1 for CRISPRi and p = 0.025 for CRISPR-KO, Figs. 6e and 6f). RNA-Seq of E1-inhibited MNT-1 confirmed that TMEM138 and CYB561A3 show the largest fold-change among all transcribed genes (log2FC = −1.27 and −1.27, respectively; Fig. 6g). Similarly, TMEM138 and CYB561A3 have the largest differences in gene expression in E1-deleted MNT-1 (log2FC = −0.75 and −0.84, respectively; Fig. 6h). CYB561A3 (Cytochrome B561 Family Member A3) is an ascorbate-dependent ferrireductase in the lysosomal membrane 51 and is highly expressed in skin melanocytes 52 (TPM = 320, Supplementary Fig. 26). TMEM138 is a four-transmembrane domain protein involved in ciliary function 53 and is moderately expressed in skin melanocytes 52 (TPM = 37, Supplementary Fig. 26). Collectively, these results suggest that CYB561A3 and TMEM138 are the major target genes of rs7948623, and they may play a role in pigmentation.
CYB561A3 affects melanin levels in MNT-1 cells
Although neither CRISPRi nor CRISPR-KO of E1 significantly impacted melanin levels in MNT-1, both of them significantly affected the expression of known genes related to melanosome and melanogenesis pathways (Figs. 6i and 6j and Supplementary Fig. 25). Considering that deletion of E1 significantly reduces expression levels of CYB561A3 and TMEM138 (Figs. 6f and 6h) and that the allele at rs7948623 with higher enhancer activity is associated with lighter skin pigmentation (Figs. 6b and 6c), we hypothesized that decreasing the expression of CYB561A3/TMEM138 may enhance pigmentation. Indeed, overexpression of either CYB561A3 or TMEM138 in MNT-1 significantly reduced melanin levels in vitro (Fig. 7a and Supplementary Fig. 27), while the negative control CD63-GFP had no significant effects. Importantly, overexpression of CYB561A3 had a considerably larger impact on melanin levels compared to TMEM138 (log2FC = −2.2 versus −0.34, Fig. 7a) and did not affect cell proliferation in MNT-1 (Supplementary Fig. 27c).
Fig. 7: CYB561A3 affects melanin levels in MNT-1.
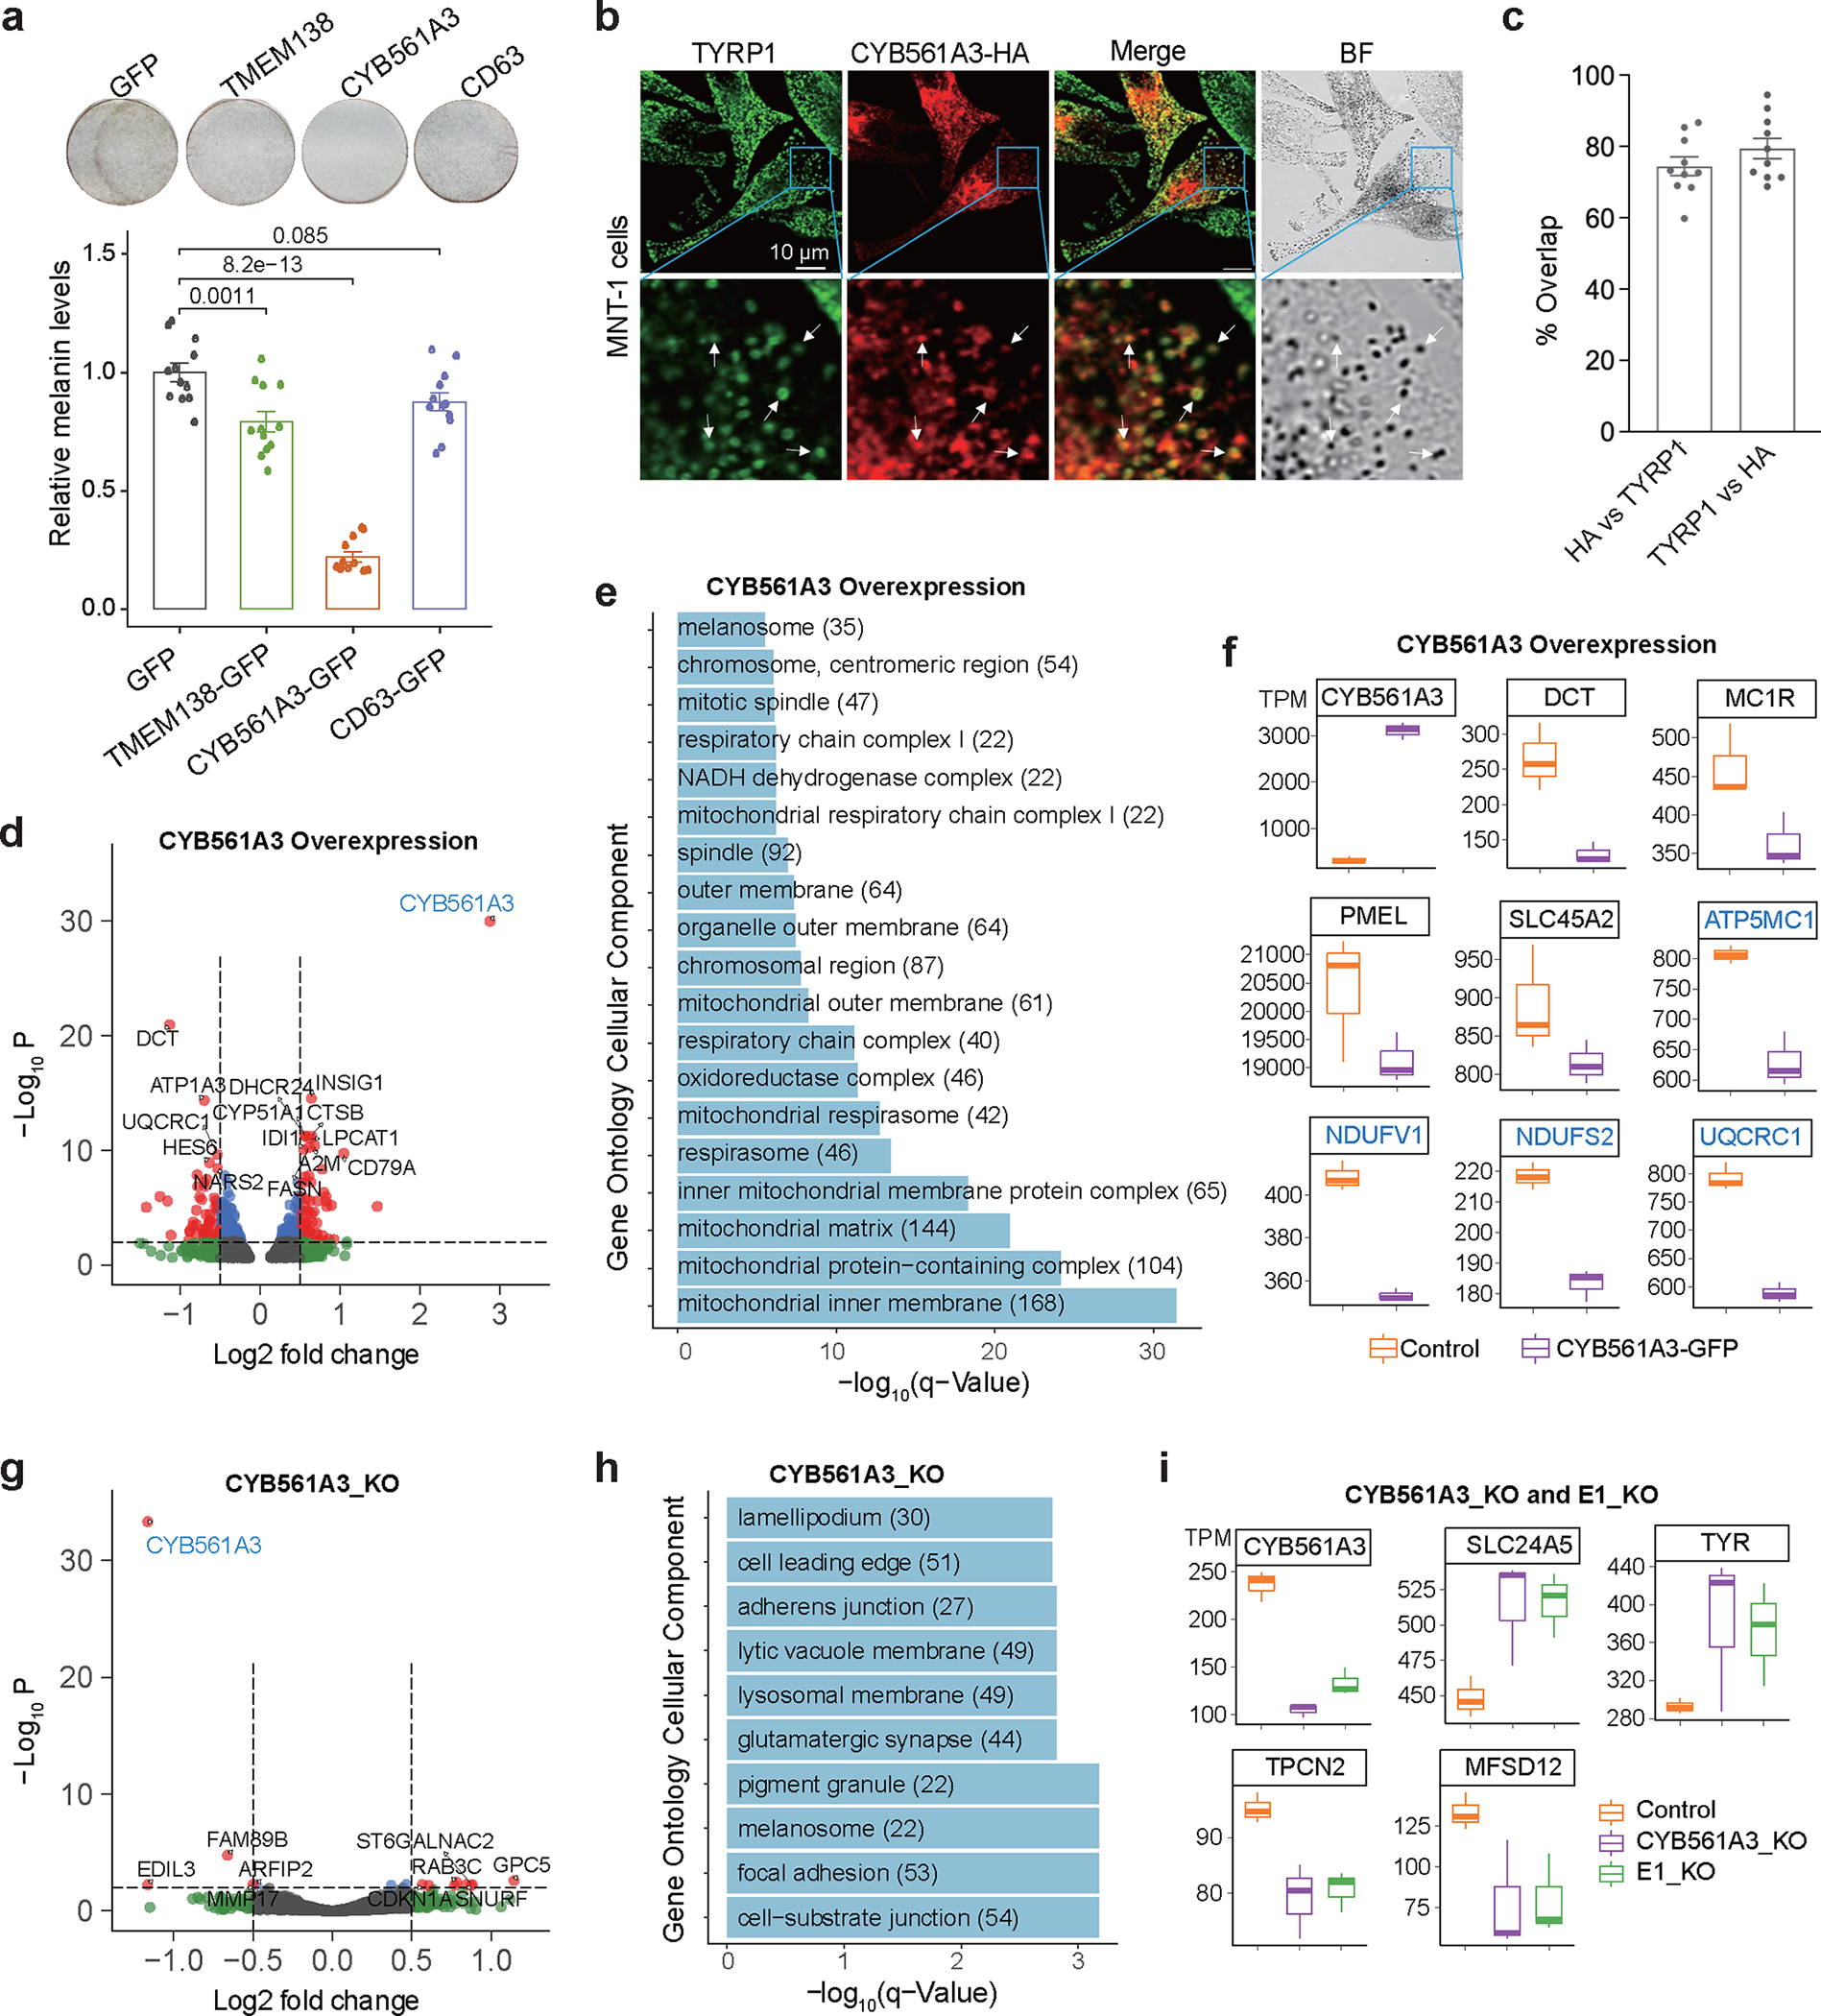
(a) Overexpression of CYB561A3 significantly decreases melanin levels in MNT-1. Top panel shows photos of pigmentation levels of MNT-1 on the bottom of a 24-well plate. The MNT-1 were first treated with 150 μM phenylthiourea (PTU, inhibits the biosynthesis of melanin) for 9 days and then infected with lentivirus encoding GFP, TMEM138-GFP, CYB561A3-GFP or CD63-GFP for 7 days. CD63-GFP is a negative control which does not affect pigmentation. The p-values are calculated using two-sided Tukey’s test with adjustments for multiple comparisons (n = 12). (b) Confocal images of MNT-1 expressing CYB561A3-HA and immunostained with antibodies against the melanosomal marker TYRP1 (green) and HA (red). Scale bar: 10 μm. Bottom images represent the enlarged areas shown in blue boxes. Arrows point to regions of overlap (yellow) between CYB561A3-HA and TYRP1-positive cellular structures. Three independent experiments. (c) Quantification of the overlap between CYB561A3-HA and TYRP1 in MNT-1 (n = 10 cells from 3 independent experiments). (d) Volcano plot showing differentially expressed genes in CYB561A3-overexpressed MNT-1. The top 10 most differentially expressed genes were labeled. P was calculated by Wald’s test with multiple testing correction in DESeq2. (e) KEGG pathway analysis showed overexpression of CYB561A3 affects the expression of genes related to mitochondrial respiration and melanin production. (f) Overexpression of CYB561A3 affects the expression of genes related to melanosome and mitochondria function (n = 3). Genes involved in pigmentation were colored in black, and genes involved in mitochondrial function were colored in blue. (g) Volcano plot of differentially expressed genes in CYB561A3-knockout MNT-1. The top 10 differentially expressed genes were labeled, P was calculated by Wald’s test with multiple testing correction in DESeq2. (h) GO analysis showed that CYB561A3-knockout affects melanogenesis-related pathways. (i) Both knockout of CYB561A3 and deletion of enhancer E1 affect the expression of genes related to melanin production. Listed genes have p-values less than 0.05 based on DESeq2 (n = 3). For boxplots, central lines are median, with boxes extending from the 25th to the 75th percentiles. Whiskers further extend by ±1.5 times the interquartile range from the limits of each box. Data were presented as mean ± SEM.
To understand how CYB561A3 could regulate pigmentation, we investigated its sub-cellular localization using confocal imaging of immunostained HA-tagged human CYB561A3. In HeLa cells, CYB561A3-HA co-localized with the lysosomal protein LAMP1 (Supplementary Fig. 27d), as previously reported 51. In MNT-1, however, a significant fraction of CYB561A3-HA (79.45% ± 2.85%) co-localized with TYRP1 protein found primarily in mature melanosomes (Figs. 7b and 7c), suggesting that CYB561A3 might regulate pigmentation.
To investigate the transcriptome-wide effects of CYB561A3, we performed RNA-Seq of MNT-1 exogenously expressing CYB561A3 (Fig. 7d). Overexpression of CYB561A3 affects the expression of genes involved in mitochondrial respiration and melanin production (Figs. 7e and 7f, and Supplementary Fig. 28). Notably, the gene most strongly downregulated in MNT-1 overexpressing CYB561A3 was DCT (log2FC = −1.1, p = 1.1×10⁻²¹, DESeq2, Figs. 7d and 7f), which encodes an enzyme critical for melanin biosynthesis. In addition, other genes that directly or indirectly regulate melanosome function, including MC1R, PMEL, and SLC45A2, were also downregulated (Fig. 7f). Moreover, increased CYB561A3 expression also decreased the expression levels of genes related to mitochondrial function (Fig. 7f).
Similar to the deletion of the E1 enhancer of CYB561A3 (Fig. 6), partial CYB561A3-knockout (69%) had no significant effect on melanin levels in MNT-1, likely due to the already high levels of melanin in these cells (Supplementary Figs. 25c and 29). However, RNA-Seq of these CRISPR-modified cells showed that decreased CYB561A3 significantly altered the expression of genes related to melanosome in MNT-1 (Figs. 7g–i and Supplementary Fig. 30), consistent with the effects of E1-deletion described above (Fig. 6j and Supplementary Fig. 25e). For example, SLC24A5 and TYR, which positively regulate melanin production 54–56, were upregulated; whereas MFSD12 and TPCN2, which negatively regulate melanin production 13,57, were downregulated in cells with reduced CYB561A3 mRNA. Taken together, we identified CYB561A3 as a novel negative regulator of skin pigmentation.
Discussion
The San populations from Botswana have relatively light skin color compared to other African populations 5,13, possibly due to local adaptation, but the underlying genetic mechanism remains to be uncovered. We identified 77 Di-SNPs that are MFVs that alter enhancer activities in melanocyte-derived cells and validated the function of regulatory Di-SNPs near MITF, LEF1, TRPS1 and BLOC1S6 using LRA and CRISPR-based experiments. MITF, LEF1 and TRPS1 play important roles in the Wnt signaling pathway 45,46,58–61, regulating the development of melanocytes and hair 62,63. Given that the San have relatively light skin color and a unique hair morphology compared to other African populations 18,64, these Di-SNPs may not only contribute to the light skin color of the San but also play a role in their hair phenotypes. These results shed light on the genetics and evolutionary history of light skin color in the San population.
Most of the GWAS-SNPs and Di-SNPs (> 98%) are located in noncoding regions, and SNPs in noncoding cis-regulatory elements could impact the expression of several genes, making it more difficult to directly determine the leading causal variants and their target genes 65. Indeed, we discovered that the enhancer harboring rs6510760 affects the expression of MFSD12 and HMG20B, both of which may impact pigmentation phenotypes; the enhancer harboring rs6497271 regulates the transcription of OCA2 and HERC2; the enhancer harboring rs7948623 affects the expression of CYB561A3 and TMEM138, with a smaller effect on DDB1. These results revealed that one variant could affect multiple genes and, thus, have pleiotropic effects.
Human skin color variation is likely determined by hundreds of loci 4–13,66,67. Inclusion of ethnically diverse and underrepresented populations in future genetic studies will be informative for identifying more loci underlying human skin pigmentation, as well as other variable phenotypes. In addition, since the causal variants/genes at most GWAS loci have not been confirmed, there is an urgent need for experimental validation. MPRA and CRISPR-based screens are promising high-throughput methods for transforming associations into causations, which will broaden our knowledge of complex traits and the treatment of human diseases.
Methods
Samples and ethics
The collection of samples and data for this study conformed to all relevant ethical regulations. Before sample collection, we obtained permits from local institutions in Africa. An appropriate IRB (Institutional Review Board) approval was also obtained from the University of Pennsylvania. All individuals involved in this study have approved written informed consents. For the details of the sample information of the 5M array data, see Crawford et al. 13. For the details of sample information of the 180 WGS data, see Fan et al 18. The melanin index data was inferred using red reflectance values from skin in a minimally sun-exposed region (underside of the arm), as detailed in Crawford et al. 13.
Cell lines and cell culture
MNT-1 (ATCC, #CRL- 3450), a gift from Dr. Michael S. Marks at Children’s Hospital of Philadelphia Research Institute, were grown in DMEM (Gibco, #11965084) supplemented with 20% Fetal Bovine Serum (FBS), 1% GlutaMAX (Gibco, #35050061), 1% NEAA (Gibco, #10370021), 1% penicillin/streptomycin (Gibco, #15140122), and 10% AIM-V (Gibco, # 12055–091).
WM88 (Rockland, #WM88–01-0001), a melanocytic patient-derived melanoma tumor cell line, a gift from Dr. Ashani Weeraratna at Wistar Institute, was cultured in Tumor Specialized medium (80% MCDB153, 20% Leibovitz’s L-15, supplemented with 2% fetal bovine serum (FBS) and 1.68 mM CaCl2).
HeLa cells (CCL-2, ATCC) were cultured in DMEM supplemented with 10% FBS and 100 units/mL penicillin/streptomycin. Lenti-X 293T cells (Takara, # 632180) were cultured in DMEM (Gibco, #11965084) supplemented with 10% FBS and 1% penicillin/streptomycin (Gibco, #15140122). All cells were cultured at 37°C with 5% CO2 in a humidified incubator.
Genome-wide association analysis
We conducted a genome-wide association analysis of skin color variation using 32,574,188 SNPs imputed from a previously published Illumina 5M SNP array dataset 13 of 1544 African samples originating from Ethiopia, Tanzania, and Botswana (GWAS-All). The SNPs were imputed using the following reference datasets: the 180 WGS 18 data was merged with SGDP 49 samples. Briefly, we imputed the 5M array data 13 using Minimac3 and excluded SNPs with low quality (genotype quality score < 0.3) and low frequency (MAF < 0.00001 in the pooled dataset). The GWAS was conducted using a linear mixed model (EMMAX 73) implemented in EPACTS 74 (Efficient and Parallelizable Association Container Toolbox, v3.3.0), and using kinship, sex, age, and top 10 PCs as covariates. We also performed a GWAS for 505 individuals from Botswana (GWAS-Bots, which includes 314 San individuals, and is a subset of the GWAS-All dataset) using the same software and parameters. The script used is: epacts single –vcf [input.vcf.gz] --ped [input.ped] --min-maf 0.01 --kinf [input.kinf] --pheno [PHENO_NAME] --cov [COV1] --cov [COV2] --out [outprefix] --run [# of parallel jobs] --test q.emmax –anno. The association results were ranked based on p-values and the top 4999 SNPs were selected for downstream functional analysis.
Di analysis
To identify highly differentiated SNPs between the relatively lightly pigmented San population (Ju|’hoan and !Xoo) and other African populations, we calculated the Di values for 9,413,188 variants from our 180G dataset (12 populations, 15 samples per population, Fan et al. 18) and selected SNPs with the top 0.1% di values for downstream functional analysis as described in Fan et al. 18. The Di statistic is calculated using the following equation:
where is the Fst value at a SNP site between population and and is the mean and standard deviation of values. measures the proportion of the genetic variance contained in a subpopulation relative to the genetic variance in all populations. Values range from 0 to 1, with higher values indicating greater genetic differentiation between populations 75. We performed 3 Di analyses: Ju|’hoan and !Xoo vs other populations; Ju|’hoan vs other populations (excluding the !Xoo); !Xoo vs other populations (excluding the Ju|’hoan). SNP enrichment analyses were conducted using GREAT (V4.04) 76 and FUMA (V1.5.4) 77. GREAT and FUMA calculate statistics by associating SNPs with their two nearest genes and use the genes as input for enrichment analysis.
SNP filtering and selection
We selected GWAS SNPs for the massively parallel reporter assay located within melanocyte open chromatin regions (ATAC-Seq/DNase-Seq peaks from melanoma cells and melanocytes) using the following 18 datasets from the ENCODE 68 and GEO 78 databases: GSM2476338, GSM2476339, GSM2476340, GSM2575295, GSM3083210, GSM774243, GSM1024610, GSM774244, GSM816631, GSM1027307, GSM1027312, GSM1014535, GSM1024793, GSM1024779, ENCFF560LQG, ENCFF600JNF, ENCFF862XVF, GSM1008599. We used GNU Wget v1.21.3 to download data from ENCODE. To select Di-SNPs related to skin pigmentation, we overlapped the top 0.1% Di-SNPs with melanocyte open chromatin regions as described above. We then focused on the Di-SNPs located within 1Mb distance to the TSS of 760 candidate pigmentation related genes. The 760 pigmentation-related genes were manually collected from 3 sources: 107 genes associated with pigmentation phenotype in mice (https://www.mousephenotype.org/data/phenotypes/MP:0001186) 79; 650 genes from a published review 80; top 100 genes highly expressed in the SK-MEL-30 cell line based on the protein atlas database 81.
Luciferase reporter assay
The MNT-1 and WM88 cell lines were used for luciferase reporter assays. The cells were plated in 24-well plates at 0.1M per well, and 500 ng firefly luciferase plasmid, 20 ng pRL Renilla luciferase plasmid (Promega, # E2231) and 1.5 μL Lipofectamine 3000 (Invitrogen, #L3000150) were added to each well. 36 hours post-transfection, luciferase activity was determined using Dual-Luciferase Assay kit (Promega, # E1910) according to manufacturer instructions. The luminescence signal was detected in a white 96-well plate using a SpectraMax i3x Multi-Mode Microplate Reader. The reporter gene activity of firefly luciferase was normalized to that of Renilla luciferase to determine the activity of functional elements.
Plasmid cloning
For luciferase assay, human enhancer elements were cloned using genomic DNA extracted from MNT-1. The amplified enhancer fragments were sequenced and ligated to PGL4.23 vector (Promega, #E8411) using Gibson assembly (NEB, #E2621). Candidate functional SNPs were introduced by mutated primers. For CRISPR inhibition experiments, sgRNAs were designed at IDT (https://www.idtdna.com/site/order/designtool/index/CRISPR_CUSTOM) or CRISPOR (http://crispor.tefor.net/) and cloned into pLKO5.sgRNA.EFS.GFP (Addgene, #57822) backbone vector using BsmBI. For CYB561A3 and TMEM138 cloning and expression, pL-CRISPR.EFS.GFP (Addgene, #57818) plasmid was digested using Bamh1 and Nhe1, and the 7.5kb fragment was gel extracted as the vector backbone. Human CYB561A3 and TMEM138 CDS were PCR amplified using cDNA from MNT-1. The CDS and vector (7.5kb) fragments were assembled by Gibson assembly and transformed into Stbl3 competent cells. Plasmids were extracted using NucleoSpin Transfection-grade Kit (Takara, #740490.250) and sequenced to confirm the plasmid sequence. Oligo sequences are listed in the supplementary table.
CRISPR knockout and inhibition
To perform enhancer CRISPR knockout or inhibition, we first constructed MNT-1 stable-expressing Cas9 (lentiCRISPR v2, Addgene, #52961) or dCas9-KRAB-MeCP2 (Addgene, #110821). Then, we produced lentiCRISPR v2 (KO) and dCas9-KRAB-MeCP2 (CRISPRi) lentiviruses following the published protocol 19. Then, MNT-1 were infected with each virus with 8 μg/mL Polybrene (Sigma CatNo.H9268). For KO cell line, 24hrs post infection, medium was replaced using full medium with Puromycin (2 μg/mL, Gibco, #A1113803), medium was changed every 24 hours. After selection for 5 days, the MNT-1 were passaged to a 10cm plate. The MNT-1-Cas9 cells were frozen for CRISPR-KO experiments. For CRISPRi cell line, all procedures are similar except that the cells were selected with Blasticidin (5 μg/mL, Gibco, #A1113903).
For CRISPR knockout of the enhancers, MNT-1 stable-expressing Cas9 were seeded in 24-well plates at a density of 0.05M per well and cultured for 24 hours. Then the medium was changed to fresh medium with 8 μg/mL Polybrene before infection. PLKO5-sgRNA (target to enhancer) viruses were added at ~10 MOI, plates were centrifuged at 1000g for 30min at 32 °C. 24 hours post infection, medium was replaced using full medium with Puromycin (2 μg/mL), and changed every 24hrs. 5 days after infection, the cells were harvested for total RNA extraction or melanin assay.
For enhancer CRISPR inhibition, MNT-1 stably expressing dCas9-KRAB-Mecp2 cells were seeded in 24-well plates at a density of 0.05M per well and cultured for 24 hours. The medium was changed to fresh medium with 8 μg/mL Polybrene (MNT-1) before infection. PLKO5-sgRNA virus were added at ~10 MOI, plates were centrifuged at 1000g for 30min at 32 °C. 24 hours post infection, medium was replaced using full medium with Blasticidin (5 μg/mL) and was changed every 24 hrs. 5 days after infection. Finally, the cells were harvested for RNA extraction or melanin assay.
RT-qPCR and RNA-Seq
Total RNA was purified from all the cultured cells (CRISPR KO, CRISPR inhibition, Overexpression) using Direct-zol RNA Miniprep Kits (Zymo, R2052) following manufacturer’s instructions, and concentration was determined by a Nanodrop. For RT-qPCR, 200–500 ng RNA was used for reverse transcription using M-MLV Reverse Transcriptase (Promega, # M1701) and Random Primer Mix (NEB, S1330). qPCR was conducted using Luna Universal qPCR Master Mix (NEB, M3003) on a QuantStudio 6 Flex Real-Time PCR machine (see primers in Supplementary Table 8). For RNA-Seq, a total of 500 ng RNA was sent to Genewiz to prepare sequencing libraries (see details at https://web.genewiz.com/rna-seq-faq), Briefly, mRNA was selected by Poly(A) enrichment, followed by fragmentation and reverse transcription, and addition of sequencing adapters and amplification. The final library was sequenced on HiSeq 2000 (150bp PE) at a depth of 20 million reads per library.
Immunostaining
Human CYB561A3 in pCMV-C-HA (Sino Biological, HG16893-CY) was transiently expressed in MNT-1 or HeLa cells using TransIT-LT1 Transfection Reagent (Mirus Bio) according to the manufacturers’ instructions. Transfected cells on glass coverslips were fixed with 4% paraformaldehyde at room temperature for 15 min. Cells were incubated with 50 mM NH4Cl for 10 min to quench free aldehyde groups, followed by incubation with blocking solution (0.2% saponin, 0.1% BSA, 0.02% sodium azide) containing primary antibodies for 1 hr at room temperature. Following 4 × 5 min PBS washes, coverslips were incubated in fluorescently labeled secondary antibodies in blocking solution for 1 hr at room temperature. Coverslips were washed with PBS for 5 mins (4 times) and inverted onto slides with ProLong Diamond Antifade Mountant. Antibodies used were mouse anti-TYRP1 (TA99/mel-5, 1:100, BioLegend), mouse anti-LAMP2 (H4A3, 1:20, Developmental Studies Hybridoma Bank), and rat anti-HA (ROAHAHA, 1:50, Roche). Host-specific secondary antibodies were conjugated to AlexaFluor 488 or 568 and used at a dilution of 1:1000.
Confocal microscopy and image analysis
Images were acquired using an Olympus FV3000 laser scanning confocal microscope with a 60x objective (1.3 NA; UPlan Super Apochromat). Colocalization analysis was performed using CellSens Dimension (v. 3.2). Briefly, each multichannel image was converted into an 8-bit image with a single channel. A region of interest (ROI) > 10% of the cell surface area with low organelle density was selected for analysis. We generated binary images using the multiply channels operation, composite images were generated of two channels, where the total fluorescence of composite images was divided by the fluorescence of each single channel to calculate the percent overlap between channels.
Melanin assay
MNT-1 cells were washed with PBS twice and detached with 0.25% trypsin. The cells were pelleted at 300 g for 3 mins at room temperature, and the supernatant was removed gently. The cell pellet was washed once with PBS and lysed in 200 μL lysis buffer (50 mM Tris-HCl, pH 7.4, 2 mM EDTA, 150 mM NaCl, 1 mM dithiothreitol) per million cells. The lysis was vortex 3 times, every 5 minutes and then spanned down at 12,000 g for 10 mins at 4°C. 50 μL supernatant was saved for protein quantification (BCA assay, Thermo Scientific, #23225). Then, 150 μL 2X Protease Lysis buffer (20 mM Tris (pH 8), 200 mM NaCl, 50 mM EDTA, 1% SDS, 0.5 mg/mL proteinase K) was added to the rest lysate to digest the pellet. Pellets were rotated at 65 °C for 5 hours and span down at 12,000g for 10 min to collect melanin. The melanin pellets were dissolved in 0.45 mL buffer N (2M NaOH/ 20% DMSO) and incubated at 60°C for 30 mins with shaking. Once melanin has fully dissolved (or if not, sonicated for 5 mins). The melanin concentration was measured by absorbance at 450 nm. If necessary, the melanin was diluted so that the absorbance value is less than 0.35.
MPRA
We performed MPRA following the lentiMPRA19 protocol with minor modifications, see details in Supplementary Notes. 3 and 4. The data analysis workflow was illustrated in Supplementary Fig. 4. Specifically, The paired-end 150bp reads (R1 and R3) covering the 200bp enhancer fragments were merged using Flash82 (-m 50 -M 92). We obtained 98.6 million merged reads of which 46.1% had the expected 200bp length, 30.1% were 1 bp short, and 11.7% were 2 bp short (short reads were excluded from downstream analysis). We extracted the 15bp barcodes (R2) associated with each merged read and filtered out low-quality read pairs. At this step, we had 29.3M high-quality read pairs (R1_ R3_ R2). We aligned the merged sequences to the reference enhancer sequences using BWA (bwa mem -t 4 -L 50 -k 10 -O 6 -B 5). To construct a unique enhancer-barcode dictionary, we removed repeated enhancer-barcode pairs and low-frequency pairs (< 3 read pairs). We also filter the pairs using the SAM-CIGAR string ($3==“200M” && $4==“MD:Z:200”) to remove errors introduced by synthesizing and/or sequencing. The average barcode types per oligo is 126, and the average barcode count per oligo is 4284 in the pre-library (Asso_Lib). In this library, there are 1102 reference alleles, 1103 alternative alleles, 148 negative controls, and 30 positive controls. We sequenced the barcodes using pair-end 15bp reads (r1 and r3) and merged them using Flash82 (-m 15 -M 15). We filtered out low-quality read pairs (r1_r3_r2) using fastp 83 and removed PCR duplicates based on UMI. At this step, we have 66%–74% reads remaining for barcode counting. We matched and counted the barcodes in the DNA and RNA libraries based on the enhancer-barcode associated library. Around 32% of the barcodes in the DNA and RNA libraries could be found in the association library. We detected 1099 Ref-Alt pairs (SNPs) in the DNA and RNA libraries. After obtaining the raw barcode counts from the DNA and RNA libraries, we performed allele-specific effect (ASE) analysis using the R package “mpra” 21. We prepared KxS integer matrices (K is barcode count, S is sample) and constructed a MPRASet object for both DNA and RNA libraries. We applied weighted linear models to test for differential enhancer activity using mpralm (normalize = TRUE, model_type = “corr_groups”).
RNA-Seq analysis
Raw RNA-Seq fastq files were retrieved from Genewiz server, and read quality was checked using FastQC (https://github.com/s-andrews/FastQC). Low-quality reads and adapters were filtered out using fastp 83 with default settings. Reference transcriptome (refMrna.fa.gz, hg38) and gene annotation (refGene.txt.gz, hg38) was downloaded from UCSC database. Transcript abundance was quantified by kallisto 84 with default settings. Gene level read counts were calculated using Tximport package 85 and genes with mean read count less than 10 were discarded. Differential expression genes were identified using DESeq2 86 and DEBrowser 87. Differential expressed genes with adjusted p-value or unadjusted p-value less than 0.05 were selected for volcano plot using EnhancedVolcano 88 package. Pathway enrichment analysis was performed using Pathview 89.
ATAC-Seq
MNT-1 or WM88 cells were washed with PBS twice and detached with 0.25% trypsin. The cells were pelleted at 500g for 5 mins at 4°C and the cell density was quantified by an Automated Cell Counter. Then, 50,000 viable cells were used for ATAC-seq following the Omni-ATAC protocol 90. Tn5 tagmentase was purchased from Diagenode (Cat. No. C01070010).
Each ATAC-seq library was sequenced at a depth of > 40 M pair-end reads by Nextseq 550. Then, the raw fastq files were filtered using fastp (v 0.22.0) 83 with default settings and mapped using bowtie2 (v 2.4.1) 91 with parameters “--very-sensitive --maxins 1000”. Duplicates and low-quality reads were removed using MarkDuplicates from gatk92 (v 4.1.7.0) and samtools (v 1.13) 93 with parameters “-q 20 -F 1804 -f 2”. Bam files were converted to Bigwig files using deeptools2 (v 3.1.3) 94 with the setting “--normalizeUsing RPKM --binSize 10”. ATAC-seq peaks were called using macs2 (v 2.1.0.20150731) 95 with the setting “callpeak -t in.bam -g hs -f BAMPE -q 0.01 --keep-dup all”. The fraction of reads in peaks were calculated using featureCounts (v 2.0.3) 96. TSS enrichment plots and correlation analysis were conducted using deeptools294.
CUT&RUN
MNT-1 cells were washed with PBS twice and detached with 0.25% trypsin. The cells were pelleted at 500g for 5 mins at 4°C and then fixed with 0.1% formaldehyde at room temperature for 1.5 min. Then, cells were quenched by adding 2.5 M glycine solution to a final concentration of 0.2 M. Finally, 500,000 cells were used for CUT&RUN using the CUT&RUN Kit (Cat. No. 14–1048) from epicypher. The antibodies used for CUT&RUN include: MITF (CST, #97800), SOX10 (CST, #89356), and H3K27Ac (abcam, # ab4729). H3K4me3 and IgG antibodies were from the CUT&RUN kit. All procedures were conducted following the manufacturer’s manual.
Each CUT&RUN library was sequenced at a depth of > 8 M pair-end reads by Nextseq 550. First, H3K4me3 antibody specificity was determined using the SNAP-CUTANA K-MetStat Panel. Second, the raw fastq files were filtered using fastp (v 0.22.0) 83 with default settings and mapped using bowtie2 (v 2.4.1) 91 with parameters “--dovetail --very-sensitive-local -I 10 -X 700”. Duplicates and low-quality reads were removed using MarkDuplicates from gatk92 (v 4.1.7.0) and samtools (v 1.13) 93 with parameters “-q 20 -F 1804 -f 2”. Bam files were converted to Bedgraph and normalized using scale factors determined by spike-in Ecoli reads. Bam files were also converted to Bigwig files using deeptools2 (v 3.1.3) 94 with the setting “--normalizeUsing RPKM --binSize 10”. H3K27ac CUT&RUN peaks were called using macs2 (v 2.1.0.20150731) 95 with the setting “callpeak -t in.bam -g hs --broad --broad-cutoff 0.05 -f BAMPE --keep-dup all”. MITF, SOX10 and H3K4me3 CUT&RUN peaks were called using SEACR (v 1.3)97. The fraction of reads in peaks was calculated using featureCounts (v 2.0.3) 96. TSS enrichment and correlation were conducted using deeptools294.
Transcription factor binding analysis
We used “motifbreakR” 69 (v2.14.2) to predict the potential transcription factor binding motifs near functional SNPs. Briefly, we first transformed the SNP id to Granges using the “snps.from.rsid” function. Then, we used motifs from the hocomoco database98 to predict effects for candidate variants. We visualize the candidate broken motifs using the plotMB function.
Identification of SNP-Gene pairs by TAD and loops
To identify the SNPs and their potential target genes in the same TAD, we intersected the SNPs with all TADs called by onTAD 71 from all Hi-C experiments (see details in supplementary notes). Then, we intersected the TADs with transcription start sites (TSS) from all human genes. We paired SNPs and genes that are in the same TAD. To identify the SNPs and their potential target genes by Hi-C or H3K27ac HiChIP loops, we extended the SNPs and TSSs to 2kb fragments (SNP/TSS ± 1kb). Then, we intersected the anchors of loops with these 2kb bins and paired the SNPs and TSSs located in the anchors of the same loop.
Statistics and reproducibility
No statistical method was used to determine the sample size in advance. No data were excluded from the analyses. We randomly selected controls for MPRA. For confocal images and related quantification of MNT-1 cells, the cells were randomly selected. Other experiments were not randomized. The investigators were not blinded to allocation during the experiments and outcome assessment.
Additionally, the two-sided paired t-test is utilized to compare the means of two groups in luciferase reporter assays. Two-sided unpaired t-test is applied to compare the means of two groups with unpaired data, specifically in CRIPSRi and CRISPR-KO assays. When comparing the means among more than two groups, we initially conducted a one-way ANOVA. Subsequently, we performed the two-sided Tukey’s test with adjustments for multiple comparisons or the two-sided Dunnett’s test with adjustments for multiple comparisons (with control group). In the case of MPRA, the p-values were estimated using a random effects model for mpralm21, and paired t-tests were conducted with multiple testing adjustments.
Extended Data
Extended Data Fig. 1. Quality statistics of the MPRA experiments.
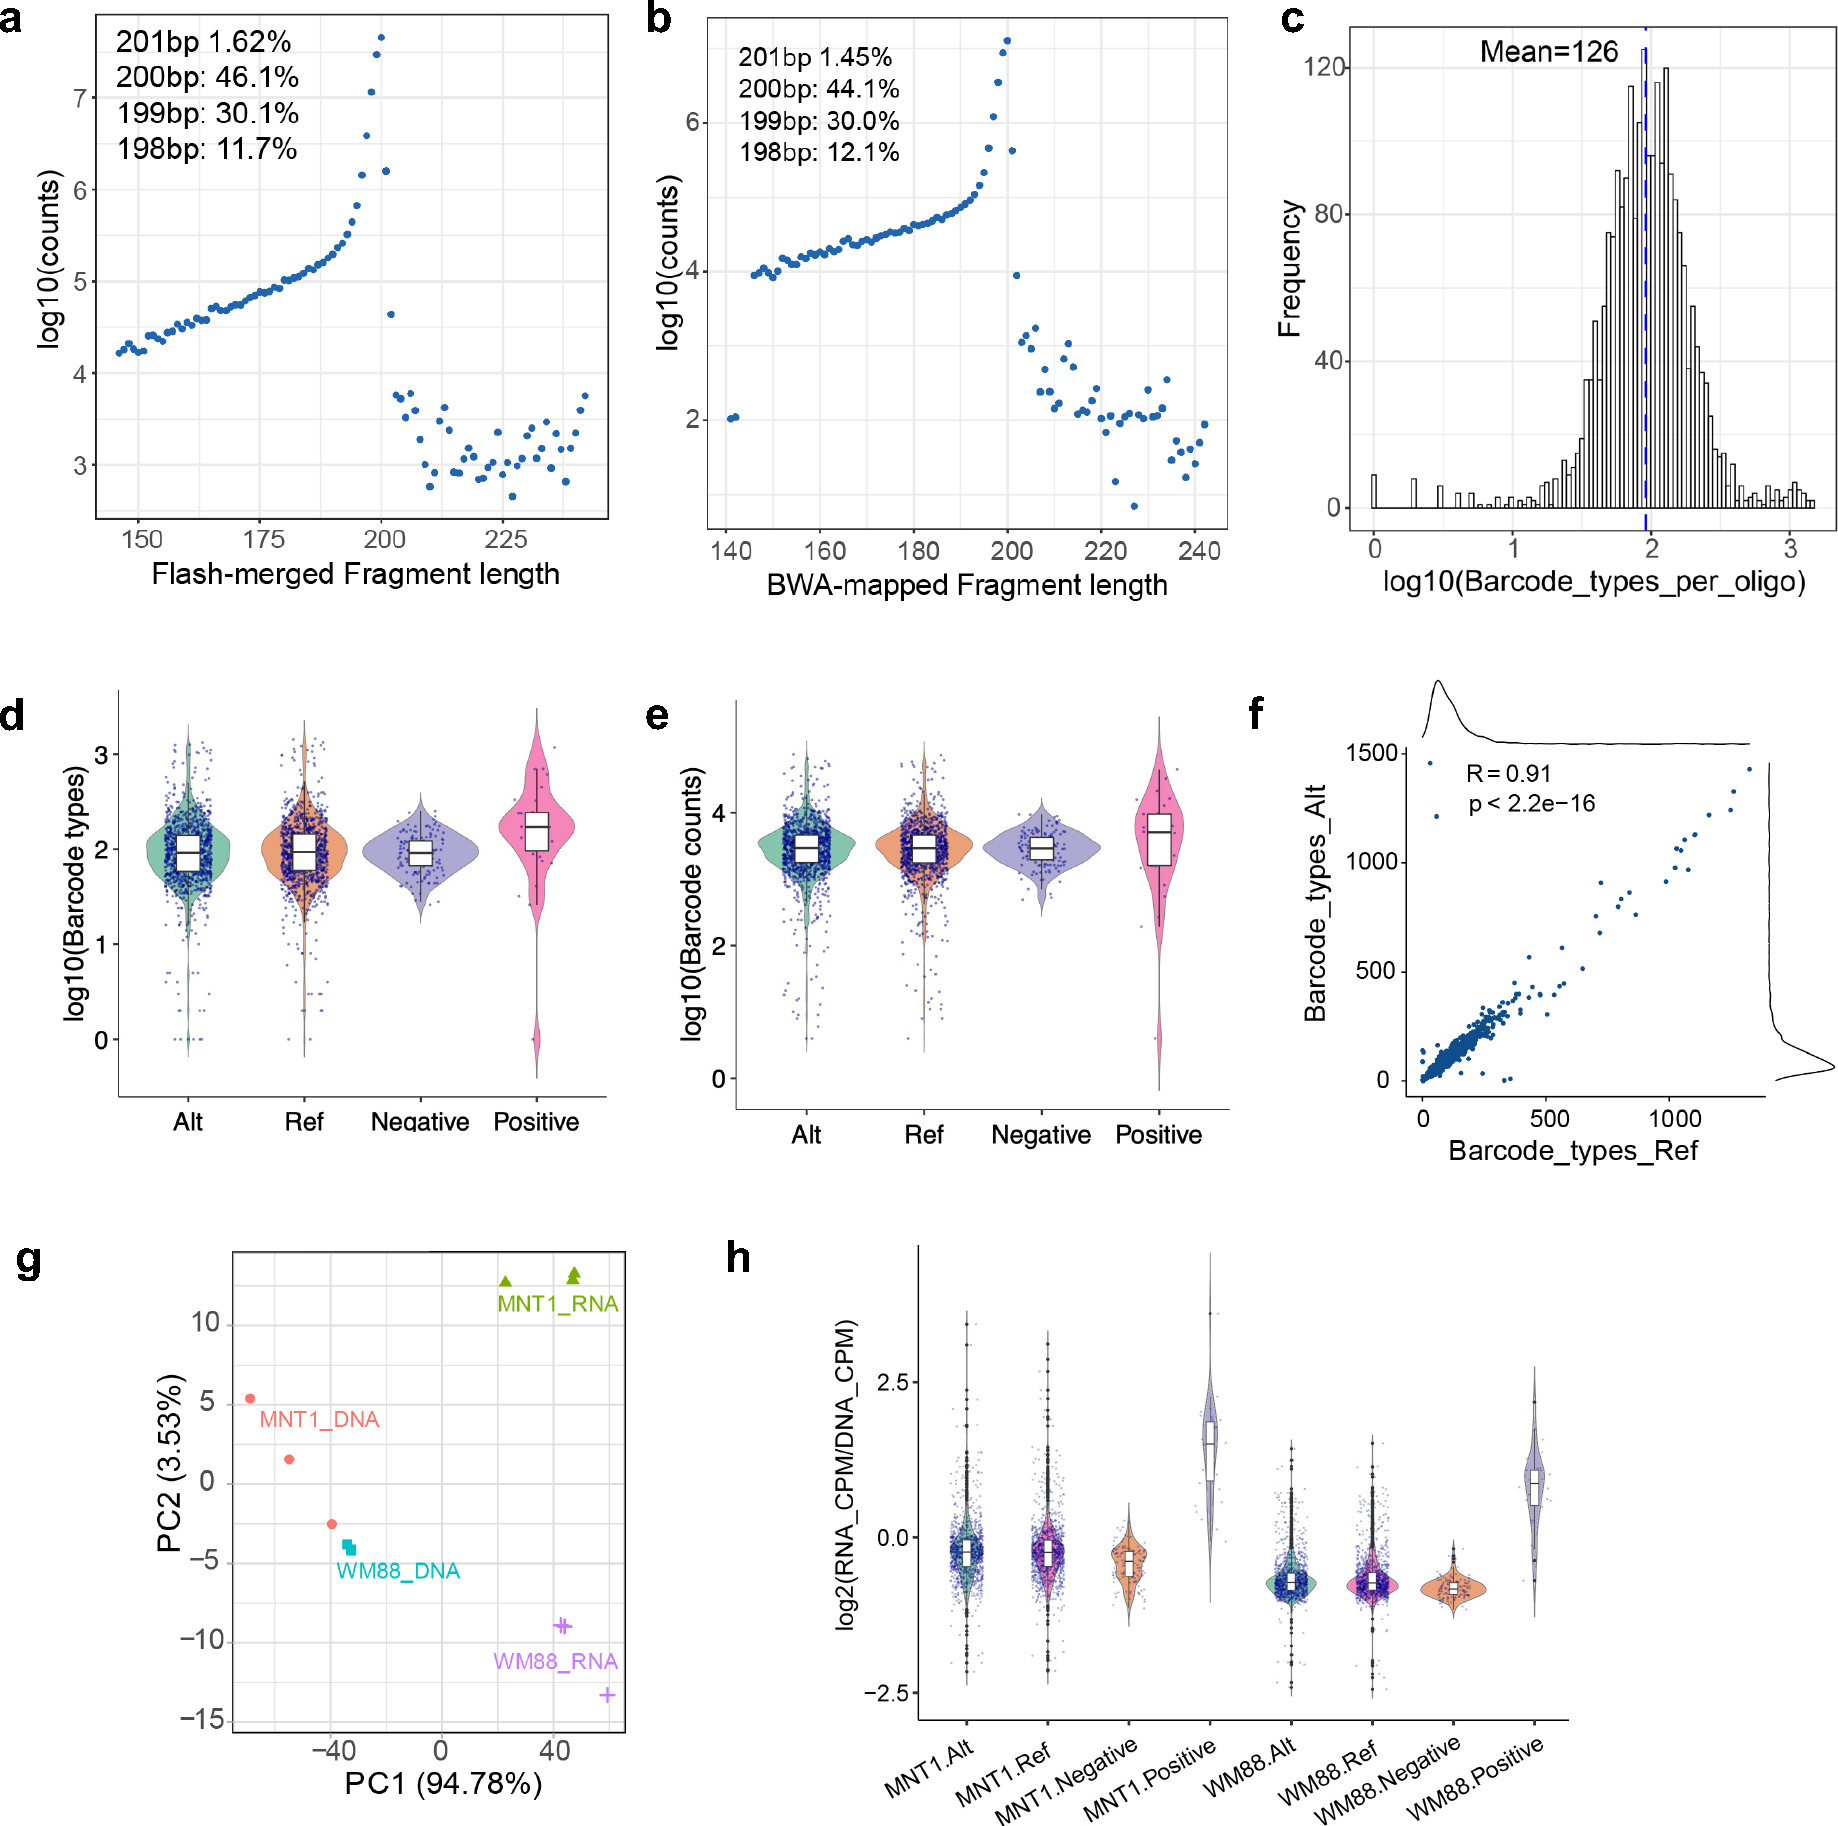
(a) Statistics for FLASH-merged reads in the association library. The plot showed that 46.1% are 200bp fragments as designed. (b) Statistics of BWA-mapped reads in the association library. The plot showed that 44.1% are 200bp fragments as designed. (c) Statistics of barcode types per oligo in the association library. On average, each oligo is linked with 126 different barcodes. (d) Statistics of barcode types per oligo in reference (n = 1102), alternative (n = 1103), negative control (n = 153), and positive control (n = 30) oligos. Data is from the association library. (e) Statistics of barcode counts per oligo in reference (n = 1102), alternative (n = 1103), negative control (n = 153), and positive control (n = 30) oligos. Data is from the association library. (f) Barcode types for reference and alternative alleles are comparable. Pearson’s r = 0.91, p < 2×10⁻¹⁶. (g) Principal component analysis of DNA and RNA libraries from MNT-1 and WM88 cells. Three replicates. (h) Summary of enhancer activities estimated by MPRA. Enhancer activities were defined as the barcode counts per million in the RNA library divided by the barcode counts per million in the DNA library. Alt: oligos containing alternative alleles (n = 1103). Ref: oligos containing reference alleles (n = 1102). Negative, negative control oligos (n = 148). Positive, positive control oligos (n = 30). For boxplots, central lines are median, with boxes extending from the 25th to the 75th percentiles. Whiskers further extend by ±1.5 times the interquartile range from the limits of each box.
Extended Data Fig. 2. MPRA identifies six allelic skewed variants near MFSD12.
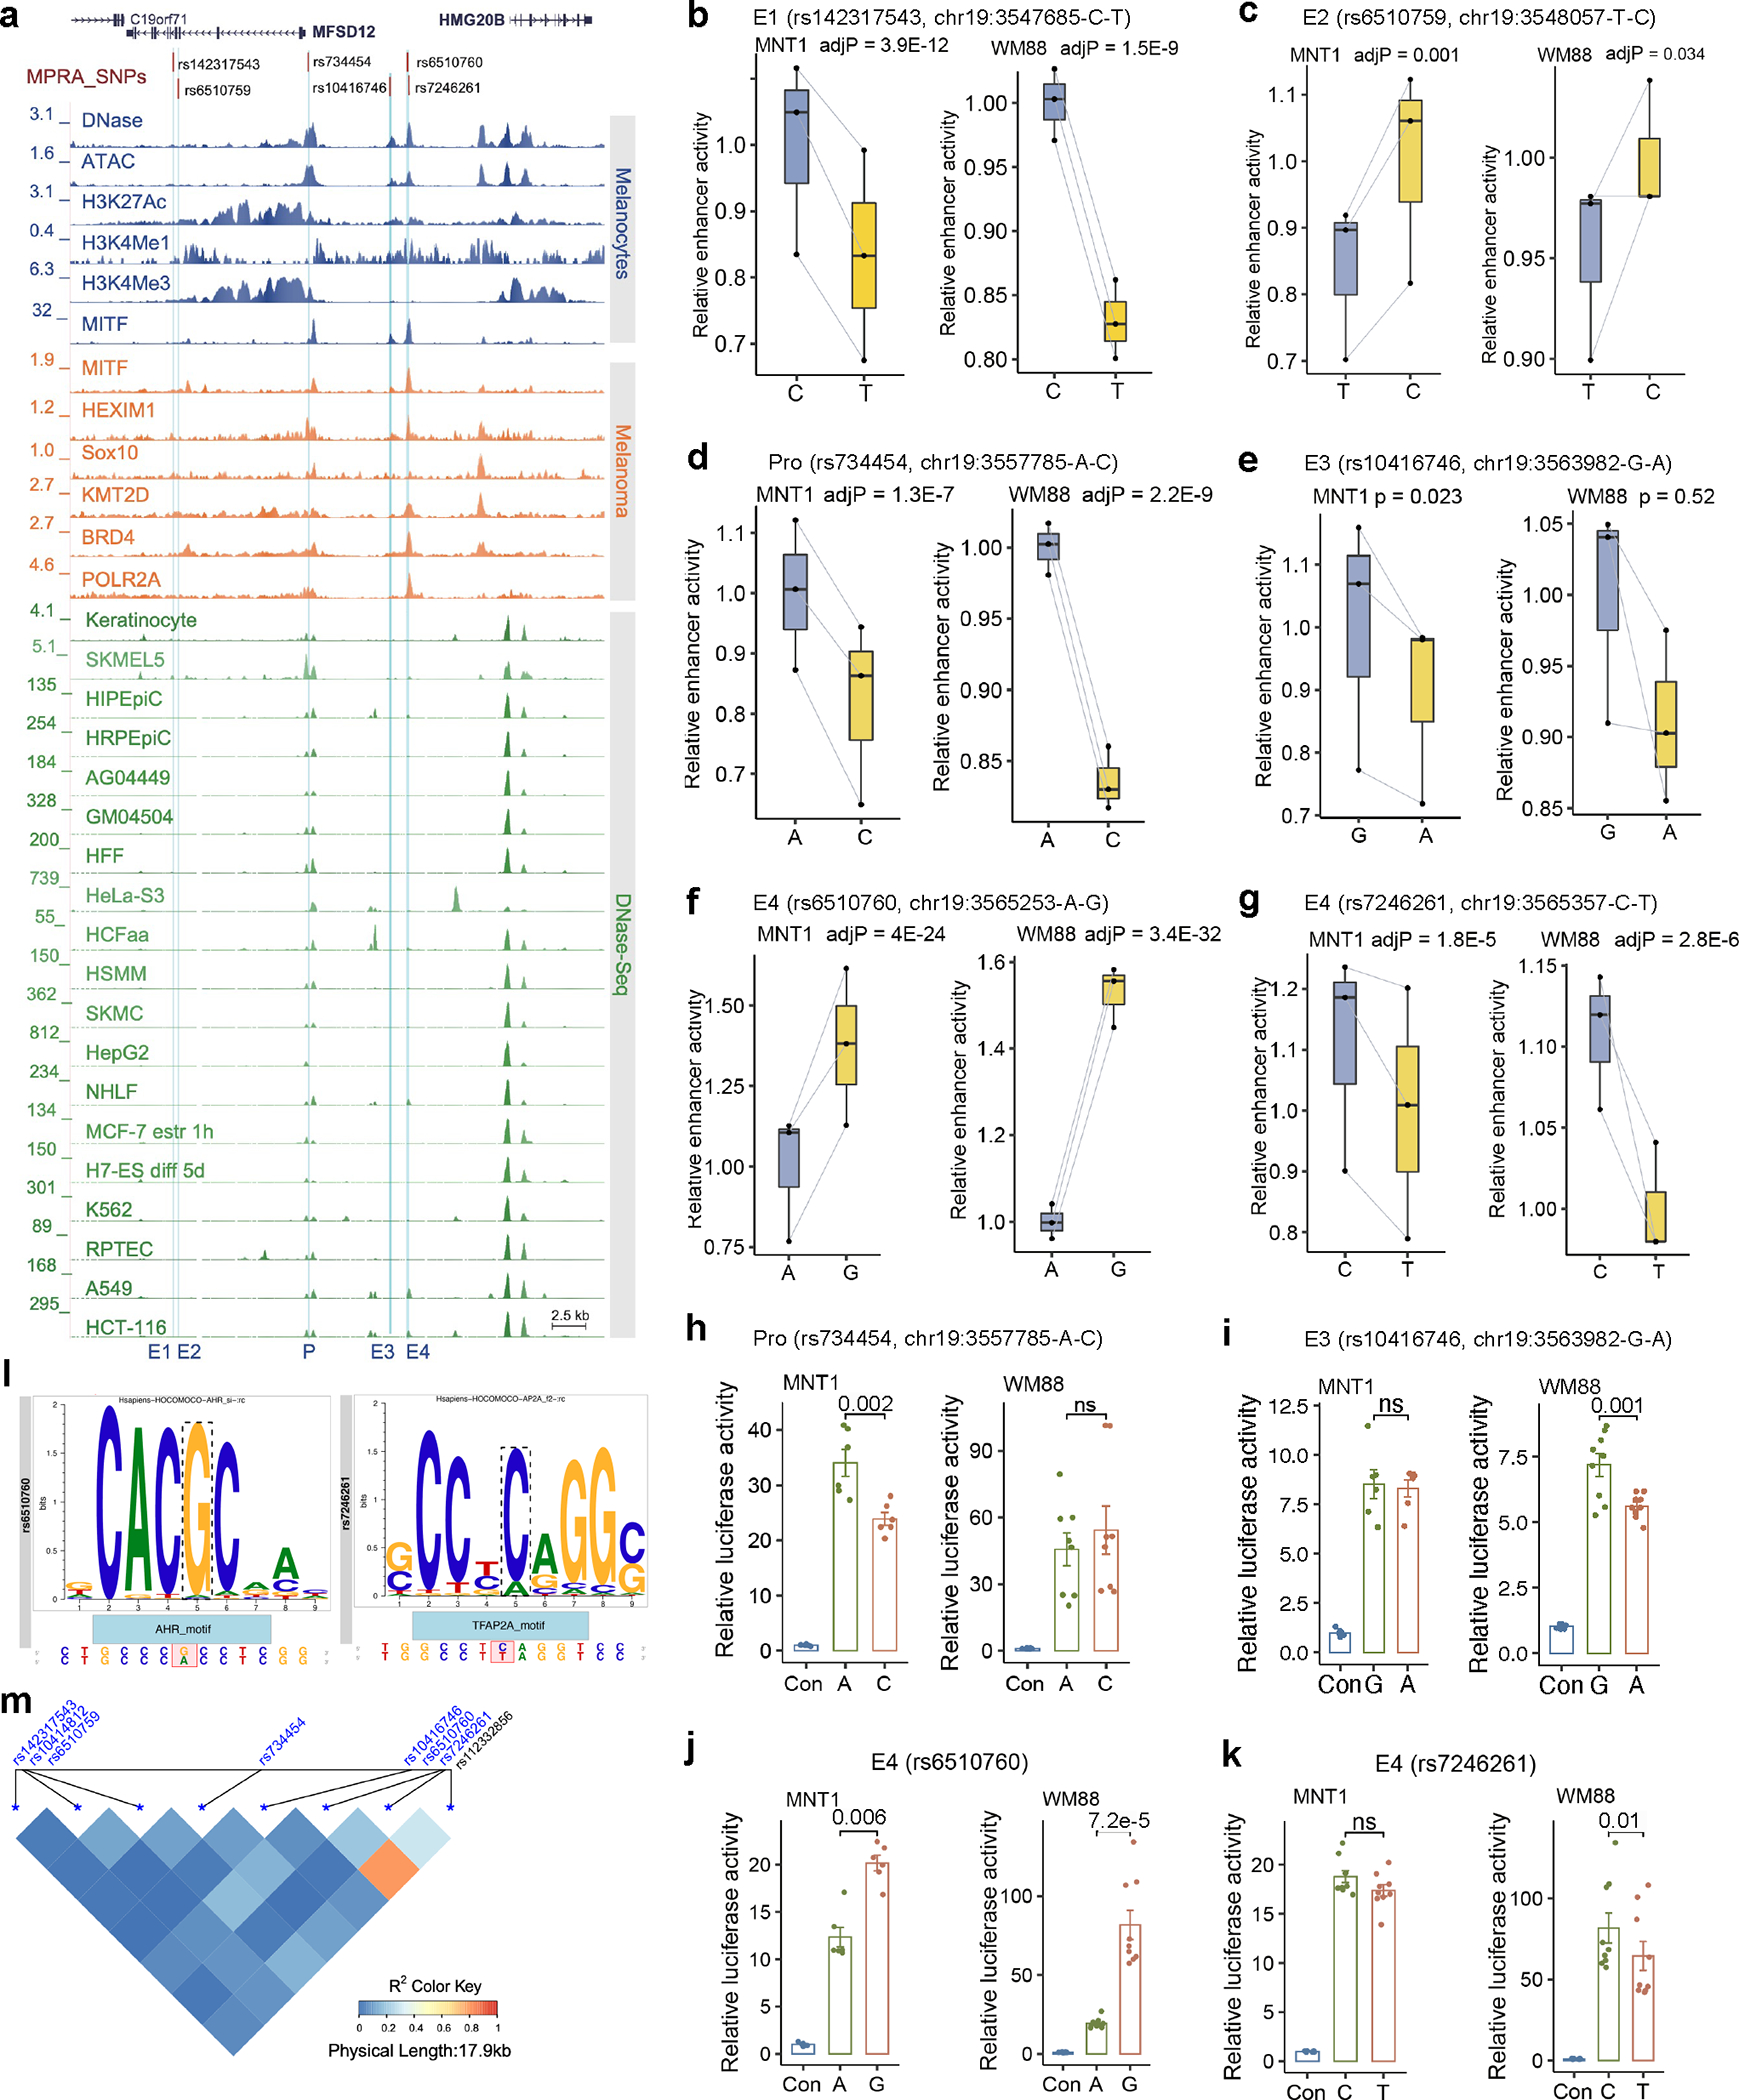
(a) Plot showing allelic skewed variants in regulatory regions near MFSD12. Blue tracks show DNase-Seq, ATAC-Seq, and ChIP-Seq data from melanocytes; orange tracks indicate ChIP-Seq data from melanoma (501-mel) cells, green tracks indicate DNase-Seq data from ENCODE cell lines. E1-E4, enhancers. P, promoter. (b-g) Relative enhancer activities of the two alleles at rs142317543, rs6510759, rs734454, rs10416746, rs6510760, rs7246261 estimated by MPRA (n = 3). For b, c, d, f, g, p-values were estimated with a random effects model for mpralm and paired t-tests with multiple testing adjustments; e was without multiple testing adjustments. (h-k) Relative enhancer activities estimated by LRA. Two-tailed paired t-tests (For LRA in MNT1, n=6. For LRA in WM88, 2h n=8; others n=9). Data were presented as mean ± SEM. ns p > 0.05. (l) rs6510760 and rs7246261 disrupt the binding motifs of AHR and TFAP2, respectively. Predicted by “MotifBreakR” 69. (m) The LD pattern of candidate functional variants near MFSD12. LD was calculated using the 180G 18 data by the LDheatmap 70 package. For boxplots, central lines are median, with boxes extending from the 25th to the 75th percentiles. Whiskers further extend by ±1.5 times the interquartile range from the limits of each box.
Extended Data Fig. 3. The enhancer E4 interacts with the promoter of MFSD12 and affects the expression of MFSD12.
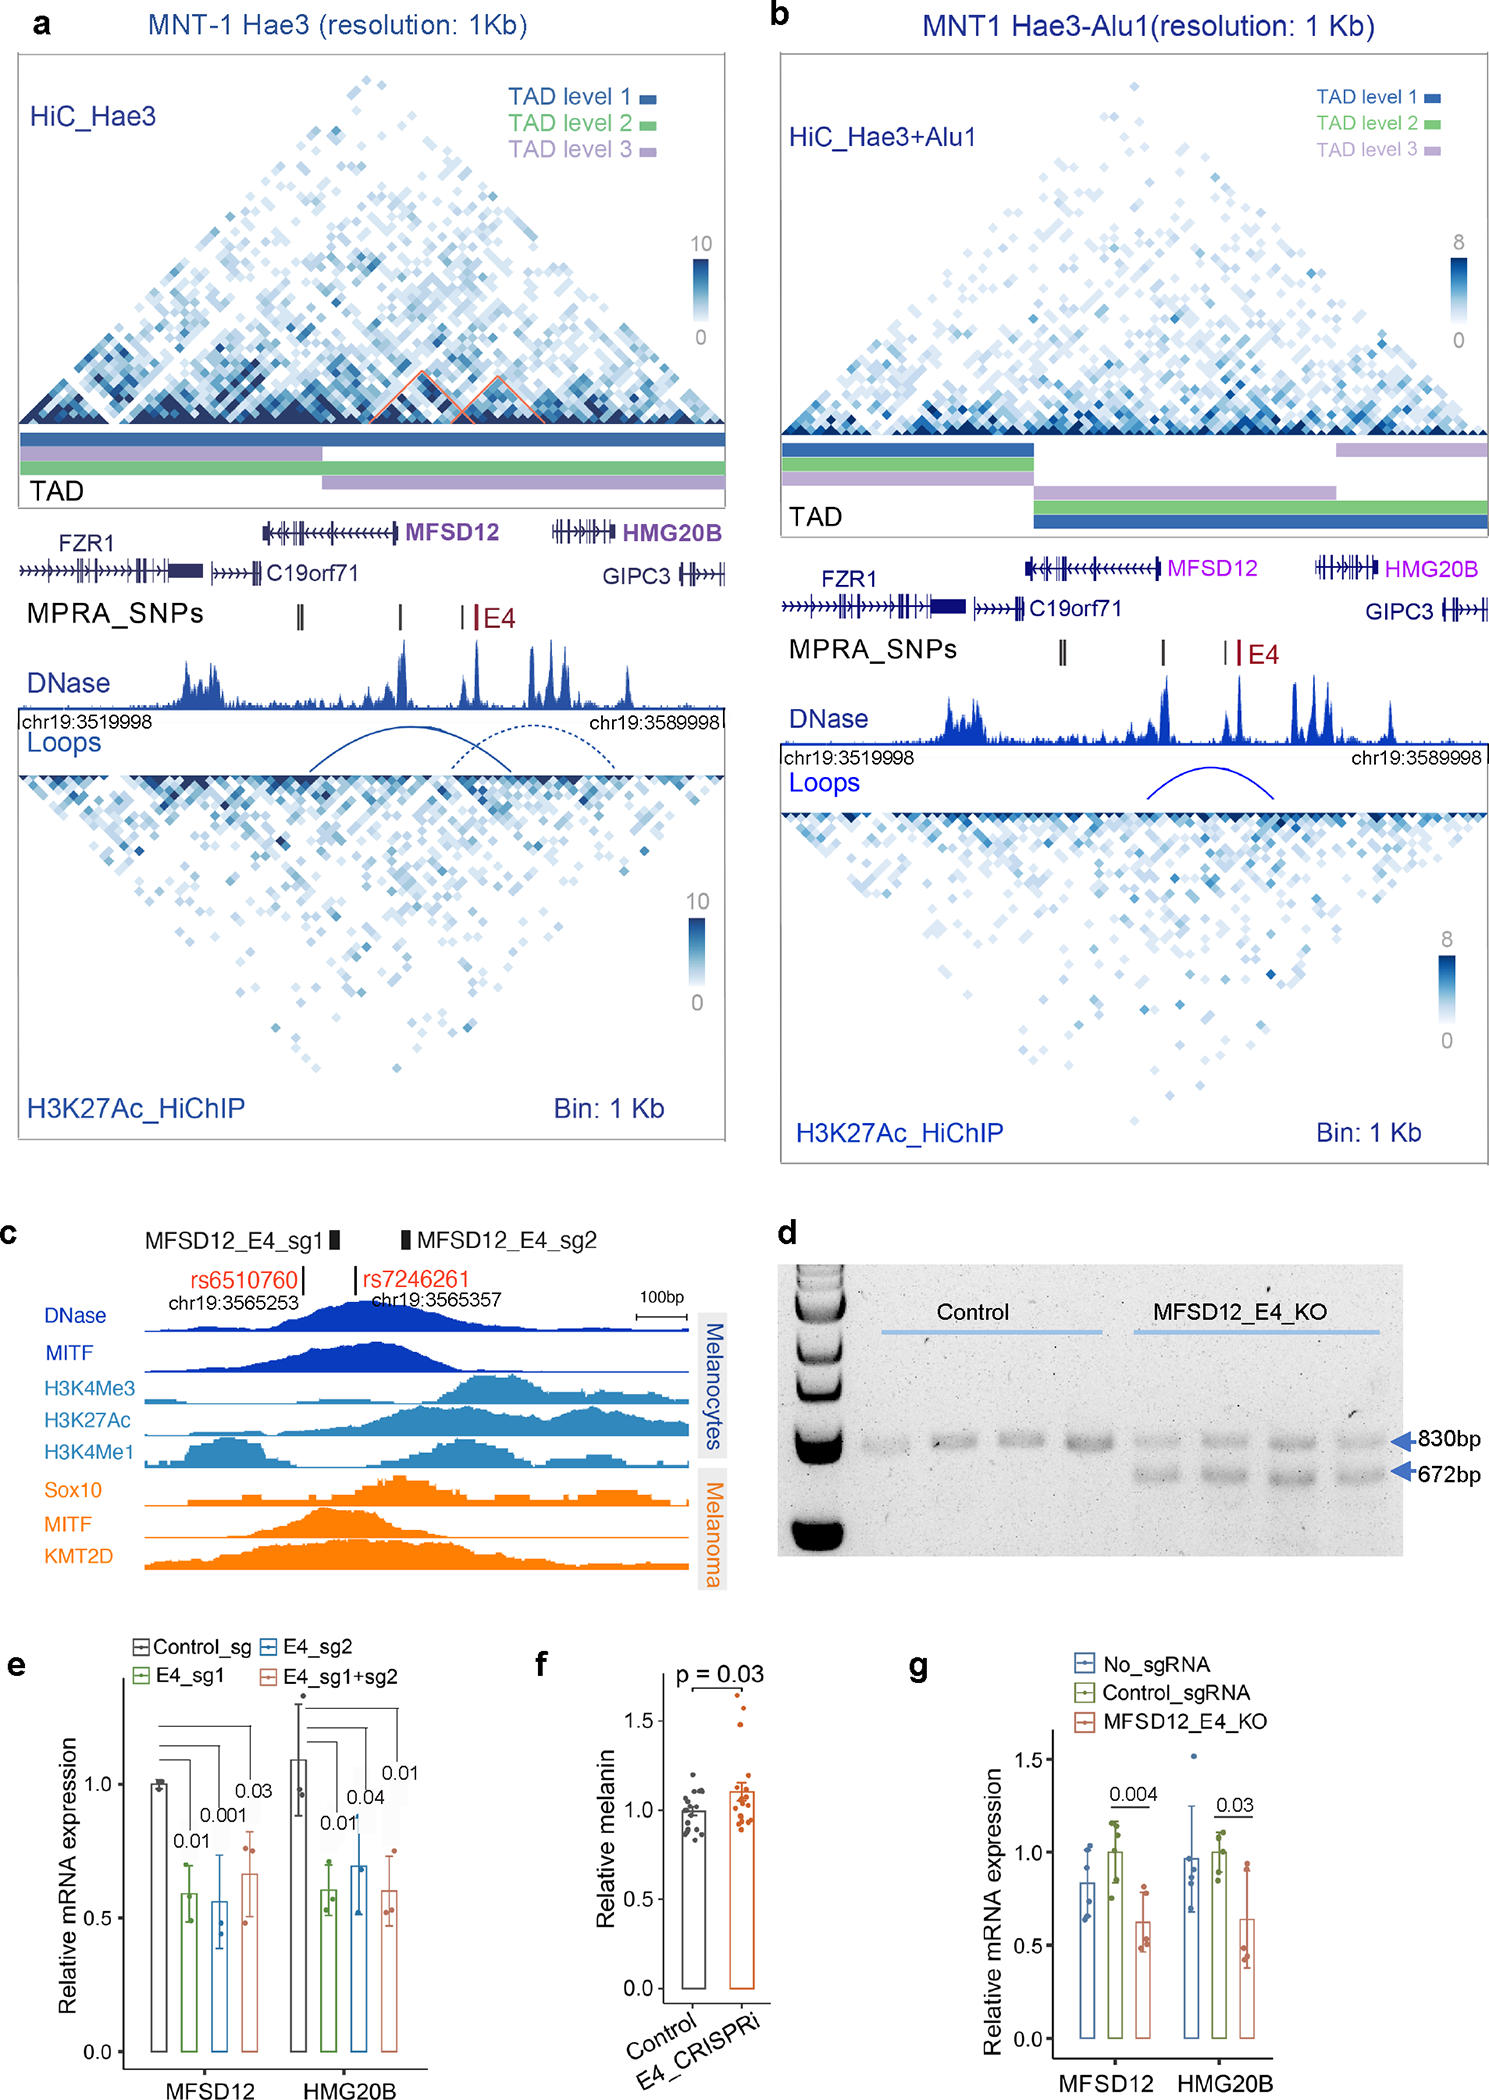
(a-b) Chromatin interactions near MFSD12 identified by Hi-C and H3K27ac HiChIP with Hae3 digestion. The upper matrix is from MNT-1 Hi-C data, and the lower matrix is from MNT-1 H3K27ac HiChIP data. TADs were called by onTAD 71and colored by nested TAD levels. The solid arch was a loop defined using FitHiChIP 29 software, the dashed arch was a potential loop based on the observed interaction matrix. The interaction matrix between MFSD12 and HMG20B were highlighted with orange angles. The DNase track of melanocytes was downloaded from ENCODE68. rs6510760 and rs657246261 in E4 are colored in red. The plotted region is chr19:3519998–3589998 (hg19). (c) Schematic showing the location of the two sgRNAs targeting the enhancer E4 of MFSD12. (d) PCR results showing efficient knockout of the enhancer by the two sgRNAs. Three independent experiments. (e) qPCR showed that CRISPRi of E4 significantly decreases the gene expression of MFSD12 and HMG20B in MNT-1 cells. Two-sided Dunnett’s test with adjustments for multiple comparisons (n = 3). (f) CRISPRi of E4 significantly increases melanin levels in MNT-1 cells. Two-tailed unpaired t-tests (n = 19). (g) qPCR showed that CRISPR knockout of E4 significantly decreases the gene expression of MFSD12 and HMG20B in MNT-1 cells. Two-tailed unpaired t-tests without multiple testing adjustments (n = 6). Data are presented as mean ± SEM.
Extended Data Fig. 4. Identification of functional variants associated with skin pigmentation near OCA2.
(a) SNP rs6497271 is in a melanocyte-specific enhancer. Blue tracks indicate DNase-Seq, ATAC-Seq, and ChIP-Seq data from melanocytes; orange tracks indicate ChIP-Seq data from melanoma (501-mel) cells; green tracks indicate DNase-Seq data from ENCODE cell lines. E1-E4, enhancers. The plotted region is chr15: 28,335,146–28,385,146 (hg19). (b) MPRA and LRA revealed that rs4778242 significantly affects the enhancer activity of E1 in MNT-1 and WM88. MPRA (n = 3), LRA (n =9). (c) MPRA showed that rs6497271 significantly affects the enhancer activity of E2 in MNT-1 and WM88 cells (n =3). (d) MPRA showed that rs7495989 affects the enhancer activity of E3 in MNT-1 and WM88 cells (n =3). (e) MPRA and LRA revealed that rs4778141 affects the enhancer activity of E4 in MNT-1 and WM88 cells. MPRA (n = 3), LRA (MNT-1, n = 9; WM88, n = 6). (f) rs6497271 overlaps transcription factor binding sites. Left panel showed rs6497271 disrupts the binding motif of LEF1 and SOX10. Right panel showed the rs6497271 overlaps ChIP-seq peaks from Cistrome database72. LRA data are presented as mean ± SEM, tested with two-tailed paired t-tests. MPRA p-values were estimated with a random effects model for mpralm and paired t-tests with multiple testing adjustments. For MPRA boxplots, central lines are median, with boxes extending from the 25th to the 75th percentiles. Whiskers further extend by ±1.5 times the interquartile range from the limits of each box.
Extended Data Fig. 5. Identification of functional variants near MITF related to skin pigmentation in the San.
(a) A plot showing that functional Di-SNP rs111969762 is in a melanocyte-specific regulatory region. Blue tracks show DNase-Seq, ATAC-Seq, and ChIP-Seq data from melanocytes; orange tracks indicate ChIP-Seq data from melanoma (501-mel) cells, green tracks indicate DNase-Seq data from ENCODE 68. E1-E2, enhancers. (b) MPRA showed that rs111969762 affects enhancer activity in WM88 cells (n = 3). (c) MPRA showed that rs7430957 impacts enhancer activity in WM88 cells (n = 3). (d) LRA showed that rs7430957 does not significantly alter the activity of the E2 enhancer near MITF. P values were estimated by two-tailed paired t-tests, MNT-1(n = 6), WM88 (n = 11). Data were presented as mean ± SEM. ns p > 0.05. (e) rs111969762 overlaps transcription factor binding sites. Left panel shows that rs6497271 disrupts the binding motif of FOXP3. Right panel shows that rs111969762 overlaps ChIP-seq peaks from the Cistrome database 72. MPRA p-values were estimated with a random effects model for mpralm and paired t-tests with multiple testing adjustments. For MPRA boxplots, central lines are median, with boxes extending from the 25th to the 75th percentiles. Whiskers further extend by ±1.5 times the interquartile range from the limits of each box.
Extended Data Fig. 6. Functional testing of Di-SNPs near LEF1.
(a) MFVs and regulatory elements near LEF1. rs17038630 and rs11939273 are Di-SNPs from the San population. (b) Plot showing allelic skews at rs17038630 in MNT-1 and WM88 cells estimated by MPRA (n = 3). (c) rs17038630 overlaps SOX10 and LEF1 binding sites. Left panel shows that rs17038630 disrupts the binding motif of SOX10 and LEF1. Right panel shows that rs11939273 overlaps ChIP-seq peaks from the Cistrome database 72. (d) MPRA and LRA results showing allelic skews at Di-SNP rs11939273 in MNT-1 and WM88 cells, the allele frequency data was from the 180G 18 and 1000G 31datasets. LRA data are presented as mean ± SEM, tested with two-tailed paired t-tests, MPRA (n = 3), LRA (MNT-1, n = 6; WM88, n = 9). (e) CRISPR-KO of the enhancer E1 of LEF1 does not affect LEF1 expression and melanin levels in MNT-1 cells. Left panel shows genotyping results of CRISPR-KO of the enhancer E1 of LEF1, three independent experiments. Middle panel shows the RT-qPCR results of CRISPR-KO of the enhancer E1 of LEF1 (n = 9). Right panel shows the melanin levels of CRISPR-KO of the enhancer E1 of LEF1 (n = 9). Two-tailed unpaired t-tests. For MPRA boxplots in b and d, central lines are median, with boxes extending from the 25th to the 75th percentiles. Whiskers further extend by ±1.5 times the interquartile range from the limits of each box. MPRA p-values were estimated with a random effects model for mpralm and paired t-tests with multiple testing adjustments.
Extended Data Fig. 7. MPRA and LRA identified three functional Di-SNPs near NLK.
(a) MFVs and regulatory elements near NLK. rs75827647, rs10468581 and rs113940275 are Di-SNPs from the San population. (b) LRA and MPRA results showing allelic skews at rs75827647 in MNT-1 and WM88 cells. MPRA (n = 3), LRA (MNT-1, n = 6; WM88, n = 9). (c) LRA and MPRA results showing allelic skews at rs10468581 in MNT-1 and WM88 cells. MPRA (n = 3), LRA (MNT-1, n = 6; WM88, n = 9). (d) LRA and MPRA results showing allelic skews at rs113940275 in MNT-1 and WM88 cells. MPRA (n = 3), LRA (MNT-1, n = 6; WM88, n = 11). From b to d, the barplots are results of LRA. Two-tailed paired t-tests without adjustments for multiple comparisons, data were presented as mean ± SEM. ns p > 0.05. The boxplots are results from the MPRA, p-values were estimated with a random effects model for mpralm and paired t-tests with multiple testing adjustments. The right panels are allele frequency maps constructed using the180G 18 and 1000G 31 datasets. For boxplots, central lines are median values, with boxes extending from the 25th to the 75th percentiles. Whiskers further extend by ±1.5 times the interquartile range from the limits of each box.
Extended Data Fig. 8. Functional testing of Di-SNPs near TRPS1.
(a) SNP rs11985280 overlaps a regulatory element of TPRS1. Blue tracks show ATAC-Seq, and ChIP-Seq data from melanocytes; orange tracks indicate ChIP-Seq data from melanoma (501-mel) cells, green tracks indicate ATAC-Seq and DNase-Seq data from ENCODE 68. (b) MPRA results showing allelic skews at rs11985280 in MNT-1 and WM88 cells (n = 3). p-values were estimated with a random effects model for mpralm and paired t-tests with multiple testing adjustments. For boxplots, central lines are median, with boxes extending from the 25th to the 75th percentiles. Whiskers further extend by ±1.5 times the interquartile range from the limits of each box. (c) rs11985280 disrupts the binding motif of CEBPA and CEBPB. Right panel shows that rs11985280 overlaps ChIP-seq peaks from the Cistrome database 72. (d) CRISPR-KO of the enhancer E1 of TRPS1 affects TRPS1 expression but not melanin levels in MNT-1 cells. Left panel shows genotyping results of CRISPR-KO of the enhancer E1 of TRPS1, three independent experiments. Middle panel shows the RT-qPCR results of CRISPR-KO of the enhancer E1 of TRPS1 (n = 9). Right panel shows the melanin levels of CRISPR-KO of the enhancer E1 of TRPS1 in MNT-1 cells (n = 9). Two-tailed unpaired t-tests. Data were presented as mean ± SEM and p values were listed above the bars.
Extended Data Fig. 9. Identification of functional regulatory variants near the BLOC1S6 locus.
(a). rs72713175 overlaps a regulatory region in melanocytes. Green tracks represent ATAC-seq for MNT-1 and WM88 cells; blue tracks show ATAC-Seq and ChIP-Seq data from normal human melanocytes (NHM); orange tracks indicate CUT&RUN data from MNT-1 cells. (b) MPRA results showing allelic skews at rs11985280 in WM88 cells but not in MNT-1 cells (n = 3). P values were estimated with a random effects model for mpralm and paired t-tests without multiple testing adjustments. For boxplots, central lines are median, with boxes extending from the 25th to the 75th percentiles. Whiskers further extend by ±1.5 times the interquartile range from the limits of each box. (c) Allele frequencies at rs72713175 in global populations, data were from the 180G 18 and 1000G 31datasets. (d) LRA results showing that rs72713175 did not affect enhancer activity in WM88 and MNT-1 cells. Two-tailed paired t-tests (n = 6). (e) CRISPRi of the enhancer containing rs72713175 significantly reduced the expression of BLOC1S6 (control, n = 8; others, n = 6; Two-sided Dunnett’s test with adjustments for multiple comparisons). (f) CRISPRi of the enhancer containing rs72713175 significantly reduced melanin levels in MNT-1 cells (control, n = 18; others, n = 9, Two-sided Dunnett’s test with adjustments for multiple comparisons). Data are presented as mean ± SEM and p values were listed above the bars.
Extended Data Fig. 10. Identification of functional regulatory variants near the DDB1 locus.
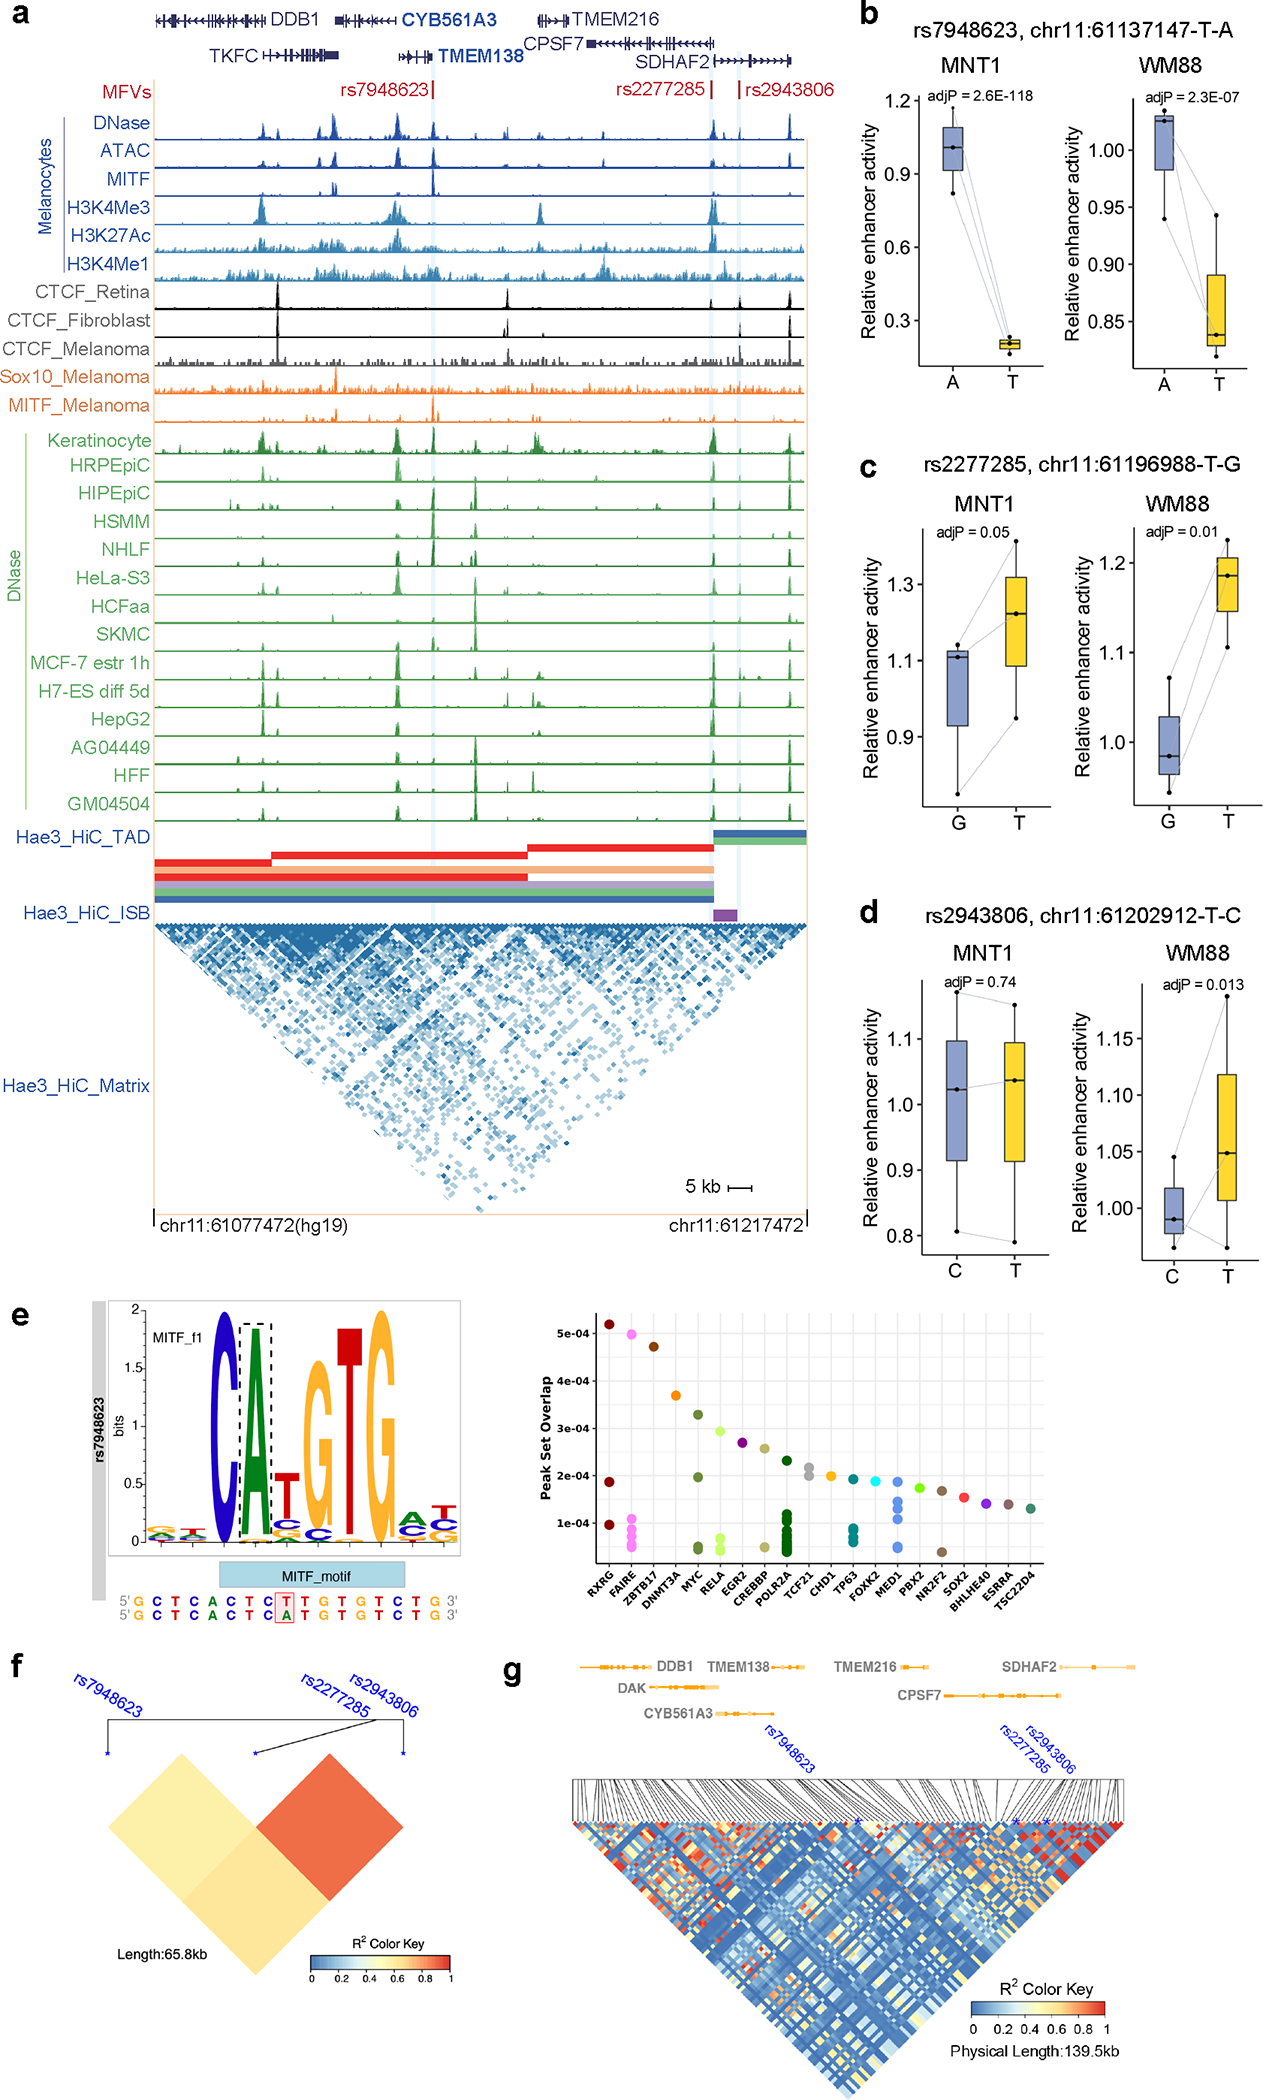
(a) Plots showing allelic skewed variants in regulatory elements near the DDB1 locus. rs7948623 overlaps an open chromatin region in melanocytes and many other cell types. rs2277285 and rs2943806 are located within CTCF binding sites and TAD boundaries. Blue tracks are DNase-Seq, ATAC-Seq, and ChIP-Seq data from melanocytes; orange tracks indicate ChIP-Seq data from melanoma (501-mel) cells; gray tracks indicate CTCF ChIP-Seq data from three cell lines; and green tracks indicate DNase-Seq data from ENCODE68. (b-d) Allelic skews at rs7948623, rs2277285 and rs2943806 as estimated by MPRA (n = 3). P values were estimated with a random effects model for mpralm and paired t-tests without multiple testing adjustments. For boxplots, central lines are median, with boxes extending from the 25th to the 75th percentiles. Whiskers further extend by ±1.5 times the interquartile range from the limits of each box. (e) rs7948623 disrupts a MITF binding motif and overlaps ChIP-seq peaks from Cistrome database 72. (f-g) LD pattern between the MFVs near the DDB1 locus. LD was calculated using the 180G18 dataset.
Supplementary Material
Acknowledgements
This research was supported by the following grants: NIH grants 3UM1HG009408–02S1, 1R01GM113657–01 and 5R01AR076241–02. We thank the Skin Biology and Disease Resource-based Center (SBDRC, NIH P30-AR069589) at the University of Pennsylvania for funding and for providing human primary melanocytes. The sequencing of MPRA was carried by the DNA Technologies and Expression Analysis Core at the UC Davis Genome Center, supported by NIH Shared Instrumentation Grant 1S10OD010786–01. We thank Elizabeth Burton for assistance on part of the plasmid cloning. We thank Dr. Zhaolan (Joe) Zhou from the Department of Genetics at UPenn for sharing their tissue culture room. We thank Dr. Jennifer Phillips-Cremins from the Department of Genetics at UPenn for constructive suggestions on Hi-C. We thank Hetty Wong and Hao Wu at the University of Pennsylvania for sharing their experimental equipment. We thank the African participants for their contributions to this study.
Footnotes
Declaration of interests
N.A. is an equity holder of Encoded Therapeutics, a gene regulation therapeutics company and is a co-founder and scientific advisor of Regel Therapeutics and Neomer Diagnostics. The remaining authors declare no competing financial interests.
Code availability
Public software and packages were used following developer’s manuals. The custom code used for data analysis has been deposited at Github (https://github.com/fengyq/nature_gentics_codes).
Data availability
The epigenomic data, Hi-C and HiChIP data were uploaded to UCSC browser and are available at https://genome.ucsc.edu/s/fengyq/Tishkoff_Lab%2Dhg38%2DMPRA%2DHiC_Pigmentation. All RNA-seq and epigenomic data generated in this study are available at GEO: GSE240717. Genotype data for GWAS was in dbGaP: phs001396.vl.pl.
References including Methods
- 1.Jablonski NG & Chaplin G Colloquium paper: human skin pigmentation as an adaptation to UV radiation. Proc. Natl. Acad. Sci. U. S. A. 107 Suppl 2, 8962–8968 (2010). [DOI] [PMC free article] [PubMed] [Google Scholar]
- 2.Barsh GS What controls variation in human skin color? PLoS Biol. 1, E27 (2003). [DOI] [PMC free article] [PubMed] [Google Scholar]
- 3.Beleza S et al. Genetic architecture of skin and eye color in an African-European admixed population. PLoS Genet. 9, e1003372 (2013). [DOI] [PMC free article] [PubMed] [Google Scholar]
- 4.Liu F et al. Genetics of skin color variation in Europeans: genome-wide association studies with functional follow-up. Hum. Genet. 134, 823–835 (2015). [DOI] [PMC free article] [PubMed] [Google Scholar]
- 5.Martin AR et al. An Unexpectedly Complex Architecture for Skin Pigmentation in Africans. Cell 171, 1340–1353.e14 (2017). [DOI] [PMC free article] [PubMed] [Google Scholar]
- 6.Galván-Femenía I et al. Multitrait genome association analysis identifies new susceptibility genes for human anthropometric variation in the GCAT cohort. J. Med. Genet. 55, 765–778 (2018). [DOI] [PMC free article] [PubMed] [Google Scholar]
- 7.Nealelab. UK BioBank GWAS. http://www.nealelab.is/uk-biobank/ http://www.nealelab.is/uk-biobank/ (2018).
- 8.Adhikari K et al. A GWAS in Latin Americans highlights the convergent evolution of lighter skin pigmentation in Eurasia. Nat. Commun. 10, 358 (2019). [DOI] [PMC free article] [PubMed] [Google Scholar]
- 9.Lona-Durazo F et al. Meta-analysis of GWA studies provides new insights on the genetic architecture of skin pigmentation in recently admixed populations. BMC Genet. 20, 59 (2019). [DOI] [PMC free article] [PubMed] [Google Scholar]
- 10.Jiang L, Zheng Z, Fang H & Yang J A generalized linear mixed model association tool for biobank-scale data. Nat. Genet. 53, 1616–1621 (2021). [DOI] [PubMed] [Google Scholar]
- 11.Batai K et al. Genetic loci associated with skin pigmentation in African Americans and their effects on vitamin D deficiency. PLoS Genet. 17, e1009319 (2021). [DOI] [PMC free article] [PubMed] [Google Scholar]
- 12.Pairo-Castineira E et al. Expanded analysis of pigmentation genetics in UK Biobank. bioRxiv (2022) doi: 10.1101/2022.01.30.478418. [DOI] [Google Scholar]
- 13.Crawford NG et al. Loci associated with skin pigmentation identified in African populations. Science 358, (2017). [DOI] [PMC free article] [PubMed] [Google Scholar]
- 14.Miller CT et al. cis-Regulatory changes in Kit ligand expression and parallel evolution of pigmentation in sticklebacks and humans. Cell 131, 1179–1189 (2007). [DOI] [PMC free article] [PubMed] [Google Scholar]
- 15.Tsetskhladze ZR et al. Functional assessment of human coding mutations affecting skin pigmentation using zebrafish. PLoS One 7, e47398 (2012). [DOI] [PMC free article] [PubMed] [Google Scholar]
- 16.Visser M, Kayser M & Palstra R-J HERC2 rs12913832 modulates human pigmentation by attenuating chromatin-loop formation between a long-range enhancer and the OCA2 promoter. Genome Res. 22, 446–455 (2012). [DOI] [PMC free article] [PubMed] [Google Scholar]
- 17.Praetorius C et al. A polymorphism in IRF4 affects human pigmentation through a tyrosinase-dependent MITF/TFAP2A pathway. Cell 155, 1022–1033 (2013). [DOI] [PMC free article] [PubMed] [Google Scholar]
- 18.Fan S et al. Whole-genome sequencing reveals a complex African population demographic history and signatures of local adaptation. Cell 186, 923–939.e14 (2023). [DOI] [PMC free article] [PubMed] [Google Scholar]
- 19.Gordon MG et al. lentiMPRA and MPRAflow for high-throughput functional characterization of gene regulatory elements. Nat. Protoc. 15, 2387–2412 (2020). [DOI] [PMC free article] [PubMed] [Google Scholar]
- 20.Akey JM et al. Tracking footprints of artificial selection in the dog genome. Proc. Natl. Acad. Sci. U. S. A. 107, 1160–1165 (2010). [DOI] [PMC free article] [PubMed] [Google Scholar]
- 21.Myint L, Avramopoulos DG, Goff LA & Hansen KD Linear models enable powerful differential activity analysis in massively parallel reporter assays. BMC Genomics 20, 209 (2019). [DOI] [PMC free article] [PubMed] [Google Scholar]
- 22.Adelmann CH et al. MFSD12 mediates the import of cysteine into melanosomes and lysosomes. Nature 588, 699–704 (2020). [DOI] [PMC free article] [PubMed] [Google Scholar]
- 23.Luecke S et al. The aryl hydrocarbon receptor (AHR), a novel regulator of human melanogenesis. Pigment Cell Melanoma Res. 23, 828–833 (2010). [DOI] [PubMed] [Google Scholar]
- 24.Kayser M et al. Three genome-wide association studies and a linkage analysis identify HERC2 as a human iris color gene. Am. J. Hum. Genet. 82, 411–423 (2008). [DOI] [PMC free article] [PubMed] [Google Scholar]
- 25.Lona-Durazo F et al. A large Canadian cohort provides insights into the genetic architecture of human hair colour. Commun. Biol. 4, 1253 (2021). [DOI] [PMC free article] [PubMed] [Google Scholar]
- 26.Simcoe M et al. Genome-wide association study in almost 195,000 individuals identifies 50 previously unidentified genetic loci for eye color. Sci. Adv. 7, eabd1239 (2021). [DOI] [PMC free article] [PubMed] [Google Scholar]
- 27.Liang Z et al. BL-Hi-C is an efficient and sensitive approach for capturing structural and regulatory chromatin interactions. Nat. Commun. 8, 1622 (2017). [DOI] [PMC free article] [PubMed] [Google Scholar]
- 28.Mumbach MR et al. HiChIP: efficient and sensitive analysis of protein-directed genome architecture. Nat. Methods 13, 919–922 (2016). [DOI] [PMC free article] [PubMed] [Google Scholar]
- 29.Bhattacharyya S, Chandra V, Vijayanand P & Ay F Identification of significant chromatin contacts from HiChIP data by FitHiChIP. Nat. Commun. 10, 4221 (2019). [DOI] [PMC free article] [PubMed] [Google Scholar]
- 30.Ochoa D et al. Open Targets Platform: supporting systematic drug-target identification and prioritisation. Nucleic Acids Res. 49, D1302–D1310 (2021). [DOI] [PMC free article] [PubMed] [Google Scholar]
- 31.1000 Genomes Project Consortium et al. A global reference for human genetic variation. Nature 526, 68–74 (2015). [DOI] [PMC free article] [PubMed] [Google Scholar]
- 32.Albers PK & McVean G Dating genomic variants and shared ancestry in population-scale sequencing data. PLoS Biol. 18, e3000586 (2020). [DOI] [PMC free article] [PubMed] [Google Scholar]
- 33.Levy C, Khaled M & Fisher DE MITF: master regulator of melanocyte development and melanoma oncogene. Trends Mol. Med. 12, 406–414 (2006). [DOI] [PubMed] [Google Scholar]
- 34.Klein JC et al. A systematic evaluation of the design and context dependencies of massively parallel reporter assays. Nat. Methods 17, 1083–1091 (2020). [DOI] [PMC free article] [PubMed] [Google Scholar]
- 35.Tan B et al. FOXP3 over-expression inhibits melanoma tumorigenesis via effects on proliferation and apoptosis. Oncotarget 5, 264–276 (2014). [DOI] [PMC free article] [PubMed] [Google Scholar]
- 36.Cao Y et al. Accurate loop calling for 3D genomic data with cLoops. Bioinformatics 36, 666–675 (2020). [DOI] [PubMed] [Google Scholar]
- 37.Takeda K et al. Induction of melanocyte-specific microphthalmia-associated transcription factor by Wnt-3a. J. Biol. Chem. 275, 14013–14016 (2000). [DOI] [PubMed] [Google Scholar]
- 38.Bondurand N et al. Interaction among SOX10, PAX3 and MITF, three genes altered in Waardenburg syndrome. Hum. Mol. Genet. 9, 1907–1917 (2000). [DOI] [PubMed] [Google Scholar]
- 39.Kichaev G et al. Leveraging Polygenic Functional Enrichment to Improve GWAS Power. Am. J. Hum. Genet. 104, 65–75 (2019). [DOI] [PMC free article] [PubMed] [Google Scholar]
- 40.Morgan MD et al. Genome-wide study of hair colour in UK Biobank explains most of the SNP heritability. Nat. Commun. 9, 5271 (2018). [DOI] [PMC free article] [PubMed] [Google Scholar]
- 41.Visconti A et al. Genome-wide association study in 176,678 Europeans reveals genetic loci for tanning response to sun exposure. Nat. Commun. 9, 1684 (2018). [DOI] [PMC free article] [PubMed] [Google Scholar]
- 42.Larimore J et al. Mutations in the BLOC-1 subunits dysbindin and muted generate divergent and dosage-dependent phenotypes. J. Biol. Chem. 289, 14291–14300 (2014). [DOI] [PMC free article] [PubMed] [Google Scholar]
- 43.Saito H et al. Melanocyte-specific microphthalmia-associated transcription factor isoform activates its own gene promoter through physical interaction with lymphoid-enhancing factor 1. J. Biol. Chem. 277, 28787–28794 (2002). [DOI] [PubMed] [Google Scholar]
- 44.Wang X et al. LEF-1 Regulates Tyrosinase Gene Transcription In Vitro. PLoS One 10, e0143142 (2015). [DOI] [PMC free article] [PubMed] [Google Scholar]
- 45.Ishitani T et al. The TAK1-NLK-MAPK-related pathway antagonizes signalling between beta-catenin and transcription factor TCF. Nature 399, 798–802 (1999). [DOI] [PubMed] [Google Scholar]
- 46.Ishitani T, Ninomiya-Tsuji J & Matsumoto K Regulation of lymphoid enhancer factor 1/T-cell factor by mitogen-activated protein kinase-related Nemo-like kinase-dependent phosphorylation in Wnt/beta-catenin signaling. Mol. Cell. Biol. 23, 1379–1389 (2003). [DOI] [PMC free article] [PubMed] [Google Scholar]
- 47.Gai Z, Gui T & Muragaki Y The function of TRPS1 in the development and differentiation of bone, kidney, and hair follicles. Histol. Histopathol. 26, 915–921 (2011). [DOI] [PubMed] [Google Scholar]
- 48.Swoboda A et al. STAT3 promotes melanoma metastasis by CEBP-induced repression of the MITF pathway. Oncogene 40, 1091–1105 (2021). [DOI] [PMC free article] [PubMed] [Google Scholar]
- 49.Mallick S et al. The Simons Genome Diversity Project: 300 genomes from 142 diverse populations. Nature 538, 201–206 (2016). [DOI] [PMC free article] [PubMed] [Google Scholar]
- 50.Sitaram A & Marks MS Mechanisms of protein delivery to melanosomes in pigment cells. Physiology (Bethesda) 27, 85–99 (2012). [DOI] [PMC free article] [PubMed] [Google Scholar]
- 51.Wang Z et al. CYB561A3 is the key lysosomal iron reductase required for Burkitt B-cell growth and survival. Blood 138, 2216–2230 (2021). [DOI] [PMC free article] [PubMed] [Google Scholar]
- 52.Karlsson M et al. A single-cell type transcriptomics map of human tissues. Sci. Adv. 7, eabh2169 (2021). [DOI] [PMC free article] [PubMed] [Google Scholar]
- 53.Lee JH et al. Evolutionarily assembled cis-regulatory module at a human ciliopathy locus. Science 335, 966–969 (2012). [DOI] [PMC free article] [PubMed] [Google Scholar]
- 54.Lamason RL et al. SLC24A5, a putative cation exchanger, affects pigmentation in zebrafish and humans. Science 310, 1782–1786 (2005). [DOI] [PubMed] [Google Scholar]
- 55.Lavado A, Olivares C, García-Borrón JC & Montoliu L Molecular basis of the extreme dilution mottled mouse mutation: a combination of coding and noncoding genomic alterations. J. Biol. Chem. 280, 4817–4824 (2005). [DOI] [PubMed] [Google Scholar]
- 56.Seruggia D, Fernández A, Cantero M, Pelczar P & Montoliu L Functional validation of mouse tyrosinase non-coding regulatory DNA elements by CRISPR-Cas9-mediated mutagenesis. Nucleic Acids Res. 43, 4855–4867 (2015). [DOI] [PMC free article] [PubMed] [Google Scholar]
- 57.Ambrosio AL, Boyle JA, Aradi AE, Christian KA & Di Pietro SM TPC2 controls pigmentation by regulating melanosome pH and size. Proc. Natl. Acad. Sci. U. S. A. 113, 5622–5627 (2016). [DOI] [PMC free article] [PubMed] [Google Scholar]
- 58.Ploper D et al. MITF drives endolysosomal biogenesis and potentiates Wnt signaling in melanoma cells. Proc. Natl. Acad. Sci. U. S. A. 112, E420–9 (2015). [DOI] [PMC free article] [PubMed] [Google Scholar]
- 59.Zhang Y et al. Lef1 contributes to the differentiation of bulge stem cells by nuclear translocation and cross-talk with the Notch signaling pathway. Int. J. Med. Sci. 10, 738–746 (2013). [DOI] [PMC free article] [PubMed] [Google Scholar]
- 60.Fantauzzo KA, Kurban M, Levy B & Christiano AM Trps1 and its target gene Sox9 regulate epithelial proliferation in the developing hair follicle and are associated with hypertrichosis. PLoS Genet. 8, e1003002 (2012). [DOI] [PMC free article] [PubMed] [Google Scholar]
- 61.Fantauzzo KA & Christiano AM Trps1 activates a network of secreted Wnt inhibitors and transcription factors crucial to vibrissa follicle morphogenesis. Development 139, 203–214 (2012). [DOI] [PMC free article] [PubMed] [Google Scholar]
- 62.Yamada T et al. Wnt/β-catenin and kit signaling sequentially regulate melanocyte stem cell differentiation in UVB-induced epidermal pigmentation. J. Invest. Dermatol. 133, 2753–2762 (2013). [DOI] [PubMed] [Google Scholar]
- 63.Andl T, Reddy ST, Gaddapara T & Millar SE WNT signals are required for the initiation of hair follicle development. Dev. Cell 2, 643–653 (2002). [DOI] [PubMed] [Google Scholar]
- 64.Tobias PV & Biesele M The Bushmen: San Hunters and Herders of Southern Africa. (Human & Rousseau, 1978). [Google Scholar]
- 65.Feng Y, McQuillan MA & Tishkoff SA Evolutionary genetics of skin pigmentation in African populations. Hum. Mol. Genet. 30, R88–R97 (2021). [DOI] [PMC free article] [PubMed] [Google Scholar]
- 66.Rawofi L et al. Genome-wide association study of pigmentary traits (skin and iris color) in individuals of East Asian ancestry. PeerJ 5, e3951 (2017). [DOI] [PMC free article] [PubMed] [Google Scholar]
- 67.Stokowski RP et al. A genomewide association study of skin pigmentation in a South Asian population. Am. J. Hum. Genet. 81, 1119–1132 (2007). [DOI] [PMC free article] [PubMed] [Google Scholar]
- 68.ENCODE Project Consortium. An integrated encyclopedia of DNA elements in the human genome. Nature 489, 57–74 (2012). [DOI] [PMC free article] [PubMed] [Google Scholar]
- 69.Coetzee SG, Coetzee GA & Hazelett DJ motifbreakR: an R/Bioconductor package for predicting variant effects at transcription factor binding sites. Bioinformatics 31, 3847–3849 (2015). [DOI] [PMC free article] [PubMed] [Google Scholar]
- 70.Shin J-H, Blay S, Graham J & McNeney B LDheatmap: AnRFunction for Graphical Display of Pairwise Linkage Disequilibria Between Single Nucleotide Polymorphisms. J. Stat. Softw. 16, (2006). [Google Scholar]
- 71.An L et al. OnTAD: hierarchical domain structure reveals the divergence of activity among TADs and boundaries. Genome Biol. 20, 282 (2019). [DOI] [PMC free article] [PubMed] [Google Scholar]
- 72.Liu T et al. Cistrome: an integrative platform for transcriptional regulation studies. Genome Biol. 12, R83 (2011). [DOI] [PMC free article] [PubMed] [Google Scholar]
- 73.Kang HM et al. Variance component model to account for sample structure in genome-wide association studies. Nat. Genet. 42, 348–354 (2010). [DOI] [PMC free article] [PubMed] [Google Scholar]
- 74.Hyun Min Kang E et al. Efficient and Parallelizable Association Container Toolbox, EPACTS v3.3.0. EPACTS http://genome.sph.umich.edu/wiki/EPACTS. [Google Scholar]
- 75.Bhatia G, Patterson N, Sankararaman S & Price AL Estimating and interpreting FST: the impact of rare variants. Genome Res. 23, 1514–1521 (2013). [DOI] [PMC free article] [PubMed] [Google Scholar]
- 76.McLean CY et al. GREAT improves functional interpretation of cis-regulatory regions. Nat. Biotechnol. 28, 495–501 (2010). [DOI] [PMC free article] [PubMed] [Google Scholar]
- 77.Watanabe K, Taskesen E, van Bochoven A & Posthuma D Functional mapping and annotation of genetic associations with FUMA. Nat. Commun. 8, 1826 (2017). [DOI] [PMC free article] [PubMed] [Google Scholar]
- 78.Barrett T et al. NCBI GEO: mining millions of expression profiles--database and tools. Nucleic Acids Res. 33, D562–6 (2005). [DOI] [PMC free article] [PubMed] [Google Scholar]
- 79.Dickinson ME et al. High-throughput discovery of novel developmental phenotypes. Nature 537, 508–514 (2016). [DOI] [PMC free article] [PubMed] [Google Scholar]
- 80.Baxter LL, Watkins-Chow DE, Pavan WJ & Loftus SK A curated gene list for expanding the horizons of pigmentation biology. Pigment Cell Melanoma Res. 32, 348–358 (2019). [DOI] [PMC free article] [PubMed] [Google Scholar]
- 81.Uhlen M et al. A pathology atlas of the human cancer transcriptome. Science 357, (2017). [DOI] [PubMed] [Google Scholar]
- 82.Magoč T & Salzberg SL FLASH: fast length adjustment of short reads to improve genome assemblies. Bioinformatics 27, 2957–2963 (2011). [DOI] [PMC free article] [PubMed] [Google Scholar]
- 83.Chen S, Zhou Y, Chen Y & Gu J fastp: an ultra-fast all-in-one FASTQ preprocessor. Bioinformatics 34, i884–i890 (2018). [DOI] [PMC free article] [PubMed] [Google Scholar]
- 84.Bray NL, Pimentel H, Melsted P & Pachter L Near-optimal probabilistic RNA-seq quantification. Nat. Biotechnol. 34, 525–527 (2016). [DOI] [PubMed] [Google Scholar]
- 85.Soneson C, Love MI & Robinson MD Differential analyses for RNA-seq: transcript-level estimates improve gene-level inferences. F1000Res. 4, 1521 (2015). [DOI] [PMC free article] [PubMed] [Google Scholar]
- 86.Love MI, Huber W & Anders S Moderated estimation of fold change and dispersion for RNA-seq data with DESeq2. Genome Biol. 15, 550 (2014). [DOI] [PMC free article] [PubMed] [Google Scholar]
- 87.Kucukural A, Yukselen O, Ozata DM, Moore MJ & Garber M DEBrowser: interactive differential expression analysis and visualization tool for count data. BMC Genomics 20, 6 (2019). [DOI] [PMC free article] [PubMed] [Google Scholar]
- 88.Blighe K Lewis Rana S. EnhancedVolcano: Publication-ready volcano plots with enhanced colouring and labeling. R package version 1.14.0. EnhancedVolcano https://github.com/kevinblighe/EnhancedVolcano. [Google Scholar]
- 89.Luo W & Brouwer C Pathview: an R/Bioconductor package for pathway-based data integration and visualization. Bioinformatics 29, 1830–1831 (2013). [DOI] [PMC free article] [PubMed] [Google Scholar]
- 90.Corces MR et al. An improved ATAC-seq protocol reduces background and enables interrogation of frozen tissues. Nat. Methods 14, 959–962 (2017). [DOI] [PMC free article] [PubMed] [Google Scholar]
- 91.Langmead B & Salzberg SL Fast gapped-read alignment with Bowtie 2. Nat. Methods 9, 357–359 (2012). [DOI] [PMC free article] [PubMed] [Google Scholar]
- 92.McKenna A et al. The Genome Analysis Toolkit: a MapReduce framework for analyzing next-generation DNA sequencing data. Genome Res. 20, 1297–1303 (2010). [DOI] [PMC free article] [PubMed] [Google Scholar]
- 93.Li H et al. The Sequence Alignment/Map format and SAMtools. Bioinformatics 25, 2078–2079 (2009). [DOI] [PMC free article] [PubMed] [Google Scholar]
- 94.Ramírez F et al. deepTools2: a next generation web server for deep-sequencing data analysis. Nucleic Acids Res. 44, W160–5 (2016). [DOI] [PMC free article] [PubMed] [Google Scholar]
- 95.Zhang Y et al. Model-based analysis of ChIP-Seq (MACS). Genome Biol. 9, R137 (2008). [DOI] [PMC free article] [PubMed] [Google Scholar]
- 96.Liao Y, Smyth GK & Shi W featureCounts: an efficient general purpose program for assigning sequence reads to genomic features. Bioinformatics 30, 923–930 (2014). [DOI] [PubMed] [Google Scholar]
- 97.Meers MP, Tenenbaum D & Henikoff S Peak calling by Sparse Enrichment Analysis for CUT&RUN chromatin profiling. Epigenetics Chromatin 12, 42 (2019). [DOI] [PMC free article] [PubMed] [Google Scholar]
- 98.Kulakovskiy IV et al. HOCOMOCO: towards a complete collection of transcription factor binding models for human and mouse via large-scale ChIP-Seq analysis. Nucleic Acids Res. 46, D252–D259 (2018). [DOI] [PMC free article] [PubMed] [Google Scholar]
Associated Data
This section collects any data citations, data availability statements, or supplementary materials included in this article.
Supplementary Materials
Data Availability Statement
The epigenomic data, Hi-C and HiChIP data were uploaded to UCSC browser and are available at https://genome.ucsc.edu/s/fengyq/Tishkoff_Lab%2Dhg38%2DMPRA%2DHiC_Pigmentation. All RNA-seq and epigenomic data generated in this study are available at GEO: GSE240717. Genotype data for GWAS was in dbGaP: phs001396.vl.pl.