

Abstract
Purpose:
The purpose of this paper was to investigate patterns of health care utilization leading up to diagnosis of necrotizing soft tissue infections of the genitalia and to identify risk factors associated with potential diagnostic delay.
Materials and Methods:
IBM MarketScan Research Databases (2001–2020) were used to identify index cases of necrotizing soft tissue infections of the genitalia. We identified health care visits for symptomatically similar diagnoses (eg, penile swelling, cellulitis) that occurred prior to necrotizing soft tissue infections of the genitalia diagnosis. A change-point analysis identified the window before diagnosis where diagnostic opportunities first appeared. A simulation model estimated the likelihood symptomatically similar diagnosis visits represented a missed opportunity for earlier diagnosis. Patient and provider characteristics were evaluated for their associations with delay.
Results:
We identified 8,098 patients with necrotizing soft tissue infections of the genitalia, in which 4,032 (50%) had a symptomatically similar diagnosis visit in the 21-day diagnostic window, most commonly for “non-infectious urologic abnormalities” (eg, genital swelling; 64%): 46% received antibiotics; 16% saw a urologist. Models estimated that 5,096 of the symptomatically similar diagnosis visits (63%) represented diagnostic delay (mean duration 6.2 days; mean missed opportunities 1.8). Risk factors for delay included urinary tract infection history (OR 2.1) and morbid obesity (OR 1.6). Visits to more than 1 health care provider/location in a 24-hour period significantly decreased delay risk.
Conclusions:
Nearly 50% of insured patients who undergo debridement for, or die from, necrotizing soft tissue infections of the genitalia will present to a medical provider with a symptomatically similar diagnosis suggestive of early disease development. Many of these visits likely represent diagnostic delay. Efforts to minimize logistic and cognitive biases in this rare condition may lead to improved outcomes if they lead to earlier interventions.
Keywords: Fournier gangrene, fasciitis, necrotizing, prodromal symptoms, delayed diagnosis, diagnostic errors
Introduction
Necrotizing soft tissue infections of the genitalia (NSTIG; historically known as Fournier’s gangrene) are rare, with an estimated incidence of 1.6 in 100,000and a 10:1 male to female ratio.1,2 Comorbidities that predispose patients to NSTIG include diabetes mellitus, morbid obesity, alcoholism, liver failure (cirrhosis), renal failure, and malignancy, likely through a shared microvascularpathophysiology.1,3 As the prevalence of each of these conditions has been increasing in the United States over the past decades, so have rates of NSTIG.1
The diagnosis of NSTIG can often be made by physical exam alone, with later-stage disease findings including crepitus (secondary to the commonly found anaerobic gas-forming organisms) and necrosis of the genital skin.4,5 Aggressive surgical debridement, fluid resuscitation, and broad-spectrum antibiotic treatments can be curative, but mortality rates are still high (near 10%).1,6–9
When the diagnosis of NSTIG is less certain, imaging can be utilized, with computerized tomography (CT) being both the most commonly used test, and the test with the highest sensitivity, when looking for pathognomonic subcutaneous air.10,11 Computed indices, such as the Fournier’s gangrene severity index and/or the Laboratory Risk Indicator for Necrotizing Fasciitis, which utilize laboratory and vital sign data to better assess the severity of the patient’s condition, are also available.12–15 However, while imaging and computed indices can improve diagnostic accuracy, both approaches still rely heavily on sufficient clinical suspicion to be used appropriately.
It is well established that once a necrotizing soft tissue infection is diagnosed, delay in the surgical debridement leads to worse clinical outcomes, with mortality rates roughly doubling with each 6 hours of delay.5,16,17 Unfortunately, despite improvements inoperative and postoperative care for NSTIG and other necrotizing soft tissue infections, overall mortality for these conditions has not improved significantly over the past decades.5 Therefore, it must be presumed that efforts to recognize NSTIG earlier in the disease course may be the best means to improve outcomes- and it is likely that these efforts must be made in the disease’s prodromal period, which for NSTIG will often start with nonspecific genital swelling prior to NSTIG development and only later progress to fever and pain.4,18 Thus, the purpose of this paper is to fully describe health care utilization in the presumed prodromal period to help determine the incidence of diagnostic delay and potential for missed opportunities for earlier diagnosis in patients who ultimately underwent surgical debridement for NSTIG. We also aim to identify risk factors associated with these delays.
Methods
Data Source and Study Population
To identify cases of NSTIG, we used longitudinal insurance claims from the IBM MarketScan Research Databases. Commercial claims and Medicare supplemental claims were included from 2001 to 2020, along with Medicaid claims from 2014 to 2018. These databases include over 200 million enrollees and contain claims from inpatient, outpatient, and emergency department (ED) visits, and outpatient medications.
Patients were identified using diagnosis codes for NSTIG and validated using procedure codes for either a surgical debridement or excision within 3 days of the index diagnosis, or death within 3 days following index diagnosis (see supplementary Table 1, https://www.jurology.com, for codes). We also required 90 days of continuous insurance enrollment prior to the index diagnosis.
Statistical Analysis
We performed statistical analyses to estimate: (1) the frequency and duration of diagnostic delays and (2) risk factors for experiencing a potential missed diagnostic opportunity during a health care visit. We used a retrospective approach to identify potential diagnostic opportunities based on health care visits before the index NSTIG diagnosis.
We identified health care visits for symptomatically similar diagnoses (SSDs) that occur prior to the initial NSTIG diagnosis; we define SSDs as symptoms, symptomatically similar diseases or syndromes, or testing/exam-based diagnoses that suggest NSTIG infection was present. ICD-9/10-CM codes commonly seen in the months leading up to their NSTIG diagnosis were reviewed for their possible clinical relationship. Candidate codes were then placed into one of 5 categories: (1) constitutional symptoms/abnormal lab findings (eg, fever, elevated white blood cell count); (2) urological anatomical abnormalities (noninfectious; eg, scrotal and/or penile swelling); (3) infection (eg, cellulitis, urinary tract infection [UTI]); 4) urological voiding symptoms (eg, urinary urgency); and (5) pain (eg, scrotal pain). Supplementary Table 2 (https://www.jurology.com) provides a complete list of SSD categories used and corresponding ICD-9/10-CM codes.
We defined the diagnostic-opportunity window as the period of time prior to diagnosis when diagnostic opportunities may occur. We identified this period based on the “change-point” where the frequency of SSD-associated health care visits significantly increased prior to diagnosis. The cumulative sum control chart method was used to detect this change-point, as has been validated previously.19
Frequency and Duration of Diagnostic Delays
To estimate the number of missed opportunities to diagnose NSTIG, we used a type of case-crossover analysis and a simulation-based method20 that have been previously used to study diagnostic delays in administrativedata.21–23 We first estimated the expected pattern of SSD-associated visits prior to the diagnostic-opportunity window. We then computed the number of likely missed diagnostic opportunities as the difference between the observed and expected number of SSD-associated visits during the diagnostic opportunity window. Finally, a bootstrapping approach was used to simulate individual visits representing a missed opportunity and provide confidence bounds for these estimates. Additional methodological details are provided in the supplementary Appendix (https://www.jurology.com) and complete methodological details have been presented in prior work.20
Risk Factors for a Diagnostic Delay
We conducted an exploratory analysis to identify potential risk factors for diagnostic delay. We used a logistic regression model to estimate risk factors for potential missed diagnostic opportunities. Each SSD visit within the diagnostic opportunity window (ie, 21 days prior to the index diagnosis) was classified as a potential missed diagnostic opportunity, with each index visit by a patient being treated as a non-missed opportunity. Note, this exploratory analysis is based on “potential” missed diagnostic opportunity as our statistical analysis does not differentiate between true missed opportunities versus coincidental visits (as was done in the simulation analysis). We controlled for patient age, weekend visit, morbid obesity, and if the visit occurred in an inpatient, ED, or outpatient setting. Treatment history for the following factors was evaluated during the 60–365 days before the index date: UTIs, psychiatric disorders, and alcohol and substance abuse disorders (see supplementary Table 3, https://www.jurology.com, for a complete list of codes.). We treated all visits on the same day as a single encounter, and we created indicators for the various combinations of care that could be involved on a given day (eg, outpatient only, outpatient, and ED, etc). In addition, we also examined what percentage of visits were attended by a urological specialist and how many patients received antibiotics in the diagnostic window. Variable selection was performed using the Akaike Information Criterion. Note, due to complexities in our underlying data structure, our model does not directly account for the correlated nature between patients with repeated observations. For this reason, and because of the exploratory nature of the risk-factor analysis, effect estimates should be interpreted with caution and should not be interpreted as exact causal effects.
All statistical analyses were conducted using the R programming language, version 4.1.0.24
Results
From 2001 through 2020, we identified a total of 8,098 NSTIG cases meeting eligibility criteria (supplementary Figure 1, https://www.jurology.com). Table 1 presents baseline criteria for the final study cohort. Of the case patients, 7,296 (90%) had at least 1 health care visit, for any reason, in the 90 days prior to their index NSTIG diagnosis, with 933 (13%) having at least 1 inpatient visit, 2,309 (32%) having an ED visit, and 6,874 (94%) having an outpatient visit. Figure 1 depicts the observed pattern of SSD-related visits prior to the index NSTIG diagnosis (see supplementary Figure 2, https://www.jurology.com, for a breakdown by setting). We estimated that the diagnostic-opportunity window started 21 days prior to the index diagnosis date, based on our change-point analysis.
Table 1.
Cohort Demographic Data
| Age at diagnosis, No. (%), y | ||
|---|---|---|
| <18 | 649 | (8) |
| 18–35 | 1,237 | (15) |
| 36–45 | 1,286 | (16) |
| 46–55 | 1,797 | (22) |
| 56–65 | 1,948 | (24) |
| >65 | 1,181 | (15) |
| Enrollment time prior to index, y | ||
| Mean | 3.6 | |
| Median | 2.5 | |
| 1st to 3rd quartiles | 1.1–4.8 | |
| Count ≤ 1.5 y, No. (%) | 2,704 (33) | |
| Count ≤ 2 y, No. (%) | 3,469 (43) | |
| Count ≤ 3 y, No. (%) | 4,684 (58) | |
| Count > 3 y, No. (%) | 3,419 (42) | |
| Morbid obesity, No. (%) | 973 (12) | |
| Prior UTI, No. (%) | 188 (2.3) | |
Abbreviation: UTI, urinary tract infection.
Figure 1.
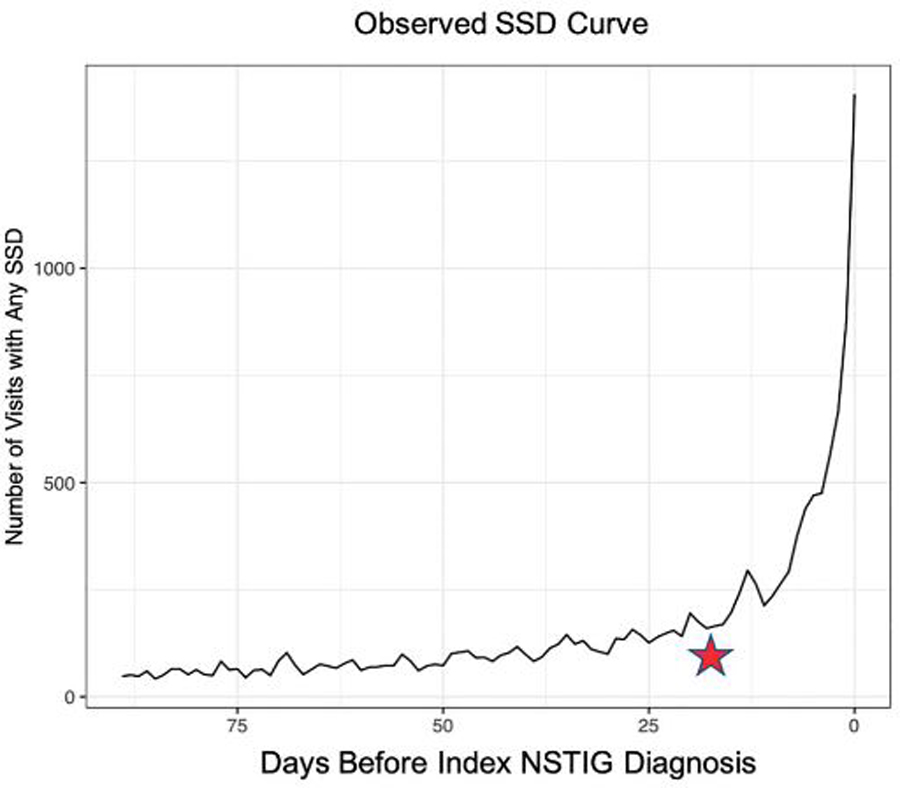
Symptomatically similar diagnosis (SSD) visits prior to index diagnosis. Over the 90 days prior to the index necrotizing soft tissue infections of the genitalia (NSTIG) diagnosis, there is a dramatic increase in visits for SSD-associated diagnoses; this trend exhibits a significant increase beginning 21 days prior to the index NSTIG diagnosis. This period, 1–21 days prior to the index diagnosis, represents the diagnostic opportunity window.
Figure 2 depicts the expected trend line in the number of SSD-associated visits based on this changepoint and the area between the observed line (blue) and the expected trend (red) represents the number of estimated missed opportunities, including the breakdown of total SSDs by category, each of which show a significant increase in frequency within the 21-day window.
Figure 2.
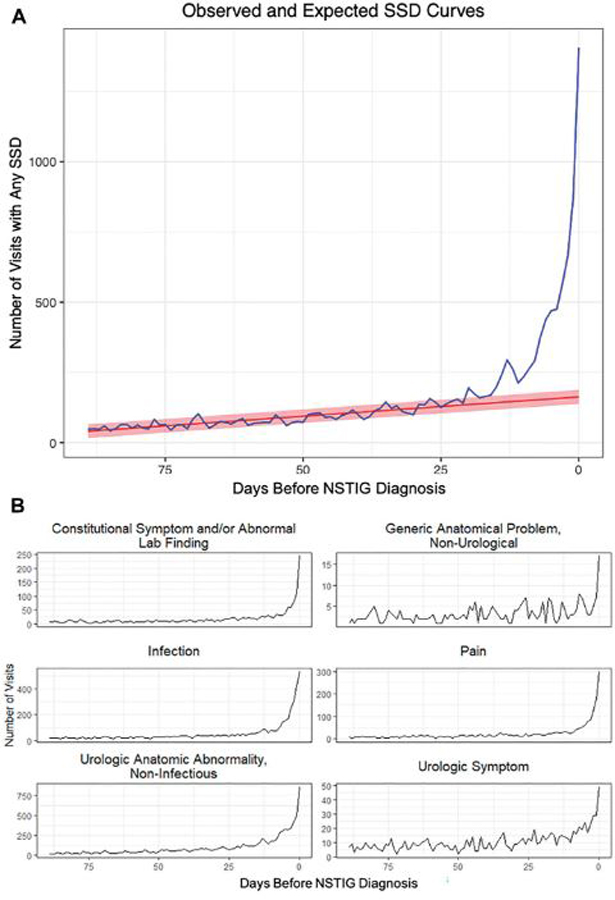
A, Symptomatically similar diagnosis (SSD) visits prior to index diagnosis with expected trend- observed SSD-associated visits (blue) vs the expected trend (red). The expected trend is based on visits occurring before the diagnostic opportunity window (ie, 1–21 days before diagnosis). The area between the observed and expected trends represents likely missed diagnostic opportunities. B, SSD visits prior to index diagnosis by SSD category. NSTIG indicates necrotizing soft tissue infections of the genitalia.
Table 2 outlines the frequency of SSD visit type, with “urologic anatomic abnormality” (eg, scrotal swelling) being the most common SSD (64%), followed by non-necrotizing infection (eg, cellulitis, UTI; 43%) and genital pain (25%). Notably, during these SSD visits 46% of patients received antibiotics (see supplementary Figure 3, https://www.jurology.com, for antibiotic change-point analysis) and 16% were seen by a urologist.
Table 2.
Breakdown of SSD Visits in 90 Days Before Diagnosis: Visits Occurring During (1–21 Days) or Before Diagnostic Opportunity Window (22–90 Days)
| Patients (% of all patients) with SSD visit, No. (%) | |||
|---|---|---|---|
| Diagnosis | During 90-day enrollment window before index diagnosis | During diagnostic opportunity window (21 days) | Before diagnostic opportunity window (22–90 days) |
| All symptomatically similar diagnoses | 4,820 (60) | 4,032 (50) | 2,412 (30) |
| Specific diagnosis | |||
| Urological anatomical abnormality (noninfectious) | 3,086 (38) | 2,600 (32) | 1,514 (19) |
| Urological infection | 2,087 (26) | 1,606 (20) | 799 (10) |
| Genital pain | 1,200 (15) | 771 (10) | 519 (6.1) |
| Constitutional symptoms and/or abnormal lab finding | 815 (10) | 563 (7.0) | 325 (4.0) |
| Urological voiding symptoms | 582 (7.2) | 274 (3.4) | 379 (4.7) |
| Generic anatomical problem (nonurological) | 172 (2.1) | 83 (1.0) | 100 (1.2) |
Abbreviation: SSD, symptomatically similar diagnosis.
Simulation-based Model Results
Table 3 presents results from the simulation analysis for the estimated locations where missed opportunities occurred. The simulation estimated that 5,879 (95% CI: 5,502–6,256) of the 9,368 (63%) SSD visits within the 21 days prior to diagnosis represented a missed opportunity. Out of the missed opportunities, 73% (95% CI: 72–75) occurred in outpatient settings, 23.3% (95% CI: 22–25) in ED settings, and 3.4% (95% CI 3.0–3.8) in inpatient settings. Of all SSD visits to outpatient and ED settings, it was estimated that 40% were missed opportunities for earlier diagnosis.
Table 3.
Simulation Results of Missed Opportunities Broken Down by Setting: Types of Settings Where Missed Opportunities Were Identified in Our Simulation-based Analysis
| Setting | Index visits, No. | Simulated missed opportunities, mean (95% CI) | Total missed opportunities, % (95% CI) | Opportunities that are misses, % (95% CI) |
|---|---|---|---|---|
| Inpatient | 4,356 | 200 (168–233) | 3.4 (2.9–3.9) | 4.4 (3.7–5.1) |
| Outpatient | 6,228 | 4,309 (4,020–4,611) | 73 (72–75) | 41 (39–43) |
| ED | 2,092 | 1,370 (1,264–1,483) | 23 (22–25) | 40 (38–42) |
| Total | 14,284 | 5,879 (5,502–6,256) | 100 | 29 (28–31) |
Abbreviations: CI, confidence interval; ED, emergency department.
Table 4 presents individual-level estimates from the simulation analysis for the duration and number of missed opportunities patients experienced. Around 41% (CI: 39%−42%) of patients experienced at least 1 missed opportunity, averaging 1.8 (CI: 1.7–1.8) visits, most commonly in the outpatient setting 1.3 (CI: 1.3–1.4). The estimated duration of diagnostic delay was 6.2 days (CI: 5.7–6.8). Among those with at least 1missed opportunity, 22% (CI: 19%−25%) of patients experienced a delay lasting 10 or more days.
Table 4.
Number and Duration of Delayed Visits per Patient: Duration and Frequency of Missed Opportunities Across Individual Patients in Our Simulation Analysis
| No. delayed visits, estimated No. (%)a | 95% CI | |
|---|---|---|
| 0 | 4,799 (59) | 4,673–4,922 (58–61) |
| ≥1 | 3,299 (41) | 3,176–3,425 (39–42) |
| ≥2 | 1,535 (19) | 1,421–1,655 (18–20) |
| ≥3 | 615 (7.6) | 543–690 (607–8.5) |
| ≥4 | 241 (3.0) | 199–285 (2.5–3.5) |
| ≥5 | 98 (1.2) | 74–126 (0.9–1.6) |
| No. delayed visits statistics, estimatedb | ||
| Mean, overall | 1.8 | 1.7–1.8 |
| Median, overall | 2 | 1–2 |
| Mean, outpatient | 1.3 | 1.3–1.4 |
| Median, outpatient | 1 | 1–1 |
| Mean, inpatient | 0.06 | 0.05–0.07 |
| Median, inpatient | 0 | 0–0 |
| Mean, ED | 0.42 | 0.39–0.44 |
| Median, ED | 0 | 0–0 |
| Duration of delayed visits, days, estimated No. (%)c | ||
| ≥0 | 3,299 (100.0) | 3,176–3,425 (100.0–100.0) |
| ≥2 | 2,627 (80) | 2,498–2,761 (78–81) |
| ≥4 | 1,830 (55) | 1,700–1,964 (53–58) |
| ≥6 | 1,383 (42) | 1,250–1,521 (39–45) |
| ≥8 | 992 (30) | 861–1,123 (27–33 |
| ≥10 | 726 (22) | 602–842 (19–25) |
| ≥12 | 588 (18) | 473–689 (15–21) |
| ≥14 | 453 (14) | 360–546 (11–16) |
| ≥16 | 259 (7.8) | 171–390 (5.3–12) |
| Duration of delayed visits statistics, No. | ||
| Mean, among delayed | 6.2 | 5.7–6.8 |
| Median, among delayed | 5 | 4–5 |
| Mean, everyone included | 2.5 | 2.2–2.9 |
| Median, everyone included | 0 | 0–0 |
Abbreviations: CI, confidence interval; ED, emergency department.
% Total patients.
Among those with at least 1 delayed visit.
% Among patients with a delay.
Table 5 presents results of the logistic regression model estimating possible factors associated with the potential missed opportunities. The odds of a potential missed opportunity was lower among individuals aged 0–17 as compared to ages 36–45 (OR 0.609 [CI: 0.52–0.72]); and higher for those ages 46–55 (OR 1.27 [CI: 1.12–1.44]) and ages 56–65 (OR 1.23 [CI: 1.08–1.39]). Patients with recurrent UTIs had greater odds of a potential miss (OR 2.08 [CI: 1.63–2.66]) as well as patients who were morbidly obese (OR 1.67 [CI: 1.45–1.92]). Missed opportunities were less likely to occur on days involving an inpatient visit, but were similar if seen for symptoms in the ED vs outpatient only. When patients were seen in multiple locations in a 24-hour period (eg, outpatient and ED, ED and inpatient), missed opportunities were significantly less common.
Table 5.
Odds of Experiencing a Potential Missed Opportunitya
| Coefficient | OR estimate | 95% CI |
|---|---|---|
| Age group, y | ||
| 0–17 | 0.61 | 0.52–0.72 |
| 18–35 | 0.99 | 0.87–1.14 |
| 36–45 | Ref | Ref |
| 46–55 | 1.27 | 1.12–1.44 |
| 56–65 | 1.23 | 1.08–1.39 |
| 65+ | 1.05 | 0.92–1.21 |
| Setting | ||
| Outpatient only | Ref | Ref |
| ED only | 0.99 | 0.88–1.14 |
| Inpatient only | 0.046 | 0.039–0.055 |
| Outpatient and ED | 0.42 | 0.37–0.48 |
| Inpatient and outpatient | 0.030f | 0.025–0.036 |
| Inpatient and ED | 0.028 | 0.020–0.039 |
| All 3 health care settings | 0.024 | 0.015–0.038 |
| Weekend | 1.04 | 0.93–1.18 |
| Health History | ||
| UTI history (>= 2 visits 60–365 days before index) | 2.08 | 1.63–2.7 |
|
Morbid obesity (>=1 visits 365 days before/after index) |
1.80 |
1.45–1.92 |
Abbreviations: CI, confidence interval; ED, emergency department; OR, odds ratio; Ref, reference; UTI, urinary track infection.
Values in bold are statistically significant at P < .05.
Results of logistic regression model for potential missed opportunities. The outcome was experiencing a missed opportunity on a given health care visit date (ie, SSD visit within 21 days of index NSTIG diagnosis) or a correct diagnosis (ie, the index NSTIG diagnosis date).
Discussion
In this large cohort of insured men diagnosed with NSTIG, we found that nearly 50% of patients presented to a health care provider with an SSD in the 21 days prior to undergoing definitive surgical debridement or dying from NSTIG. Of these visits, we estimated that over 60% represented a diagnostic delay. The most common reasons for these visits include genital anatomical abnormalities (eg, scrotal swelling), infections (eg, cellulitis), and genital pain. Importantly, this study identified risk factors for missed diagnoses including morbid obesity and a history of recurrent UTIs, suggesting that both logistical factors (eg, difficult physical exams) and cognitive biases (eg, a focus on more common diagnoses) may contribute to diagnostic delays for NSTIG.
In the late stages of NSTIG, when patients have visual evidence of necrosis, the diagnosis is incontrovertible. Broad-spectrum antibiotics combined with aggressive, expeditious surgical debridement and critical care have decreased mortality to rates <10%- significant improvement from historical rates near 50%.1,18 However, in the last few decades, mortality rates have plateaued.6,8 While this study suggests opportunities exist for earlier diagnoses, the majority of patients presenting with the SSDs we identified (eg, scrotal swelling, pain) will not progress to NSTIG. Because most of these SSDs are substantially more common than NSTIG, it is likely not feasible to investigate every patient with an SSD for NSTIG. This is a universal problem associated with the diagnosis of almost all rare diseases.25 For example, our group has previously shown that in patients diagnosed with herpes sim plex encephalitis, a rare condition affecting only 1–4 patients per million each year, having a prior history of sinusitis was associated with diagnostic delay, implying that the physician (and perhaps the patient) assumed that the overlapping symptoms were most likely the result of the more common condition.
Diagnosing what is common, often despite signs, symptoms, and clinical patterns that might suggest an alternative diagnosis, is called cognitive bias.26 Our results suggest that the diagnosis of NSTIG may also be affected by cognitive biases, given that a history of recurrent UTIs was independently associated with diagnostic delays. Because early symptoms of NSTIG overlap with some UTI symptoms, it is not surprising that this association exists. Future efforts with NSTIG should focus on educating clinicians most likely to see these patients first during the prodromal period (eg, primary care and emergency room doctors) and then tailoring more-intense diagnostic workups to those patients most likely to get NSTIG (eg, obese diabetics). Our results also highlight the need for new approaches to identify the patients most at risk for developing NSTIG and new technologies to aid in more rapid diagnosis of NSTIG.
Because diagnostic delays for NSTIG are not well understood, we conducted an exploratory analysis of possible risk factors for diagnostic delay. The association between morbid obesity and delay in diagnosis deserves special mention. Morbidly obese patients use more health care and have more comorbidities, including higher rates of pain and infectious conditions, potentially introducing cognitive biases similar to UTIs.27,28 In addition, physical exams of morbidly obese patients are more difficult, and therefore, often less thorough.29,30 This may be especially true for already difficult to examine areas like the genitalia and perineum. Similar to UTIs, education about the importance of thorough examinations in obese, at-risk patients with signs and symptoms of NSTIG may be important.
Finally, the pattern of health care utilization may help us understand diagnostic pathways for NSTIG. Patients who were seen by health care providers in more than 1 location in a 24-hour period were significantly less likely to have a missed diagnosis vs those only seen by an ED or primary care provider. While this association may simply be explained by the fact that patients seeing multiple providers are presenting with more serious or obvious cases, an alternative explanation may be that when a provider is in doubt about a diagnosis, they send the patient to a new provider-allowing for a “fresh set of eyes” to reevaluate the patient. Similarly, as NSTIG often progresses rapidly, in the time between the first and second encounter, the diagnosis may become more apparent, enabling a diagnosis that would not have occurred if the patient were sent home after the first visit. Interestingly, only a relatively small proportion of patients had a urology visit of any kind during the diagnostic window before the index diagnosis. Thus, a greater involvement of urology consults may help decrease diagnostic delays for NSTIG. Also of interest was the finding that despite antibiotics being prescribed to 46% of patients with an SSD, all still progressed to NSTIG. While our methodology does not allow us to determine if some non-cohort men may have been spared from NSTIG with antibiotic use, this finding does suggest that NSTIG may not be a simple progression from non-necrotizing infections.
There are limitations to this study. First, we used administrative data and diagnostic codes to identify cases of NSTIG, which have varying sensitivities and specificities. Second, it is possible that some of the non-SSD visits that occurred within 30 days of NSTIG may have represented missed-diagnostic visits if symptoms were incorrectly coded. Third, this data set only includes patients with insurance and the patterns of care for uninsured patients may be very different than we report. Fourth, though these SSDs are assumed to be related to the eventual NSTIG diagnosis, this does not necessarily mean that a clinical error was made. Indeed, it may not be reasonable to jump to consideration of NSTIG when present early in the course of the disease, some missed opportunities may be part of the diagnostic process. As the pathophysiology of NSTIG is still not fully understood- ie, how and why swelling and cellulitis progress to a necrotizing infection is unclear- it remains unknown if earlier intervention (eg, with culture-appropriate antibiotics) or an alternative imaging study would have changed the disease course. To decrease diagnostic delays for NSTIG a better understanding of the natural history of the disease and risk factors for the disease are needed. In addition, future work should focus on identifying actionable diagnostic opportunities using more granular data (eg, lab values, vital signs). Finally, we did not fully investigate the clinical outcomes associated with delay, though future work using this cohort will focus there.
Conclusions
NSTIG has a significant prodromal period during which patients often present with nonspecific genitourinary complaints. In nearly 50% of this large, insured population of patients ultimately diagnosed with NSTIG, there was a health care visit in the 21 days leading up to diagnosis for an SSD- suggesting that in many men, a missed opportunity for earlier diagnosis and treatment/intervention likely existed. While the impact of diagnostic delay requires further study, study findings suggest that developing clinical pathways which aim to minimize the cognitive biases that commonly exist with rare medical conditions (such as NSTIG) may improve overall disease outcomes if they result in an early diagnosis and intervention.
Supplementary Material
Study Need and Importance
Early, aggressive surgical interventions and improved intensive care have decreased necrotizing soft tissue infections of the genitalia (NSTIG) mortality to well below 10%. However, continued clinical improvements, including minimizing the need for debilitating surgery that leads to large volume skin loss, will require a better understanding of the NSTIG prodromal period. We used the IBM MarketScan Research Database and Medicaid claims from2001 to 2020 (over 200 million enrollees) to describe NSTIG prodromal period health care utilization.
What We Found
The NSTIG prodromal period be-gins almost 3 weeks before diagnosis. Within the 21-day diagnostic window, nearly 50% of the 8,098 NSTIG cohort patients presented to a health care facility with a symptomatically similar diagnosis (SSD, most commonly “urologic anatomical abnormalities” such as scrotal swelling; 64%), without the diagnosis of NSTIG being made (see Figure). Simulation models estimated that 41% of patients experienced diagnostic delay, averaging 6.2 days. Patient risk factors for delay included a history of recurrent urinary tract infections (OR 2.1; 95% CI 1.6–2.7) and morbid obesity (OR 1.8; 95% CI 1.5–1.9). Antibiotics were prescribed for 46% of cohort patients during SSD visits.
Limitations
While we presume that the majority of the symptomatically similar diagnoses obtained in the 21-day prior to NSTIG diagnosis represent early stages of the necrotizing disease, this does not necessarily mean that clinical errors were made, nor that conventional early intervention would have prevented progression. The use of administrative data to describe clinical events and our incomplete understanding of how necrotizing infections develop and evolve limit the study.
Interpretation for Patient Care
Our study suggests there are significant opportunities for earlier intervention in NSTIG that may ultimately decrease overall disease morbidity. However, given the relative rarity of the disease relative to their SSDs, improvements in care will only occur if clinicians can better implement diagnostic tools necessary to identify necrotizing infection.
Support:
AHRQ R01 HS027375.
Footnotes
Conflict of Interest: The Authors have no conflicts of interest to disclose.
Ethics Statement: This study was deemed exempt from Institutional Review Board review.
References
- 1.Sorensen MD, Krieger JN, Rivara FP, et al. Fournier’s gangrene: population based epidemiology and outcomes. J Urol 2009;181(5):2120–2126. [DOI] [PMC free article] [PubMed] [Google Scholar]
- 2.Kiran RP. Fournier’s gangrene: a review of 1726 cases. Br J Surg 2000;87(11):1596. [DOI] [PubMed] [Google Scholar]
- 3.Czymek R, Hildebrand P, Kleemann M, et al. New insights into the epidemiology and etiology of Fournier’s gangrene: a review of 33 patients. Infection 2009;37(4):306–312. [DOI] [PubMed] [Google Scholar]
- 4.Ferreira PC, Reis JC, Amarante JM, et al. Fournier’s gangrene: a review of 43 reconstructive cases. Plast Reconstr Surg 2007;119(1):175–184. [DOI] [PubMed] [Google Scholar]
- 5.Nawijn F, Smeeing DPJ, Houwert RM, Leenen LPH, Hietbrink F Time is of the essence when treating necrotizing soft tissue infections: a systematic review and meta-analysis. World JEmerg Surg 2020;15:4. [DOI] [PMC free article] [PubMed] [Google Scholar]
- 6.Garg G, Singh V, Sinha RJ, Sharma A, Pandey S, Aggarwal A. Outcomes of patients with Fournier’s gangrene: 12-year experience from a tertiary care referral center. Turk J Urol 2019;45(supp 1):S111–S116. [DOI] [PMC free article] [PubMed] [Google Scholar]
- 7.Lauerman MH, Kolesnik O, Sethuraman K, et al.Less is more? Antibiotic duration and outcomes in Fournier’s gangrene. J Trauma Acute Care Surg 2017;83(3):443–448. [DOI] [PubMed] [Google Scholar]
- 8.Sparenborg JD, Brems JA, Wood AM, Hwang JJ, Venkatesan K Fournier’s gangrene: a modern analysis of predictors of outcomes. TranslAndrol Urol 2019;8(4):374–378. [DOI] [PMC free article] [PubMed] [Google Scholar]
- 9.El-Qushayri AE, Khalaf KM, Dahy A, et al. Fournier’s gangrene mortality: a 17-year systematic review and meta-analysis. Int J Infect Dis 2020;92:218–225. [DOI] [PubMed] [Google Scholar]
- 10.Levenson RB, Singh AK, Novelline RA. Fournier gangrene: role of imaging. Radiographics 2008;28(2):519–528. [DOI] [PubMed] [Google Scholar]
- 11.McGillicuddy EA, Lischuk AW, Schuster KM,et al. Development of a computed tomography-based scoring system for necrotizing soft-tissue infections. J Trauma 2011;70(4):894–899. [DOI] [PubMed] [Google Scholar]
- 12.Corcoran AT, Smaldone MC, Gibbons EP, WalshTJ, Davies BJ. Validation of the Fournier’s gangrene severity index in a large contemporary series. J Urol 2008;180(3):944–948. [DOI] [PubMed] [Google Scholar]
- 13.Ersoz F, Sari S, Arikan S, et al. Factors affecting mortality in Fournier’s gangrene: experience with fifty-two patients. Singapore Med J 2012;53(8):537–540. [PubMed] [Google Scholar]
- 14.Laor E, Palmer LS, Tolia BM, Reid RE, Winter HI. Outcome prediction in patients with Fournier’s gangrene. J Urol 1995;154(1):89–92. [PubMed] [Google Scholar]
- 15.Wong CH, Khin LW, Heng KS, Tan KC, Low CO. The LRINEC (Laboratory Risk Indicator for Necrotizing Fasciitis) score: a tool for distinguishing necrotizing fasciitis from other soft tissue infections. CritCareMed 2004;32(7):1535–1541. [DOI] [PubMed] [Google Scholar]
- 16.Kobayashi L, Konstantinidis A, Shackelford S,et al. Necrotizing soft tissue infections: delayed surgical treatment is associated with increased number of surgical debridements and morbidity. J Trauma 2011;71(5):1400–1405. [DOI] [PubMed] [Google Scholar]
- 17.Chao WN, Tsai CF, Chang HR, et al. Impact oftiming of surgeryon outcome of Vibriovulnificus-related necrotizing fasciitis. Am J Surg 2013;206(1):32–39. [DOI] [PubMed] [Google Scholar]
- 18.Hagedorn JC, Wessells H. A contemporary up-date on Fournier’s gangrene. Nat Rev Urol 2017;14(4):205–214. [DOI] [PubMed] [Google Scholar]
- 19.Page E A test for a change in a parameter occurring at an unknown point. Biometrika 1955;42(3–4):523–527. [Google Scholar]
- 20.Miller AC, Cavanaugh JE, Arakkal AT, KoenemanSH, Polgreen PM. A comprehensive framework to estimate the frequency, duration and risk factors for diagnostic delays using simulation-based methods. medRxiv: 2021.10.22.21265386;2021. [DOI] [PMC free article] [PubMed] [Google Scholar]
- 21.Waxman DA, Kanzaria HK, Schriger DL. Unrecognized cardiovascular emergencies among Medicare patients. JAMA Intern Med 2018;178(4):477–484. [DOI] [PMC free article] [PubMed] [Google Scholar]
- 22.Miller AC, Arakkal AT, Koeneman S, et al. Incidence, duration and risk factors associated with delayed and missed diagnostic opportunities related to tuberculosis: a population-based longitudinal study. BMJ Open 2021;11(2):e045605. [DOI] [PMC free article] [PubMed] [Google Scholar]
- 23.Miller AC, Koeneman SH, Arakkal AT, Cavanaugh JE, Polgreen PM. Incidence, duration, and risk factors associated with missed opportunities to diagnose herpes simplex encephalitis: a population-based longitudinal study. Open Forum Infect Dis 2021;8(9):ofab400. [DOI] [PMC free article] [PubMed] [Google Scholar]
- 24.R Core Team. R: A Language and Environment for Statistical Computing. R Foundation for Statistical Computing; 2021. [Google Scholar]
- 25.Stoller JK. The challenge of rare diseases. Chest 2018;153(6):1309–1314. [DOI] [PubMed] [Google Scholar]
- 26.Royce CS, Hayes MM, Schwartzstein RM. Teaching critical thinking: a case for instruction in cognitive biases to reduce diagnostic errors and improve patient safety. AcadMed 2019;94(2):187–194. [DOI] [PubMed] [Google Scholar]
- 27.Raebel MA, Malone DC, Conner DA, Xu S, Porter JA, Lanty FA. Health services use and healthcare costs of obese and nonobese individuals. Arch Intern Med 2004;164(19):2135–2140. [DOI] [PubMed] [Google Scholar]
- 28.Okifuji A, Hare BD. The association between chronic pain and obesity. J Pain Res 2015;8:399–408. [DOI] [PMC free article] [PubMed] [Google Scholar]
- 29.Chagpar AB, McMasters KM, Saul J, et al. Body mass index influences palpability but not stage of breast cancer at diagnosis. Am Surg 2007;73(6):555–560. [PubMed] [Google Scholar]
- 30.Silk AW, McTigue KM. Reexamining the physical examination for obese patients. JAMA 2011;305(2):193–194. [DOI] [PubMed] [Google Scholar]
Associated Data
This section collects any data citations, data availability statements, or supplementary materials included in this article.