

Abstract
Inorganic arsenic (iAs) causes cancer by initiating dynamic transitions between epithelial and mesenchymal cell phenotypes. These transitions transform normal cells into cancerous cells, and cancerous cells into metastatic cells. Most in vitro models assume that transitions between states are binary and complete, and do not consider the possibility that intermediate, stable cellular states might exist. In this paper, we describe a new, two-hit in vitro model of iAs-induced carcinogenesis that extends to 28 weeks of iAs exposure. Through week 17, the model faithfully recapitulates known and expected phenotypic, genetic, and epigenetic characteristics of iAs-induced carcinogenesis. By 28 weeks, however, exposed cells exhibit stable, intermediate phenotypes and epigenetic properties, and key transcription factor promoters (SNAI1, ZEB1) enter an epigenetically poised or bivalent state. These data suggest that key epigenetic transitions and cellular states exist during iAs-induced epithelial-to-mesenchymal transition (EMT), and that it is important for our in vitro models to encapsulate all aspects of EMT and the mesenchymal-to-epithelial transition (MET). In so doing, and by understanding the epigenetic systems controlling these transitions, we might find new, unexpected opportunities for developing targeted, cell state-specific therapeutics.
Keywords: inorganic arsenic, epigenetics, epithelial-to-mesenchymal transition, heavy metal carcinogenesis
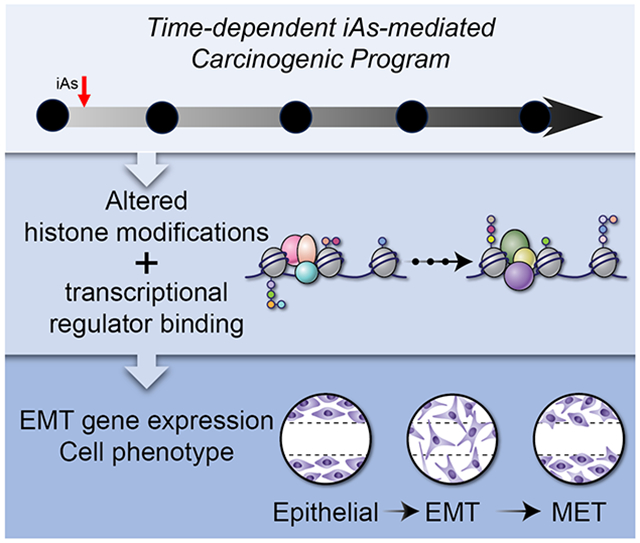
Graphical Abstract
Introduction
Inorganic arsenic (iAs) is a ubiquitous environmental carcinogen that affects millions of people worldwide, primarily through contaminated drinking water (Cheng et al., 2012; IARC, 2004, 2012b; Salnikow and Zhitkovich, 2008). iAs is not a mutagen but causes cells to undergo an epithelial-to-mesenchymal transition (EMT). During EMT, differentiated epithelial cells lose their epithelial junctions and apical-basal polarity; start producing vimentin filaments; gain motility, migration, and invasiveness potential; and become resistant to apoptosis (Boyer et al., 2000; Jolly et al., 2015; Kalluri and Weinberg, 2009; Larue and Bellacosa, 2005; Nieto, 2013; Radisky, 2005; Shagieva et al., 2012). It is known that the EMT process is controlled by several key transcription factors, including SNAIL (encoded by SNAI1), SLUG (encoded by SNAI2), TWIST1 (encoded by TWIST1), and ZEB1 (encoded by ZEB1) (Barrallo-Gimeno and Nieto, 2005; Chaffer et al., 2013; Lamouille et al., 2014; Yang et al., 2004). It has also been shown that DNA methylation and the incorporation of histone variants are key epigenetic mechanisms for regulating iAs-induced carcinogenesis (Klein et al., 2007; Rea et al., 2017; Rea et al., 2018; Rea et al., 2016). However, the mechanisms by which iAs alters gene expression to induce EMT remain largely unknown.
An inherent challenge facing the environmental toxicology field is that carcinogenesis is a multistage process whereby cells are transformed into a cancerous state and eventually metastasize (Angadi and Kale, 2015; Polyak and Weinberg, 2009; Thiery et al., 2009). To colonize a secondary site and develop a secondary tumor, the mesenchymal-like cells derived from the EMT need to revert back to an epithelial phenotype, in the process known as the mesenchymal-to-epithelial transition (MET) (Bakir et al., 2020; Diepenbruck and Christofori, 2016; Nieto et al., 2016). This dynamic plasticity and ability to reverse or change phenotype not only drives tumor progression and metastasis (Goldrath et al., 2002; Marconi et al., 2021), but enables cancer cells to evade therapy and develop drug resistance (Biddle et al., 2011; Grosse-Wilde et al., 2015; Hay, 1995; Thiery et al., 2009; Thiery and Sleeman, 2006; Tripathi et al., 2020; Yu et al., 2013). While most cancers originate in epithelial tissues, it is now known that tumors are a heterogeneous mixture of cells with varying hybrid states (or phenotypes) along the epithelial-mesenchymal continuum (Boyer et al., 2000; Tam and Weinberg, 2013). Unfortunately, these intermediate phenotypes are not captured by most in vitro models of heavy metal-induced carcinogenesis. Rather, the transition from a “normal” to “cancerous” cell is simplified to a binary “all-or-none” process, and hybrid or intermediate phenotypes are disregarded as metastable transient states. This perspective overlooks the possibility that dynamic and reversible transitions between epithelial and mesenchymal phenotypes might themselves be therapeutically actionable targets.
To address these issues, we developed a “two-hit” and time-dependent in vitro iAs exposure model to capture the intermediate and hybrid cellular states that arise during EMT/MET. The idea behind the time-dependent carcinogenic model aims to replicate authentic human exposure or 'priming' conditions, where humans are gradually and chronically exposed to a low carcinogen. Furthermore, they may even experience elevated levels of the same carcinogen or low levels of a second carcinogen, ultimately fostering the development of cancer. Such models have been shown with ionizing radiation exposures (Hauptmann et al., 2016; Tang et al., 2017). The model faithfully recapitulates known phenotypic and transcriptional/regulatory features of EMT and MET, and we identified several new phenotypic and epigenetic states that are not captured or represented by existing in vitro models. Of particular interest was the discovery that key transcription factor promoters acquire a “bivalent” or “poised” epigenetic state during iAs-induced EMT. These data demonstrate that our understanding of EMT/MET is incomplete: epigenetic mechanisms may play a more prominent role in iAs-induced carcinogenesis than previously thought, intermediate cellular states do exist and persist, and that this new in vitro model might open new opportunities for the development of cell state-specific targeted therapeutics.
Materials and Methods
Cell Growth Conditions and Carcinogenic Induction with Sodium Arsenite
Human bronchial epithelial cells (BEAS2B; Table S2) were grown in Dulbecco's modified Eagle medium (Sigma-Aldrich, St. Louis, MO, D6429), supplemented with 10% fetal bovine serum (Sigma Aldrich F0926) and 1% penicillin-streptomycin (Sigma-Aldrich PSL01). Cells were grown to ~80% confluency in a 5% CO2 humidified chamber at 37 °C and passaged every 3–4 days with fresh media. Cells were treated with freshly diluted 0.5 μM sodium arsenite (iAs) (Sigma-Aldrich S-225), at each passage of the cells, for a total of 17 weeks, as shown in Figure 1A and described in detail elsewhere (Rea et al., 2016; Riedmann et al., 2015). As the cells have a slightly faster doubling time with the addition of the iAs, this is taken into consideration when plating cells. Experiments were performed with time-matched control cells. At the end of 17 weeks, cells were then exposed to 2.0 μM iAs for an additional 10 weeks. This extended exposure (culminating in 2.0T cells) mimics a “second hit” of a carcinogen (Chen et al., 2018). Cells were grown, exposed to iAs, and harvested as three biological replicates at t=0 (NT), 3, 8, 17, and 28 (2.0T) weeks. As a control for the “second hit”, we extended the exposure of cells to 0.5 μM iAs for an additional 10 weeks, reaching week 28.
Figure 1. Chronic, low-dose iAs-transformed cells exhibit mesenchymal features and gain migratory and invasive characteristics.

Data shown are the mean of three independent experiments ± SEM. **** p<0.05. Cells were fixed and stained with crystal violet. (A) Diagram of the iAs-treatment model used in this study. BEAS2B cells were grown and exposed to 0.5 μM iAs for up to 17 weeks, then 2.0 μM iAs was added for another 10 weeks (28 weeks total iAs exposure). Cells were harvested at weeks NT, 3, 8, 17 and at the end of the 2.0T exposure. Cells were flash frozen and stored at −80 °C until pellet was used for analyses. (B) Representative images of cells at each week of the iAs-induced EMT. Cells gain a more mesenchymal phenotype (more elongated) through week 17 and begin to revert to a more epithelial state in the 2.0T. Scale bar is 100 μm. (C) Representative images of transwell migration assays from iAs-exposed cells. Scale bar is 100 μm (D) Quantification of transwell migration assays shown normalized to NT cells. (E) Representative images of wound healing assays of cells at 0 (Scale bar is 500 μm) and 24 hours after wounding (Scale bar is 200 μm). (F) Quantification of wound healed after 24 hours. Data is mean of n=3 ± s.e.m, p < 0.05 by one-way ANOVA as we compared all changes to NT.
Transwell Migration Assay
Cells were split and starved with blocking media (DMEM + 0.1% BSA) overnight. The transwell inserts (8.0 μm pore; VWR, Radnor, PA, # 82050-028) were coated with coating solution (1X PBS, 15 μg/mL collagen, BD Biosciences, Franklin Lakes, NJ, #354249; 42.6 μM NaOH) for 60 minutes at 37 °C. Inserts were washed with PBS, and then blocked with blocking media for 1 hour at 37 °C. Starved cells were harvested and resuspended at ~2.0 x 10⁵ cells/mL in DMEM without serum, and 100 μL of the cell suspension was added to the inserts (~2.0 x 10⁴ cells per well). DMEM containing 20 ng/mL EGF was placed in the bottom chamber. Cells were placed back in the incubator for 24 hours, after which we removed the inserts and the cells that remained in the upper chamber. Cells that migrated through the membrane were washed, fixed with methanol for 15 minutes, stained with DAPI (1% TritonX-100, 10 μg/mL DAPI) for 15 minutes, washed with PBS, and imaged on an Olympus CKX53 at 40X magnification. Each transwell assay was performed in triplicate, with three transwell replicates per biological replicate and 3-4 images per insert. Cells were counted using cellSens Standard software (Olympus, Center Valley, PA) (Table S4).
Wound Healing Assay
Cells were grown to ~80% confluency in 6-well plates as described above. We then used a 1 mL pipette tip to create a “wound” in the cell monolayer. After creating the wound, each plate was washed with PBS, fresh media added, and an image taken for each plate using an Olympus CKX53 at 40X magnification. The “width” of the open wound was measured using cellSens Standard software (Olympus), and at t=0 (NT, non-treated) was roughly equivalent to the diameter of the 1 mL pipette tip. Plates were returned to the incubator for 24 hours, re-imaged, and the width of the remaining open wound was measured. Each wound healing assay was performed in triplicate with three wells per biological replicate, and 3–4 images per well (Table S4).
Anchorage-Independent Growth Assay
At each timepoint shown in Figure 1A (t = NT, 3, 8, 17, 28 and 2.0T), cells were harvested, diluted to ~1.0 x 10⁶/mL, mixed with 0.36% agarose (8.19 mL DMEM + 810 μL 4% agarose), and plated onto a pre-solidified lower layer of 0.75% agarose (8.2 mL DMEM + 1.8 mL 4% agarose) in 6-well plates. Each well received ~75,000 cells, and 500 μL of DMEM was added weekly to maintain moisture. After three weeks, cells were fixed and stained with crystal violet, and washed with PBS. Images were taken with an Olympus CKX53 at 10X magnification. Colonies were counted and quantified from three independent experiments with three replicates per group (Table S4).
Spheroid Growth Assay
Single-cell suspensions were prepared in triplicate in serum-free DMEM and embedded into a 1:1 collagen (Sigma 5162): Matrigel (Sigma, E1270) mixture in 24-well plates. Cells were grown in the collagen/Matrigel matrix for 5–7 days. Morphology was examined by phase-contrast microscopy as described elsewhere (Xiong et al., 2016). For western blot analysis and RNA extraction for qRT-PCR, cells were washed three times with cold 1X PBS to remove collagen/Matrigel matrix, centrifuged at 2000 x g for 5 min at 4 °C after each wash. The number of spheroids with filopodial projections was quantified (Table S4).
Xenografts
All animal experiments were performed in accordance with institutional guidelines under University of Kentucky IACUC approval. Cells from each treatment timepoint (t=NT, 3, 8, 17, and 2.0T) were counted, washed once with PBS, and then resuspended at a concentration of ~1.0 x 10⁷ cells/mL in a 1:1 (v/v) dilution of PBS and growth factor reduced Matrigel matrix (Corning, Corning, NY, #354230, Lot #7296006). NGS mice (Table S2) were anesthetized with isoflurane and injected in the hind leg subcutaneously with ~1.0 x 10⁶ cells in 100 μL total volume. Twelve mice were injected in both left and right legs each with an independent sample of cells, a total of four injections per cell type were performed (n =4). Tumor size (length and width) was measured once weekly. Animals were sacrificed at seven weeks, tumors were harvested, imaged, and flash frozen in liquid nitrogen for further analysis. Mice that did not develop tumors were monitored until all other mice that did develop tumors were sacrificed.
RNA Quantification/qRT-PCR
RNA was isolated from BEAS2B cell cultures using a Quick RNA Mini-Prep kit (Zymo Research, Irving, CA, #R1057). To prepare cDNA, 1 μg of RNA was used in a reverse transcriptase reaction with iScript reverse transcriptase (Bio-Rad, Hercules, CA, #1708891). Each quantitative reverse transcription-polymerase chain reaction (qRT-PCR) was performed with 25 ng of cDNA using the following thermal cycling conditions: 1) 94 °C for 5 min; 2) 94 °C for 30 sec; 3) 56 °C for 30 sec; 4) 72 °C for 45 sec; 5) repeat steps 2–4 for 40 cycles; 6) 72 °C for 10 min. PCR primers were designed in PrimerBank and are listed in Table S1. Target gene expression was normalized to the GADPH housekeeping gene, and then plotted as fold change in expression (2-ddCt) relative to the t=NT sample. Each experiment was performed with at least three biological and technical replicates, and data are presented as the mean ± s.e.m. Statistical significance was measured with one-way ANOVA at p < 0.05, with Dunnett’s post-hoc tests to compare each iAs-treatment group to NT (Table S4).
Western blots
Total protein was extracted from ~107 cells. Cells were first pelleted at 2500 x g at 4 °C for 5 min and washed twice with cold PBS. The pellet was resuspended in 200 μL of Radioimmunoprecipitation Assay (RIPA) buffer + protease Inhibitors and sonicated at “low” power in a Biorupter for 12 cycles of 30 seconds on and 30 seconds off. The lysate was centrifuged for 15 min at 10,000 xg at 4 °C, the supernatant saved, and total protein quantified with a BCA Kit (ThermoFisher, Waltham, MA, #23225). Equal amounts of protein were loaded and resolved on 10% SDS-PAGE gels run at 150 V until the loading dye reached the end of the gel. Proteins were then transferred to polyvinylidene fluoride (PVDF) membranes at 65 V for 90 min (on ice). Membranes were blocked with a PBS solution containing 5% milk + Tween 20 (PBST), and then incubated with primary antibodies (Table S2, all at 1:1000 dilution) in 0.5% milk + PBST overnight at 4 °C. We then added alkaline phosphatase-conjugated secondary antibodies (Table S2) for one hour at room temperature, washed the membranes with PBST, generated signal using ECF substrate (VWR 95040-078), and imaged the blots on a Bio-Rad Chemi-Doc. Quantification of Western Blot bands are shown in Table S3. Quantification was performed using Image J software and relativized to protein levels in time-matched NT cells.
Chromatin Immunoprecipitation and DNA Occupancy Quantification by Quantitative PCR (ChIP-qPCR)
Approximately 1.0 x 10⁷ cells were suspended in 10 mL of DMEM, and formaldehyde added to achieve 1% v:v concentration. The cells were fixed by rotating at 25 °C for 10 min. Glycine was then added to a final concentration of 125 mM, cells rotated for 5 min, and pelleted by low-speed centrifugation at 4 °C. Fixed cells were then washed three times with cold PBS and flash frozen for later use. Cells were thawed on ice, resuspended in 1 mL of prechilled cell lysis buffer (5 mM PIPES, pH 8.0, 85 mM KCl, 1% NP-40) containing 1 mM phenylmethylsulfonyl fluoride (PMSF) and 1X Protease Inhibitor Cocktail (PIC, Epigentek R-1101) and lysed on ice for 20 min by gently flicking the tube every 4–5 minutes. Nuclei were collected by centrifuging at 2000 x g for 5 minutes at 4 °C and resuspended in room temperature nuclei lysis buffer (50 mM Tris-Cl pH 8.0, 10 mM EDTA, 1% SDS) + 1X PIC/1mM PMSF. Nuclei were immediately placed in a 1 mL AFA fiber milliTube (Covaris, Woburn, MA, #520130) and sonicated in a Covaris sonicator at 7 W average incident power; 140 W peak incident power; 5% duty factor; 200 cycles/bursts; and 930 sec total sonication time. After sonication, lysates were centrifuged for 10 min at 10,000 x g at 4 °C. The supernatant was carefully removed, DNA concentration was measured on a Qubit3 fluorometer and 40 μg of chromatin combined with 4 volumes of 5X dilution buffer (20 mM Tris-Cl pH 8.0, 150 mM NaCl, 1 mM EDTA, 1% Triton X-100, 0.01% SDS, + 1XPIC/1mM PMSF).
ChIP experiments targeted H3K4me3, H3K9ac, H3K9me3, and H3K27me3 markers. For each immunoprecipitation, we added 4 μg of antibody (Table S2) to the nuclear lysate and rotated the tubes overnight at 4 °C. The next day, we prepared magnetic beads (Dynabeads Protein G, ThermoFisher #100004D) by washing them twice with 5X dilution buffer and added 30 μL equivalent to each sample. Tubes were rotated for 2 hr at 4 °C. After 2 hr, the tubes were placed on a magnetic stand and the supernatant removed. Beads were washed twice with a low-salt wash buffer (20 mM Tris-Cl pH8.0, 150 mM NaCl, 2 mM EDTA, 1% Triton X-100, 0.1% SDS, fresh PMSF), twice with a high salt wash buffer (20 Tris-Cl pH 8.0, 500 mM NaCl, 2 mM EDTA, 1% Triton X-100, 0.1% SDS, fresh PMSF), once with LiCl wash buffer (20 mM Tris-Cl pH8.0, 250 mM LiCl, 1 mM EDTA, 1% NP-40, 1% sodium deoxycholate, fresh PMSF), and once with TE (10 mM Tris-Cl, pH 8.0, 1 mM EDTA, fresh PMSF). Each wash step was 5 min at room temperature on a rotating stand, and for the TE wash step the magnetic beads were moved to a fresh tube. Immunoprecipitated material was eluted from the beads in 100 μL of freshly prepared elution buffer (50 mM sodium bicarbonate, 1% SDS) at 65 °C for 30 minutes, shaking at 1200 rpm in an Eppendorf Thermomixer. The eluate was transferred to a PCR tube, and NaCl added to final concentration of 0.3 M. We then added 1 μL of 20 mg/mL Proteinase K to each tube, and incubated the tubes overnight at 67 °C. The next morning, we added 1 μL of 10 mg/mL RNAseA and incubated the tubes at 37 °C for 30 minutes. The resulting DNA was purified with a Qiagen PCR cleanup kit (Qiagen, Hilden, Germany, #28104) and eluted in 40 μL of 10 mM Tris-Cl pH 8.0. Occupancy of histone modifications (H3K4me3, H3K9ac, H3K9me3, and H3K27me3) at the EMT marker genes was evaluated using 1 μL of eluate by qPCR (see program described above in gene expression studies) using PCR primers (Table S1) and thermal cycling conditions described above. IgG negative control was performed (data not shown). Target occupany was normalized to the input for each sample, and then plotted as fold change in expression (2-ddCt) relative to the t=NT sample. Each experiment was performed with at least three biological and technical replicates, and data are presented as the mean ± s.e.m. Statistical significance was measured with ANOVA at p < 0.05, with Dunnett’s post-hoc tests to compare each iAs-treatment group to NT (Table S5).
Results
Chronic in vitro exposure model recapitulates key phenotypic features of EMT and MET
We previously reported that BEAS2B cells exposed to 0.5 μM iAs for 8 weeks undergo EMT (Rea et al., 2017; Rea et al., 2018; Rea et al., 2016; Riedmann et al., 2015). Here, we exposed BEAS2B cells to 0.5 μM iAs for 17 weeks, then added 2.0 μM iAs for another 10 weeks (28 weeks total) to mimic a “second environmental hit” that might be required for cells to become malignant (Chen et al., 2018; Chilakapati et al., 2010; Zhao et al., 1997). As control, cells were continuously exposed to the 0.5 μM iAs until week 28, to match the 2.0 μM exposed cells. As previously shown (Chen et al., 2018; Riedmann et al., 2015), cell morphology clearly changed over the course of iAs treatment relative to non-treated (NT) cells (Figure 1B). After 3 weeks of 0.5 μM iAs exposure, BEAS2B cells were still predominantly epithelial in shape. By 8 weeks, however, some cells became spindle-like (mesenchymal), and by week 17 most cells displayed a mesenchymal phenotype (Alison et al., 2012; Angadi and Kale, 2015; Hay, 1995). Surprisingly, a portion of the 2.0T cells appeared to revert to an epithelial shape (Figure 1B).
These data suggest that even after prolonged exposure and “two hits”, cells were in different stages of malignant transformation, with many retaining a mesenchymal phenotype.
We next investigated the migratory potential of these cells (Figure 1C and D; Supplemental Figure 1A). NT and W3 cells had low migratory potential, with very few cells crossing the transwell membrane (Figure 1C). The W8 (p < 0.01) and W17 (p <0.01) cells had the highest migratory potential, with an ~1.5-fold increase in cells that crossed the membrane (Figure 1D). Interestingly, the 2.0T cells again had an “intermediate” phenotype; migration levels were lower than the W8 and W17 cells (p < 0.01), but more than the NT (p < 0.01) cells. These data are consistent with data in Figure 1B, where some 2.0T cells seemed to revert to an epithelial phenotype but many retained a mesenchymal phenotype. The wound-healing assay (Figure 1E and F; Supplemental Figure 1B) confirmed the migratory potential. NT, W3, and W8 cells all exhibited similar wound healing potential, with ~40% of the wound healed after 24 hours. W17 cells healed ~70% of the wound after 24 hours (p < 0.001), but the 2.0T cells again showed an intermediate phenotype (Figure 1E and F; ~60% of the wound is healed, p < 0.001). Together, these data suggest that 0.5 μM iAs exposure enables cells to gain migratory potential (through W17), but that cells begin entering a fully transformed state after secondary (and higher) iAs exposure.
Chronic, low dose iAs exposed cells gain tumorigenic properties
We next asked if chronically exposed BEAS2B cells gain tumorigenic potential. We performed anchorage-independent growth tests in soft agar (Figure 2A and B; Supplemental Figure 1C), and organoid formation tests on a collagen/Matrigel matrix (Figure 2C and D; Supplemental Figure 1D)(Xiong et al., 2016). In the soft agar assay, NT and W3 cells formed very few colonies. W8 and W17 cells formed more colonies than NT cells (p < 0.001), reflecting a slight increase in tumorigenic potential. The 2.0T cells not only formed the most colonies (> 45%, p < 0.001), but the colonies appeared larger than those formed from the other iAs-exposed cells (Figure 2A). All exposed cells formed spheroid-shaped organoid colonies (Figure 2C and D), but only 2.0T cells had a significant increase in the number of spheroids with filipodia (40% vs 10% for other cells; p < 0.001), where filipodia are characteristic of metastatic tumors (Arjonen et al., 2011; Jacquemet et al., 2015).
Figure 2. Late stage iAs-transformed cells gain tumorigenic properties.

(A) Representative images of anchorage-independent growth assays of cells throughout iAs exposure. Scale bar is 200 μm. (B) Quantification of anchorage-independent growth assays. (C) Representative images of spheroid growth by iAs-treated cells (Top). Zoomed in image showing filopodia formed in the 2.0T cells (Bottom). Arrows highlight characteristic filopodia protruding from cells’ edges. Scale bar is 200 μm. (D) Quantification of spheroid filopodia projections. (E) Representative images of xenograft tumors formed in mice (Left W17, Right 2.0T) seven weeks post subcutaneous injection of cells. Tumors only formed from W17 and 2.0T. Scale bar is 1 cm. (F) Xenograft volumes measured at each week post injection. Data shown are the average of four tumors ± SEM. * denotes p<0.05. (G) Final xenograft weights when harvested at seven weeks post subcutaneous injection. Data is mean of n=3 ± s.e.m, p < 0.05 by one-way ANOVA as we compared all changes to NT.
When we subcutaneously injected cells into NSGS mice, only W17 and 2.0T cells formed tumors (Figure 2E). The 2.0T-derived tumors developed faster (Figure 2F; Supplemental Figure 1E) and were larger (by volume) than W17-derived tumors (Figure 2F; Supplemental Figure 1E) but were not significantly different from W7 tumors based on average tumor weight (Figure 2G; Supplemental Figure 1E). Together, these data indicate that chronically exposed BEAS2B cells were in various stages of malignant transformation (as expected), but that 2.0T cells contained a sub-population that was undergoing MET, which is essential for metastatic colonization (Lim and Thiery, 2012; Thiery et al., 2009). We controlled for time of exposure of the 2.0T cells with time-matched 0.5 μM iAs (exposed also for 28 weeks with 0.5 μM iAs).We show a similar trend, albeit with lower changes compared to the 2.0T cells, for both transwell migration assays (Supplemental Figure 2A). and soft agar assays (Supplemental Figure 2B). in these time-matched control cells.
EMT marker gene expression correlates with expected waves of transcriptional control
We next used real-time PCR to quantify EMT and MET marker gene expression. For key epithelial marker genes (Ayroles et al., 2015; Hay, 1995; Larue and Bellacosa, 2005; Markovitz-Bishitz et al., 2010; Zeisberg and Neilson, 2009), we observed the expected sequence and patterns of gene expression up until W17, whereupon CLDN1, CDH1, TJP1, and CTNNB1 expression started to trend upward (Figure 3A; Supplemental Figure 3A). For markers of the mesenchymal state (Hiraguri et al., 1998; Person et al., 2015; Shagieva et al., 2012; Zeisberg and Neilson, 2009), we observed a range of responses (Figure 3B; Supplemental Figure 3B). We observed expected results for the mesenchymal markers CDH2 and FOXC2 through W17. In the 2.0T cells, the expression of CDH2 curiously started to decrease; however, FOXC2 remained increased in expression. Surprisingly, the expression of VIM showed an oscillating pattern through the weeks of iAs exposure. Expression of these EMT-related marker genes is orchestrated by SNAIL, TWIST, and ZEB transcription factors (Yang et al., 2004), so we also profiled the expression of these transcription factors (Figure 3C; Supplemental Figure 3C). We found that the expression of these EMT-TFs (SNAI1, SNAI2, and ZEB1) showed expression patterns expected of cells undergoing the EMT process. Interestingly, in the 2.0T cells the expression of SNAI1 decreased, while SNAI2 and ZEB1 remained high, potentially maintaining the mesenchymal states observed (Figure 3C). Differences in gene expression were confirmed by western blot (Figure 3D, Supplemental Figure 3E, Table S3). We then looked at the expression profiles of other genes that may be important in iAs-induced carcinogenesis. AS3MT, for example, is responsible for methylating iAs so it can be metabolized by cells (Engström et al., 2013). As expected, we saw increased AS3MT expression throughout the iAs-exposure, but surprisingly, actin expression (ACTB) was reduced throughout the iAs treatment (Supplemental Figure 3D and E). Similar gene expression profiles were observed in 3D spheroids, data that were confirmed by western blot (Figure 3E and 3F, and Supplemental Figure 3F and G, Table S3). Based on the combined phenotypic and gene expression data, it seems clear that iAs-exposed BEAS2B cells are in different stages of EMT through W17 but are transitioning into MET by 2.0T. There also appears to be several phases to the EMT, specifically: NT cells are epithelial, W3 cells are in a pre-EMT stage, W8 cells are in the middle of the EMT process (mid-EMT), W17 cells are in a late stage of EMT (Late-EMT), and 2.0T cells are undergoing MET. Compared to the 2.0T cells, the time-matched 0.5 μM iAs exposed cells for 28 weeks, showed similar changes in gene expression trends, albeit less robust (Supplemental Figure 4 A-G). This suggests that the observed effects in 2.0T cells are attributed to the level of iAs exposure accelerating the transformation (Chen et al., 2018), rather than the duration of exposure.
Figure 3. EMT-related gene expression changes during iAs-induced transformation.

Shown are qRT-PCR fold change in gene expression of EMT markers through iAs-induced carcinogenesis. Data shown are the mean of three independent experiments ± SEM. (A) Epithelial marker genes (CLDN1, CDH1, TJP1). (B) Mesenchymal marker genes (CDH2, FOXC2, VIM). (C) EMT-associated transcription factors (SNAI1, SNAI2, ZEB1). (D) Western blot of EMT-associated Marker genes. (E) EMT markers in cells grown in 3D culture (CTNNB1, CDH1, CDH2, CDH3, SNAI1). For clarity, statistical notations (*) are not shown. Data is mean of n=3 ± s.e.m, p < 0.05 by one-way ANOVA as all weekly changes were compared to time-matched NT control. (F) Western blots of EMT-associated Marker genes in the 3D cell culture.
Histone modifications predict EMT reprogramming and gene expression. Unique epigenetic states emerge during EMT?
EMT and MET require interactions between many transcription factors and epigenetic regulators. As an initial inquiry into epigenetic states during the different phases of EMT and MET, we used ChIP-qPCR to quantify activating (H3K4me3 and H3K9ac) and repressive (H3K9me3 and, H3K27me3) histone marks at the promoters of epithelial-related genes. As expected and coincident with reduced CDH1 expression in W3–W18 cells, we detected increased occupancy of repressive marks and reduced occupancy of activating histone marks (Figures 4A and 5; Supplemental Figures 5 and 6, Table S3). The 2.0T cells exhibited increased CDH1 expression, which was accompanied by increased occupancy of the activating H3K9ac mark and decreased occupancy of repressive marks. Similar dynamics were observed at CTNNB1 (Figure 4B). TJP1 (Figure 4C) was interesting because there was abundant repressive H3K9me3 marks through W17, but activating marks started accumulating in the 2.0T cells. The data from W3 through W17 are generally consistent with reported reductions in CTNNB1 and TJP1 expression as cells undergo EMT (Zeisberg and Neilson, 2009), but trends in the 2.0T data were unexpected.
Figure 4. SNAI1 bivalent chromatin state driven by iAs-induced carcinogenesis.

Data from ChIP-qPCR for the occupancy of histone modifications at EMT-related promoters throughout iAs-induced carcinogenesis. Data are mean from three independent experiments ± SEM. Inset graph show gene expression changes. Epithelial-related gene promoters: (A) CDH1, (B) CTNNB1, (C) TJP1; Mesenchymal-related gene promoters: (D) CDH2, (E) VIM; EMT-related transcription factor promoters: (F) SNAI1, (G) ZEB1, (H) SNAI2. For clarity, statistical notations (*) are not shown. Data is mean of n=3 ± s.e.m, p < 0.05 by one-way ANOVA as all weekly changes were compared to time-matched NT control.
Figure 5. Epigenetic Landscape Changes of EMT-Associated genes.

Cartoons of EMT-related gene promoter regions showing relative levels of histone post-translational modifications throughout the iAs exposure. (A) CDH1 Proximal Promoter. (B) CDH2 Proximal Promoter. (C) SNAI1 Proximal Promoter
We next investigated the mesenchymal-related gene promoters. At the CDH2 promoter, we found increased occupancy of activating histone marks through W17, followed by a downward trend at 2.0T (Figure 4D). The observed decrease in activating marks was not accompanied by a coordinated increase in repressive marks. The VIM promoter showed an interesting oscillation in activating versus repressive histone marks (Figure 4E) that was consistent with oscillating gene expression (Figure 3B and Supplemental Figure 3B). These data are also consistent with the observed changes in migratory potential (Figure 1), and other studies showing that Vim coordinates many events in EMT (Usman et al., 2021). Indeed, the presence of activating versus repressive histone marks was generally consistent with observed gene expression data throughout the exposure time course, and consistent with other carcinogenic (Peixoto et al., 2019) and cellular differentiation models (Bhat et al., 2017; Chen and Wu, 2016; Giles et al., 2022).
Transcription factor promoters become bivalent during iAs-induced EMT
We next investigated the promoters of transcription factors SNAI1, SNAI2, and ZEB1, each of which is a key regulator of EMT. Interestingly, the SNAI1 and ZEB1 promoters acquired active and repressive histone marks throughout the time course (Figure 4F and G, Figure 5; Supplemental Figures 5,6,7), indicative of a “bivalent” or “poised” state (Bernhart et al., 2016; Li et al., 2018). At 2.0T, we also observed a trend toward increased activating and repressive marks in the SNAI2 promoter (Figure 4H), suggestive of bivalency. “Poised” SNAI1 and ZEB1 transcription factor promoters (especially at SNAI1) are consistent with their known roles as regulators of EMT (Casas et al., 2011; Chaffer et al., 2013; Cuddapah et al., 2009; Jose et al., 2014; Lamouille et al., 2014; Sun and Fang, 2016; Yang et al., 2004), and the need to rapidly respond to internal or external cues.
Discussion
Chronic, low dose iAs exposure with a second hit drives full tumorigenic potential.
It has been established, by ourselves and others, that chronic exposure to low-dose iAs transforms cells into a cancerous state (Person et al., 2015; Rea et al., 2017; Rea et al., 2018; Tokar et al., 2010). In this study, we extend these findings and present a two-hit model of iAs-induced carcinogenesis in BEAS2B lung epithelial cells. The idea behind this time-dependent carcinogenic model was to mimic real human exposure or ‘priming’ conditions, where humans are gradually and constantly exposed to a low carcinogenicity over a long period. Such models have been shown with low ionizing radiation exposures (Hauptmann et al., 2016; Tang et al., 2017) where the low dose sensitizes the human subject, until a secondary ‘hit’ comes in, to drive full carcinogenesis. This is based on the Hanahan and Weinberg multi-hit model for carcinogenesis, which proposes that transformation requires an initiating event (Hanahan and Weinberg, 2011). Here we describe a time-dependent, multistage iAs-carcinogenesis EMT model where we see epigenetic mechanisms driving the initiation, progression, and establishment of cancer.
Exposure of BEAS2B cells with chronic low-dose of iAs, resulted in a time-dependent upregulation of vimentin and N-cadherin and downregulation of E-cadherin (E-cad), indicating that these cells underwent EMT. Loss of E-cad is a critical step for EMT initiation and is regulated by several transcriptional repressors such as Snail (Batlle et al., 2000), Slug (Liu et al., 2012), Twist (Kwok et al., 2005; Liu et al., 2014), and Zeb1 (Drake et al., 2009). The downregulation of E-cad during this process is inversely correlated with the upregulation of Slug, Snail, Twist and Zeb1. In our model, we observed that Snail’s expression peaked at week 8 (W8), while Slug and Zeb1 peaked at W17 (Figure 3). Our results suggest that Snail is the early driver of iAs-mediated EMT, which is in contrast with studies that Zeb1 expression drives chromium-mediated EMT in cells (Casas et al., 2011; Eckert et al., 2011; Wang et al., 2011). We hypothesize that the early expression of Snail, then drives the expression of the other master EMT TFs. The added expression of all these ‘master’ EMT transcription factors, Snail, Slug, Zeb1 and Twist, then fuels the maximum repression of E-cad (Wels et al., 2011). Future studies will tease directly whether Snail drives the expression of these other TFs.
This situation of increased master transcription factor expression and decrease in E-cad expression, reverted in 2.0T cells. In details, we observed an increase in Ecad’s expression while that of Snail, Slug, and Zeb1 decreased (Figure 3). In fact the re-expression of E-cad has been suggested to cause MET and colonization in breast cancer (Palen et al., 2016). We therefore hypothesize that this re-expression of E-cad drives metastatic colonization of cells as has been shown in breast cancer (Palen et al., 2016). Overall, throughout this model, we observed a steady decline of epithelial markers and gain of mesenchymal markers (Figure 3). In 2.0T cells, the expression profile seemed to revert, suggesting a mesenchymal-to-epithelial transformation (MET). Supporting this MET transformation are studies showing that mesenchymal cells partially revert to the epithelial phenotype to colonize new sites (Gunasinghe et al., 2012; Ocaña et al., 2012). Based on this dynamic expression of key EMT markers, we hypothesize that these cells were in different EMT/MET stages in the weekly progression timeline.
Intermediate states in the iAs-induced carcinogenesis
Cancer is a multi-stage process. Most studies up to this point have evaluated carcinogenesis as ‘an all or nothing’ process, binning these reversible hybrid steps together, possibly missing steps that could be targeted for possible therapy. We therefore developed a more detailed model of carcinogenesis to better capture the full multistage process, which appears to involve several hybrid steps. Based on the expression pattern of key EMT genes during this weekly iAs-exposure, we sliced the process into several stages (Dongre and Weinberg, 2019; Yang et al., 2020). We confirmed these stages using phenotypic, migratory, invasive, and tumorigenic potential of the cells. Of interest the cells grown after exposure to second hit of iAs (2.0T cells), showed a reversion from mesenchymal to epithelial, albeit complete. Our studies show the plasticity of cells during EMT, is essential for cancer progression and might be a target for drug therapy (Hass et al., 2020), and drug resistance (Hay, 1995; Thiery and Sleeman, 2006; Tripathi et al., 2020; Yu et al., 2013). Since iAs at low dose is a weak mutagen (Klein et al., 2007), we hypothesize that epigenetics might be responsible for the plasticity and carcinogenic potential of these cells. These findings, therefore, support a dynamic extended multistage EMT model where epigenetic mechanisms drive the interconversions between low and high tumorigenic states, thus increasing tumorigenicity.
Chronic, low dose iAs exposure sets Bivalent promoter at SNAI1
We recently had showed large-scale changes in DNA methylation (Eckstein et al., 2017; Rea et al., 2017), histone variant incorporation (Rea et al., 2016); hydroxymethylation (Rea et al., 2018) and chromatin structure during iAs-mediated EMT(Riedmann et al., 2015). In this study, we determined how epigenetic processes regulate the expression of EMT transcription factors on a gene-specific level. We analyzed the PTMs on the promoters of the on Slug, Zeb1, and Snail. One of our critical findings is that promoters of the Snail family transcription factors (SNAI1 and SNAI2) gained a bivalent chromatin state during the iAs-induced carcinogenesis (Figures 4 and 5). Maintenance of the promoters of the Snail transcription factors in a poised bivalent state, possibly allows these transcription factors to readily respond to signals as shown in other cases (Bernstein et al., 2006). Interestingly this bivalency is resolved at the late stage of transformation (2.0T) to a repressed mark (Figure 5). These results are consistent with other studies that showed bivalency at the ZEB1 during EMT to maintain the plasticity observed in carcinogenic cells (Chaffer et al., 2013).
Conclusions
Our findings therefore support a dynamic multistage EMT model where epigenetic mechanisms drive the interconversions between low and high tumorigenic states, thus increasing tumorigenicity and malignancy. This study therefore provides a platform to investigate epigenomic changes occurring during these hybrid states with the potential to develop therapeutics for iAs-mediated carcinogenesis.
Supplementary Material
Highlights.
iAs drives a multistage carcinogenesis
Epigenetic changes across iAs exposure delineate multiple stages of carcinogenesis
SNAI1 promoter gains bivalency during iAs-mediated carcinogenesis
Acknowledgements
The authors thank Donna Gilbreath at the University of Kentucky Markey Cancer Center for her assistance with the manuscript preparation.
Funding
This research was supported by National Science Foundation grants NSF/MCB 151798 and NSF/MCB 016515 (Y.F.-M.) and National Institutes of Health grants R01 ES024478 and R01 ES034253 (Y.F.-M.).
Abbreviations:
- EMT
Epithelial-to-Mesenchymal Transition
- iAs
Inorganic Arsenic
- MET
Mesenchymal-to-Epithelial Transition
- TFs
transcription factor
- qrt-PCR
quantitative real time PCR
Footnotes
Publisher's Disclaimer: This is a PDF file of an unedited manuscript that has been accepted for publication. As a service to our customers we are providing this early version of the manuscript. The manuscript will undergo copyediting, typesetting, and review of the resulting proof before it is published in its final form. Please note that during the production process errors may be discovered which could affect the content, and all legal disclaimers that apply to the journal pertain.
Conflicts of Interest
The authors declare no conflict of interest. The funders had no role in the design of the study; in the collection, analyses, or interpretation of data; in the writing of the manuscript; or in the decision to publish the results.
Declaration of interests
The authors declare that they have no known competing financial interests or personal relationships that could have appeared to influence the work reported in this paper.
References
- Alison MR, Lin W-R, Lim SML, Nicholson LJ, 2012. Cancer stem cells: In the line of fire. Cancer Treatment Reviews 38, 589598. [DOI] [PubMed] [Google Scholar]
- Angadi P, Kale A, 2015. Epithelial-mesenchymal transition - A fundamental mechanism in cancer progression: An overview. Indian Journal of Health Sciences and Biomedical Research (KLEU) 8, 77–84. [Google Scholar]
- Arjonen A, Kaukonen R, Ivaska J, 2011. Filopodia and adhesion in cancer cell motility. Cell adhesion & migration 5, 421–430. [DOI] [PMC free article] [PubMed] [Google Scholar]
- Ayroles JF, Buchanan SM, O'Leary C, Skutt-Kakaria K, Grenier JK, Clark AG, Hartl DL, de Bivort BL, 2015. Behavioral idiosyncrasy reveals genetic control of phenotypic variability. Proc. Natl. Acad. Sci. USA 112, 6706–6711. [DOI] [PMC free article] [PubMed] [Google Scholar]
- Bakir B, Chiarella AM, Pitarresi JR, Rustgi AK, 2020. EMT, MET, Plasticity, and Tumor Metastasis. Trends Cell Biol 30, 764–776. [DOI] [PMC free article] [PubMed] [Google Scholar]
- Barrallo-Gimeno A, Nieto MA, 2005. The Snail genes as inducers of cell movement and survival: implications in development and cancer. Development 132, 3151–3161. [DOI] [PubMed] [Google Scholar]
- Batlle E, Sancho E, Francí C, Domínguez D, Monfar M, Baulida J, García De Herreros A, 2000. The transcription factor snail is a repressor of E-cadherin gene expression in epithelial tumour cells. Nat Cell Biol 2, 84–89. [DOI] [PubMed] [Google Scholar]
- Bernhart SH, Kretzmer H, Holdt LM, Jühling F, Ammerpohl O, Bergmann AK, Northoff BH, Doose G, Siebert R, Stadler PF, Hoffmann S, 2016. Changes of bivalent chromatin coincide with increased expression of developmental genes in cancer. Sci. Rep 6. [DOI] [PMC free article] [PubMed] [Google Scholar]
- Bernstein BE, Mikkelsen TS, Xie XH, Kamal M, Huebert DJ, Cuff J, 2006. A bivalent chromatin structure marks key developmental genes in embryonic stem cells. Cell 125. [DOI] [PubMed] [Google Scholar]
- Bhat J, Helmuth J, Chitadze G, Kouakanou L, Peters C, Vingron M, Ammerpohl O, Kabelitz D, 2017. Stochastics of Cellular Differentiation Explained by Epigenetics: The Case of T-Cell Differentiation and Functional Plasticity. Scandinavian Journal of Immunology 86, 184–195. [DOI] [PubMed] [Google Scholar]
- Biddle A, Liang X, Gammon L, Fazil B, Harper LJ, Emich H, Costea DE, Mackenzie IC, 2011. Cancer stem cells in squamous cell carcinoma switch between two distinct phenotypes that are preferentially migratory or proliferative. Cancer Res 71, 5317–5326. [DOI] [PubMed] [Google Scholar]
- Boyer B, Valles AM, Edme N, 2000. Induction and regulation of epithelial-mesenchymal transitions. Biochem Pharmacol 60, 1091–1099. [DOI] [PubMed] [Google Scholar]
- Casas E, Kim J, Bendesky A, Ohno-Machado L, Wolfe CJ, Yang J, 2011. Snail2 is an essential mediator of Twist1-induced epithelial mesenchymal transition and metastasis. Cancer Res 71, 245–254. [DOI] [PMC free article] [PubMed] [Google Scholar]
- Chaffer Christine L., Marjanovic Nemanja D., Lee T, Bell G, Kleer Celina G., Reinhardt F, D’Alessio Ana C., Young Richard A., Weinberg Robert A., 2013. Poised Chromatin at the ZEB1 Promoter Enables Breast Cancer Cell Plasticity and Enhances Tumorigenicity. Cell 154, 61–74. [DOI] [PMC free article] [PubMed] [Google Scholar]
- Chen H-F, Wu K-J, 2016. Epigenetics, TET proteins, and hypoxia in epithelial-mesenchymal transition and tumorigenesis. BioMedicine 6, 1–8. [DOI] [PMC free article] [PubMed] [Google Scholar]
- Chen QY, Li J, Sun H, Wu F, Zhu Y, Kluz T, Jordan A, DesMarais T, Zhang X, Murphy A, Costa M, 2018. Role of miR-31 and SATB2 in arsenic-induced malignant BEAS-2B cell transformation. Molecular Carcinogenesis 57, 968–977. [DOI] [PMC free article] [PubMed] [Google Scholar]
- Cheng T-F, Choudhuri S, Muldoon-Jacobs K, 2012. Epigenetic targets of some toxicologically relevant metals: a review of the literature. JAT 32, 643–653. [DOI] [PubMed] [Google Scholar]
- Chilakapati J, Wallace K, Ren H, Fricke M, Bailey K, Ward W, Creed J, Kitchin K, 2010. Genome-wide analysis of BEAS-2B cells exposed to trivalent arsenicals and dimethylthioarsinic acid. Toxicology 268, 31–39. [DOI] [PubMed] [Google Scholar]
- Cuddapah S, Jothi R, Schones DE, Roh TY, Cui K, Zhao K, 2009. Global analysis of the insulator binding protein CTCF in chromatin barrier regions reveals demarcation of active and repressive domains. Genome Res 19. [DOI] [PMC free article] [PubMed] [Google Scholar]
- Diepenbruck M, Christofori G, 2016. Epithelial-mesenchymal transition (EMT) and metastasis: yes, no, maybe? Curr Opin Cell Biol 43, 7–13. [DOI] [PubMed] [Google Scholar]
- Dongre A, Weinberg RA, 2019. New insights into the mechanisms of epithelial-mesenchymal transition and implications for cancer. Nat Rev Mol Cell Biol 20, 69–84. [DOI] [PubMed] [Google Scholar]
- Drake JM, Strohbehn G, Bair TB, Moreland JG, Henry MD, 2009. ZEB1 Enhances Transendothelial Migration and Represses the Epithelial Phenotype of Prostate Cancer Cells. Molecular Biology of the Cell 20, 2207–2217. [DOI] [PMC free article] [PubMed] [Google Scholar]
- Eckert MA, Lwin TM, Chang AT, Kim J, Danis E, Ohno-Machado L, Yang J, 2011. Twist1-induced invadopodia formation promotes tumor metastasis. Cancer Cell 19. [DOI] [PMC free article] [PubMed] [Google Scholar]
- Eckstein M, Rea M, Fondufe-Mittendorf YN, 2017. Transient and permanent changes in DNA methylation patterns in inorganic arsenic-mediated epithelial-to-mesenchymal transition. Toxicology and Applied Pharmacology. [DOI] [PMC free article] [PubMed] [Google Scholar]
- Engström KS, Hossain M, Lauss M, Ahmed S, Raqib R, Vahter M, Broberg K, 2013. Efficient Arsenic Metabolism — The AS3MT Haplotype Is Associated with DNA Methylation and Expression of Multiple Genes Around AS3MT. PLOS ONE 8. [DOI] [PMC free article] [PubMed] [Google Scholar]
- Giles JR, Manne S, Freilich E, Oldridge DA, Baxter AE, George S, Chen Z, Huang H, Chilukuri L, Carberry M, Giles L, Weng NP, Young RM, June CH, Schuchter LM, Amaravadi RK, Xu X, Karakousis GC, Mitchell TC, Huang AC, Shi J, Wherry EJ, 2022. Human epigenetic and transcriptional T cell differentiation atlas for identifying functional T cell-specific enhancers. Immunity 55, 557–574.e557. [DOI] [PMC free article] [PubMed] [Google Scholar]
- Goldrath AW, Sivakumar PV, Glaccum M, Kennedy MK, Bevan MJ, Benoist C, Mathis D, Butz EA, 2002. Cytokine requirements for acute and Basal homeostatic proliferation of naive and memory CD8+ T cells. J Exp Med 195, 1515–1522. [DOI] [PMC free article] [PubMed] [Google Scholar]
- Grosse-Wilde A, Fouquier d'Herouel A, McIntosh E, Ertaylan G, Skupin A, Kuestner RE, del Sol A, Walters KA, Huang S, 2015. Stemness of the hybrid Epithelial/Mesenchymal State in Breast Cancer and Its Association with Poor Survival. PLOS ONE 10, e0126522. [DOI] [PMC free article] [PubMed] [Google Scholar]
- Gunasinghe NPAD, Wells A, Thompson EW, Hugo HJ, 2012. Mesenchymal–epithelial transition (MET) as a mechanism for metastatic colonisation in breast cancer. Cancer and Metastasis Reviews 31, 469–478. [DOI] [PubMed] [Google Scholar]
- Hanahan D, Weinberg Robert A., 2011. Hallmarks of Cancer: The Next Generation. Cell 144, 646–674. [DOI] [PubMed] [Google Scholar]
- Hass R, von der Ohe J, Ungefroren H, 2020. The Intimate Relationship among EMT, MET and TME: A T(ransdifferentiation) E(nhancing) M(ix) to Be Exploited for Therapeutic Purposes. Cancers 12. [DOI] [PMC free article] [PubMed] [Google Scholar]
- Hauptmann M, Haghdoost S, Gomolka M, Sarioglu H, Ueffing M, Dietz A, Kulka U, Unger K, Babini G, Harms-Ringdahl M, Ottolenghi A, Hornhardt S, 2016. Differential Response and Priming Dose Effect on the Proteome of Human Fibroblast and Stem Cells Induced by Exposure to Low Doses of Ionizing Radiation. Radiat Res 185, 299–312. [DOI] [PubMed] [Google Scholar]
- Hay ED, 1995. An overview of epithelio-mesenchymal transformation. Acta Anat (Basel) 154, 8–20. [DOI] [PubMed] [Google Scholar]
- Hiraguri S, Godfrey T, Nakamura H, Graff J, Collins C, Shayesteh L, Doggett N, Johnson K, Wheelock M, Herman J, Baylin S, Pinkel D, Gray J, 1998. Mechanisms of inactivation of E-cadherin in breast cancer cell lines. Cancer Res 58. [PubMed] [Google Scholar]
- IARC, 2004. Some Drinking-water Disinfectants and Contaminants, including Arsenic. IARC MONOGRAPHS ON THE EVALUATION OF CARCINOGENIC RISKS TO HUMANS 84, 39–267. [PMC free article] [PubMed] [Google Scholar]
- IARC, 2012b. Cadmium and Cadmium Compounds. IARC MONOGRAPHS ON THE EVALUATION OF CARCINOGENIC RISKS TO HUMANS, 121–146. [Google Scholar]
- Jacquemet G, Hamidi H, Ivaska J, 2015. Filopodia in cell adhesion, 3D migration and cancer cell invasion. Current Opinion in Cell Biology 36, 23–31. [DOI] [PubMed] [Google Scholar]
- Jolly MK, Boareto M, Huang B, Jia D, Lu M, Ben-Jacob E, Onuchic JN, Levine H, 2015. Implications of the Hybrid Epithelial/Mesenchymal Phenotype in Metastasis. Front Oncol 5, 155. [DOI] [PMC free article] [PubMed] [Google Scholar]
- Jose CC, Xu B, Jagannathan L, Trac C, Mallela RK, Hattori T, Lai D, Koide S, Schones DE, Cuddapah S, 2014. Epigenetic dysregulation by nickel through repressive chromatin domain disruption. Proceedings of the National Academy of Sciences 111, 14631–14636. [DOI] [PMC free article] [PubMed] [Google Scholar]
- Kalluri R, Weinberg RA, 2009. The basics of epithelial-mesenchymal transition. J Clin Invest. 119. [DOI] [PMC free article] [PubMed] [Google Scholar]
- Klein CB, Leszczynska J, Hickey C, Rossman TG, 2007. Further evidence against a direct genotoxic mode of action for arsenic-induced cancer. Toxicology and applied pharmacology 222, 289–297. [DOI] [PMC free article] [PubMed] [Google Scholar]
- Kwok WK, Ling MT, Lee TW, Lau TC, Zhou C, Zhang X, Chua CW, Chan KW, Chan FL, Glackin C, Wong YC, Wang X, 2005. Up-regulation of TWIST in prostate cancer and its implication as a therapeutic target. Cancer Res 65, 5153–5162. [DOI] [PubMed] [Google Scholar]
- Lamouille S, Xu J, Derynck R, 2014. Molecular mechanisms of epithelial-mesenchymal transition. Nat Rev Mol Cell Biol 15, 178–196. [DOI] [PMC free article] [PubMed] [Google Scholar]
- Larue L, Bellacosa A, 2005. Epithelial-mesenchymal transition in development and cancer: role of phosphatidylinositol 3' kinase/AKT pathways. Oncogene 24, 7443–7454. [DOI] [PubMed] [Google Scholar]
- Li F, Wan M, Zhang B, Peng Y, Zhou Y, Pi C, Xu X, Ye L, Zhou X, Zheng L, 2018. Bivalent Histone Modifications and Development. Curr Stem Cell Res Ther 13, 83–90. [DOI] [PubMed] [Google Scholar]
- Lim J, Thiery JP, 2012. Epithelial-mesenchymal transitions: insights from development. Development 139, 3471–3486. [DOI] [PubMed] [Google Scholar]
- Liu GL, Yang HJ, Liu T, Lin YZ, 2014. Expression and significance of E-cadherin, N-cadherin, transforming growth factor-β1 and Twist in prostate cancer. Asian Pac J Trop Med 7, 76–82. [DOI] [PubMed] [Google Scholar]
- Liu YN, Abou-Kheir W, Yin JJ, Fang L, Hynes P, Casey O, Hu D, Wan Y, Seng V, Sheppard-Tillman H, Martin P, Kelly K, 2012. Critical and reciprocal regulation of KLF4 and SLUG in transforming growth factor β-initiated prostate cancer epithelial-mesenchymal transition. Mol Cell Biol 32, 941–953. [DOI] [PMC free article] [PubMed] [Google Scholar]
- Marconi GD, Fonticoli L, Rajan TS, Pierdomenico SD, Trubiani O, Pizzicannella J, Diomede F, 2021. Epithelial-Mesenchymal Transition (EMT): The Type-2 EMT in Wound Healing, Tissue Regeneration and Organ Fibrosis. Cells 10. [DOI] [PMC free article] [PubMed] [Google Scholar]
- Markovitz-Bishitz Y, Tauber Y, Afrimzon E, Zurgil N, Sobolev M, Shafran Y, Deutsch A, Howitz S, Deutsch M, 2010. A polymer microstructure array for the formation, culturing, and high throughput drug screening of breast cancer spheroids. Biomaterials 31, 8436–8444. [DOI] [PubMed] [Google Scholar]
- Nieto MA, 2013. Epithelial plasticity: a common theme in embryonic and cancer cells. Science 342, 1234850. [DOI] [PubMed] [Google Scholar]
- Nieto MA, Huang RY, Jackson RA, Thiery JP, 2016. EMT: 2016. Cell 166, 21–45. [DOI] [PubMed] [Google Scholar]
- Ocaña Oscar H., Córcoles R, Fabra Á, Moreno-Bueno G, Acloque H, Vega S, Barrallo-Gimeno A, Cano A, Nieto MA, 2012. Metastatic Colonization Requires the Repression of the Epithelial-Mesenchymal Transition Inducer Prrx1. Cancer Cell 22, 709–724. [DOI] [PubMed] [Google Scholar]
- Palen K, Weber J, Dwinell MB, Johnson BD, Ramchandran R, Gershan JA, 2016. E-cadherin re-expression shows in vivo evidence for mesenchymal to epithelial transition in clonal metastatic breast tumor cells. Oncotarget 7. [DOI] [PMC free article] [PubMed] [Google Scholar]
- Peixoto P, Etcheverry A, Aubry M, Missey A, Lachat C, Perrard J, Hendrick E, Delage-Mourroux R, Mosser J, Borg C, Feugeas J-P, Herfs M, Boyer-Guittaut M, Hervouet E, 2019. EMT is associated with an epigenetic signature of ECM remodeling genes. Cell Death & Disease 10, 205. [DOI] [PMC free article] [PubMed] [Google Scholar]
- Person RJ, Ngalame NN, Makia NL, Bell MW, Waalkes MP, Tokar EJ, 2015. Chronic inorganic arsenic exposure in vitro induces a cancer cell phenotype in human peripheral lung epithelial cells. Toxicology and applied pharmacology 286, 36–43. [DOI] [PMC free article] [PubMed] [Google Scholar]
- Polyak K, Weinberg RA, 2009. Transitions between epithelial and mesenchymal states: acquisition of malignant and stem cell traits. Nat Rev Cancer 9, 265–273. [DOI] [PubMed] [Google Scholar]
- Radisky DC, 2005. Epithelial-mesenchymal transition. J Cell Sci 118, 4325–4326. [DOI] [PubMed] [Google Scholar]
- Rea M, Eckstein M, Eleazer R, Smith C, Fondufe-Mittendorf YN, 2017. Genome-wide DNA methylation reprogramming in response to inorganic arsenic links inhibition of CTCF binding, DNMT expression and cellular transformation. Sci Rep 7, 41474. [DOI] [PMC free article] [PubMed] [Google Scholar]
- Rea M, Gripshover T, Fondufe-Mittendorf Y, 2018. Selective inhibition of CTCF binding by iAs directs TET-mediated reprogramming of 5-hydroxymethylation patterns in iAs-transformed cells. Toxicology and Applied Pharmacology 338, 124–133. [DOI] [PMC free article] [PubMed] [Google Scholar]
- Rea M, Jiang T, Eleazer R, Eckstein M, Marshall AG, Fondufe-Mittendorf YN, 2016. Quantitative Mass Spectrometry Reveals Changes in Histone H2B Variants as Cells Undergo Inorganic Arsenic-Mediated Cellular Transformation. Molecular & Cellular Proteomics 15, 2411–2422. [DOI] [PMC free article] [PubMed] [Google Scholar]
- Riedmann C, Ma Y, Melikishvili M, Godfrey S, Zhang Z, Chen K, Rouchka EC, Fondufe-Mittendorf YN, 2015. Inorganic Arsenic-induced cellular transformation is coupled with genome wide changes in chromatin structure, transcriptome and splicing patterns. BMC Genomics 16, 212. [DOI] [PMC free article] [PubMed] [Google Scholar]
- Salnikow K, Zhitkovich A, 2008. Genetic and Epigenetic Mechanisms in Metal Carcinogenesis and Cocarcinogenesis: Nickel, Arsenic, and Chromium. Chemical Research in Toxicology 21, 28–44. [DOI] [PMC free article] [PubMed] [Google Scholar]
- Shagieva GS, Domnina LV, Chipysheva TA, Ermilova VD, Chaponnier C, Dugina VB, 2012. Actin isoforms and reorganization of adhesion junctions in epithelial-to-mesenchymal transition of cervical carcinoma cells. Biochemistry (Moscow) 77, 1266–1276. [DOI] [PubMed] [Google Scholar]
- Sun L, Fang J, 2016. Epigenetic Regulation of Epithelia-Mesenchymal Transition. Cellular and molecular life sciences : CMLS 73, 4493–4515. [DOI] [PMC free article] [PubMed] [Google Scholar]
- Tam W, Weinberg RA, 2013. The epigenetics of epithelial-mesenchymal plasticity in cancer. Nature Medicine 19, 1438–1449. [DOI] [PMC free article] [PubMed] [Google Scholar]
- Tang FR, Loke WK, Khoo BC, 2017. Low-dose or low-dose-rate ionizing radiation-induced bioeffects in animal models. J Radiat Res 58, 165–182. [DOI] [PMC free article] [PubMed] [Google Scholar]
- Thiery JP, Acloque H, Huang RY, Nieto MA, 2009. Epithelial-mesenchymal transitions in development and disease. Cell 139. [DOI] [PubMed] [Google Scholar]
- Thiery JP, Sleeman JP, 2006. Complex networks orchestrate epithelial-mesenchymal transitions. Nat Rev Mol Cell Biol 7, 131–142. [DOI] [PubMed] [Google Scholar]
- Tokar EJ, Diwan BA, Waalkes MP, 2010. Arsenic Exposure Transforms Human Epithelial Stem/Progenitor Cells into a Cancer Stem-like Phenotype. Environmental Health Perspectives 118, 108–115. [DOI] [PMC free article] [PubMed] [Google Scholar]
- Tripathi S, Chakraborty P, Levine H, Jolly MK, 2020. A mechanism for epithelial-mesenchymal heterogeneity in a population of cancer cells. PLOS Computational Biology 16, e1007619. [DOI] [PMC free article] [PubMed] [Google Scholar]
- Usman S, Waseem NH, Nguyen TKN, Mohsin S, Jamal A, Teh MT, Waseem A, 2021. Vimentin Is at the Heart of Epithelial Mesenchymal Transition (EMT) Mediated Metastasis. Cancers (Basel) 13. [DOI] [PMC free article] [PubMed] [Google Scholar]
- Wang Z, Zhao Y, Smith E, Goodall GJ, Drew PA, Brabletz T, Yang C, 2011. Reversal and Prevention of Arsenic-Induced Human Bronchial Epithelial Cell Malignant Transformation by microRNA-200b. Toxicological Sciences 121, 110–122. [DOI] [PMC free article] [PubMed] [Google Scholar]
- Wels C, Joshi S, Koefinger P, Bergler H, Schaider H, 2011. Transcriptional activation of ZEB1 by Slug leads to cooperative regulation of the epithelial-mesenchymal transition-like phenotype in melanoma. J Invest Dermatol 131, 1877–1885. [DOI] [PMC free article] [PubMed] [Google Scholar]
- Xiong X, Li X, Wen YA, Gao T, 2016. Pleckstrin Homology (PH) Domain Leucine-rich Repeat Protein Phosphatase Controls Cell Polarity by Negatively Regulating the Activity of Atypical Protein Kinase C. J Biol Chem 291, 25167–25178. [DOI] [PMC free article] [PubMed] [Google Scholar]
- Yang J, Antin P, Berx G, Blanpain C, Brabletz T, Bronner M, Campbell K, Cano A, Casanova J, Christofori G, Dedhar S, Derynck R, Ford HL, Fuxe J, García de Herreros A, Goodall GJ, Hadjantonakis A-K, Huang RYJ, Kalcheim C, Kalluri R, Kang Y, Khew-Goodall Y, Levine H, Liu J, Longmore GD, Mani SA, Massagué J, Mayor R, McClay D, Mostov KE, Newgreen DF, Nieto MA, Puisieux A, Runyan R, Savagner P, Stanger B, Stemmler MP, Takahashi Y, Takeichi M, Theveneau E, Thiery JP, Thompson EW, Weinberg RA, Williams ED, Xing J, Zhou BP, Sheng G, On behalf of the, E.M.T.I.A., 2020. Guidelines and definitions for research on epithelial–mesenchymal transition. Nature Reviews Molecular Cell Biology 21, 341–352. [DOI] [PMC free article] [PubMed] [Google Scholar]
- Yang J, Mani SA, Donaher JL, Ramaswamy S, Itzykson RA, Come C, Savagner P, Gitelman I, Richardson A, Weinberg RA, 2004. Twist, a master regulator of morphogenesis, plays an essential role in tumor metastasis. Cell 117. [DOI] [PubMed] [Google Scholar]
- Yu M, Bardia A, Wittner BS, Stott SL, Smas ME, Ting DT, Isakoff SJ, Ciciliano JC, Wells MN, Shah AM, Concannon KF, Donaldson MC, Sequist LV, Brachtel E, Sgroi D, Baselga J, Ramaswamy S, Toner M, Haber DA, Maheswaran S, 2013. Circulating breast tumor cells exhibit dynamic changes in epithelial and mesenchymal composition. Science 339, 580–584. [DOI] [PMC free article] [PubMed] [Google Scholar]
- Zeisberg M, Neilson EG, 2009. Biomarkers for epithelial-mesenchymal transitions. The Journal of clinical investigation 119, 1429–1437. [DOI] [PMC free article] [PubMed] [Google Scholar]
- Zhao CQ, Young MR, Diwan BA, Coogan TP, Waalkes MP, 1997. Association of arsenic-induced malignant transformation with DNA hypomethylation and aberrant gene expression. Proceedings of the National Academy of Sciences of the United States of America 94, 10907–10912. [DOI] [PMC free article] [PubMed] [Google Scholar]
Associated Data
This section collects any data citations, data availability statements, or supplementary materials included in this article.