Abstract
Background.
In recent years, few US adults have had exposure and resultant immunity to hepatitis A virus (HAV). Further, persons with liver disease have an increased risk of adverse consequences if they are infected with HAV.
Methods.
This study used 1999–2011 National Notifiable Diseases Surveillance System and Multiple Cause of Death data to assess trends in the incidence of HAV infection, HAV-related hospitalization, and HAV-related mortality.
Results.
During 1999–2011, the incidence of HAV infection declined from 6.0 cases/100 000 to 0.4 cases/100 000. Similar declines were seen by sex and age, but persons aged ≥80 years had the highest incidence of HAV infection in 2011 (0.8 cases/100 000). HAV-related hospitalizations increased from 7.3% in 1999 to 24.5% in 2011. The mean age of hospitalized cases increased from 36.0 years in 1999 to 45.1 years in 2011. While HAV-related mortality declined, the mean age at death among decedents with HAV infection increased from 48.0 years in 1999 to 76.2 years in 2011. The median age range of decedents who had HAV infection and a liver-related condition was 51.0 to 68.0 years.
Conclusions.
Although vaccine-preventable, HAV-related hospitalizations increased greatly, mostly among adults, and liver-related conditions were frequently reported among HAV-infected individuals who died. Public health efforts should focus on the need to assess protection from hepatitis A among adults, including those with liver disease.
Keywords: hepatitis A virus, hepatitis A hospitalizations, hepatitis A mortality, hepatitis A complications, hepatitis A trends
Although the incidence of hepatitis A virus (HAV) infection has declined to an all-time low in recent years [1], large multifocal hepatitis A outbreaks still occur in the United States [2–5]. HAV is transmitted by the fecal-oral route either by direct contact with an infected person or contaminated fomites or through consumption of contaminated food or water [6]. Transmission can occur easily because HAV is a hardy virus and can remain infectious in the environment for several days [7]. In 1995, a safe and effective hepatitis A vaccine became available. Shortly thereafter, an incremental approach to vaccination was initiated, with coverage of children aged 2–18 years living in areas with the highest disease prevalence and the following groups at increased risk of infection or severe disease: travelers to hepatitis A–endemic areas, men who have sex with men, users of injection and noninjection drugs, persons who work with HAV in a research laboratory setting, persons with clotting factor disorders, and persons with chronic liver disease [8]. In 1999, the recommendations were further expanded to include children living in 17 states with mean incidence rates of HAV infection consistently higher than the 1987–1997 national mean [9]. In 2006, all children aged 12–23 months were covered under this vaccination strategy [10]. Despite these efforts, large multifocal outbreaks have occurred because of consumption of contaminated food imported from countries where hepatitis A is a common source of exposure [11]. The result of importing contaminated food is that susceptible persons—mainly adults who have no other risk factors—are infected. Further, recent findings from the National Health and Nutrition Examination Survey documented that the seroprevalence of HAV antibodies among adults, especially those aged 50–59 years, declined from 1988–1994 to 1999–2006 [12].
National surveillance data are instrumental in monitoring the incidence and outcomes of HAV infection. Because the epidemiology of HAV infection has changed over time, primarily as a result of the widely implemented childhood vaccination programs, the shift in the susceptible population to consist of mostly older adults, and recent hepatitis A outbreaks, we sought to describe these changes by (1) examining US trends in the incidence of hepatitis A, hepatitis A–related hospitalization, and hepatitis A–related mortality from 1999 to 2011 and (2) comparing the most frequently reported causes of death in 2011 among decedents who had a hepatitis A–related cause of death with those reported for decedents without a hepatitis A–related cause of death.
METHODS
Data Sources
Data analyzed in this study were from the (1) National Notifiable Diseases Surveillance System (NNDSS), which is the national passive surveillance system through which health departments notify the Centers for Disease Control and Prevention of nationally notifiable diseases and conditions, including hepatitis A [13], and (2) US Multiple Cause of Death (MCOD) database, which includes demographic information and cause of death information on all registered deaths that occurred in the United States [14]. The study period was 1999 to 2011 for both data sets. This study was exempt from human subjects review, and informed consent was not obtained because all data were obtained from secondary sources without patient-level information.
NNDSS Case Definitions
Health departments at various levels of the US public health system ascertain hepatitis A case reports and submit deidentified information to the NNDSS. To meet the case definition for hepatitis A, a patient must have had an acute illness with discrete onset of symptoms and jaundice and/or elevated serum aminotransferase levels with a positive result for HAV immunoglobulin M antibody or must have been a household or sexual contact of a laboratory-confirmed case during the 15–50 days before the onset of symptoms [15]. Hepatitis A–related hospitalizations and mortality data were obtained from case reports.
MCOD Case Definition
The case definition for a hepatitis A–related death was adapted from the viral hepatitis mortality case definitions used in a recent publication by Ly et al [16] and was defined as having (1) the hepatitis A International Classification of Diseases, Tenth Revision (ICD-10) [17] code of B15 listed as any cause of death in the record axis or (2) human immunodeficiency virus infection (ICD-10 codes B20–B24) as the underlying cause of death and hepatitis A as any other cause in either the record or entity axis. Deaths meeting any of these criteria were counted as a hepatitis A–related deaths.
Statistical Analysis
Case Incidence Rates
To calculate hepatitis A incidence rates, the number of hepatitis A case reports during 1999–2011 NNDSS was divided by the US Census population for each year. Incidence rates, stratified by the overall total population and by sex, were adjusted to the age distribution of the 2000 US standard population by using the direct method [18].
Hospitalizations and Deaths
The proportion of hospitalized and fatal HAV infection cases from the NNDSS was calculated, and the denominator included all hepatitis A cases reported during 1999–2011. To check for data-quality issues, hospitalization and mortality counts were examined by state. Where data did not match, we used the data confirmed by the state. The proportion of hospitalizations and deaths among hepatitis A cases and their respective mean ages were calculated by year.
Mortality Incidence Rates
To calculate hepatitis A–related mortality incidence rates, the number of deaths meeting the case definition for a hepatitis A–related death was divided by the US Census population for each year. Mortality rates were adjusted to the age distribution of the 2000 US standard population, using the direct method [18].
Trend Testing and Slope Calculations
To quantify the changes over time, linear regression was used to calculate the slope of each trend line, and the Cochran–Armitage trend test was used to evaluate the statistical significance of each trend. A P value of <.05 was considered statistically significant [19].
Comortalities
Comortalities of deaths with and those without hepatitis A in 2011 MCOD data were calculated by grouping ICD-10 codes using the scheme of the Clinical Classifications Software for ICD-10. The most frequently listed categories in the record axis were then isolated from deaths with and those without hepatitis A, as described by Ly et al [16].
RESULTS
National Trends in Hepatitis A Incidence
From 1999 through 2011, the United States observed a continuous decline in the overall hepatitis A incidence, from 6.0 cases/100 000 population in 1999 (n = 16 915 reported cases) to 0.4 cases/100 000 population in 2011 (n = 1376 reported cases; P < .0001, by the Cochran–Armitage trend test; Figure 1). The 2011 hepatitis A incidence rate was the lowest ever recorded for the United States.
Figure 1.
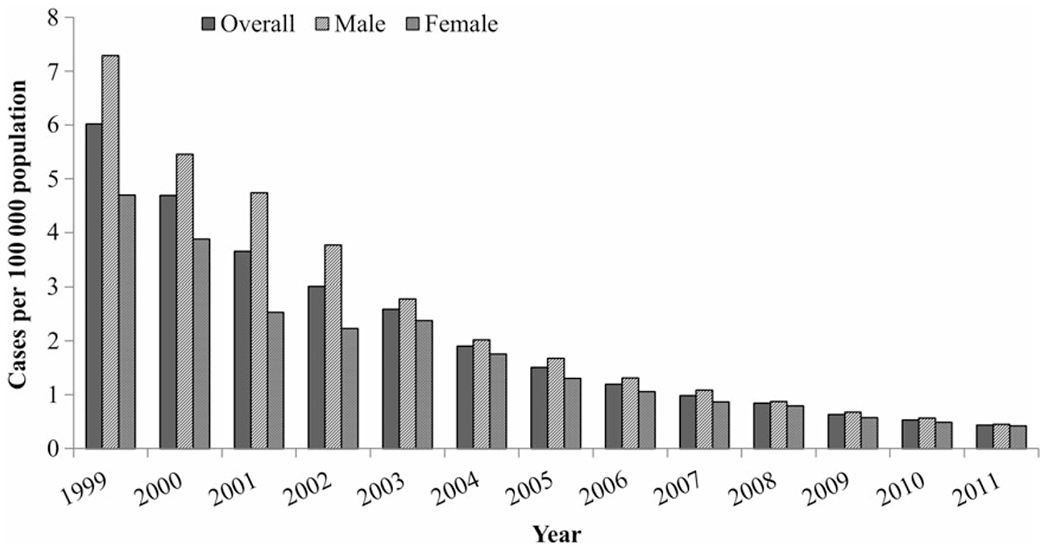
Hepatitis A incidence, by sex and year—United States, 1999–2011. Data are from the National Notifiable Diseases Surveillance System [13] and the US Census Bureau [20].
There were also sex-specific declines in the hepatitis A incidence, with decreases of 0.52 cases per 100 000 population per year among males and 0.32 cases per 100 000 population per year among females (P < .0001, by the Cochran–Armitage trend test; Figure 1). From 1999 to 2007, there was a distinctively higher incidence among males, compared with females, but the rates in the 2 groups converged over time. In 2011, the incidence rates were 0.45 reported cases per 100 000 population for males and 0.42 reported cases per 100 000 population for females.
During the study period, the hepatitis A incidence declined among all age groups (Figure 2). The most dramatic age-specific declines were among cases aged 0–19 years and those aged 20–39 years; rates decreased from 7.10 cases/100 000 population and 8.39 cases/100 000 population, respectively, in 1999 to 0.29 cases/100 000 population and 0.58 cases/100 000 population, respectively, in 2011. In 1999, the hepatitis A incidence was highest among persons aged 0–39 years and lowest among persons aged ≥60 years. However, by 2011, the incidence was lowest among persons aged 0–19 years and highest among persons aged ≥80 years.
Figure 2.
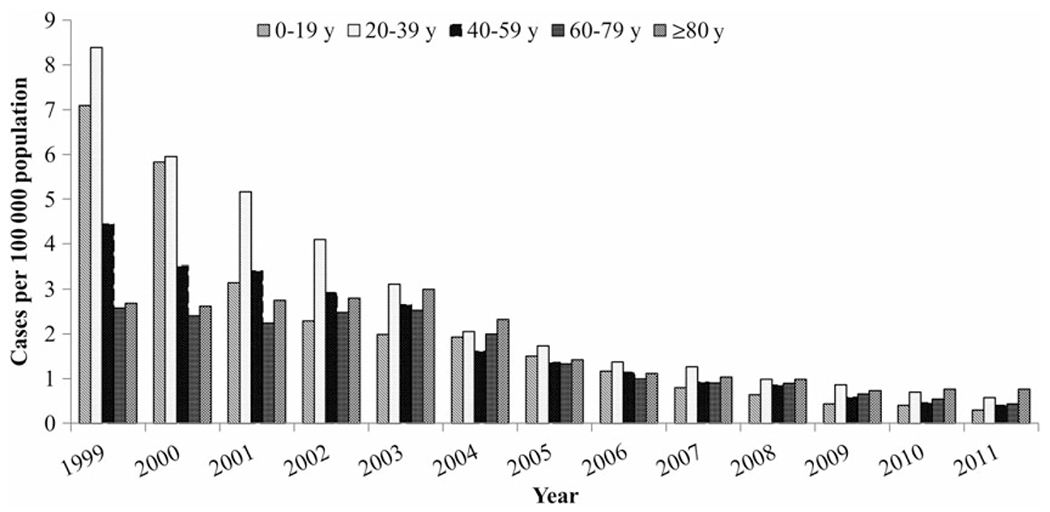
Hepatitis A incidence, by age group and year—United States, 1999–2011. Data are from the National Notifiable Diseases Surveillance System [13] and the US Census Bureau [20].
National Trends in Hepatitis A–Related Hospitalizations
Among reported cases of hepatitis A, there was an observed linear upward trend in hepatitis A–related hospitalizations, with a 1.63% increase per year ranging from 7.3% in 1999 to 24.5% in 2011 (P < .0001, by the Cochran–Armitage trend test; Figure 3). The mean age of hospitalized cases increased from 36.0 years in 1999 to 45.1 years in 2011, for an annual average increase of 0.8 years (P = .02, by the Cochran–Armitage trend test; Figure 4).
Figure 3.
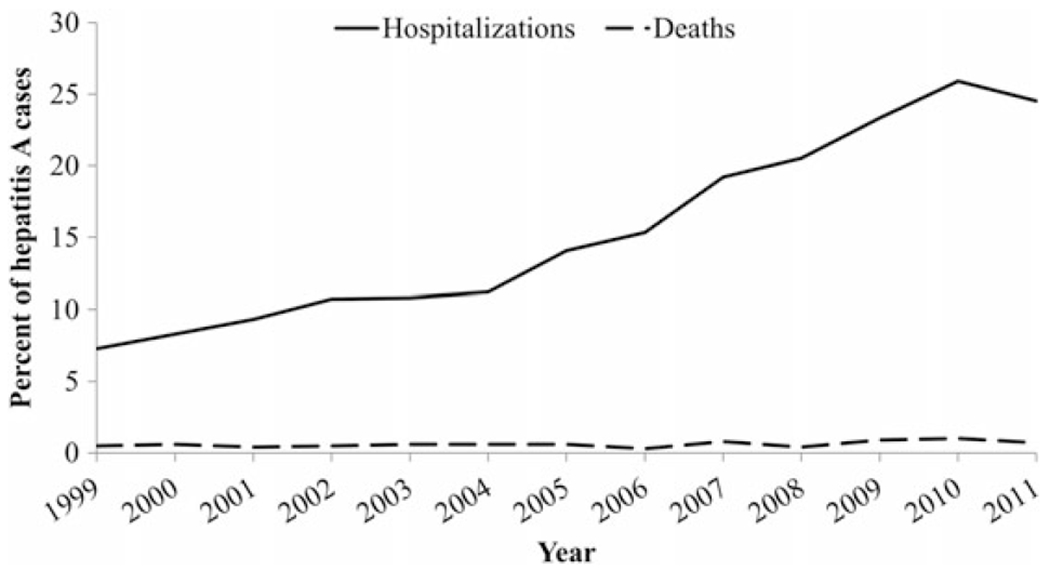
Hepatitis A–related hospitalizations and hepatitis A—related deaths, by year—United States, 1999–2011. Data are from the National Notifiable Diseases Surveillance System [13].
Figure 4.
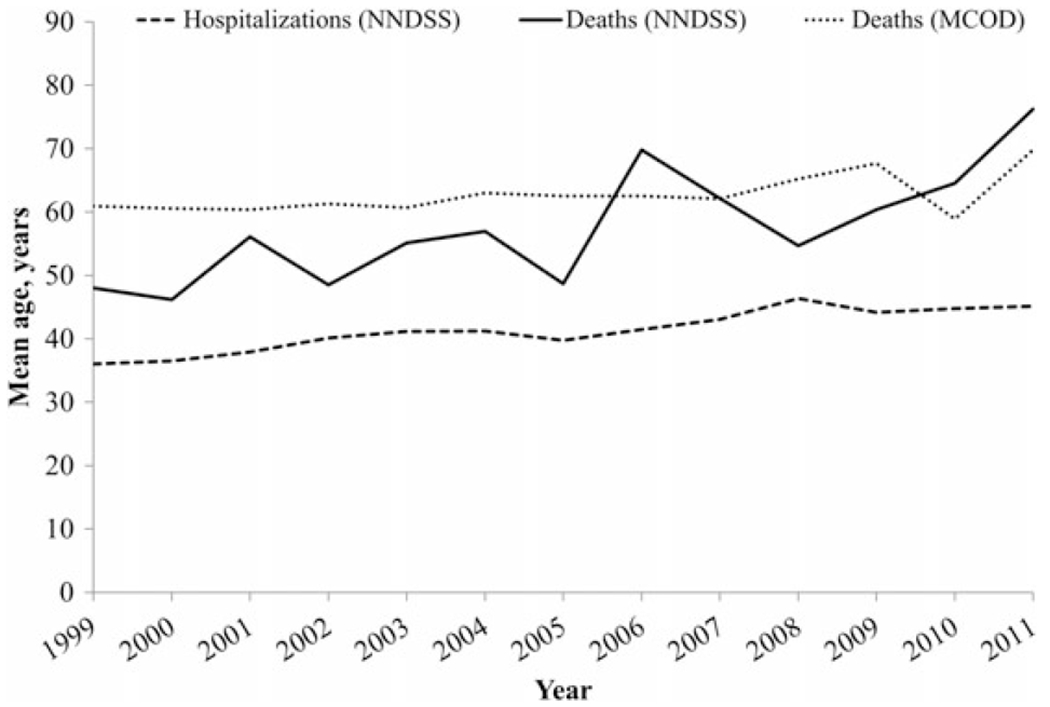
Mean age of individuals with hepatitis A–related hospitalizations and hepatitis A–related deaths, by year—United States, 1999–2011. Data are from the National Notifiable Diseases Surveillance System (NNDSS) [13] and the National Vital Statistics System [14].
National Trends in Hepatitis A–Related Deaths
Based on NNDSS data, the proportion of hepatitis A deaths among cases of hepatitis A remained low (<1.0%) and relatively stable (range, 0.3%–1.0%) throughout the study period (Figure 3). The average annual increase in the mean age of deaths was 1.8 years, ranging from 48.0 years in 1999 to 76.2 years in 2011 (P < .0001, by the Cochran–Armitage trend test; Figure 4). Based on US MCOD data, a decreasing trend was observed in the age-adjusted hepatitis A–related mortality rates (Figure 5). On average, a mortality rate decrease of 0.01 deaths per 100 000 population per year was observed, ranging from 0.1 deaths per 100 000 population (n = 270 deaths) in 1999 to 0.02 deaths per 100 000 population (n = 71 deaths) in 2011 (P = .0003, by the Cochran–Armitage trend test). The mean age at death increased from 61.0 years in 1999 to 67.7 years in 2009; however, in 2010, the mean age decreased to 58.9 years and, in 2011, increased again to 69.8 years (Figure 4).
Figure 5.
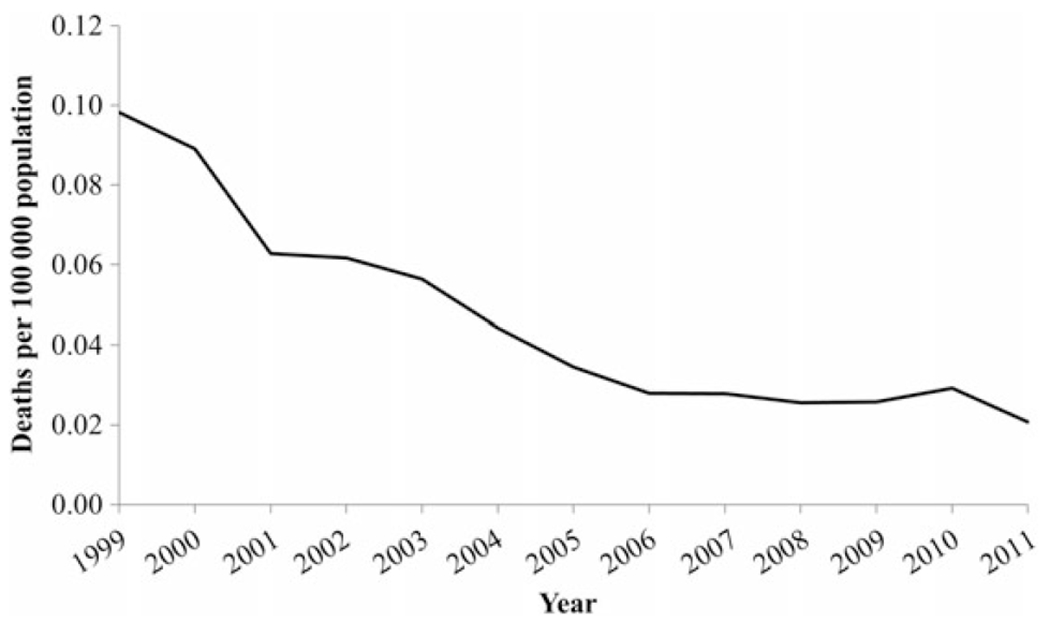
Hepatitis A–related mortality incidence, by year—United States, 1999–2011. Data are from the National Vital Statistics System [14] and the US Census Bureau [20].
2011 US Mortality
In 2011, death certificates of decedents with hepatitis A listed liver-related conditions among frequently cited causes of death. For example, “hepatitis (excluding hepatitis A)” was the most commonly cited category (39.4%), followed by “fibrosis, cirrhosis, and other liver diseases” (28.2%; Table 1). The category “liver disease, alcohol-related” was listed for 8.5% of decedents with hepatitis A. The median age of decedents associated with these categories was 58.0 years for “hepatitis (excluding hepatitis A)”; 68.0 years for “fibrosis, cirrhosis, and other liver diseases”; and 51.0 years for “liver disease, alcohol-related.” Hepatitis B was listed for 22 hepatitis A–related deaths (31.0%). Hepatitis C was listed for 17 hepatitis A–related deaths (23.9%).
Table 1.
Frequent Causes of Death Among Deaths With and Deaths Without Hepatitis A—United States, 2011
| Hepatitis A Status, Rank | CCS Category | Deaths, No. (%)a | Age at Death, y, Median |
|---|---|---|---|
| With hepatitis A | |||
| 1 | CCS 6: Hepatitis (excluding hepatitis A) | 28 (39.4) | 58.0 |
| 2 | CCS 151: Fibrosis, cirrhosis, and other liver diseases | 20 (28.2) | 68.0 |
| 3 | CCS 98: Essential hypertension | 14 (19.7) | 81.0 |
| 4 | CCS 2: Septicemia (except in labor) | 12 (16.9) | 68.5 |
| 5 | CCS 107: Cardiac arrest and ventricular fibrillation | 10 (14.1) | 80.5 |
| 6 | CCS 157: Acute and unspecified renal failure | 9 (12.7) | 86.0 |
| 7 | CCS 108: Congestive heart failure, nonhypertensive | 8 (11.3) | 86.0 |
| 8 | CCS 49: Diabetes mellitus without complication | 8 (11.3) | 76.0 |
| 9 | CCS 259: Residual codes, unclassified | 8 (11.3) | 71.5 |
| 10 | CCS 150: Liver disease, alcohol-related | 6 (8.5) | 51.0 |
| 11 | CCS 101: Coronary atherosclerosis and other heart disease | 6 (8.5) | 71.0 |
| 12 | CCS 68: Senility and organic mental disorders | 6 (8.5) | 90.5 |
| 13 | CCS 127: Chronic obstructive pulmonary disease and bronchiectasis | 6 (8.5) | 62.0 |
| 14 | CCS 158: Chronic renal failure | 5 (7.0) | 76.0 |
| 15 | CCS 260: E Codes: all (external causes of injury and poisoning) | 5 (7.0) | 63.0 |
| 16 | CCS 58: Other nutritional, endocrine, and metabolic disorders | 5 (7.0) | 73.0 |
| Without hepatitis A | |||
| 1 | CCS 101: Coronary atherosclerosis and other heart disease | 370 419 (14.7) | 82.0 |
| 2 | CCS 68: Senility and organic mental disorders | 352 540 (14.0) | 87.0 |
| 3 | CCS 107: Cardiac arrest and ventricular fibrillation | 339 222 (13.5) | 79.0 |
| 4 | CCS 98: Essential hypertension | 321 964 (12.8) | 82.0 |
| 5 | CCS 131: Respiratory failure, insufficiency, arrest (adult) | 286 093 (11.4) | 78.0 |
| 6 | CCS 108: Congestive heart failure, nonhypertensive | 284 556 (11.3) | 85.0 |
| 7 | CCS 127: Chronic obstructive pulmonary disease and bronchiectasis | 271 825 (10.8) | 78.0 |
| 8 | CCS 67: Substance-related mental disorders | 270 341 (10.7) | 71.0 |
| 9 | CCS 49: Diabetes mellitus without complication | 221 694 (8.8) | 76.0 |
| 10 | CCS 109: Acute cerebrovascular disease | 176 171 (7.0) | 82.0 |
| 11 | CCS 106: Cardiac dysrhythmias | 170 975 (6.8) | 84.0 |
| 12 | CCS 19: Cancer of bronchus, lung | 166 054 (6.6) | 72.0 |
| 13 | CCS 2: Septicemia (except in labor) | 165 201 (6.6) | 76.0 |
| 14 | CCS 122: Pneumonia | 164 218 (6.5) | 82.0 |
| 15 | CCS 100: Acute myocardial infarction | 157 340 (6.2) | 77.0 |
| 16 | CCS 260: E Codes: all (external causes of injury and poisoning) | 154 219 (6.1) | 57.0 |
Data are from the National Vital Statistics System Multiple Cause of Death [14].
Abbreviation: CCS, Clinical Classifications Software.
Cumulative percentages of each table will not equal 100% because a death with multiple causes can be placed in >1 category and only the most frequent categories are listed. The denominator equals 71 for deaths with hepatitis A and 2 519 771 for deaths without hepatitis A.
The most frequently reported categories of non–liver-related conditions among decedents who had hepatitis A were “essential hypertension”; “septicemia (except in labor)”; “cardiac arrest and ventricular fibrillation”; “acute and unspecified renal failure”; “congestive heart failure, nonhypertensive”; “diabetes mellitus without complication”; “residual codes, unclassified”; “coronary atherosclerosis and other heart disease”; “senility and organic mental disorders”; “chronic obstructive pulmonary disease and bronchiectasis”; “chronic renal failure”; “E codes: all (external causes of injury and poisoning”; and “other nutritional, endocrine, and metabolic disorders” (7.0%−14.7%; Table 1). The median age of decedents with these conditions ranged from 62.0 years (for “chronic obstructive pulmonary disease and bronchiectasis”) to 90.5 years (for “senility and organic mental disorders”). Decedents who did not have hepatitis A died most frequently of causes that were representative of the most common causes of death in the general US population.
DISCUSSION
This study describes an increasing trend in the proportion of hepatitis A cases who were hospitalized in the United States. The increasing proportion of hospitalizations is likely explained by the convergence of the following 2 factors: (1) the susceptible population is now more likely to consist of older adults [12], and (2) HAV infection among older adults results in more-severe disease [6, 10]. Exposure to the virus is not limited to groups previously identified to be at high risk, such as travelers [22], because food importations to the United States have increased over time [23] and can be the source of HAV [2, 4].
We found that decedents with hepatitis A frequently had liver-related conditions mentioned on their death certificate and that they died at relatively young ages. Although hepatitis A does not cause chronic infection, HAV infection in older persons results in more-severe adverse consequences, including death [21]. These data support the fact that HAV infection can worsen the severity of disease and lead to early mortality [24]. Therefore, since 1996 [8], it has been recommended that persons with chronic liver disease receive hepatitis A vaccination. Because of the severity of preexisting liver disease, it is also recommended that persons infected with hepatitis B virus and/or hepatitis C virus (HCV) receive hepatitis A vaccination [25]. Despite these recommendations, 2011 MCOD mortality data showed that 39.4% and 28.2% of decedents with hepatitis A also had disease mortality categories “other hepatitis infections” and “cirrhosis, fibrosis, and other liver diseases,” respectively, specified, indicating that hepatitis A vaccination was probably not received. Additionally, in 2011, a national survey indicated that only 17% of persons with chronic liver disease were vaccinated [26], and data from a health insurance company indicated that only 22% of HCV-infected patients were vaccinated [27]. These findings suggest a need for better implementation of the vaccine policy for this population through provider education and identification and mitigation of other barriers to vaccination.
Hepatitis A outbreaks continue to be documented in Europe [28, 29] and in the United States [2–5]. During the most recent multifocal hepatitis A outbreak in the United States, nearly one half of the cases identified were hospitalized, and most of the cases were adults [2]. Supporting the findings of previous studies, this study found an increase in the mean age of reported hepatitis A cases who were hospitalized or died. Additionally, during the study period there was a shift in the age groups with the highest hepatitis A incidence, with the youngest age groups having the highest incidence in 1999 and the oldest age groups having the highest incidence in 2011. These shifting trends are likely explained by effective vaccine implementation and protection among children and less opportunity for adults to be exposed to HAV.
When large outbreaks of hepatitis A occur, disease control costs are higher than direct medical costs [30]. Administering the 2-dose hepatitis A vaccination series to susceptible adults may be moderately expensive relative to the costs of administering other vaccines [31]. However, because of the hepatitis A vaccine’s high immunogenic properties [10, 32], a 1-dose vaccine may be sufficient to protect susceptible persons who become exposed to hepatitis A. This strategy has been implemented in other countries. Because large multifocal outbreaks have occurred and affected mainly adults who have no other hepatitis A risk factors, cost-effectiveness studies are needed to evaluate the full effect of administering a 1-dose hepatitis A vaccine to adults in the United States.
Since 2006, the Advisory Committee on Immunization Practices has recommended hepatitis A vaccination for all children starting at 1 year of age and for persons at increased risk of infection or severe disease [10]. Adults not at increased risk were not included in the recommendation because of the lower infection rate in the general US population at the time the recommendations were published [10]. In addition, because children and persons at increased risk would be protected through vaccination under these recommendations, it was thought that other adults would likely be protected though herd immunity [10].
In 2011, the hepatitis A incidence among males and females was similar; however, existing studies show that hepatitis A–related mortality is noticeably higher among males than females [1, 16]. Alcohol consumption, which is known to worsen the severity of HAV infection and is historically higher among males than females, may contribute to the disparity in deaths. To examine this assumption, we found that 77% of deaths with hepatitis A were among males (data not shown), and alcohol-related liver disease was the tenth most frequently reported condition among decedents with hepatitis A.
Although this study is population based, there are limitations to consider when interpreting these data. First, this study included passive surveillance data reported through the NNDSS, which receives case reports only on symptomatic cases of serologically confirmed HAV infection [1]; therefore, these analyses did not capture HAV-infected persons who were asymptomatic or did not receive a diagnosis. However, any bias in reporting may be relatively constant over time. Further, because reporting of viral hepatitis to the Centers for Disease Control and Prevention is voluntary, extended data such as hospitalization information may be incomplete. Therefore, compared with the 42% of cases hospitalized in the recent multistate outbreak [2], the 24.5% hospitalized for hepatitis A found in this study may be a conservative estimate. In addition, while multiple-cause mortality data capture virtually all US-registered death certificates, there are a number of previously described limitations [16, 33], which ultimately resulted in capturing only a portion of the total US hepatitis A–related mortality burden. Despite the known reasons for underreporting hepatitis A in the NNDSS and MCOD, HAV infection, a vaccine-preventable illness, was still an important cause of hospitalization and mortality in the United States in this study.
In summary, this study described an increasing trend in the proportion of reported hepatitis A cases who were hospitalized and in the mean age of hepatitis A cases who were hospitalized or died. Additionally, compared with decedents without HAV infection, decedents with HAV infection who died with a liver-related cause of death also died relatively young. These data suggest the need to (1) reinforce the current hepatitis A vaccine recommendation that includes persons with chronic liver disease and (2) consider expanding the hepatitis A vaccine coverage to all unvaccinated adults, who seem to make up the majority of the susceptible US population. Because of changes in hepatitis A epidemiology, adults are now at higher risk of HAV infection in the United States. As a result, public health efforts should focus on ensuring education of providers about this shift in the United States and the need to assess hepatitis A immunity among adults. Future studies might explore a 1-dose hepatitis A vaccine strategy as opposed to the standard 2-dose series as a way to reduce vaccination costs, increase vaccine coverage, and, possibly, prevent future outbreaks.
Acknowledgments.
We thank the staff of state and local health departments, laboratories, and healthcare providers who make surveillance for hepatitis A possible.
Disclaimer.
The findings and conclusions in this report are those of the authors and do not necessarily represent the views of the Centers for Disease Control and Prevention (CDC).
Financial support.
This work was supported by the CDC.
Footnotes
Potential conflict of interest. Both authors: No reported conflicts.
Both authors have submitted the ICMJE Form for Disclosure of Potential Conflicts of Interest. Conflicts that the editors consider relevant to the content of the manuscript have been disclosed.
References
- 1.Centers for Disease Control and Prevention. Surveillance for viral hepatitis—United States, 2011. http://www.cdc.gov/hepatitis/Statistics/2011Surveillance/index.htm. Accessed 14 November 2013.
- 2.Collier M, Khudyakov Y, Delvage S, et al. Outbreak of hepatitis A in the USA associated with frozen pomegranate arils imported from Turkey: an epidemiological case study. Lancet Infect Dis 2014; 14:976–81. [DOI] [PubMed] [Google Scholar]
- 3.Wheeler C, Vogt T, Armstrong G, et al. An outbreak of hepatitis A associated with green onions. N Engl J Med 2005; 353:890–7. [DOI] [PubMed] [Google Scholar]
- 4.Dentinger C, Bower W, Nainan O, et al. An outbreak of hepatitis A associated with green onions. J Infect Dis 2001; 183:1273–6. [DOI] [PubMed] [Google Scholar]
- 5.Hutin Y, Pool V, Cramer E, et al. A multistate, foodborne outbreak of hepatitis A. National Hepatitis A Investigation Team. N Engl J Med 1999; 340:595–602. [DOI] [PubMed] [Google Scholar]
- 6.Wasley A, Feinstone S, Bell B. Hepatitis A virus. In: Mandell GL, Bennett JE, Dolin R, eds. Mandell, Douglas, and Bennett’s principles and practice of infectious Diseases, 7th ed. Philadelphia, PA: Churchill Livingstone, 2009. [Google Scholar]
- 7.Sattar S, Jason T, Bidawid S, Farber J. Foodborne spread of hepatitis A: Recent studies on virus survival, transfer and inactivation. Can J Infect Dis 2000; 11:159–63. [DOI] [PMC free article] [PubMed] [Google Scholar]
- 8.Centers for Disease Control and Prevention. Prevention of hepatitis A through active or passive immunization: recommendations of the Advisory Committee on Immunization Practices (ACIP). MMWR Recomm Rep 1996; 45:1–30. [PubMed] [Google Scholar]
- 9.Centers for Disease Control and Prevention. Prevention of hepatitis A through active or passive immunization: recommendations of the Advisory Committee on Immunization Practices (ACIP). MMWR Recomm Rep 1999; 481:1–37. [PubMed] [Google Scholar]
- 10.Centers for Disease Control and Prevention. Prevention of hepatitis A through active or passive immunization: recommendations of the Advisory Committee on Immunization Practices. MMWR Recomm Rep 2006; 55:1–23. [PubMed] [Google Scholar]
- 11.Fiore A. Hepatitis A transmitted by food. Clin Infect Dis 2004; 38:705–15. [DOI] [PubMed] [Google Scholar]
- 12.Klevens R, Kruszon-Moran D, Wasley A, et al. Seroprevalence of hepatitis A virus antibodies in the U.S.: results from the National Health and Nutrition Examination Survey. Public Health Rep 2011; 126:522–32. [DOI] [PMC free article] [PubMed] [Google Scholar]
- 13.Centers for Disease Control and Prevention. National Notifiable Diseases Surveillance System (NNDSS). http://wwwn.cdc.gov/nndss/. Accessed 3 March 2014.
- 14.Centers for Disease Control and Prevention. Vital statistics data available online. http://www.cdc.gov/nchs/data_access/Vitalstatsonline.htm. Accessed 10 March 2014.
- 15.Centers for Disease Control and Prevention. CDC/CSTE case definitions. http://wwwn.cdc.gov/NNDSS/script/casedefDefault.aspx. Accessed 5 September 2013.
- 16.Ly K, Xing J, Klevens R, Jiles R, Holmberg S. Causes of death and characteristics of decedents with viral hepatitis, United States, 2010. Clin Infect Dis 2014; 58:40–9. [DOI] [PMC free article] [PubMed] [Google Scholar]
- 17.World Health Organization (WHO). International classification of diseases, 10thrRevision. Geneva, Switzerland: WHO, 1998. [Google Scholar]
- 18.Klein R, Schoenborn C. Age adjustment using the 2000 projected U.S. population. Healthy People 2010 Stat Notes 2001; 20:1–10. [PubMed] [Google Scholar]
- 19.Rosner B. Fundamentals of biostatistics. 6th ed. Belmont, CA: Thomson Brooks/Cole, 2006. [Google Scholar]
- 20.Unites States Census Bureau. Data Tools and Apps. Available at: http://www.census.gov/data/data-tools.html. Accessed 3 March 2014.
- 21.Willner I, Uhl M, Howard S, Williams E, Riely C, Waters B. Serious hepatitis A: an analysis of patients hospitalized during an urban epidemic in the United States. Ann Intern Med 1998; 158:111–4. [DOI] [PubMed] [Google Scholar]
- 22.Klevens R, Miller J, Iqbal K, et al. The evolving epidemiology of hepatitis A in the United States: incidence and molecular epidemiology from population-based surveillance, 2005–2007. Arch Intern Med 2010; 170:1811–8. [DOI] [PubMed] [Google Scholar]
- 23.Brooks N, Regmi A, Jerardo A. U.S.: food import patterns, 1998–2007: a report from the Economic Research Service, 2009. http://www.ers.usda.gov/publications/fau-us-agricultural-trade-update/fau-125.aspx. Accessed 14 November 2013.
- 24.Kim S, Yoon H, Kim Y, et al. Acute hepatitis A-associated acute renal failure in adults. Nephron Clin Pract 2008; 109:c127–32. [DOI] [PubMed] [Google Scholar]
- 25.Centers for Medicare and Medicaid Services. Overview: Physician Quality Reporting Initiative. http://www.cms.hhs.gov/pqri/. Accessed 14 June 2010.
- 26.Centers for Disease Control and Prevention. Noninfluenza vaccination coverage among adults—United States, 2011. MMWR Morb Mortal Wkly Rep 2013; 62:66–72. [PMC free article] [PubMed] [Google Scholar]
- 27.Kanwal F, Schnitzler M, Bacon B, Hoang T, Buchanan P, Asch S. Quality of care in patients with chronic hepatitis C virus infection. Ann Intern Med 2010; 153:231–9. [DOI] [PubMed] [Google Scholar]
- 28.Van Damme P, Banatvala J, Fay O, et al. Hepatitis A booster vaccination: is there a need? Lancet 2003; 362:1065–71. [DOI] [PubMed] [Google Scholar]
- 29.Payne L, Coulombier D. Hepatitis A in the European Union: responding to challenges related to new epidemiological patterns. Eurosurveillance 2009; 14:1–2. [PubMed] [Google Scholar]
- 30.Rosenthal P Cost-effectiveness of hepatitis A vaccination in children, adolescents, and adults. Hepatology 2003; 37:44–51. [DOI] [PubMed] [Google Scholar]
- 31.Centers for Disease Control and Prevention. CDC vaccine price list. http://www.cdc.gov/vaccines/programs/vfc/awardees/vaccine-management/price-list/. Accessed 15 November 2013.
- 32.André F, Van Damme P, Safary A, Banatvala J. Inactivated hepatitis A vaccine: immunogenicity, efficacy, safety and review of official recommendations for use. Expert Rev Vaccines 2002; 1:9–23. [DOI] [PubMed] [Google Scholar]
- 33.Ly K, Xing J, Klevens R, Jiles R, Ward J, Holmberg S. The growing burden of mortality from viral hepatitis in the United States, 1999–2007. Ann Intern Med 2012; 156:271–8. [DOI] [PubMed] [Google Scholar]


