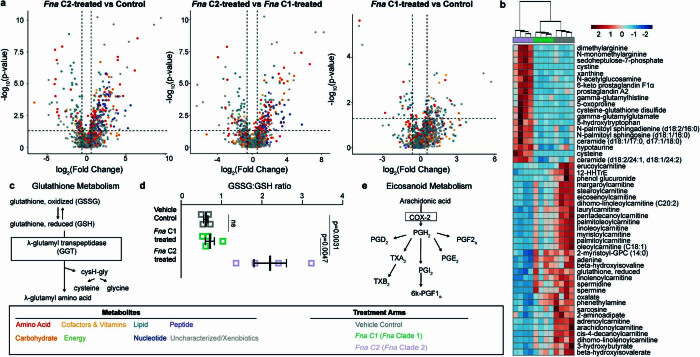
Extended Data Fig. 8. Altered metabolites in Fna treated mice.
a, Plots show the log2-transformed fold change in metabolite level between treatment arms by the -log10(p-value). Points indicate individual metabolites colored by their metabolic categorization. Dotted lines indicate the threshold of significant gene expression, defined as log2-transformed fold change ≥ 0.58 and ≤ −0.58 (vertical lines) and a -log10(p-value) ≥ 1.30 (horizontal line). Statistical analysis performed on natural log-transformed values using one-sided T-test. b, Clustered heatmap of top fifty metabolites across study arms. Dendrogram groups individual samples by similarity of metabolite profile. Bar color for each sample indicates treatment arm, vehicle control (grey), Fna C1-treated (green), or Fna C2-treated (lavender). c, Schematic of glutathione metabolic pathway. d, Plot demonstrates the ratio between oxidized (GSSG) and reduced (GSH) glutathione levels for each treatment arm, vehicle control (grey), Fna C1-treated (green), or Fna C2-treated (lavender); n = 4 mice per arm. Data is plotted as mean ± s.e.m. Statistical analysis performed using one-way ANOVA. e, Schematic of eicosanoid metabolic pathway.

