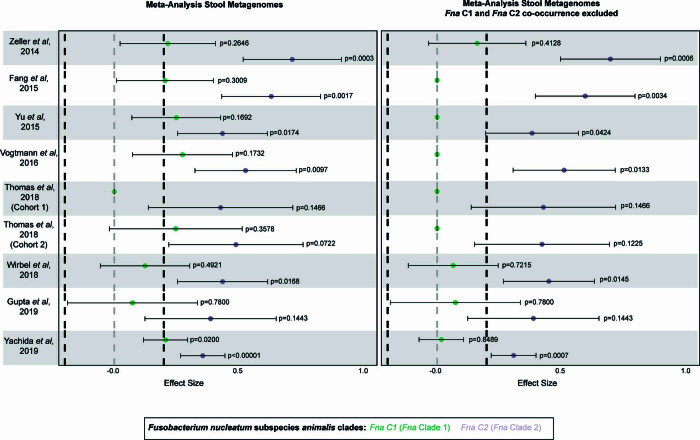
Extended Data Fig. 11. Meta-analysis of Fna in human stool metagenomes.
Fna C1 and Fna C2 detection in stool metagenomic data from previously published independent cohorts from patients with CRC and healthy controls plotted by individual cohorts. Left plot shows the effect sizes for Fna C1 and Fna C2 calculated across all samples (CRC n = 627, healthy control n = 619) using a meta-analysis of standardized mean differences and a random effects model on MetaPhlAn463 species-level genome bins (SGB) abundances. Right plot shows the effect sizes for Fna C1 and Fna C2 calculated using the same approach but with samples where Fna C1 co-occurred with Fna C2 excluded (CRC n = 596, healthy control n = 616). Data is plotted as mean ± s.e.m. Statistical significance assessed by Wald test, two-sided. All p-values are corrected via the Benjamini-Yakuteli method.

