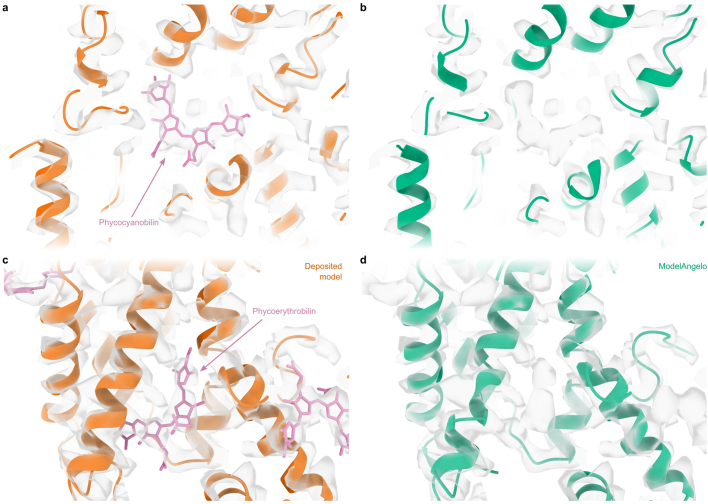
Extended Data Fig. 3. Performance around cofactors in the phycobilisome.
a, Cartoon representation of protein backbones (orange) and stick representation of a phycocyanobilin co-factor (pink) in the cryo-EM density (transparent grey) for the deposited phycobilisome structure. b, as in panel a, but for the model built by ModelAngelo (green). ModelAngelo leaves the cofactor density empty. c, d, as in panels a, b but for a phycoerythrobilin cofactor.

