Abstract
Fms‐like tyrosine kinase‐3 (FLT3) is a commonly mutated gene in acute myeloid leukemia (AML). The two most common mutations are the internal‐tandem duplication domain (ITD) mutation and the tyrosine kinase domain (TKD) mutation. FLT3‐ITD and FLT3‐TKD exhibit distinct protein stability, cellular localization, and intracellular signaling. To understand the underlying mechanisms, we performed proximity labeling with TurboID to identify proteins that regulate FLT3‐ITD or ‐TKD differently. We found that BRCA1/BRCA2‐containing complex subunit 36 (BRCC36), a specific K63‐linked polyubiquitin deubiquitinase, was exclusively associated with ITD, not the wild type of FLT3 and TKD. Knockdown of BRCC36 resulted in decreased signal transducers and activators of transcription 5 phosphorylation and cell proliferation in ITD cells. Consistently, treatment with thiolutin, an inhibitor of BRCC36, specifically suppressed cell proliferation and induced cell apoptosis in ITD cells. Thiolutin efficiently affected leukemia cell lines expressing FLT3‐ITD cell viability and exhibited mutual synergies with quizartinib, a standard clinical medicine for AML. Furthermore, mutation of the lysine at 609 of ITD led to significant suppression of K63 polyubiquitination and decreased its stability, suggesting that K609 is a critical site for K63 ubiquitination specifically recognized by BRCC36. These data indicate that BRCC36 is a specific regulator for FLT3‐ITD, which may shed light on developing a novel therapeutic approach for AML.
Keywords: cellular signaling, deubiquitination, glycoprotein, N‐glycan, protein stability
The present study first demonstrated that the N‐glycosylation processing in the Golgi is essential for either wild type (WT) or the mutants of Fms‐like tyrosine kinase‐3 (FLT3)‐mediated signaling. The specific interaction between the internal‐tandem duplication domain (ITD) and BRCC36 enhanced ITD stability only and its mediated intracellular signaling. Dual inhibition of FLT3/BRCC36 synergistically affects ITD function, providing a new target for treating the FLT3‐ITD acute myeloid leukemia.
1. INTRODUCTION
Intracellular protein homeostasis is regulated by protein synthesis and degradation. 1 Proteins are degraded by two main proteolytic systems: the autophagy‐lysosome pathway and the ubiquitin‐proteasome system. 2 Ubiquitination mediates the targeting of a substrate to the proteasome and the lysosome, a significant site for protein degradation. 3 Ubiquitination, a process that forms a bond between ubiquitin and the lysine residue at the target site of a protein, is one of the multifaceted post‐translational modifications regulating almost all of the cellular processes. 4 This process, both dynamic and reversible, is regulated by ubiquitin ligases and deubiquitinases (DUBs). 5 Previous studies have demonstrated a variety of linkages within ubiquitin chains, determined by the ubiquitination sites. 6 Among them, K48‐ and K63‐linked polyubiquitin chains are the most well‐studied members and the most abundant types in cells. 7 The role of K48‐linked chains is to target substrates to the proteasome for degradation. 8 In contrast, the K63 chain performs various functions, including DNA damage repair, kinase signaling pathways, receptor trafficking, and ribosomal biogenesis. 9 BRCA1/BRCA2‐containing complex subunit 36 (BRCC36), a specific K63 DUB, comprises a functional metalloprotease domain and a predicted coiled‐coil region, 10 and belongs to the JAMM/MPN+ family of deubiquitinating enzymes. BRCC36 requires the formation of multi‐subunit complexes to express its isopeptidase activity. In the nucleus, BRCC36 and the subunits MERIT40, BRCC45/BRE, Abraxas, and RAP80 form the BRCA1‐A complex to participate in DNA damage repair. 11 In the cytoplasm, BRCC36, together with the subunits MERIT40/NBA1, BRCC45/BRE, and Abro1/KIAA0157, forms a BRISC (BRCC36 isopeptidase complex) complex to play significant roles in various signaling pathways. 12
Acute myeloid leukemia (AML) is the most common form of acute leukemia in adults. It represents the deadliest type of this disease. 13 Fms‐like tyrosine kinase 3 (FLT3) is one of the most frequently mutated genes in AML. 14 As a cell‐surface receptor for the cytokine FLT3 ligand, FLT3 can regulate the differentiation, proliferation, and survival of hematopoietic progenitor cells. 15 Internal tandem duplication (ITD) of the juxtamembrane domain of FLT3 is the primary kinase mutation in human AML, and the other predominant point mutation is the tyrosine kinase domain (TKD) mutation. 16 AML patients harboring mutations are known to have lower survival rates and higher relapse rates, underscoring the urgent need for research into novel strategies to target mutant FLT3. 17 A previous study comparing ITD and TKD mutations found that ITD was associated with worse relapse‐free survival, an association not found with TKD mutations. 18 , 19 The majority of patients harboring ITD experience relapse within a short period after discontinuation of chemotherapy. 20 The development of tyrosine kinase inhibitors (TKIs) blocking ITD has become a rational therapeutic concept. 21
Thus far, several experiments have revealed exclusive interactions between ITD or TKD and other molecules. FLT3‐ITD but not TKD uses Src to activate signal transducers and activators of transcription 5 (STAT5). 22 The association of NPM1c with FLT3‐TKD shifts the TKD localization and activates STAT5 signaling. 23 ITD and TKD have different abilities to induce the activation of signaling pathways, 24 , 25 which underscores the importance of distinguishing these mutants in disease progression and treatment.
Exploring the protein interactome is a common approach to uncovering new properties of target proteins. Mass spectrometry with affinity purification is a frequently used strategy to identify novel protein interactions. Proximity labeling is performed by ligases that catalyze the transition of an inert small molecular substance into a highly reactive form and connect proximal endogenous proteins. 26 TurboID uses biotin and ATP to generate biotin‐5′‐AMP. This reactive intermediate can rapidly label lysine residues of the near proteins. TurboID has higher activity than previously described biotin proximity labeling methods, such as BioID, enabling higher temporal resolution and broader application in vivo. 26
In the present study, we used proximity labeling technology combined with liquid chromatography–mass spectrometry analysis to distinguish the properties of FLT3 mutants. We found that FLT3‐ITD specifically associates with BRCC36, which hydrolyzes K63‐linked polyubiquitin chains of ITD. The association with BRCC36 specifically enhanced the ITD stability and its mediated intracellular signaling. Conversely, the knockdown of BRCC36 or its inhibitor downregulated ITD expression and downstream signaling. Thus, BRCC36 may be a promising target for novel therapies against FLT3‐ITD‐positive AML.
2. MATERIALS AND METHODS
Detailed materials and methods for this paper are provided in Appendix S1.
3. RESULTS
3.1. Comparison of FLT3 localization in FLT3‐WT, FLT3‐ITD, and FLT3‐TKD cells
It is known that there are two forms of human FLT3. One is a mature form at around 150 kDa, which is thought to be fully N‐glycosylated and is then expressed on the cell surface to activate mitogen‐activated protein kinase (MAPK) signaling pathways efficiently. The other is an immature form at around 130 kDa, which may be mainly localized in the ER. 27 To confirm further the difference in the mature status of FLT3‐WT and mutants, we transfected 293T cells with corresponding plasmids and performed western blotting. There was a more mature form in FLT3‐WT cells than in mutant cells. In FLT3‐ITD, most of the protein was immature, with a small percentage of mature form, while FLT3‐TKD mainly existed as an immature form (Figure 1A). Changes in FLT3 localization are known to affect downstream signaling. 28 To determine the specific location of FLT3, the immunostaining used antibodies against FLT3, and wheat germ agglutinin (WGA), which can clearly stain the plasma membrane, was performed in HeLa cells. FLT3‐WT was located in both plasma membrane (indicated by arrows) and internal cellular components, while ITD and TKD were primarily localized to internal cellular components (Figure 1B). To further investigate the specific localization of FLT3 in leukemia cells, we utilized human leukemia cell lines RS4‐11 and MV4‐11, which endogenously express similar levels of FLT3‐WT or FLT3‐ITD, respectively. 29 As shown in Figure S1A, FLT3‐WT was mainly expressed on the cell surface co‐localized with the WGA staining indicated by arrows, while FLT3‐ITD was mainly localized to internal cellular components. Previously, we found that FLT3‐ITD and TKD also have complex N‐glycans containing fucosylation, 30 which are synthesized and processed in the Golgi apparatus.
FIGURE 1.
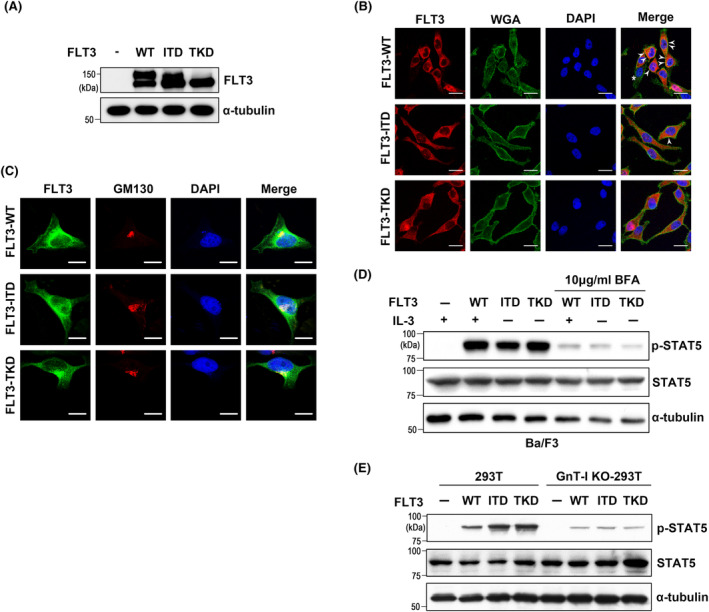
Comparison of FLT3 localization among WT and mutants in HeLa cells, and effects of N‐glycosylation on cellular signaling. (A) Expression patterns of FLT3 in 293T cells. Expression of WT, ITD, or TKD was determined by western blotting with FLT3 antibody. (B) and (C) Representative images of immunofluorescent staining showed the expression and localization of WT, ITD, and TKD in HeLa cells, in which cell membrane and Golgi apparatus are more easily distinguishable due to the superior cell spread property compared to other cell types such as 293T and Ba/F3 cells. The white arrows indicate the cell surface area. The asterisk represents cells that were not successfully transfected. DAPI (blue) was used for nuclear staining. Bar represents 20 μm. (D) The levels of p‐STAT5 were analyzed by western blot in Ba/F3 cells treated with or without BFA. The Ba/F3‐FLT3‐WT cells, stably transfected, were cultured in the presence of 1 ng/mL IL‐3 as described in the Materials and methods section. FLT3‐ITD and TKD cells were not included in this culture. (E) Effects of GnT‐I‐KO on the levels of p‐STAT5 in 293T cells. The same amounts of cell lysates were blotted with indicated antibodies. α‐Tubulin was used as an internal control.
Considering both mutants are mainly located in the ER as previously described, 31 we speculate that both mutants may be transported to the Golgi apparatus once and then undergo retrograde transport from the Golgi apparatus to the ER to activate the downstream pathways. We therefore performed immunostaining to check if ITD and TKD were also localized in the Golgi apparatus. These mutants were partly co‐localized with GM130, a cis Golgi marker (Figure 1C). ITD and TKD can induce a robust activation of STAT5. The Ba/F3 cell was an interleukin‐3 (IL‐3)‐dependent cell line and IL‐3 can induce STAT5 phosphorylation in FLT3‐WT Ba/F3 cells. 30 We found that the Golgi entry was essential for mutant‐mediated cellular signaling. As shown in Figure 1D, P‐STAT5 levels were suppressed in WT cells and mutants in the presence of brefeldin A (BFA), which blocks the ER–Golgi transport. 32 However, in MV4‐11 cells, p‐STAT5 levels were enhanced in the presence of BFA (Figure S1B), which was also observed in 32D cells. 28 Taken together, these results suggest that the effects of BFA on FLT3‐ITD‐mediated cellular signaling may differ in different cell lines. To further clarify the effects of the complex type of N‐glycans processed in the Golgi apparatus on downstream signaling, we established N‐acetylglucosaminyltransferase I (GnT‐I) knockout (KO) 293T cells. GnT‐I is a key enzyme in the cis‐Golgi cisternae that transfers N‐acetylglucosamine (GlcNAc) onto the N‐glycan core (containing five mannose). The addition of GlcNAc by GnT‐I is required for the action of α‐mannosidase II and N‐acetylglucosaminyltransferase‐II (GnT‐II), and further reaction in a catalytically ordered pathway. 33 Deficiency of GnT‐I leads to loss of the downstream N‐glycosylation pathway and results in the presence of high‐mannose types of N‐glycans. 34 As expected, after the removal of high‐mannose types of N‐glycans via treatment with endoglycosidase H, the mobility shifts of all FLT3 bands were at the same level around 120 kDa in GnT‐I KO cells, faster than those of immature forms indicated in the red line in 293T WT cells (Figure S2). This result clearly indicates that even FLT3 mutants contain hybrid and/or complex types of N‐glycans. Furthermore, GnT‐I KO resulted in suppression of p‐STAT5 levels in both WT and mutants (Figure 1E), suggesting that a modification of the complex type of N‐glycans processed in the Golgi apparatus is required for FLT3‐mediated signaling.
3.2. Comparison of protein stability of FLT3 among the three cell lines
In addition to localization, we also investigated the protein stability of WT and FLT3 mutants in 293T cells. When cells were treated with MG132, a proteasome inhibitor, the increase in FLT3 was observed only in the WT cells, compared with the ITD and TKD cells (Figure 2A), suggesting the degradation of both mutants is mainly not through the proteasomal pathway. On the other hand, when cells were treated with cycloheximide (CHX), a protein synthesis inhibitor, the decay of FLT3 in the WT or ITD cells was significantly faster than that in TKD cells (Figure 2B), which suggests that TKD is more stable than ITD to some extent. The two mutants' different locations and protein stabilities further prompted us to investigate the underlying mechanisms.
FIGURE 2.
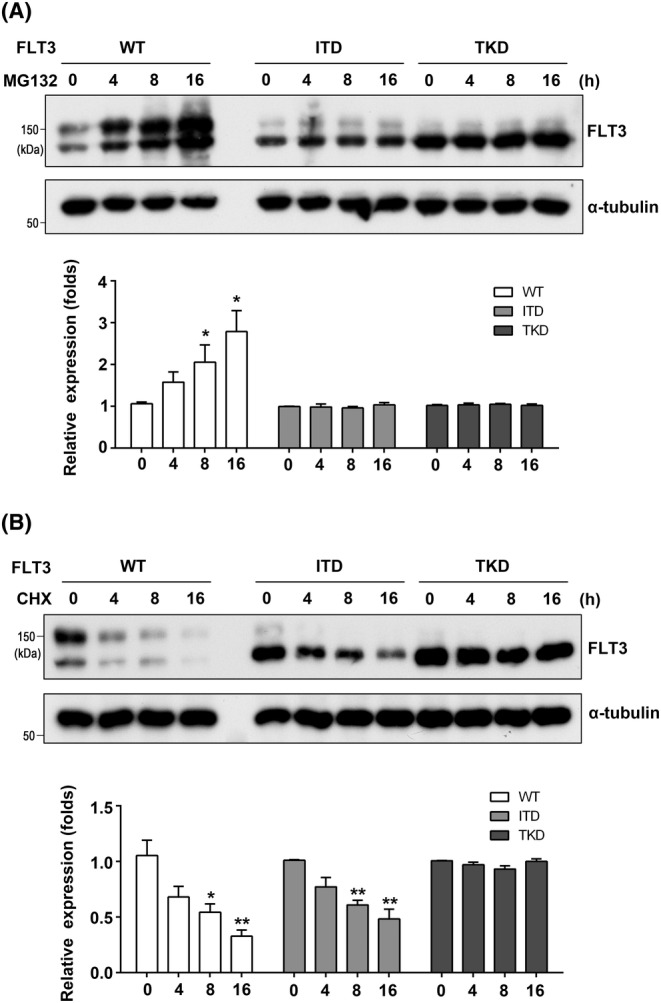
Comparison of FLT3 stabilities among WT and mutants. 293 T cells were transfected with WT, ITD, or TKD and then treated with MG132 at 5 μM (A) or CHX at 50 μg/mL (B) for indicated times. The same amounts of cell lysates were blotted with indicated antibodies. The experiments were independently repeated three times. α‐Tubulin was used as an internal control. The relative expression levels of FLT3 were calculated by the intensities of FLT3 to that of α‐tubulin, which for cells without MG132 or CHX was set as 1.0. Data were analyzed by one‐way ANOVA and presented as the mean ± SD. *P < 0.05, **P < 0.01.
3.3. Proximity labeling and identification of proteins that specifically interact with FLT3 mutants
To identify proteins that differently regulate FLT3‐ITD or FLT3‐TKD, we performed proximity labeling with TurboID fused to the C‐terminus of FLT3, which catalyzes the biotinylation of proteins that transiently interact with FLT3 in the presence of biotin. Considering the higher transfection efficiency and protein yield, we transfected these expression vectors into 293T cells. Western blotting with anti‐FLT3 antibody demonstrated that FLT3‐TurboID was successfully expressed, and the two forms of FLT3 shown in Figure 3A were quite similar to the pattern shown in Figure 1A without the TurboID tag, suggesting that the TurboID tag does not affect the location of FLT3 proteins and posttranslational modification by N‐glycans.
FIGURE 3.
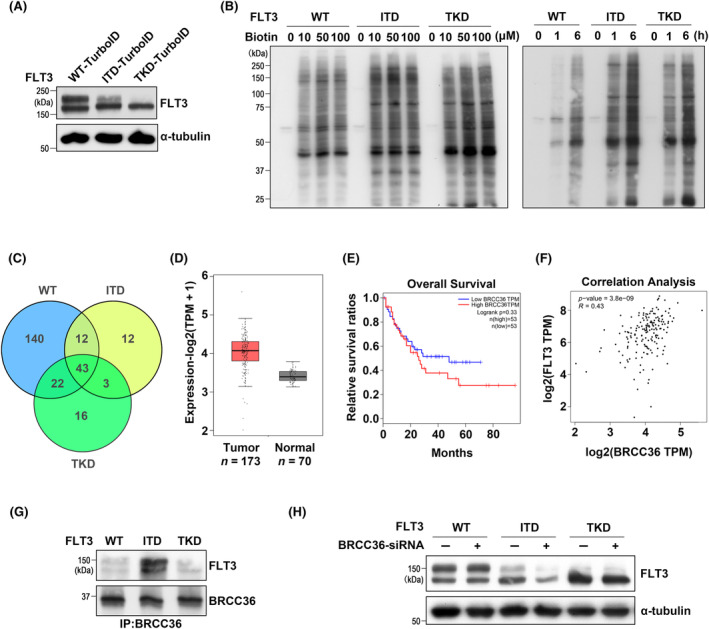
Proximity labeling and identification of BRCC36. (A) Expression patterns of FLT3‐TurboID in 293T cells. Expression of WT‐, ITD‐, or TKD‐TurboID was determined by western blotting with FLT3 antibody. (B) Determination of suitable biotin concentration and labeling time in 293T cells expressing WT‐, ITD‐, or TKD‐TurboID. The same amounts of cell lysates were detected with the ABC kit. (C) Venn diagram showing the peptide distribution identified by MS in 293T cells expressing WT‐, ITD‐, or TKD‐TurboID. After biotinylation, the peptides were purified by the streptavidin‐coated magnetic beads as described in the Material and methods section. (D) Expression levels of BRCC36 in AML and normal tissues in the Gene Expression Profiling Interactive Analysis (GEPIA) database (n = 243). TPM, transcripts per million. (E) Survival plots of AML patients stratified by the BRCC36 levels using the GEPIA database (n = 106). The vertical lines represent censored data. (F) Correlation analysis between FLT3 and BRCC36 gene from the GEPIA database. (G) The immunoprecipitates (IP) with anti‐BRCC36 antibody were analyzed by western blot using an anti‐FLT3 antibody. (H) 293T cells were transfected with WT, ITD, or TKD plasmids with or without BRCC36‐siRNA. FLT3 stability was evaluated by western blot using an anti‐FLT3 antibody. α‐Tubulin was used as an internal control.
To identify the optimal biotin concentration for protein labeling, we treated cells with varying concentrations of biotin and found that 50 μM is sufficient for biotinylation (Figure 3B, left panel). We treated the cells with 50 μM biotin for varying durations to determine the optimal incubation time (Figure 3B, right panel). A 6‐h incubation was sufficient to achieve robust protein labeling. After the biotinylated proteins were digested by trypsin and affinity‐purified by streptavidin beads, eluates were subjected to mass spectrometry (MS) analysis as described above. In total, 371 proteins were identified from FLT3‐WT, ITD, and TKD samples (Table S1). The graph shows that 12 proteins were detected explicitly in ITD and 16 were detected in TKD (Figure 3C). We selected 11 candidates detected exclusively in ITD or TKD related to protein stability, vesicle transport, or signal transduction. The effects of these 11 proteins were assessed by observing changes in the phosphorylation levels of STAT5, Erk, and Akt in FLT3‐WT, ITD, or TKD cells, using specific small interfering RNAs (siRNAs) for each to exclude unrelated candidates (Figure S3). Among these, we noted that depletion of BRCC36, which was explicitly associated with ITD based on the MS results, significantly suppressed p‐STAT5 and p‐Erk in ITD cells, not TKD cells, which may offer some molecular insights into the distinctions between ITD and TKD mutants. We therefore considered BRCC36 as a potential ITD‐interacting protein. BRCC36 is a catalytic subunit responsible for most K63‐ubiquitin (Ub)‐specific DUB activity in the cytoplasm and the nucleus. 35 The expression levels of BRCC36, survival rates in AML patients, and correlation analysis were obtained from the Gene Expression Profiling Interactive Analysis database (http://gepia.cancer‐pku.cn/). The data revealed marked upregulation of BRCC36 in the tumor group compared to the healthy group (Figure 3D), and BRCC36 caused a slight reduction of survival rate in AML (Figure 3E). Moreover, the expression of FLT3 is significantly correlated with the expression of BRCC36 (Figure 3F). To verify the MS results biochemically, we performed co‐immunoprecipitation (co‐IP) experiments and found that BRCC36 specifically interacts with ITD (Figure 3G). Moreover, BRCC36‐knockdown (KD) using siRNA destabilized ITD but not WT and TKD (Figure 3H). Collectively, the interaction between BRCC36 and FLT3‐ITD is specific and functional.
3.4. Effects of BRCC36 on cellular signaling and cell proliferation in FLT3‐ITD‐expressing cells
To investigate the influence of BRCC36 on FLT3 expression and cellular signaling, the BRCC36‐siRNAs were transfected into both Ba/F3 cells and 293T cells. The efficiency of RNA interference was confirmed by quantitative PCR (qPCR) (Figure 4A) and western blotting with an anti‐BRCC36 antibody (Figure 4B,C). These siRNAs efficiently silenced the corresponding protein expression in both Ba/F3 and 293T cells and were used in the following experiments. In the BRCC36‐KD Ba/F3 cells, the p‐STAT5 levels, and specific signaling of FLT3, were remarkably reduced in ITD cells compared to untreated cells. In contrast, the p‐STAT5 levels in TKD cells and IL‐3‐induced p‐STAT5 levels in FLT3‐WT cells were not affected by the BRCC36‐KD (Figure 4B).
FIGURE 4.
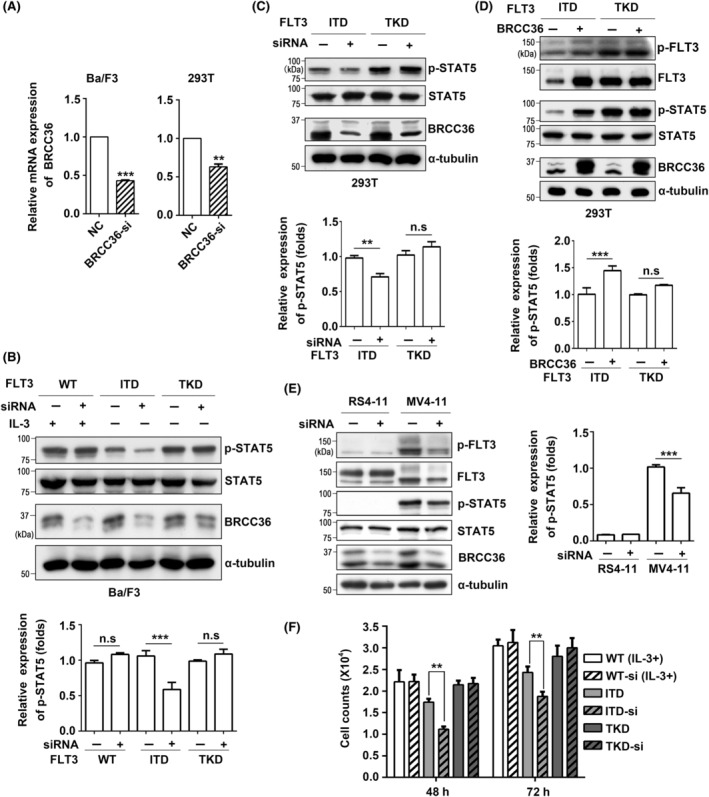
The effects of BRCC36 on FLT3 expression and its mediated signaling. (A) Ba/F3 cells and 293T cells were transiently transfected with BRCC36‐siRNAs for 48 h, and then BRCC36 expression levels were detected by qPCR. Glyceraldehyde‐3‐phosphate dehydrogenase (GAPDH) was used as an internal control. After transfection with BRCC36‐siRNAs, the expression levels of p‐STAT5 and BRCC36 in Ba/F3 cells (B) or 293T cells (C) were detected by western blot using indicated antibodies. α‐Tubulin was used as an internal control. The relative expression levels of p‐STAT5 were calculated by the intensities of p‐STAT5 to that of STAT5, which for cells without transfection was set as 1.0. Data were analyzed by one‐way ANOVA and presented as the mean ± SD (n = 3). (D) After overexpression of BRCC36 in 293T cells, the expression levels of p‐FLT3, FLT3, p‐STAT5, and BRCC36 were detected by western blot. (E) After transfection with BRCC36‐siRNAs, the expression levels of p‐FLT3, FLT3, p‐STAT5, and BRCC36 in RS4‐11 (FLT3‐ITD negative) and MV4‐11 (FLT3‐ITD positive) cells were detected by western blot. The relative expression levels of p‐STAT5 were calculated by the intensities of p‐STAT5 to that of STAT5, which for MV4‐11 cells without transfection was set as 1.0. (F) Effects of BRCC36‐siRNA on cell proliferation in WT, ITD, and TKD Ba/F3 cells. The experiments were independently repeated three times. **P < 0.01, ***P < 0.001.
Furthermore, to confirm the influence of BRCC36 on FLT3, we transfected 293T cells with either BRCC36‐siRNA or a BRCC36‐overexpression plasmid. Consistent with the Ba/F3 cells data, BRCC36‐KD attenuated the p‐STAT5 levels only in ITD cells, not TKD‐expressing 293T cells (Figure 4C). Conversely, overexpression of BRCC36 increased the p‐FLT3 and FLT3 expression and enhanced the p‐STAT5 levels in ITD cells, which were not observed in the TKD cells (Figure 4D). BRCC36‐KD significantly reduced the levels of p‐FLT3, FLT3, and p‐STAT5 in MV4‐11 cells, but not in RS4‐11 cells (Figure 4E). Moreover, we examined the effect of BRCC36‐KD on the cell proliferation of Ba/F3 cells. The BRCC36‐KD significantly inhibited cell proliferation of ITD cells but not WT and TKD cells (Figure 4F). These results further support the conclusion that BRCC36 regulates the expression and cellular signaling of the FLT3‐ITD mutant.
3.5. Effects of BRCC36 on the K63‐linked polyubiquitin on FLT3‐ITD
BRCC36 is a metalloprotease that specifically cleaves K63‐linked polyubiquitin chains, so we wondered about the impact of the K63‐ubiquitin chain on FLT3‐ITD expression. 293T cells were co‐transfected with the plasmids expressing each variant of FLT3 and hemagglutinin (HA) tagged K63‐Ub (HA‐K63‐Ub), a ubiquitin construct in which all lysine ubiquitination sites except K63 are mutated. 36 Western blot analysis showed that K63‐Ub containing an HA tag was appreciably detected by the anti‐HA antibody (Figure 5A). Following transfection with K63‐Ub, the expression levels of FLT3 in ITD cells were significantly decreased compared to those in TKD cells (Figure 5A). To confirm the interaction between BRCC36 and ITD further, the cells expressing HA‐K63‐Ub and ITD or TKD were treated with or without thiolutin (Thl), which is characterized as a Zn2+ ion chelator capable of inhibiting DUB activity, including BRCC36. 37 Western blot results showed that thiolutin significantly downregulated the p‐STAT5 levels in both Ba/F3 cells (Figure 5B) and 293T cells (Figure 5C) expressed ITD, not those expressed TKD. Thiolutin did not affect IL‐3‐induced p‐STAT5 in FLT3‐WT Ba/F3 cells. Consistently, thiolutin treatment reduced p‐FLT3, FLT3, and p‐STAT5 levels in MV4‐11 cells, but not in RS4‐11 cells (Figure 5D). The co‐IP analysis revealed that inhibiting BRCC36 with the inhibitor or siRNA induced an increase in K63‐Ub chains in ITD cells compared to control cells, while no significant changes were observed in TKD cells (Figure 5E). Conversely, overexpression of BRCC36 decreased the K63‐Ub chains in ITD cells, with no observable changes in TKD cells (Figure 5E). These data suggest that BRCC36 disassembles the K63‐linked polyubiquitin chains on FLT3‐ITD, thereby increasing protein stability.
FIGURE 5.
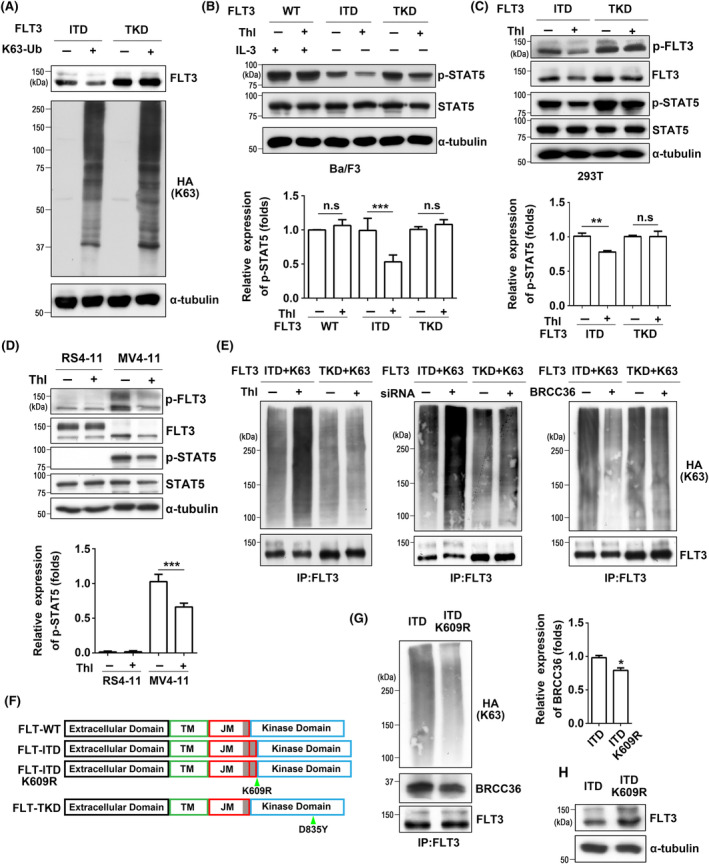
Thiolutin, a BRCC36 inhibitor, affects FLT3‐mediated signaling and K63 polyubiquitin. (A) 293T cells were transfected with HA‐K63‐Ub and ITD or TKD. The expression levels of FLT3 and HA‐K63‐Ub were detected by western blot using anti‐FLT3 and anti‐HA antibodies. After treatment with thiolutin (Thl), the expression levels of p‐STAT5 in Ba/F3 cells (B) and the expression levels of p‐FLT3, FLT3, and p‐STAT5 in 293T cells (C) were detected by western blot. The relative expression levels of p‐STAT5 were calculated by the intensities of p‐STAT5 to that of STAT5, which for cells without treatment with Thl was set as 1.0. Data were analyzed by one‐way ANOVA and presented as the mean ± SD (n = 3). α‐Tubulin was used as an internal control. (D) After treatment with Thl, the expression levels of p‐FLT3, FLT3, and p‐STAT5 in RS4‐11 and MV4‐11 cells were detected by western blot. The relative expression levels of p‐STAT5 were calculated by the intensities of p‐STAT5 to that of STAT5, which for MV4‐11 cells without treatment with Thl was set as 1.0. (E) 293T cells expressing HA‐K63‐Ub and FLT3‐ITD or TKD were treated with or without thiolutin (left panel), BRCC36‐siRNA (middle panel), or BRCC36‐overexpression plasmid (right panel). After immunoprecipitation with an anti‐FLT3 antibody, the expression levels of K63 polyubiquitin in the immunoprecipitants were detected by western blotting with an anti‐HA antibody. (F) The diagrams show the WT and mutants used in this study. The gray shading shows the REYEYDL(K) amino acid sequence, duplicated in the ITD. TM, transmembrane domain; JM, juxtamembrane domain. (G) The effects of lysine at 609 of ITD on K63 polyubiquitin and interaction between ITD and BRCC36. The immunoprecipitants of FLT3 were detected by western blotting with indicated antibodies. The relative expression levels of BRCC36 were calculated by the intensities of BRCC36 against FLT3, which for ITD cells was set as 1.0. (H) The expression levels of FLT3 in the same amounts of cell lysates were evaluated by western blot. α‐Tubulin was used as an internal control. *P < 0.05, **P < 0.01, ***P < 0.001.
Given the interaction between BRCC36 and FLT3‐ITD, we determined the specific ubiquitination site to understand why BRCC36 cleaved K63‐Ub specifically in ITD but not in TKD. Ubiquitination starts with connecting a single ubiquitin molecule to a substrate lysine residue. 4 Considering the molecular features of two mutants, lysine 609, which directly connects ITD with the other normal sequence in the juxtamembrane domain of FLT3‐ITD, 19 , 38 might be a potential ubiquitination site. To determine the importance of this lysine residue in ITD for K63‐Ub binding, we utilized the ITD mutant in which this lysine residue was substituted with arginine (FLT3‐ITD‐K609R) (Figure 5F). As expected, IP experiments demonstrated that the K63‐Ub levels were suppressed in the FLT3‐ITD‐K609R cells (Figure 5G). Furthermore, the interaction with BRCC36 decreased in the ITD‐K609R cells (Figure 5G). These data indicate that K609 of FLT3‐ITD is a critical site for K63 ubiquitination. Consistently, the expression levels of ITD were enhanced in the ITD‐K609R cells (Figure 5H), suggesting the K63‐Ub promotes ITD degradation.
3.6. Synergistic effects of BRCC36 inhibitor and FLT3 kinase inhibitor on FLT3‐ITD‐mediated cellular signaling, cell proliferation, and cell apoptosis
To investigate the role of thiolutin in the treatment of AML, we exposed the cells to thiolutin at 0.2 μM with or without AC220 (quizartinib), a tyrosine kinase inhibitor with clinical promise for AML, at 1 nM, for a duration of 8 h. 39 The combination of the two drugs efficiently reduced the expression levels of p‐STAT5 (Figure 6A) and exhibited robust antiproliferative potencies in FLT3‐ITD Ba/F3 cells (Figure 6B). Moreover, AC220 also inhibited the levels of p‐FLT3 in both RS4‐11 and MV4‐11 cells, and p‐STAT5 levels in MV4‐11 cells (Figure S1C). Curiously, the treatment with AC220 increased the mature form of FLT3‐ITD in MV4‐11 cells, which is similar to the FLT3‐WT in RS4‐11 cells. The detailed mechanism for the phenomenon requires further study. Furthermore, an Annexin V‐FITC apoptosis assay revealed that the combination of drugs significantly induced cell apoptosis (Figure 6C). To further investigate the specific role of thiolutin in leukemia cells, we utilized MV4‐11 and RS4‐11 cell lines. As expected, the cell viability assay showed that MV4‐11 cells were more sensitive to the stimulation of thiolutin than RS4‐11 cells (Figure 6D). Taken together, our data suggest that the potential synergistic activity of the dual inhibition of FLT3/BRCC36 may apply to the clinical treatment of FLT3‐ITD patients.
FIGURE 6.
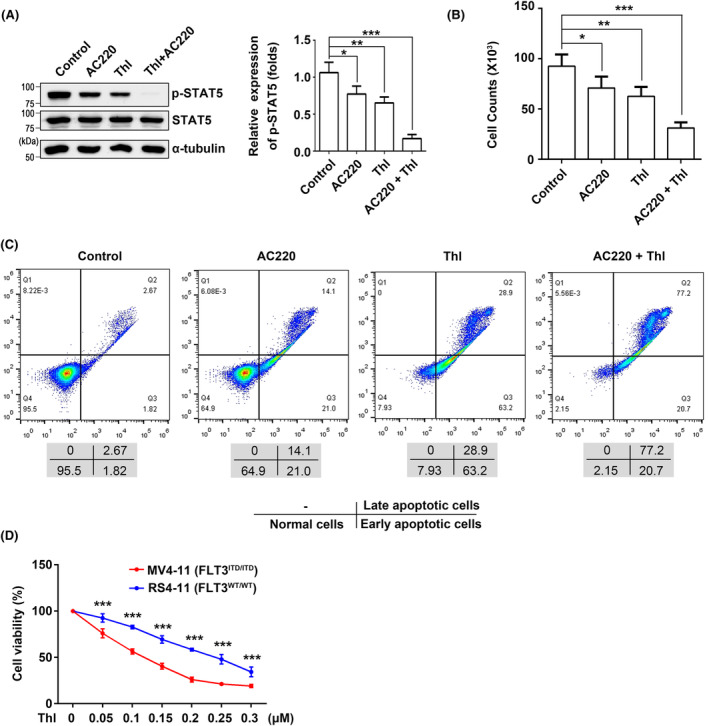
Synergistic inhibitory effects of thiolutin and quizartinib on cellular signaling, cell proliferation, and apoptosis in FLT3‐ITD Ba/F3 cells. (A) The expression levels of p‐STAT5 in ITD cells, following various treatments, were detected by western blot. α‐Tubulin was used as an internal control. The relative expression levels of p‐STAT5 were calculated by the intensities of p‐STAT5 against STAT5, which for cells without treatment with the drug was set as 1.0. Data were analyzed by one‐way ANOVA and presented as the mean ± SD (n = 3). These treatments also affected cell proliferation abilities using cell counting (B) and cell apoptosis using Annexin V‐FITC apoptosis assay kit (C). (D) MV4‐11 cells and RS4‐11 cells were treated with different doses of thiolutin, and a cell viability assay was performed to determine the drug sensitivity. The number of cells without the treatment was set as 100%. *P < 0.05, **P < 0.01, ***P < 0.001.
4. DISCUSSION
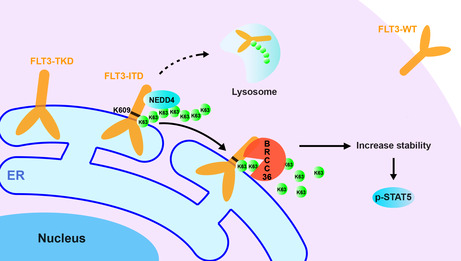
In this study, we screened for proteins that interact with FLT3 mutants and found that BRCC36, a K63‐linked polyubiquitin chain deubiquitinase, was specifically associated with FLT3‐ITD and increased its stability and downstream signaling (Figure 7). Conversely, the downregulation of BRCC36 expression or BRCC36 activity suppressed the downstream signaling and cell proliferation, and promoted cell apoptosis. These results suggest that BRCC36 may be a potential therapeutic target protein for AML.
FIGURE 7.
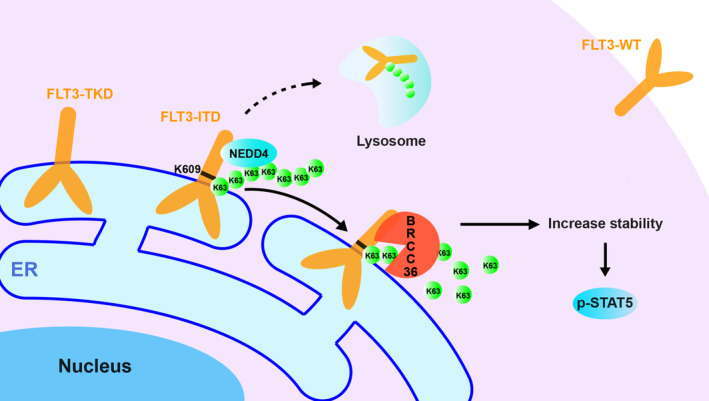
Schematic diagram of the proposed molecular mechanism for the specific interaction between FLT3‐ITD and BRCC36 for regulating cell functions. FLT3 is one of the most frequently mutated genes in AML, such as ITD and TKD, which shift the localization on the cell surface to ER, where both activate STAT5. Most patients harboring ITD mutants suffer from a worse relapse and poor survival rates. This study demonstrates that BRCC36, a K63‐linked polyubiquitin chain deubiquitinase, was selectively associated with ITD, not WT or TKD, enhancing its stability and downstream signaling, including p‐STAT5. Furthermore, we identified that K609, which links with the duplicate sequence in ITD, is a critical site for K63‐linked polyubiquitin, which is presumably modified by neural precursor cell‐expressed developmentally downregulated protein 4. 44 Thus, BRCC36 may be a promising target for novel therapy against FLT3‐ITD‐positive AML. The dotted line indicates the degradation pathway has not been directly proved in this study, necessitating further investigation.
FLT3 is a transmembrane ligand‐activated receptor tyrosine kinase commonly expressed in hematopoietic stem cells that plays a vital role in the early stages of myeloid and lymphoid lineage development. 40 FLT3‐ITD occurs as the replicated sequence in the juxtamembrane domain, and TKD occurs in the tyrosine kinase domain. Both mutants constitutively activate FLT3 kinase activity, thereby playing a role in the biology of AML. The present study showed that both have different N‐glycosylation patterns and intracellular localizations (Figure 1). This is consistent with previous studies that noted most ITD and TKD are localized at the ER, with only a minority of ITD expressed on the cell surface. 28 , 41 It is worth noting that although both are mainly located in the ER, entry into the Golgi for further N‐glycosylation is essential for cellular signaling mediated by both mutants. This is because blocking ER–Golgi transport with BFA or GnT‐I‐KO significantly suppressed p‐STAT5 levels (Figure 1). In addition, both mutants showed distinctive protein stabilities, i.e., TKD is more stable than ITD (Figure 2). These studies suggest that both mutants may have different regulatory mechanisms in AML biology.
Compared with TKD, patients harboring ITD have elevated peripheral blood counts, an increased chance of relapse, and inferior overall survival. 19 In experimental models, ITD induced a myeloproliferative phenotype for myeloproliferative disease, whereas TKD caused a lymphoid disease with different hematologic manifestations in the murine bone marrow. 25 , 42 Both mutants differ concerning their structural features and clinical presentation but also show significant disparities in biological transforming potential and molecular biology, as described above. Thus, exploring the target protein collaborating with ITD or TKD specifically for treating AML is fundamental.
Traditional techniques for identifying protein interaction face challenges in effectively capturing weak or transient interactions. In this study, we used the TurboID ligase, 43 a new proximity‐dependent labeling technique, to identify target proteins associated with FLT3. According to the results of MS analysis, BRCC36, a deubiquitinase for K63 polyubiquitination, was found to be explicitly associated with ITD, not TKD or WT. Furthermore, using biochemical approaches, this study proved that ITD physically and functionally interacts with BRCC36 (Figures 3, 4, 5, 6). It has been reported that ITD could be poly‐ubiquitinated with both K48 and K63 linkages, and the K48 polyubiquitination was preferentially linked by c‐Cbl, 44 while neural precursor cell‐expressed developmentally downregulated protein 4 preferentially performed K63 polyubiquitination, an E3 ligase reported specific for K63 chains. 45 Interestingly, inhibition of the deubiquitinase USP9X, which cleaves various Ub chains, including K48 and K63 linkages, induced apoptosis preferentially in cells transformed by the ITD mutant and decreased the downstream signaling event. 46 In addition, inhibiting deubiquitinase USP10, which cleaves the K48 linkage, promotes ITD degradation and confers an antiproliferative effect both in vitro and in vivo. 47 Although those studies did not show the direct interaction between DUBs and FLT3, they underscored the importance of regulatory polyubiquitination in playing crucial roles in the pathological phenotypes of ITD, which further supports our findings. Our results revealed that BRCC36 specifically and spatially connects with FLT3‐ITD and disassembles its K63‐ubiquitin. This might provide more precise insights into the molecular mechanisms and evidentiary support for the significance of K63‐ubiquitin in regulating ITD in hematopoietic cells. To understand why BRCC36 cleaved K63‐Ub specifically in ITD but not in TKD, we established FLT3‐ITD‐K609R cells according to the different molecular features of two mutants (Figure 5F) and performed IP experiments with these cells. The data indicated that K609 of ITD is a critical site for K63 ubiquitination. Furthermore, the interaction with BRCC36 was decreased in ITD‐K609R cells compared to ITD cells, suggesting that the interaction with BRCC36 may partly depend on the duplicate sequence of ITD. We speculate that the duplicate sequence may alter the local spatial structure, resulting in increased ubiquitination at K609, and make it more accessible to BRCC36. The detailed mechanisms require further study.
It has been reported that K63‐linked polyubiquitination may lead to the degradation of a protein by a lysosomal pathway, not proteasomal degradation. 9 , 48 Our study suggests that ITD might undergo degradation via the lysosomal pathway rather than the proteasomal pathway, as evidenced by the stability of ITD in the early phase (16 h) not being affected by MG132 (Figure 2A). However, we cannot entirely exclude the possibility of ITD degradation via the proteasome system, as the K48‐linked chain modifies it. 44 On the other hand, the K63‐linked chain was also reported to have a protective effect for some proteins. For instance, K63‐ubiquitination promoted the stability and activation of Janus kinase 2 in the hematopoietic stem cells. 49 The regulation of protein stability through K63‐ubiquitination seems to depend on target proteins.
FLT3‐ITD mutations are correlated with specific cytogenetic subgroups. Among acute promyelocytic leukemia (APL) patients with PML‐RARα, it was reported that 30%–50% of patients had FLT3 mutations. 50 , 51 Frequent (~90%) co‐occurrence was reported in patients with t(6; 9) and FLT3‐ITD mutations. 50 , 52 Similarly, FLT3‐ITD mutations are also frequently found in patients with mixed lineage leukemia (MLL)‐partial tandem duplication (PTD). 53 The rate of MLL‐PTD in FLT3‐ITD‐positive patients was significantly higher than that in FLT3‐ITD‐negative patients. 53 Given that FLT3‐ITD mutations have unique distributions among AML subtypes, we analyzed the distribution of BRCC36 in these subtypes to identify potential overlaps.
FLT3 inhibitors are widely used for the treatment of AML and significantly improve the survival and prognosis of AML patients. 54 However, the efficacy of FLT3‐targeted TKIs has been compromised by the emergence of adaptive and acquired resistance through multiple distinct mechanisms. 55 These limitations warrant the development of novel, targeted agents. Given the fewer numbers and different catalytic mechanisms of DUBs, 56 we believe that they will become a new class of potential drug targets. In this study, we observed that thiolutin, an inhibitor of BRCC36, 37 reduced the level of p‐STAT5, impaired cell proliferation, and promoted apoptosis in ITD cells such as MV4‐11 cells. Furthermore, these effects of thiolutin exhibited mutual synergies with quizartinib, a TKI used for AML. Recent research has suggested that thiolutin holds promise for the clinical therapy of esophageal squamous cell carcinoma, 57 further indicating that BRCC36 could be a potential therapeutic target for treating AML with FLT3‐ITD.
AUTHOR CONTRIBUTIONS
Jianwei Liu: Conceptualization; data curation; formal analysis; investigation; validation; visualization; writing – original draft; writing – review and editing. Tomoya Isaji: Data curation; funding acquisition; investigation; methodology; validation; visualization. Sachiko Komatsu: Data curation; investigation; methodology; validation. Yuhan Sun: Data curation; investigation; methodology; validation. Xing Xu: Data curation; investigation; methodology; validation. Tomohiko Fukuda: Data curation; funding acquisition; investigation; methodology; validation. Tsutomu Fujimura: Data curation; investigation; methodology; validation. Shinichiro Takahashi: Conceptualization; funding acquisition; methodology; resources; supervision; writing – original draft; writing – review and editing. Jianguo Gu: Conceptualization; funding acquisition; methodology; project administration; resources; supervision; writing – original draft; writing – review and editing.
FUNDING INFORMATION
This work was partly supported by a Grant‐in‐Aid for Scientific Research (23H02440 to J.G., 22K06615 to T.I., 21K07346 to S.T., and 21K06547 to T.F.) and by a Grant‐in‐Aid for Challenging Exploratory Research (22K19443 to J.G.) from the Japan Society for the Promotion of Science. This work was also conducted under the Collaborative Open Research Program to promote the Human Glycome Atlas Project as strategic interdisciplinary research in the J‐GlycoNet cooperative network, which is accredited by the Minister of Education, Culture, Sports, Science and Technology, MEXT, Japan, as a Joint Usage/Research Center.
CONFLICT OF INTEREST STATEMENT
The authors declare no conflict of interest.
ETHICS STATEMENTS
Approval of the research protocol by an Institutional Reviewer Board: N/A.
Informed Consent: N/A.
Registry and the Registration No. of the study/trial: N/A.
Animal Studies: N/A.
Supporting information
Appendix S1.
Appendix S2.
Appendix S3.
Appendix S4.
Appendix S5.
ACKNOWLEDGEMENTS
None declared.
Liu J, Isaji T, Komatsu S, et al. BRCC36 associates with FLT3‐ITD to regulate its protein stability and intracellular signaling in acute myeloid leukemia. Cancer Sci. 2024;115:1196‐1208. doi: 10.1111/cas.16090
Contributor Information
Shinichiro Takahashi, Email: shintakahashi@tohoku-mpu.ac.jp.
Jianguo Gu, Email: jgu@tohoku-mpu.ac.jp.
REFERENCES
- 1. Lao L, Bourdeau I, Gagliardi L, et al. ARMC5 is part of an RPB1‐specific ubiquitin ligase implicated in adrenal hyperplasia. Nucleic Acids Res. 2022;50(11):6343‐6367. [DOI] [PMC free article] [PubMed] [Google Scholar]
- 2. Korac J, Schaeffer V, Kovacevic I, et al. Ubiquitin‐independent function of optineurin in autophagic clearance of protein aggregates. J Cell Sci. 2013;126(Pt 2):580‐592. [DOI] [PMC free article] [PubMed] [Google Scholar]
- 3. Clague MJ, Urbe S. Endocytosis: the DUB version. Trends Cell Biol. 2006;16(11):551‐559. [DOI] [PubMed] [Google Scholar]
- 4. Swatek KN, Komander D. Ubiquitin modifications. Cell Res. 2016;26(4):399‐422. [DOI] [PMC free article] [PubMed] [Google Scholar]
- 5. Zong Z, Zhang Z, Wu L, Zhang L, Zhou F. The functional deubiquitinating enzymes in control of innate antiviral immunity. Adv Sci (Weinh). 2021;8(2):2002484. [DOI] [PMC free article] [PubMed] [Google Scholar]
- 6. Yau R, Rape M. The increasing complexity of the ubiquitin code. Nat Cell Biol. 2016;18(6):579‐586. [DOI] [PubMed] [Google Scholar]
- 7. Ohtake F, Saeki Y, Ishido S, Kanno J, Tanaka K. The K48‐K63 branched ubiquitin chain regulates NF‐kappaB signaling. Mol Cell. 2016;64(2):251‐266. [DOI] [PubMed] [Google Scholar]
- 8. Li W, Ye Y. Polyubiquitin chains: functions, structures, and mechanisms. Cell Mol Life Sci. 2008;65(15):2397‐2406. [DOI] [PMC free article] [PubMed] [Google Scholar]
- 9. Duncan LM, Piper S, Dodd RB, et al. Lysine‐63‐linked ubiquitination is required for endolysosomal degradation of class I molecules. EMBO J. 2006;25(8):1635‐1645. [DOI] [PMC free article] [PubMed] [Google Scholar]
- 10. Zeqiraj E, Tian L, Piggott CA, et al. Higher‐order assembly of BRCC36‐KIAA0157 is required for DUB activity and biological function. Mol Cell. 2015;59(6):970‐983. [DOI] [PMC free article] [PubMed] [Google Scholar]
- 11. Rabl J, Bunker RD, Schenk AD, et al. Structural basis of BRCC36 function in DNA repair and immune regulation. Mol Cell. 2019;75(3):483‐497.e489. [DOI] [PMC free article] [PubMed] [Google Scholar]
- 12. Rabl J. BRCA1‐a and BRISC: multifunctional molecular Machines for Ubiquitin Signaling. Biomolecules. 2020;10(11):1503. [DOI] [PMC free article] [PubMed] [Google Scholar]
- 13. Maifrede S, Nieborowska‐Skorska M, Sullivan‐Reed K, et al. Tyrosine kinase inhibitor‐induced defects in DNA repair sensitize FLT3(ITD)‐positive leukemia cells to PARP1 inhibitors. Blood. 2018;132(1):67‐77. [DOI] [PMC free article] [PubMed] [Google Scholar]
- 14. Kazi JU, Ronnstrand L. FMS‐like tyrosine kinase 3/FLT3: from basic science to clinical implications. Physiol Rev. 2019;99(3):1433‐1466. [DOI] [PubMed] [Google Scholar]
- 15. Kikushige Y, Yoshimoto G, Miyamoto T, et al. Human Flt3 is expressed at the hematopoietic stem cell and the granulocyte/macrophage progenitor stages to maintain cell survival. J Immunol. 2008;180(11):7358‐7367. [DOI] [PubMed] [Google Scholar]
- 16. Kottaridis PD, Gale RE, Linch DC. Flt3 mutations and leukaemia. Br J Haematol. 2003;122(4):523‐538. [DOI] [PubMed] [Google Scholar]
- 17. Levis M, Brown P, Smith BD, et al. Plasma inhibitory activity (PIA): a pharmacodynamic assay reveals insights into the basis for cytotoxic response to FLT3 inhibitors. Blood. 2006;108(10):3477‐3483. [DOI] [PMC free article] [PubMed] [Google Scholar]
- 18. Janke H, Pastore F, Schumacher D, et al. Activating FLT3 mutants show distinct gain‐of‐function phenotypes in vitro and a characteristic signaling pathway profile associated with prognosis in acute myeloid leukemia. PloS One. 2014;9(3):e89560. [DOI] [PMC free article] [PubMed] [Google Scholar]
- 19. Kayser S, Schlenk RF, Londono MC, et al. Insertion of FLT3 internal tandem duplication in the tyrosine kinase domain‐1 is associated with resistance to chemotherapy and inferior outcome. Blood. 2009;114(12):2386‐2392. [DOI] [PubMed] [Google Scholar]
- 20. Gale RE, Green C, Allen C, et al. The impact of FLT3 internal tandem duplication mutant level, number, size, and interaction with NPM1 mutations in a large cohort of young adult patients with acute myeloid leukemia. Blood. 2008;111(5):2776‐2784. [DOI] [PubMed] [Google Scholar]
- 21. Burchert A. Maintenance therapy for FLT3‐ITD‐mutated acute myeloid leukemia. Haematologica. 2021;106(3):664‐670. [DOI] [PMC free article] [PubMed] [Google Scholar]
- 22. Leischner H, Albers C, Grundler R, et al. SRC is a signaling mediator in FLT3‐ITD‐ but not in FLT3‐TKD‐positive AML. Blood. 2012;119(17):4026‐4033. [DOI] [PubMed] [Google Scholar]
- 23. Rudorf A, Müller TA, Klingeberg C, et al. NPM1c alters FLT3‐D835Y localization and signaling in acute myeloid leukemia. Blood. 2019;134(4):383‐388. [DOI] [PMC free article] [PubMed] [Google Scholar]
- 24. Choudhary C, Schwable J, Brandts C, et al. AML‐associated Flt3 kinase domain mutations show signal transduction differences compared with Flt3 ITD mutations. Blood. 2005;106(1):265‐273. [DOI] [PubMed] [Google Scholar]
- 25. Grundler R, Miething C, Thiede C, Peschel C, Duyster J. FLT3‐ITD and tyrosine kinase domain mutants induce 2 distinct phenotypes in a murine bone marrow transplantation model. Blood. 2005;105(12):4792‐4799. [DOI] [PubMed] [Google Scholar]
- 26. Cho KF, Branon TC, Udeshi ND, Myers SA, Carr SA, Ting AY. Proximity labeling in mammalian cells with TurboID and split‐TurboID. Nat Protoc. 2020;15(12):3971‐3999. [DOI] [PubMed] [Google Scholar]
- 27. Schmidt‐Arras DE, Böhmer A, Markova B, Choudhary C, Serve H, Böhmer FD. Tyrosine phosphorylation regulates maturation of receptor tyrosine kinases. Mol Cell Biol. 2005;25(9):3690‐3703. [DOI] [PMC free article] [PubMed] [Google Scholar]
- 28. Choudhary C, Olsen JV, Brandts C, et al. Mislocalized activation of oncogenic RTKs switches downstream signaling outcomes. Mol Cell. 2009;36(2):326‐339. [DOI] [PubMed] [Google Scholar]
- 29. Kellner F, Keil A, Schindler K, et al. Wild‐type FLT3 and FLT3 ITD exhibit similar ligand‐induced internalization characteristics. J Cell Mol Med. 2020;24(8):4668‐4676. [DOI] [PMC free article] [PubMed] [Google Scholar]
- 30. Duan C, Fukuda T, Isaji T, et al. Deficiency of core fucosylation activates cellular signaling dependent on FLT3 expression in a Ba/F3 cell system. FASEB J. 2020;34(2):3239‐3252. [DOI] [PubMed] [Google Scholar]
- 31. Reiter K, Polzer H, Krupka C, et al. Tyrosine kinase inhibition increases the cell surface localization of FLT3‐ITD and enhances FLT3‐directed immunotherapy of acute myeloid leukemia. Leukemia. 2018;32(2):313‐322. [DOI] [PMC free article] [PubMed] [Google Scholar]
- 32. Alvarez C, Sztul ES. Brefeldin A (BFA) disrupts the organization of the microtubule and the actin cytoskeletons. Eur J Cell Biol. 1999;78(1):1‐14. [DOI] [PubMed] [Google Scholar]
- 33. Helenius A, Aebi M. Intracellular functions of N‐linked glycans. Science. 2001;291(5512):2364‐2369. [DOI] [PubMed] [Google Scholar]
- 34. Yang J, Isaji T, Zhang G, et al. EpCAM associates with integrin and regulates cell adhesion in cancer cells. Biochem Biophys Res Commun. 2020;522(4):903‐909. [DOI] [PubMed] [Google Scholar]
- 35. Cooper EM, Cutcliffe C, Kristiansen TZ, Pandey A, Pickart CM, Cohen RE. K63‐specific deubiquitination by two JAMM/MPN+ complexes: BRISC‐associated Brcc36 and proteasomal Poh1. EMBO J. 2009;28(6):621‐631. [DOI] [PMC free article] [PubMed] [Google Scholar]
- 36. Lim KL, Chew KC, Tan JM, et al. Parkin mediates nonclassical, proteasomal‐independent ubiquitination of synphilin‐1: implications for Lewy body formation. J Neurosci. 2005;25(8):2002‐2009. [DOI] [PMC free article] [PubMed] [Google Scholar]
- 37. Lauinger L, Li J, Shostak A, et al. Thiolutin is a zinc chelator that inhibits the Rpn11 and other JAMM metalloproteases. Nat Chem Biol. 2017;13(7):709‐714. [DOI] [PMC free article] [PubMed] [Google Scholar]
- 38. Kazi JU, Sun J, Phung B, Zadjali F, Flores‐Morales A, Rönnstrand L. Suppressor of cytokine signaling 6 (SOCS6) negatively regulates Flt3 signal transduction through direct binding to phosphorylated tyrosines 591 and 919 of Flt3. J Biol Chem. 2012;287(43):36509‐36517. [DOI] [PMC free article] [PubMed] [Google Scholar]
- 39. Zarrinkar PP, Gunawardane RN, Cramer MD, et al. AC220 is a uniquely potent and selective inhibitor of FLT3 for the treatment of acute myeloid leukemia (AML). Blood. 2009;114(14):2984‐2992. [DOI] [PMC free article] [PubMed] [Google Scholar]
- 40. Grafone T, Palmisano M, Nicci C, Storti S. An overview on the role of FLT3‐tyrosine kinase receptor in acute myeloid leukemia: biology and treatment. Oncol Rev. 2012;6(1):e8. [DOI] [PMC free article] [PubMed] [Google Scholar]
- 41. Schmidt‐Arras D, Böhmer SA, Koch S, et al. Anchoring of FLT3 in the endoplasmic reticulum alters signaling quality. Blood. 2009;113(15):3568‐3576. [DOI] [PubMed] [Google Scholar]
- 42. Kelly LM, Liu Q, Kutok JL, Williams IR, Boulton CL, Gilliland DG. FLT3 internal tandem duplication mutations associated with human acute myeloid leukemias induce myeloproliferative disease in a murine bone marrow transplant model. Blood. 2002;99(1):310‐318. [DOI] [PubMed] [Google Scholar]
- 43. Branon TC, Bosch JA, Sanchez AD, et al. Efficient proximity labeling in living cells and organisms with TurboID. Nat Biotechnol. 2018;36(9):880‐887. [DOI] [PMC free article] [PubMed] [Google Scholar]
- 44. Oshikawa G, Nagao T, Wu N, Kurosu T, Miura O. c‐Cbl and Cbl‐b ligases mediate 17‐allylaminodemethoxygeldanamycin‐induced degradation of autophosphorylated Flt3 kinase with internal tandem duplication through the ubiquitin proteasome pathway. J Biol Chem. 2011;286(35):30263‐30273. [DOI] [PMC free article] [PubMed] [Google Scholar]
- 45. Maspero E, Valentini E, Mari S, et al. Structure of a ubiquitin‐loaded HECT ligase reveals the molecular basis for catalytic priming. Nat Struct Mol Biol. 2013;20(6):696‐701. [DOI] [PubMed] [Google Scholar]
- 46. Akiyama H, Umezawa Y, Ishida S, Okada K, Nogami A, Miura O. Inhibition of USP9X induces apoptosis in FLT3‐ITD‐positive AML cells cooperatively by inhibiting the mutant kinase through aggresomal translocation and inducing oxidative stress. Cancer Lett. 2019;453:84‐94. [DOI] [PubMed] [Google Scholar]
- 47. Weisberg EL, Schauer NJ, Yang J, et al. Inhibition of USP10 induces degradation of oncogenic FLT3. Nat Chem Biol. 2017;13(12):1207‐1215. [DOI] [PMC free article] [PubMed] [Google Scholar]
- 48. Zhao L, Zhao J, Zhong K, Tong A, Jia D. Targeted protein degradation: mechanisms, strategies and application. Signal Transduct Target Ther. 2022;7(1):113. [DOI] [PMC free article] [PubMed] [Google Scholar]
- 49. Donaghy R, Han X, Rozenova K, et al. The BRISC deubiquitinating enzyme complex limits hematopoietic stem cell expansion by regulating JAK2 K63‐ubiquitination. Blood. 2019;133(14):1560‐1571. [DOI] [PMC free article] [PubMed] [Google Scholar]
- 50. Thiede C, Steudel C, Mohr B, et al. Analysis of FLT3‐activating mutations in 979 patients with acute myelogenous leukemia: association with FAB subtypes and identification of subgroups with poor prognosis. Blood. 2002;99(12):4326‐4335. [DOI] [PubMed] [Google Scholar]
- 51. Beitinjaneh A, Jang S, Roukoz H, Majhail NS. Prognostic significance of FLT3 internal tandem duplication and tyrosine kinase domain mutations in acute promyelocytic leukemia: a systematic review. Leuk Res. 2010;34(7):831‐836. [DOI] [PubMed] [Google Scholar]
- 52. Oyarzo MP, Lin P, Glassman A, Bueso‐Ramos CE, Luthra R, Medeiros LJ. Acute myeloid leukemia with t(6;9)(p23;q34) is associated with dysplasia and a high frequency of flt3 gene mutations. Am J Clin Pathol. 2004;122(3):348‐358. [DOI] [PubMed] [Google Scholar]
- 53. Steudel C, Wermke M, Schaich M, et al. Comparative analysis of MLL partial tandem duplication and FLT3 internal tandem duplication mutations in 956 adult patients with acute myeloid leukemia. Genes Chromosomes Cancer. 2003;37(3):237‐251. [DOI] [PubMed] [Google Scholar]
- 54. Jiang K, Li X, Wang C, et al. Dual inhibition of CHK1/FLT3 enhances cytotoxicity and overcomes adaptive and acquired resistance in FLT3‐ITD acute myeloid leukemia. Leukemia. 2022;37:539‐549. [DOI] [PubMed] [Google Scholar]
- 55. Williams AB, Li L, Nguyen B, Brown P, Levis M, Small D. Fluvastatin inhibits FLT3 glycosylation in human and murine cells and prolongs survival of mice with FLT3/ITD leukemia. Blood. 2012;120(15):3069‐3079. [DOI] [PMC free article] [PubMed] [Google Scholar]
- 56. Birol M, Echalier A. Structure and function of MPN (Mpr1/Pad1 N‐terminal) domain‐containing proteins. Curr Protein Pept Sci. 2014;15(5):504‐517. [DOI] [PubMed] [Google Scholar]
- 57. Jing C, Li X, Zhou M, et al. The PSMD14 inhibitor Thiolutin as a novel therapeutic approach for esophageal squamous cell carcinoma through facilitating SNAIL degradation. Theranostics. 2021;11(12):5847‐5862. [DOI] [PMC free article] [PubMed] [Google Scholar]
Associated Data
This section collects any data citations, data availability statements, or supplementary materials included in this article.
Supplementary Materials
Appendix S1.
Appendix S2.
Appendix S3.
Appendix S4.
Appendix S5.


