Abstract
One way to reduce the computational cost of electronic structure calculations is to use auxiliary basis expansions to approximate four-center integrals in terms of two- and three-center integrals, usually by using the variationally optimum Coulomb metric to determine the expansion coefficients. However, the long-range decay behavior of the auxiliary basis expansion coefficients has not been characterized. We find that this decay can be surprisingly slow. Numerical experiments on linear alkanes and a toy model both show that the decay can be as slow as 1/r in the distance between the auxiliary function and the fitted charge distribution. The Coulomb metric fitting equations also involve divergent matrix elements for extended systems treated with periodic boundary conditions. An attenuated Coulomb metric that is short-range can eliminate these oddities without substantially degrading calculated relative energies. The sparsity of the fit coefficients is assessed on simple hydrocarbon molecules and shows quite early onset of linear growth in the number of significant coefficients with system size using the attenuated Coulomb metric. Hence it is possible to design linear scaling auxiliary basis methods without additional approximations to treat large systems.
Keywords: linear scaling, resolution of the identity, density fitting
Electronic structure calculations are normally performed by using basis set expansions to allow approximations to the Schrödinger equation to be expressed as algebraic rather than differential equations. Molecular electronic structure calculations (1) of either the density functional theory or wave-function type typically use standardized atom-centered basis sets, {|μ〉}, whose functions are fixed linear combinations of Gaussian functions. With Gaussian basis functions, two-electron matrix elements,
 |
[1] |
can be efficiently evaluated (2), normally with g(r1, r2) = |r1 – r2|–1 for Coulomb interactions. There are formally O(N4) of these integrals for an atomic orbital basis set of size N. However, for a given choice of basis set, the number of nonnegligible integrals grows as only O(N2) with increases in the size of the molecule. This growth arises from the rapid (Gaussian) decay of the amplitude of the product charge distribution |μν〉 ≡ χμ(r1)χν(r1) with separation of the basis function centers. In density functional theory calculations, even this reduced bottleneck can be overcome for construction of the Coulomb matrix, Jμν = Σλσ〈μν|λσ〉Pλσ, from the density matrix by use of linear-scaling fast multipole (3–5) and tree code methods (6).
However, for a molecule of fixed size, increasing the number of basis functions per atom, n, does inexorably lead to O(n4) growth in the number of significant integrals. This growth follows directly from the fact that the number of nonnegligible product charge distributions, |μν〉, grows as O(n2). As a result, the use of large (high-quality) basis expansions is computationally costly. This article revisits perhaps the most practical way around this “basis set quality” bottleneck, which is to introduce an auxiliary basis, {|K〉}. The auxiliary basis will be used to approximate products of Gaussian basis functions:
 |
[2] |
Auxiliary basis expansions were introduced long ago (7–10), and after subsequent investigations (11–17), they have become widely recognized as an effective and powerful approach, which is sometimes synonymously called resolution of the identity or density fitting. In practice, the rate of growth of computational cost of large-scale electronic structure calculations with n is reduced to approximately n3. If n is fixed and molecule size increases, auxiliary basis expansions thus reduce the prefactor associated with the computation, while not altering the scaling. The important point is that the prefactor can be reduced by 5 or 10 times or more. Such large speedups are possible because the number of auxiliary functions required to obtain reasonable accuracy, X, has been shown to be only ≈3–4 times larger than N.
The auxiliary basis expansion coefficients, C, are determined by minimizing the deviation between the fitted distribution and the actual distribution,  , which leads to the following set of linear equations:
 |
[3] |
Evidently solution of the fit equations requires only two- and three-center integrals, and as a result the (four-center) two-electron integrals can be approximated as:
 |
[4] |
We have intentionally written the fitting problem, defined by Eq. 3 so that the two-electron operator, g, is not specified. Whereas the broadly accepted choice is the two-electron repulsion operator (18, 19), g(r1, r2) = |r1 – r2|–1, other choices of metric are also possible. For example, the overlap operator, g(r1, r2) = δ(r1 – r2), has been explored (8, 12, 16), and the use of an anti-Coulomb operator, g(r1, r2) = –|r1 – r2|, has also been advocated (20), because it is optimal for representing the potential caused by a charge distribution.
In the limit where the auxiliary basis is complete (i.e., all products of atomic orbitals are included), the fitting procedure described above will simply reproduce the exact charge distribution, regardless of what fitting metric (Coulomb, overlap, etc.) is chosen. However, the auxiliary basis is invariably incomplete (as mentioned above, X ≈ 3N), which is essential for obtaining increased computational efficiency. Thus in realistic applications, different choices for the fitting metric will lead to different fitting coefficients and therefore different results. Present-day auxiliary basis calculations are generally performed with the Coulomb operator (9) for the fit, which was shown to be superior to the overlap metric both in theory and practice (12, 16, 19, 21). Standardized auxiliary basis sets have been developed by the Ahlrichs group for Coulomb fitting (13, 14) in self-consistent field calculations, and for second-order perturbation (MP2) calculations (15, 17) of the correlation energy. With these basis sets, small absolute errors (e.g., <60 μ-Hartree per atom in MP2) and even smaller relative errors in computed energies are found, whereas the speed-up can be 3- to 30-fold. On this basis, auxiliary basis calculations are becoming increasingly widely used, particularly at the density functional theory and MP2 levels.
The purpose of this article is to revisit the question of whether or not the Coulomb metric is indeed the most appropriate choice for auxiliary basis set calculations. Although one might first imagine that this question is well settled given the standardization discussed above, it is not necessarily so. In particular, the decay behavior of the fit coefficients, C, has never been explored and addressed carefully to our knowledge. Yet this decay behavior is essential to characterize to design a fast (indeed linear scaling) solver for auxiliary basis calculations; to date it has been bypassed by defining (potentially discontinuous) local fitting domains (22, 23). In the next section, we uncover a peculiar long-range decay of the expansion coefficients obtained with the Coulomb metric, whose origin lies in the long-range nature of this operator. For a similar reason, we show that the fitting equations in the Coulomb metric have divergent matrix elements, for a system with periodic boundary conditions. As a remedy, we investigate the use of an attenuated Coulomb operator (24, 25), g(r1, r2) = erfc(ω|r1 – r2|)/|r1 – r2|, which permits the two- and three-center matrix elements to be efficiently evaluated with standard algorithms (26). We explore the locality of the fit coefficients and the chemical performance of this fit operator as a function of ω and assess the implications for linear scaling algorithms by using auxiliary basis expansions.
Long-Range Behavior of Fit Coefficients with the Coulomb and Overlap Metrics
In Eq. 2, the fit coefficient,  , gives the weight of the auxiliary basis function |K〉 in the auxiliary basis representation of the two-center product density |μν〉. The basis functions μ,ν are local atomic orbitals so their product is also a local function, although no longer atom-centered. Thus in an auxiliary basis expansion of |μν〉, only the |K〉s that are close in real space to the product density |μν〉 should yield nonnegligible
  . For example, suppose one wants to represent the product of carbon s functions centered on one end (C1) of a C40H82 alkane chain, denoted as |(ss)1〉, in terms of an atom-centered auxiliary basis expansion. One would expect that auxiliary functions centered on carbons far enough away from C1 would not contribute because they simply don't overlap. Generally,
  is expected to decay very fast as the distance between |μν〉 and |K〉 increases (perhaps at the rate of decay of the overlap matrix).
To assess the decay behavior of  in practice we begin by summarizing the results of some numerical experiments, performed on alkane chains, by using the pvdz atomic orbital basis set (27) and the corresponding auxiliary basis set (15). These calculations were performed by using a modified version of the q-chem program (28). We calculated
  by solving Eq. 3 in both the Coulomb metric and the overlap metric. Fig. 1 shows the decay behavior of
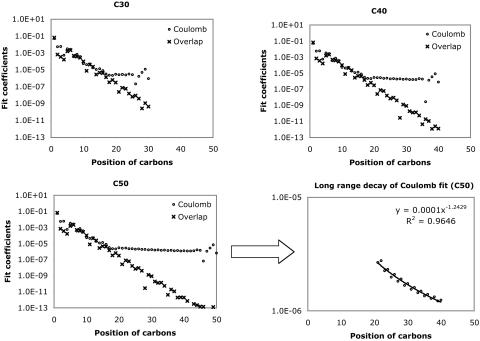
  as a function of the distance between a single |μν〉 product chosen as |(ss)1〉, and {|K〉}, where |K〉 are s functions on all carbon atoms. Although the fit coefficients at short range look similar (at least on the logarithmic scale of the plot) in the Coulomb and overlap metrics, a striking contrast is evident in the long-range decay behavior of the fit coefficients.
Fig. 1.
Decay behavior of the fit coefficients ( ) for C30H62 ∼ C50H102, with the Coulomb and overlap metric, where μ = ν = s function centered on the first carbon (C1) atom, and K = s function centered on the varying carbon atoms. Absolute values of the fit coefficients are plotted as a function of the distance between μν and K on a logarithmic scale. The long-range behavior with the Coulomb metric for C50H102 is magnified in the bottom right panel.
In both metrics, there is rapid initial decay of the fit coefficients, , with separation between the distribution center and the expansion center. However, in the Coulomb metric, this initial rapid decay stops around C20, after which it decays very slowly (indeed as ∼r–1.25) showing some edge effects around the end of the chain. By contrast, decay in the overlap matrix continues to be faster than algebraic throughout the length of the chain, consistent with our expectations. The long-range algebraic decay of the Coulomb metric fit coefficients is remarkable, because we expect that auxiliary functions, |K〉, which do not overlap with the target density, |μν〉, should not contribute to the expansion. Because the Coulomb operator is known to yield more reliable auxiliary basis expansions (12, 16), it is important to delve more deeply into the origin of this peculiar behavior.
In fact, considerable insight can be obtained by considering a toy system. We try to fit a target s-type Gaussian function, sT, with unit monopole (in atomic units), using two identical s-type auxiliary Gaussian functions, also with unit monopoles, but whose exponents differ from sT. One of these functions, s1, is centered at the same point as sT, whereas the other, s2, is a distance r away (far enough so that the s-type functions interact as classical monopoles). The fitting equations (in the Coulomb metric) for the coefficients of the functions s1 and s2 are:
 |
[5] |
With our normalization convention (yielding unit monopoles), relevant matrix elements are i ≡〈s1|s1〉=〈s2|s2〉, j ≡〈s1|sT〉 ≠ i, and 〈sT|s2〉=〈s1|s2〉= r–1. Solving this simple linear system for c1 and c2 leads to c1 = (ijr2 – 1)/i2r2 – 1) and c2 = r(i – j)/(i2r2 – 1).
We are interested in the limit of large r, for which the coefficient of the on-site auxiliary function, c1, approaches j/i, whereas the coefficient, c2, of the far away s function, behaves as (i – j)/(i2r) as r increases. This c2 value closely resembles the peculiar behavior seen in the fit coefficients from the numerical experiments reported in Fig. 1. The toy model enables us to understand the origin of the effect. The on-site coefficient, c1, is tending toward the value (j/i) obtained for the case of a single fitting function, which is not the value needed to fit the unit charge at this site. The second coefficient, c2, partially compensates for the missing (or excess) charge, such that an improved description of the electric field is obtained. By contrast, in the overlap metric, c2 simply tends to zero, and no improvement is obtained relative to using just a single fitting function. In this view, the peculiar long-range behavior in the Coulomb metric is providing a limited improvement over the result obtained without any second auxiliary basis function. However, the improvement is intrinsically limited because of the limited flexibility of the auxiliary basis: it is using a nonlocal correction to compensate for local deficiencies of the auxiliary basis.
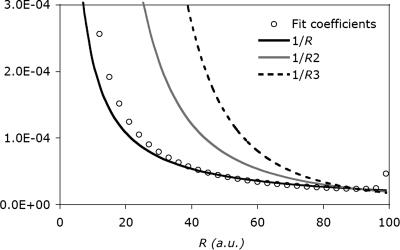
Extending this two-site auxiliary basis to a (finite) 1D lattice of 100 equally spaced s-type Gaussian functions, with the target at one end, and exponents large enough so as to interact classically, gives the same 1/r decay in the fit coefficients (Fig. 2). Also plotted are the functions 1/r, 1/r2, and 1/r3, scaled so that they match at r = 90 a.u. The tail clearly follows the 1/r curve, consistent with the two-function fit above. In fact, the long-range behavior of this curve is nearly the same as that of the real fit coefficients shown in Fig. 1. Interestingly, they even share similar edge effects. By contrast, fitting in the overlap metric yields zero values for all fitting coefficients except the first (on-site) auxiliary basis function.
Fig. 2.
Decay behavior of the fit coefficients for a toy system, which consists of 100 equally spaced s-type auxiliary functions to fit a single s-type target function at the origin. The long-range decay of the fit coefficients appears to be 1/r with some edge effects at the end.
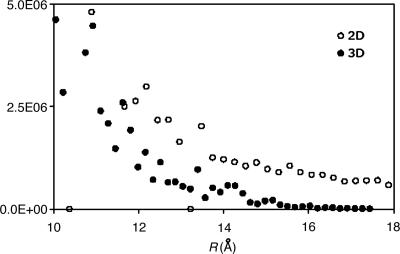
As the nonlocality of the Coulomb metric fit coefficients is compensating for local deficiencies of the auxiliary basis, the magnitude of this effect could vary strongly with local chemical environment. 2D and 3D systems might exhibit less nonlocality because of the larger numbers of near neighbors (and thus auxiliary basis expansion centers) close to a given product distribution. To examine this question, we extended the 1D example considered above to two and three dimensions by considering both graphite and diamond analogs, with the sites slightly perturbed. We placed a target s function (from the vdz basis) at the center of the system and fit the function by using the corresponding Coulomb fitting basis, giving expansion coefficients whose magnitudes are plotted in Fig. 3. The decay behavior is markedly faster than that of the linear system, with the 3D case exhibiting by far the most rapid decay. This apparent dimensionality dependence in fact was initially deduced from analysis of 1D, 2D, and 3D models by one of us (P.M.W.G.).
Fig. 3.
Decay behavior of the fit coefficients of model 2D and 3D systems. The 2D system is based on a graphite structure, with each site slightly perturbed. The 3D system is based on a diamond structure, slightly perturbed. For each case the target function is the thrice-contracted s function of the vdz basis. The auxiliary basis set is the corresponding basis set for J-matrix fitting. The 2D fit coefficients decay more rapidly than for the linear case, and the 3D coefficients decay far more rapidly still, suggesting strong dimensional dependence.
One might imagine that the use of a long-range metric could be most problematical in treating a perfectly periodic (i.e., crystalline) system with periodic boundary conditions. Let us consider how the Coulomb fitting approach would apply to modeling the charge density, ρ(r), in a periodic system. The charge density, in terms of atomic orbitals, will be:
 |
[6] |
where  is atomic orbital |μ〉 centered in the unit cell described by lattice vector m, and
  is the density matrix element for pair μν with cell separation n – m. The auxiliary basis functions will also be periodically replicated, with (by definition) the same fit coefficients in each unit cell, so that the auxiliary basis expansion becomes:
 |
[7] |
The problem of minimizing the total residual self-interaction  can be slightly simplified by translational invariance to equivalently minimize:
 |
[8] |
Requiring that the derivative of the residual with respect to a fitting coefficient, PK, is zero gives us the fitting equations:
 |
[9] |
The coefficient matrix to be inverted for the fitting coefficients is thus:
 |
[10] |
However, in the Coulomb metric, when both  and
and  have nonzero monopole (such as for s functions), this matrix element diverges. This divergence does not occur when performing an equivalent calculation without periodic boundary conditions, because during the fitting procedure the auxiliary functions do not interact in a collective manner; the auxiliary functions in each cell have their own fitting coefficients. Nor (obviously) does it occur when the metric is short-ranged, such as for overlap.
Bridging Coulomb and Overlap Metrics with an Attenuated Coulomb Operator
The above results show that Coulomb fitting has some undesirable features. The very slow long-range decay of the Coulomb metric fit coefficients prevents them from becoming negligible as fast as is the case with a strictly local metric such as the overlap operator. The Coulomb metric fit equations for a system with periodic boundary conditions involve matrix elements whose magnitudes are divergent. What might be desirable is an operator that behaves like the Coulomb operator on short-length scales, but then damps rapidly to zero on longer-length scales.
There are operators with this property, such as g(r1, r2) = erfc(ω|r1 – r2|)/|r1 – r2|. This attenuated Coulomb operator (24, 25) is short-range, and the extent of locality can be altered by adjusting ω. At ω = 0, the long-range Coulomb operator is recovered, but as ω increases the operator becomes more local, until finally as ω → ∞, the metric approaches a δ function and we recover the overlap metric. Thus we expect to recover the strengths and weaknesses of the Coulomb operator as ω → 0, and the strengths and weaknesses of the overlap operator as ω → ∞, and we wonder whether there is an intermediate region that combines the good chemistry of the Coulomb operator with the well behaved asymptotic decay of the overlap operator.
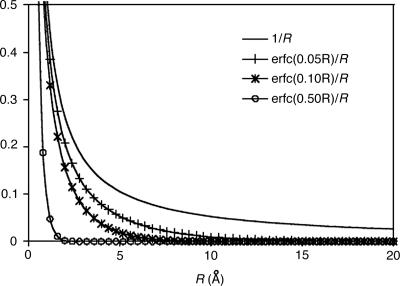
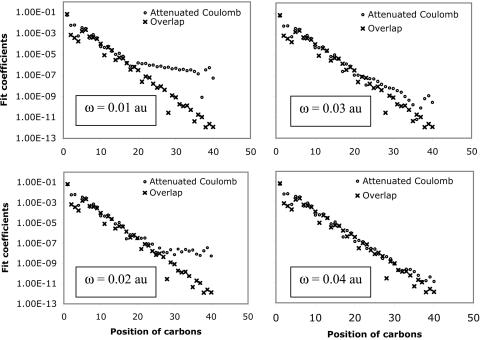
First, to show how attenuation depends on ω, we plot the attenuated Coulomb operator in Fig. 4 for several possible values of ω. Values of ω between 0.05 and 0.5 a.u. correspond to strong attenuation on scales between 20 and 2 Å, respectively. This range is appropriate for revisiting the alkane chains we had previously used in Fig. 1. In Fig. 5, decay properties of the fit coefficients using the attenuated Coulomb operator for C40H82 is shown for several values of ω. Fig. 5 demonstrates that, as expected, with larger values of ω (i.e., with the metric becoming more local), the fit coefficients exhibit rapid long-range decay similar to the overlap metric. With ω = 0.03, the fit coefficients already start showing overlap-like asymptotic behavior. These results indicate that the long-range tail of the Coulomb fit coefficients shown in Fig. 1 can be removed by using the attenuated Coulomb operator as the fitting metric.
Fig. 4.
Extent of nonlocality of the Coulomb metric, 1/r and the attenuated Coulomb metric, erfc(ωr)/r, with ω = 0.05, 0.1, and 0.5 a.u.
Fig. 5.
Effect of Coulomb attenuation on the decay of the fit coefficients ( ) for C40H82, using the erfc(ωr)/r metric, with ω = 0.01, 0.02, 0.03, and 0.04 a.u., where μ = ν = s function centered on the first carbon (C1) atom, and K = s function centered on the varying carbon atom.
How strong can the attenuation be without degrading the quality of relative energies computed by using the auxiliary basis? For computational efficiency, one would like ω as large as possible to obtain the most rapid decay of the fit coefficients, and thus the greatest reward from the use of sparse matrix methods. But the larger ω is the less the fit problem looks like the original Coulomb one, and therefore in all likelihood the less accurate the results will be. We address this question for the problem of calculating the MP2 energy by using auxiliary basis expansions (15). We have computed atomization energies for the G2 test set (29, 30) of 148 neutral molecules by using various ω values at the rimp2 level, as well as by the MP2 method without making any auxiliary basis approximation. The atomic orbital basis is again pvdz. This test set contains relatively small molecules, of size up to ≈15 atoms (seven nonhydrogen atoms). A statistical summary of the deviations between the rimp2 calculations and full MP2 calculations is given in Table 1.
Table 1.
Statistics on the atomization energies of 148 neutral molecules from the G2 test set computed at the rimp2/pvdz level
| erfc(ωr)/r
|
||||||||||||||||
|---|---|---|---|---|---|---|---|---|---|---|---|---|---|---|---|---|
| Error | rimp2 | 0.01 | 0.1 | 0.2 | 0.3 | 0.4 | 0.5 | 0.6 | 0.7 | 0.8 | 0.9 | 1 | 10 | 100 | 1,000 | Overlap |
| MAE | 0.08 | 0.08 | 0.08 | 0.08 | 0.11 | 0.14 | 0.17 | 0.19 | 0.21 | 0.23 | 0.25 | 0.27 | 0.52 | 0.52 | 0.52 | 0.52 |
| MAXE | 0.27 | 0.27 | 0.28 | 0.39 | 0.53 | 0.62 | 0.68 | 0.73 | 0.79 | 0.86 | 0.93 | 1.01 | 2.26 | 2.24 | 2.24 | 2.24 |
| RMS | 0.10 | 0.10 | 0.09 | 0.11 | 0.16 | 0.19 | 0.22 | 0.25 | 0.28 | 0.30 | 0.33 | 0.35 | 0.68 | 0.68 | 0.68 | 0.68 |
For rimp2, the Coulomb metric was used, and all other data were obtained by using the attenuated Coulomb metric, erfc(ωr)/r, at varying ω values. Energies are in kcal/mol. MAE, mean absolute error; MAXE, maximum absolute error; RMS, root mean square error.
Examining the mean absolute, maximum absolute, and rms errors from Table 1 shows the effect of attenuation on the accuracy of atomization energies. The auxiliary basis error introduced by the overlap metric is about six or seven times larger than with Coulomb fitting. As is evident from the plots in Figs. 4 and 5, even small values of ω will alter the operator on the length scale of the molecules in the G2 set. It is thus encouraging that there is no degradation of the results for attenuations of 0.1 a.u. Choosing a value of 0.2 or 0.3 a.u. affords stronger attenuation (and earlier onset of sparsity) with very little degradation of the results. We conclude that the standardized auxiliary basis sets used for these tests are sufficiently flexible to permit replacement of the Coulomb operator by the Coulomb attenuated version with little or no change in accuracy when using the ω values above.
Sparsity in Matrix Elements and Fit Coefficients
The stage is now set for exploring the extent of inherent sparsity in these coefficients, as a function of the fitting metric. With the success of linear scaling methods (4, 6, 31, 32) and local correlation models (33–35) for reducing the scaling with molecular size, it is desirable to combine them with the reduced prefactors offered by the auxiliary basis approach to produce still more efficient algorithms (22, 23). The locality of the coefficients determines the extent to which low-scaling methods involving auxiliary basis expansions are possible without further approximations, such as fitting domains (22, 23).
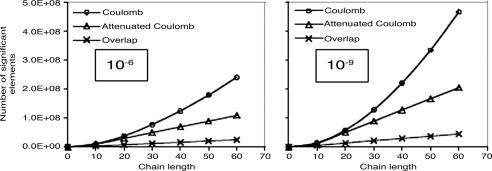
We again look at alkanes, because they exhibit relatively strong nonlocality of the Coulomb metric auxiliary basis expansion coefficients. We examine two different drop tolerances, 10–6 and 10–9, as representative of lower and higher precision calculations. The fit coefficients are defined by Eq. 3, in terms of three- and two-center integrals. In Fig. 6 the growth in the number of significant three-center integrals as a function of molecular size is plotted for alkane chains. Clear differences between the long-range Coulomb operator, the attenuated Coulomb operator, and the still more short-range overlap operator are evident. Linear scaling sets in for the overlap operator beyond the range of the basis function with largest extent, which corresponds typically to 5–10 Å. Linear scaling sets in slightly later for the attenuated Coulomb operator, because, as shown in Fig. 4, for ω = 0.1 this operator itself extends over about a 5- to 10-Å range. Either of these fit metrics allows the possibility of solving for the expansion coefficients in linear effort, for large enough systems. By contrast, obtaining linear scaling will be nontrivial in the Coulomb metric because we will start from a quadratic number of integrals.
Fig. 6.
The growth with chain length (for all-trans alkanes) in the number of significant three-center integrals, 〈K|μν〉g, for three different metrics. We used ω = 0.1 a.u for the attenuated Coulomb metric. The calculations used the pvdz basis and its corresponding auxiliary basis. Significant integrals are those whose magnitude exceeds a drop tolerance. Results are plotted for two different drop tolerances: 10–6 (Left) and 10–9 (Right). Quadratic growth is evident in the Coulomb metric, whereas the other metrics show onset of linear growth.
In typical computer implementations of auxiliary basis electronic structure calculations, the fit coefficients used are not those of Eq. 3, but instead it is more convenient to define:
 |
[11] |
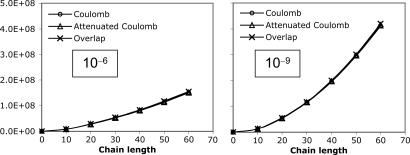
The elements of the V matrix are the two-center Coulomb integrals, VLK ≡ 〈L|K〉. From the B matrices, two-electron integrals can be directly approximated via a single matrix multiply,  , as compared with the two required in Eq. 4. The locality and sparsity associated with B are summarized in Fig. 7 for the two different target precisions. The behavior of B with all three fitting metrics is quite similar for a given precision. The number of significant elements of B grows subquadratically with alkane chain length for the lower precision. By contrast, at the higher precision, the growth appears nearly quadratic, which is a direct consequence of multiplying in the square root of the matrix of long-range two-center integrals in Eq. 11. Thus the B matrices appear intrinsically long-range and poorly suited for development of linear-scaling methods.
Fig. 7.
Scaling behavior of the coefficients  (defined in Eq. 11) for three metrics and two drop tolerances, 10–6 (Left) and 10–9 (Right). See the Fig. 6 legend and the text for additional details. No significant difference in the growth behavior of the significant
  between the different metrics is evident. Quadratic growth in the number of significant coefficients is evident with the 10–9 tolerance.
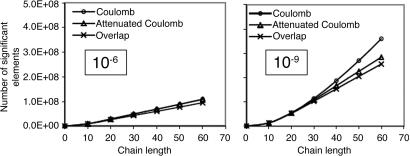
On the other hand, the auxiliary basis expansion coefficients, C, (defined in Eq. 3) are dimensionless and potentially short-range. The growth in the number of significant elements of C for alkane chains is summarized in Fig. 8. From previous results, one expects a qualitative difference between the sparsity of the C coefficients in the Coulomb metric relative to the other metrics. In the higher precision results of Fig. 8, the long-range decay of C in the Coulomb metric leads to nonlinear growth in the number of significant elements. By contrast, the growth in the number of significant elements of C is turning linear with system size for the attenuated Coulomb metric and the overlap metric. The length scale on which the growth has turned linear is approximately between 10 and 15 atoms in a line (i.e., on the order of 15–22 Å). With Fig. 5, the implication is that sparsity-based linear scaling algorithms to obtain the expansion coefficients C will be feasible when a short-range fit operator is used.
Fig. 8.
Growth in the number of significant auxiliary basis expansion coefficients  , as defined by Eq. 3, for three metrics and two drop tolerances, 10–6 (Left) and 10–9 (Right). See the Fig. 6 legend and the text for additional details. At 10–9, growth in the number of significant
  is nearly quadratic in the Coulomb metric, but linear for long chains in the other two metrics.
The results from Fig. 8 with the less-demanding drop tolerance present an interesting contrast to the higher-precision ones. With the lower tolerance, differences in the sparsity of C with the three different metrics diminish markedly. The scaling of the number of significant elements in the Coulomb metric with problem size is not significantly different from the other two metrics. The magnitude of the long-range Coulomb metric C coefficients that are decaying as algebraic powers of r therefore must be mostly smaller than 10–6 (although mostly >10–9). This range is a characteristic of the auxiliary basis expansions used here; a larger auxiliary basis must result in a slowly decaying tail with even smaller magnitudes, whereas a smaller auxiliary basis would exhibit larger long-range effects. At this lower level of accuracy, it is possible to exploit sparsity in the C coefficients even in the Coulomb metric. Furthermore, it is worth recalling the inference from Fig. 3 that 1D systems such as the alkanes should exhibit greater nonlocality in the Coulomb metric than 2D and 3D systems.
Finally, it is worth contrasting the present results to locality and sparsity of the molecular orbitals (36). Localized orbitals have tails with decay lengths related to the inverse square root of the highest occupied molecular orbital–lowest unoccupied molecular orbital gap (37), so that the better the insulator, the more effective localization will be. For a good insulator like an alkane, localized orbitals are effectively zero on about the same length scale we discussed above, whereas smaller gap materials exhibit tails that are significant at longer ranges. However, all of the quantities that we have discussed for auxiliary basis expansions depend only on the atomic orbital basis and auxiliary basis functions alone. Thus our present conclusions are independent of the electronic structure of the material, except indirectly through its dimensionality.
Conclusions
This article reports properties of auxiliary basis expansions that are relevant for electronic structure calculations on large molecules. The decay behavior of these expansion coefficients in alkane chains is strikingly different when using the overlap and Coulomb metrics for fitting. Expansion coefficients in the Coulomb metric exhibit far slower decay with distance between auxiliary function center and the center of the fitted distribution, with the most extreme case approaching r–1. Nonetheless the chemistry associated with Coulomb auxiliary expansions is generally much better than that associated with overlap-derived auxiliary expansions. Seeking to combine the best of both expansions, we examined an attenuated Coulomb operator as the fit metric and showed that for MP2 it retains the good chemistry of the Coulomb metric and the strong spatial localization of the overlap metric.
The attenuated Coulomb operator offers a route for extending the auxiliary basis expansion approach to larger-scale calculations. Numerical experiments revealed that in the attenuated Coulomb metric the number of fit coefficients is strictly linear for a sufficiently large system. Because they derive from a linear number of three-center integrals, linear scaling evaluation is possible just by exploitation of sparsity, together with established fast methods such as Cholesky decomposition to treat the two-center matrix inversion problem. The relevant length scale is ≈10–20 Å. Use of the sparsity of the auxiliary basis expansion coefficients permits reduced scaling evaluation of interesting target quantities both in density functional theory and wavefunction-based approaches such as MP2 theory. This sparsity will be important in the quest to extend the realm of applicability of molecular electronic structure methods toward nanomaterials.
Acknowledgments
This work was supported by a Department of Energy grant from the Computational Nanotechnology Program and subcontracts from Small Business Innovation Research grants from the National Institutes of Health (to Q-Chem, Inc.).
Author contributions: M.H.-G. designed research; Y.J. and A.S. performed research; P.M.W.G. contributed new reagents/analytic tools; Y.J. and A.S. analyzed data; and Y.J., A.S., and M.H.-G. wrote the paper.
This paper was submitted directly (Track II) to the PNAS office.
References
- 1.Helgaker, T., Jorgensen, P. & Olsen, J. (2000) Molecular Electronic Structure Theory (Wiley, Chichester, U.K.).
- 2.Gill, P. M. W. (1994) Adv. Quantum Chem. 25, 141–205. [Google Scholar]
- 3.White, C. A., Johnson, B. G., Gill, P. M. W. & Head-Gordon, M. (1994) Chem. Phys. Lett. 230, 8–16. [Google Scholar]
- 4.White, C. A., Johnson, B. G., Gill, P. M. W. & Head-Gordon, M. (1996) Chem. Phys. Lett. 253, 268–278. [Google Scholar]
- 5.Strain, M. C., Scuseria, G. E. & Frisch, M. J. (1996) Science 271, 51–53. [Google Scholar]
- 6.Challacombe, M. & Schwegler, E. (1997) J. Chem. Phys. 106, 5526–5536. [Google Scholar]
- 7.Whitten, J. (1973) J. Chem. Phys. 58, 4496–4501. [Google Scholar]
- 8.Baerends, E. J., Ellis, D. E. & Ros, P. (1973) Chem. Phys. 2, 41–51. [Google Scholar]
- 9.Dunlap, B., Connolly, J. & Sabin, J. (1979) J. Chem. Phys. 71, 3396–3402. [Google Scholar]
- 10.Dunlap, B. (1983) J. Chem. Phys. 78, 3140–3142. [Google Scholar]
- 11.Feyereisen, M., Fitzgerald, G. & Komornicki, A. (1993) Chem. Phys. Lett. 208, 359–363. [Google Scholar]
- 12.Vahtras, O., Almlof, J. & Feyereisen, M. W. (1993) Chem. Phys. Lett. 213, 514–518. [Google Scholar]
- 13.Eichkorn, K., Treutler, O., Ohm, H., Haser, M. & Ahlrichs, R. (1995) Chem. Phys. Lett. 240, 283–289. [Google Scholar]
- 14.Eichkorn, K., Weigend, F., Treutler, O. & Ahlrichs, R. (1997) Theor. Chem. Acc. 97, 119–124. [Google Scholar]
- 15.Weigend, F., Haser, M., Patzelt, H. & Ahlrichs, R. (1998) Chem. Phys. Lett. 294, 143–152. [Google Scholar]
- 16.Skylaris, C. K., Gagliardi, L., Handy, N. C., Ioannou, A. G., Spencer, S. & Willetts, A. (2000) J. Mol. Struct. Theochem. 501, 229–239. [Google Scholar]
- 17.Weigend, F., Kohn, A. & Hattig, C. (2002) J. Chem. Phys. 116, 3175–3183. [Google Scholar]
- 18.Dunlap, B. (2000) J. Mol. Struct. Theochem. 529, 37–40. [Google Scholar]
- 19.Mintmire, J. & Dunlap, B. (1982) Phys. Rev. A 25, 88–95. [Google Scholar]
- 20.Gill, P. M. W., Johnson, B. G., Pople, J. A. & Taylor, S. W. (1992) J. Chem. Phys. 96, 7178–7179. [Google Scholar]
- 21.Dunlap, B. (2000) Phys. Chem. Chem. Phys. 2, 2113–2116. [Google Scholar]
- 22.Werner, H. J., Manby, F. R. & Knowles, P. J. (2003) J. Chem. Phys. 118, 8149–8160. [Google Scholar]
- 23.Schutz, M. & Manby, F. R. (2003) Phys. Chem. Chem. Phys. 5, 3349–3358. [Google Scholar]
- 24.Adamson, R. D., Dombroski, J. P. & Gill, P. M. W. (1996) Chem. Phys. Lett. 254, 329–336. [Google Scholar]
- 25.Gill, P. M. W. & Adamson, R. D. (1996) Chem. Phys. Lett. 261, 105–110. [Google Scholar]
- 26.Adamson, R. D., Dombroski, J. P. & Gill, P. M. W. (1999) J. Comput. Chem. 20, 921–927. [Google Scholar]
- 27.Schafer, A., Horn, H. & Ahlrichs, R. (1992) J. Chem. Phys. 97, 2571–2577. [Google Scholar]
- 28.Kong, J., White, C. A., Krylov, A. I., Sherrill, D., Adamson, R. D., Furlani, T. R., Lee, M. S., Lee, A. M., Gwaltney, S. R., Adams, T. R., et al. (2000) J. Comput. Chem. 21, 1532–1548. [Google Scholar]
- 29.Curtiss, L. A., Raghavachari, K., Trucks, G. W. & Pople, J. A. (1991) J. Chem. Phys. 94, 7221–7230. [Google Scholar]
- 30.Curtiss, L. A., Raghavachari, K., Redfern, P. C. & Pople, J. A. (1997) J. Chem. Phys. 106, 1063–1079. [Google Scholar]
- 31.Scuseria, G. E. (1999) J. Phys. Chem. A 103, 4782–4790. [Google Scholar]
- 32.Shao, Y. H., White, C. A. & Head-Gordon, M. (2001) J. Chem. Phys. 114, 6572–6577. [Google Scholar]
- 33.Saebo, S. & Pulay, P. (1993) Annu. Rev. Phys. Chem. 44, 213–236. [Google Scholar]
- 34.Schutz, M., Hetzer, G. & Werner, H. J. (1999) J. Chem. Phys. 111, 5691–5705. [Google Scholar]
- 35.Lee, M. S., Maslen, P. E. & Head-Gordon, M. (2000) J. Chem. Phys. 112, 3592–3601. [Google Scholar]
- 36.Maslen, P. E., Ochsenfeld, C., White, C. A., Lee, M. S. & Head-Gordon, M. (1998) J. Phys. Chem. A 102, 2215–2222. [Google Scholar]
- 37.Baer, R. & Head-Gordon, M. (1997) Phys. Rev. Lett. 79, 3962–3965. [Google Scholar]


