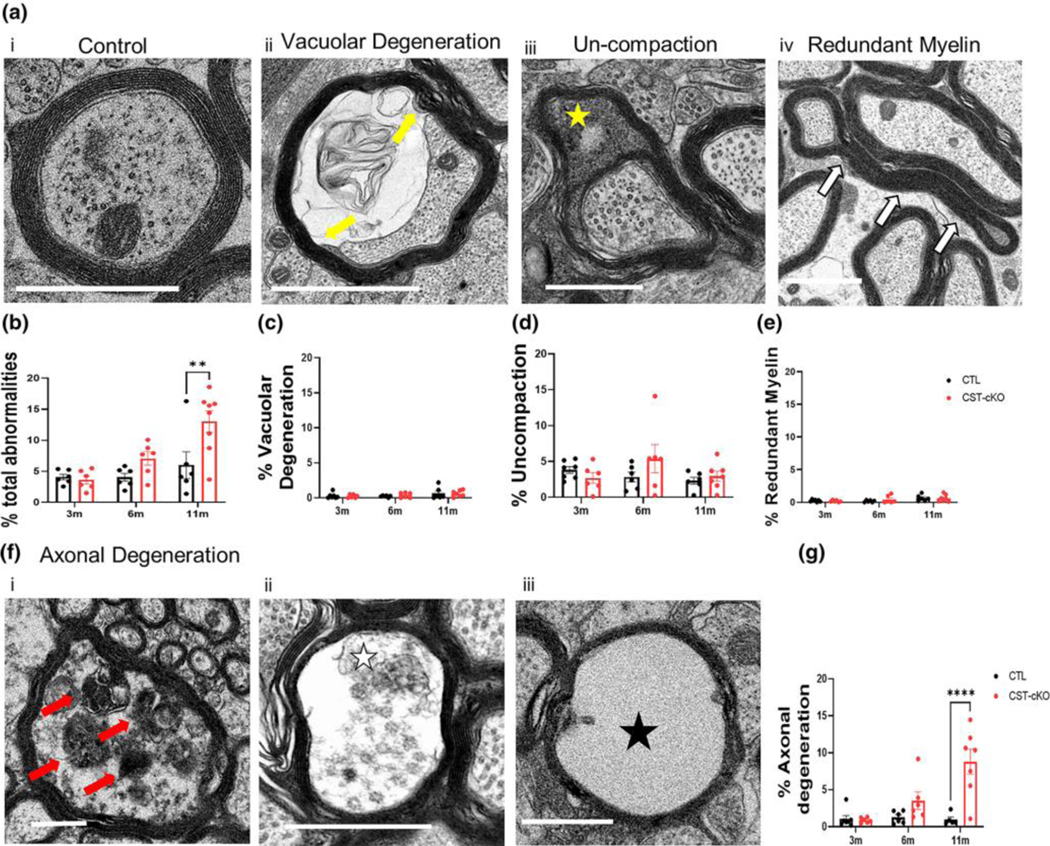
FIGURE 3. Quantification of myelin and axonal pathologies in the corpus callosum of CST-cKO mice.
(a) Representative image of a healthy axon with an intact, compacted myelin sheath and appropriate array of neurofilament and microtubules (ai). Representative images of various myelin and axonal abnormalities observed in the CST-cKO mouse included (from left to right): axon losing attachment to the myelin sheath (aii vacuolar degeneration; yellow arrows); presence of cytoplasm between compacted wraps of myelin (aiii; un-compaction; yellow star); compact myelin out folding (aiv; redundant myelin; white arrows) and a variety of axonal degenerating profiles (f) including (fi) organelle collapse; red arrow, (fii) presence organelle and cytoskeletal debris from the axon; white star, and (fiii) complete loss of axon exhibited by an empty myelin shell; black star. (b) Quantitative analysis combining all myelin and axonal pathologies revealed a significant increase in myelin/axonal pathologies at 11 m PI but not at 3- and 6- months PI. Separating out the individual pathologies revealed (c-e) no significant difference in myelin ultrastructure between genotypes at any of the timepoints analyzed; however, (g) axonal degeneration was significantly increased in the 11 m CST-cKO mice. All data were statistically compared using a 2-way ANOVA; ** p < .005 ****p < .0001. Scale bar = 1 μm.

