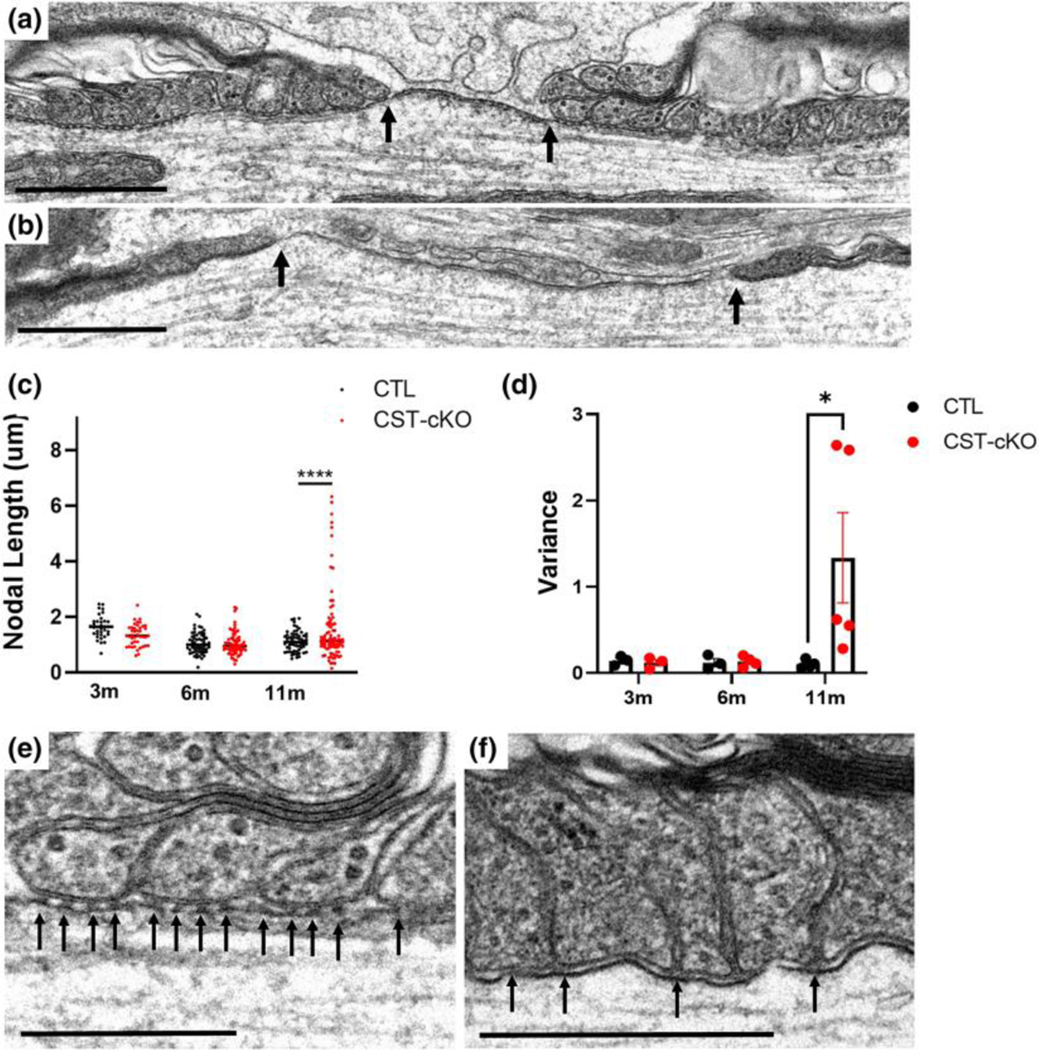
FIGURE 5. Increase in nodal length variability and loss of transverse bands following adult onset sulfatide depletion.
(a) Normal ultrastructure of a node of Ranvier (bound indicated by black arrows) including nodal length (~1 micron) and flanking paranodal regions with lateral loops closely opposed to the axolemma. (b) CST-cKO mice revealed nodes of Ranvier with varying lengths including abnormally long nodal gaps (nodal bounds indicated by arrows). (c) Overall, node quantitation revealed no significant change in average nodal length between genotypes at any of the time points analyzed; however, a significant difference was observed in length variability in the 11-months post tamoxifen injected CST-cKO mice with nodes of Ranvier presenting both shorter and longer than 1 micron. (d) Calculating the nodal length variance per mouse further confirmed this variability at 11-months PI with a significant increase in length variance with no difference in variance at the earlier PI time points. All data were statistically compared using a 2-way ANOVA. (e) CTL mice revealed equally spaced electron densities, known as transverse bands (arrows), at the interface between the lateral loops of the myelin sheath and the axolemma. (f) In contrast, transverse bands were unevenly spaced and structurally disrupted (arrows) in the CST-cKO. For analysis, the fit of the two models (single variance/covariance matrix or group specific variance/covariance matrices) was compared using a likelihood ratio test. a-b Scale bars = 1 μm. *p < .05 ****p < .0001. E-F Scale bars = 0.5 μm.

