

Abstract
Coronary heart disease remains a major global health challenge, with a clear need for enhanced early risk assessment. This study aimed to elucidate metabolic signatures across various stages of coronary heart disease and develop an effective multiclass diagnostic model. Using metabolomic approaches, gas chromatography–mass and liquid chromatography–tandem mass spectrometry were used to analyze plasma samples from healthy controls, patients with stable angina pectoris, and those with acute myocardial infarction. Pathway enrichment analysis was conducted on metabolites exhibiting significant differences. The key metabolites were identified using Random Forest and Recursive Feature Elimination strategies to construct a multiclass diagnostic model. The performance of the model was validated through 10-fold cross-validation and evaluated using confusion matrices, receiver operating characteristic curves, and calibration curves. Metabolomics was used to identify 1491 metabolites, with 216, 567, and 295 distinctly present among the healthy controls, patients with stable angina pectoris, and those with acute myocardial infarction, respectively. This implicated pathways such as the glucagon signaling pathway, d-amino acid metabolism, pyruvate metabolism, and amoebiasis across various stages of coronary heart disease. After selection, testosterone isobutyrate, N-acetyl-tryptophan, d-fructose, l-glutamic acid, erythritol, and gluconic acid were identified as core metabolites in the multiclass diagnostic model. Evaluating the diagnostic model demonstrated its high discriminative ability and accuracy. This study revealed metabolic pathway perturbations at different stages of coronary heart disease, and a precise multiclass diagnostic model was established based on these findings. This study provides new insights and tools for the early diagnosis and treatment of coronary heart disease.
Introduction
Although the incidence and mortality rates of coronary heart disease (CHD) have decreased, it remains the leading cause of death worldwide.1 There are 11.39 million individuals with CHD in China,2 and the number is higher in the United States, reaching 20.10 million. This underscores the critical need to improve cardiovascular disease prevention and treatment strategies. Current approaches based on traditional and modifiable risk factors have only been partially successful, highlighting a significant gap in meeting the desired standards. Therefore, deepening the understanding of the pathophysiological mechanisms of CHD is imperative to improve the effectiveness of prevention and treatment. According to a review by the Journal of the American College of Cardiology, causes of angina and ischemia include coronary microvascular dysfunction, vasospastic disorders, and myocardial metabolic disturbances. Notably, these conditions are more prevalent than arterial stenosis, prompting adjustments to current diagnostic methods or strategies.3
Another diagnostic limitation in clinical practice is the ineffective allocation and poor use of medical resources. CHD diagnosis depends predominantly on coronary CT angiography (CTA) or angiography alone.1 However, a subset of patients who presented with chest pain symptoms and underwent pertinent tests exhibited no coronary artery abnormalities.4 Such findings can prompt nonessential investigations and additional burdens for these individuals. Conversely, some patients with CHD may not exhibit prominent symptoms, possibly eliminating the need for coronary angiography or CTA to evaluate their cardiovascular health and depriving them of vital opportunities for early diagnosis and intervention. Additionally, specific patient populations, such as those with iodine allergies or pregnant women, are unsuitable candidates for iodine-containing contrast examinations. This highlights the need to develop an accessible, practical, and multifaceted diagnostic model. Such a model would aid clinicians in accurately determining the various stages and conditions of CHD, enhancing the efficiency of medical resource allocation and use.
Metabolomics can capture complex metabolic networks and may serve as the earliest and most sensitive indicator of changes in the disease state. Metabolic biomarkers derived from human blood offer unique insights into the mechanistic basis of diseases and therapeutic targets, revealing personalized metabolic phenotypes. Multiple metabolomic studies have demonstrated that metabolic biomarkers can be used to systematically assess small-molecule metabolites in biological samples, reflecting systemic or holistic statuses and providing additional insights into disease pathologies.5−7 Metabolites do not conform to a fixed structural template and cannot be measured by using a single analytical tool. Therefore, liquid chromatography–tandem mass spectrometry (LC-MS/MS) is used for measuring charged metabolites, whereas chromatography–mass spectrometry (GC-MS) is optimal for low molecular weight and volatile substances, including metabolites with challenging ionization procedures.8 By integration of these methods, the combined application of LC-MS/MS and GC-MS can achieve optimal metabolome coverage.
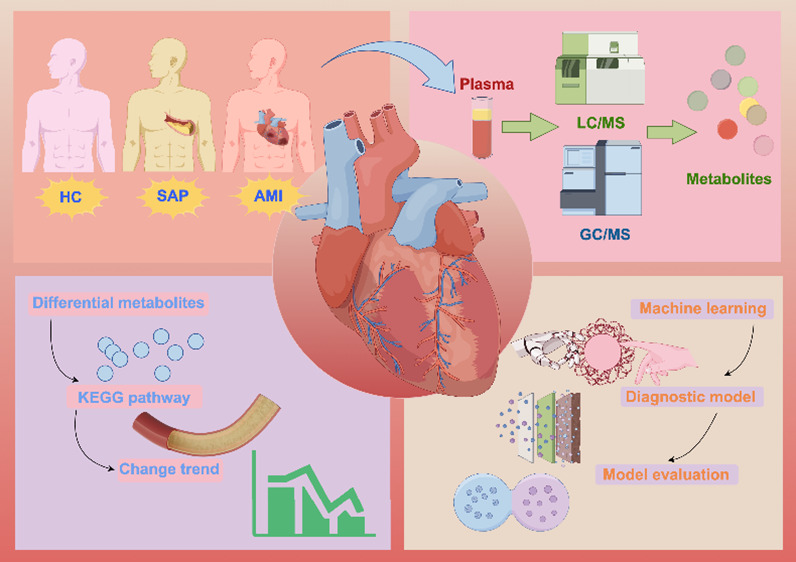
To further explore the dynamic changes in metabolites at different CHD stages, we aggregated the data from healthy controls (HCs), patients with stable angina pectoris (SAP), and patients with acute myocardial infarction (AMI). Using LC-MS/MS and GC-MS metabolomics, we compared the pathological progression of SAP and AMI, aiming to more systematically interpret the mechanisms related to CHD. Moreover, by using machine-learning technology, we constructed a multiclassification model to enhance early clinical diagnosis and provide new insights for future disease management.
Materials and Methods
Research Design
Between 2021 and 2023, our team recruited participants from the Shuguang Hospital, affiliated with Shanghai University of Traditional Chinese Medicine, securing clinical and demographic information and plasma samples. We enrolled 30 patients with AMI and applied diagnostic criteria based on the Fourth Universal Definition of Myocardial Infarction (2018) by the European Society of Cardiology (ESC)/American College of Cardiology Foundation/American Heart Association/World Heart Federation.9 AMI was diagnosed when there was evidence of elevated cardiac troponin levels with at least one value exceeding the 99th percentile upper reference limit. This was accompanied by at least one of the following: symptoms of myocardial ischemia, new ischemic electrocardiographic changes, development of pathological Q waves, imaging evidence of a new loss of viable myocardium or a new regional wall motion abnormality consistent with an ischemic etiology, or identification of an intracoronary thrombus by angiography. In patients with AMI hospitalized for chest discomfort or other ischemic symptoms, the presence of new ST-segment elevation in two contiguous leads or new bundle branch block with ischemic repolarization patterns is referred to as ST-elevation myocardial infarction (STEMI). The electrocardiographic features include new ST-elevation at the J-point in two contiguous leads with the cut-point: ≥1 mm in all leads other than leads V2–V3 where the following cut-points apply: ≥2 mm in men ≥40 years, ≥2.5 mm in men <40 years, or ≥1.5 mm in women regardless of age. We collected 80 patients with the most typical type of stable angina pectoris in chronic coronary syndromes. The diagnostic criteria were based on the 2019 European Society of Cardiology Diagnosis and Management Guidelines for Chronic Coronary Syndrome.10 The diagnosis was confirmed by coronary artery luminal narrowing >50% in at least one major branch, as evidenced through coronary angiography or CTA. In addition, the criteria included postpercutaneous coronary intervention and/or coronary artery bypass grafting, with the site, degree, frequency, nature, duration, and triggering factors of angina relatively stable in the short term. Plasma from 30 HCs was the control. The selection of sample size was based on published scientific estimates and recommendations.11 The inclusion and exclusion criteria for all study groups, as well as the diagnostic process for chronic coronary syndrome, are detailed in the Supporting Information (Tables S1 and S2).
Procedures
Blood samples were collected in EDTA anticoagulant tubes and centrifuged at 3000g for 15 min at 4 °C. Next, a 500 μL aliquot was transferred to a 1.5 mL centrifuge tube, snap-frozen in liquid nitrogen, and stored at −80 °C. The samples were thawed at room temperature for analysis. Subsequently, 150 μL of the sample was transferred to a 1.5 mL Eppendorf tube, and 450 μL of a methanol-acetonitrile protein precipitation agent (V:V = 2:1, with 2 μg/mL l-2-chlorophenylalanine) was added. The mixture was vortexed for 1 min, sonicated in an ice–water bath for 10 min, and incubated at −40 °C for 2 h. After centrifugation at 13,000g for 10 min at 4 °C, 150 μL of the supernatant was filtered through a 0.22 μm syringe filter into an LC autosampler vial for UPLC-MS analysis using an ACQUITY UPLC I-Class plus coupled to a QE high-resolution mass spectrometer.
Additionally, 150 μL of the supernatant was transferred to a glass derivatization vial and dried in a freeze-concentration centrifugal dryer. Next, 80 μL of methoxylamine hydrochloride in pyridine (15 mg/mL) was added, and the sample was incubated at 37 °C for 60 min to facilitate oximation. Subsequently, 50 μL of the BSTFA reagent, 20 μL of hexane, and 10 μL of an internal standard mix (C8–C24 in chloroform) were added followed by incubation at 70 °C for 60 min. Finally, the samples were equilibrated at room temperature for 30 min before GC-MS analysis using a 7890B-5977A system for metabolomic profiling.
Metabolomics Data Processing
Raw metabolomic data were processed using Progenesis QI version 3.0, which included baseline filtering, peak identification, integration, retention time correction, peak alignment, and normalization. Compound identification involved using accurate mass, secondary fragments, and isotopic distribution with qualitative analysis using databases such as the Human Metabolome Database, LipidMaps v2.3, METLIN, and EMDB2.0. Ions with >50% missing values within the groups were excluded. For the remaining missing values, imputation was performed by using half the minimum detected value. The identified compounds were evaluated and assigned scores, and a screening criterion of 36 out of a maximum of 80 points was established. Compounds scoring below this threshold were deemed inaccurately identified and were excluded from the analysis.
Statistical Analysis
A comprehensive examination of the demographic characteristics and clinical indicators of the participants was initially conducted. Continuous variables were assessed for the normal distribution and homogeneity of variance. When these criteria were met, one-way analysis of variance (ANOVA) was used to compare the mean differences among the three groups. Conversely, if these conditions were not satisfied, then the Kruskal–Wallis test was used. Categorical variables were compared using the Chi-square test, and Fisher’s exact test was applied when small expected frequencies were encountered. Following the identification of significant differences, multiple comparisons were performed to identify specific intergroup disparities.
Additionally, we used principal component analysis and orthogonal partial least squares-discriminant analysis (OPLS-DA) to analyze quality control samples and the overall data set, with the objective of revealing metabolic feature distinctions between groups. ANOVA was used to evaluate variations in metabolites, considering sex differences, and Pearson’s correlation analysis was used to explore the association of each metabolite with age. Furthermore, analysis of covariance (ANCOVA) was performed for each metabolite to adjust for the potential confounding effects of age and sex. Subsequently, Tukey’s honest significant difference test was applied for posthoc comparisons, with statistical corrections for multiple comparisons. The threshold for statistical significance was set at p < 0.05.
Moreover, we implemented a Random Forest method combined with Recursive Feature Elimination to identify key metabolic biomarkers. The multiclass diagnostic model was developed over 1000 iterations and refined through 10-fold cross-validation. Confusion matrices, receiver operating characteristic (ROC) curves, and calibration curves were used to comprehensively evaluate the performance of the model. All data handling and analytical procedures were performed using R software (version 3.5.4). Circular heat maps were produced using the online tool at [https://www.chiplot.online/], and graphical abstracts were created using the platform at [https://www. figdraw. com/static/index. com].
Results
Clinical Characteristics of Participant Groups
This study included 30 HCs, 80 patients with SAP, and 30 with AMI, all of whom were diagnosed with STEMI. Regarding sex, 40% of the patients in the HC group were male, lower than the 71.2% in the SAP group, and the proportion further increased to 93.3% in the AMI group. The mean ages were 26.33, 62.87, and 62.0 years for HCs, patients with SAP, and patients with AMI, respectively. Biochemically, fasting glucose levels were slightly higher in the SAP group (6.13 mmol/L) than those in HCs (5.04 mmol/L) and substantially higher in the AMI group (10.78 mmol/L). Lipid profiles indicated a decrease in total cholesterol and low-density lipoprotein (LDL) levels in the SAP group, consistent with some previous findings;12 however, these markers were significantly elevated in the AMI group. Triglyceride levels showed an upward trend across all of the groups. Inflammatory markers, such as high-sensitivity C-reactive protein (hs-CRP), white blood cell count, neutrophil percentage, and neutrophil-to-lymphocyte ratio, were markedly higher in the AMI group than in the other groups. Conversely, the percentages of lymphocytes, eosinophils, and basophils were diminished in the AMI group. Cardiac function indicators revealed a significantly lower left ventricular ejection fraction (54.5%) in patients with AMI than in those with SAP (63.43%) and HCs (65.6%). Furthermore, the left ventricular end-systolic diameter and volume were higher in the AMI group than in the HC and SAP groups. These clinical differences among the groups provide critical insights into the progression of coronary artery disease (Table 1 and Tables S2 and S3).
Table 1. Demographic Characteristics and Clinical Indicators of the Participantsa.
|
P-value |
|||||||
|---|---|---|---|---|---|---|---|
| variable | HC | SAP | AMI | overall | HC-SAP | HC-AMI | SAP-AMI |
| participants, n | 30 | 80 | 30 | ||||
| age | 26.33(2.11) | 62.87(10.41) | 62.0(16.26) | <0.0001 | <0.0001 | <0.0001 | 0.900 |
| male, n (%) | 12(40%) | 57(71.2) | 28(93.3%) | <0.0001 | 0.0051 | <0.0001 | 0.032 |
| FBG (mmol/L) | 5.04(0.37) | 6.13(1.645) | 10.78(3.00) | <0.0001 | 0.1300 | <0.0001 | <0.0001 |
| LVEF (%) | 65.6(4.44) | 63.43(6.13) | 54.5(8.56) | <0.0001 | 0.2582 | <0.0001 | <0.0001 |
| LVDS (mm) | 27.43(3.61) | 31.6(4.51) | 34.84(5.57) | <0.0001 | 0.0001 | <0.0001 | 0.0032 |
| ESV (ml) | 29.73(10.41) | 40.69(14.26) | 52.31(21.02) | <0.0001 | 0.0025 | <0.0001 | 0.0012 |
| TC (mmol/L) | 4.6(0.75) | 3.94(1.08) | 4.72(1.56) | 0.0015 | 0.0207 | 0.9227 | 0.0053 |
| TG (mmol/L) | 0.87(0.42 | 1.55(0.88) | 1.99(1.31) | <0.0001 | 0.0022 | <0.0001 | 0.0742 |
| HDL-C (mmol/L) | 1.59(0.29) | 1.1(0.25) | 1.04(0.25) | <0.0001 | <0.0001 | <0.0001 | 0.5175 |
| LDL-C (mmol/L) | 2.41(0.64) | 2.05(0.78) | 2.78(1.08) | 0.0003 | 0.1129 | 0.2027 | 0.0002 |
| hs-CRP (mg/L) | 0.13(0.03) | 0.29(0.28) | 1.36(3.27) | 0.0002 | 0.8273 | 0.0009 | 0.0005 |
| leukocyte (/L) | 6.04(1.18) | 6.48(1.69) | 9.89(3.24) | <0.0001 | 0.5800 | <0.0001 | <0.0001 |
| neutrophil % (%) | 55.71(8.20) | 61.5(7.76) | 77.54(10.19) | <0.0001 | 0.0045 | <0.0001 | <0.0001 |
| lymphocyte % (%) | 35.96(7.65) | 28.87(7.74) | 16.06(8.75) | <0.0001 | 0.0002 | <0.0001 | <0.0001 |
| eosinophil % (%) | 2.27(1.87) | 2.31(1.72) | 0.84(1.02) | 0.0001 | 0.9918 | 0.0026 | 0.0001 |
| basophil % (%) | 0.56(0.23) | 0.5(0.23) | 0.32(0.23) | 0.0003 | 0.4902 | 0.0005 | 0.0016 |
| monocytes (/L) | 0.33(0.09) | 0.44(0.14) | 0.53(0.27) | 0.0001 | 0.0159 | 0.0001 | 0.0366 |
| platelets (/L) | 239.8(45.99) | 209.9(57.52) | 217.2(75.42) | 0.0683 | 0.0624 | 0.4326 | 0.9999 |
| NLR | 1.68(0.69) | 2.36(0.97) | 6.15(3.84) | <0.0001 | 0.3185 | <0.0001 | <0.0001 |
| PLR | 116.27(27.68) | 125.76(47.89) | 183.64(104.79) | <0.0001 | 0.9999 | 0.0001 | <0.0001 |
| NPR | 0.014(0.00) | 0.02(0.00) | 0.037(0.01) | <0.0001 | 0.0278 | <0.0001 | <0.0001 |
Abbreviations: LVDS, left ventricular systolic diameter; ESV, end-systolic volume; FBG, fasting blood glucose; LVEF, left ventricular ejection fraction; NLR, neutrophil-to-lymphocyte ratio; NPR, neutrophil-to-platelet ratio; PLR, platelet-to-lymphocyte ratio; TC, total cholesterol; TG, triglyceride; HDL-C, high-density lipoprotein cholesterol; LDL-C, low-density lipoprotein cholesterol; hs-CRP, high-sensitivity C-reactive protein.
Quality Control (QC) in Dual-Platform Metabolomics
The tight clustering of the QC samples observed during the analysis validated the stability and reliability of the MS system. Notably, the AMI_5 sample exhibited a significant deviation and was removed. After this exclusion, no significant outliers remained in the data set (Figure 1A). For enhanced precision in analyzing the treated samples, the OPLS-DA method was applied, resulting in three sample groups demonstrating clear intragroup cohesion and intergroup distinctions, as shown in the analyses involving GC-MS and LC-MS/MS (Figure 1B). We identified 1197 and 294 metabolites via LC-MS/MS and GC-MS, respectively, including 14 major metabolite classes (Figure 1C).
Figure 1.

(A) Quality control of liquid chromatography–tandem mass spectrometry (LC-MS/MS) and chromatography–mass spectrometry (GC-MS). During the collective analysis of the overall samples, the acute myocardial infarction (AMI)_5 sample was identified as an outlier. No apparent outliers were observed in the data after excluding AMI_5. (B) Orthogonal partial least squares-discriminant analysis of LC-MS/MS and GC-MS, with pairwise comparisons among healthy control (HC), stable angina pectoris (SAP), and AMI groups, showing significant intragroup clustering and intergroup differences. (C) Types of metabolites detected using LC-MS/MS and GC-MS.
Metabolic Profiling and Functional Enrichment Analysis in CHD
In this study, ANOVA was used to assess differences in metabolites across sexes, whereas Pearson’s correlation tests were used to examine the linear relationships between metabolites and age. The analyses indicated that sex influenced 395 metabolites and was significantly associated with 761. Of these metabolites, 244 were affected by sex and age (Figure 2B). To determine the impact of different groups on metabolite levels more accurately, ANCOVA was conducted with sex and age as covariates, addressing potential confounders. Pairwise comparative analysis of the HC, SAP, and AMI groups revealed 216, 567, and 295 significantly different metabolites, respectively (Figure 2A), with 43 showing consistent changes across all comparisons (Figure 2C). Additionally, a functional enrichment analysis of the differentially expressed metabolites was performed using the KEGG database (Figure 3A), and a metabolite-pathway network diagram was constructed from the enrichment results (Figure 3B). This diagram reveals significant disparities in six metabolic pathways, including central carbon metabolism in cancer, glucagon signaling pathway, d-amino acid metabolism, linoleic acid metabolism, pyruvate metabolism, amoebiasis, and galactose metabolism, across all three groups, suggesting their potential vital roles at various stages of the progression of CHD.
Figure 2.

(A) Volcano plots for pairwise comparisons among HC, SAP, and AMI groups. (B) Metabolite variance influenced by age and sex. (C) Upset plots of differential metabolites for pairwise comparisons among HC, SAP, and AMI groups.
Figure 3.

(A) Pathway enrichment heatmap for pairwise comparisons among HC, SAP, and AMI groups. (B) Metabolite-pathway network diagram based on enrichment results.
Dynamic Trajectories of Metabolites from HC to SAP to AMI
To elucidate metabolic alterations during disease progression, we charted eight distinct metabolite trajectories across the three clinical states (Figure 4A,B). Clusters 1 and 2, comprising 33 metabolites, including oxoglutaric acid, l-arginine, l-glutamic acid, 12,13-EpOME, lysoPE (P-18:0/0:0), and docosapentaenoic acid (22n-3), followed a pattern of progressive increase or decrease across the groups, correlating with the severity of atherosclerotic disease. Clusters 3 and 4 included 149 metabolites, such as protoapigenone, uridine, and d-glucose, which showed no difference between HC and SAP; however, notable changes were evident between AMI and the other two groups (HC and SAP), indicating that these metabolites are specifically altered after myocardial infarction. Clusters 5 and 6, which comprised 26 metabolites, including 7-oxo decanoylcarnitine, desmosterol, and maleamic acid, remained consistent between SAP and AMI but differed when comparing both to HC, suggesting an association with early pathological changes in angina.
Figure 4.

(A) Trend analysis of metabolite variations across three conditions. (B) Semicircular heatmap of metabolites across different trend subgroups.
Multiclass Diagnostic Model
We used a Random Forest algorithm and Recursive Feature Elimination, incorporating age and sex as covariates. Using a 10-fold cross-validation strategy, we identified six key metabolites in our multiclass diagnostic model. These included testosterone isobutyrate (TiB), N-acetyl-tryptophan, d-fructose, l-glutamic acid, erythritol, and gluconic acid (Figure 5A). The classification performance of the model was evaluated by using a confusion matrix (Figure 5B). Within the HC group, one individual was misclassified as having SAP. Among patients with SAP, one was misidentified as HC, and two patients with AMI were incorrectly categorized as having SAP. Despite these misclassifications, the overall model performance was satisfactory. The discriminative ability of the model was further substantiated with ROC curves with an area under the curve (AUC) of 0.99 for all categories (Figure 5C). Troponin, the current clinical biomarker for AMI diagnosis, was used for comparison with an AUC value of 0.96 (Figure 5D). The calibration curves indicated that the model performed significantly well in predicting stable angina pectoris with minimal bias. However, despite the overall accuracy, the model exhibited a slight tendency to overestimate when predicting HC and AMI (Figure 5E). This multiclass diagnostic model demonstrates high accuracy and stability across different stages of CHD diagnosis.
Figure 5.

(A) Expression of metabolites in the multiclass diagnostic model. (B) Confusion matrix of the model. (C) ROC curves of the model distinguishing between HC, SAP, and AMI categories. (D) ROC curve for Troponin I. (E) Calibration curve of the model.
Discussion
Metabolic products, the end products or intermediates of metabolic processes, bridge the information gap between genotype and ultimate phenotype and more accurately reflect the actual physiological state of an organism.13 In this study, we conducted a parallel analysis of the clinical and metabolomic features of 140 individuals across the HC, SAP, and AMI cohorts, sketching a comprehensive panorama of CHD. This study provides a valuable reference for further research and diagnosis in this field.
A pivotal event in the onset of atherosclerosis is the retention of LDL and other cholesterol-rich lipoproteins within the arterial walls. The relative reduction in cardiovascular disease risk is directly proportional to the absolute decrease in LDL levels.14 We found that lipid profiles in patients with AMI did not meet the standard criteria, with total cholesterol, triglyceride, and LDL levels exceeding those of healthy participants and patients with SAP, emphasizing that dyslipidemia management remains a focal point in CHD intervention. CHD is a chronic inflammatory condition driven by cholesterol, and our findings indicate that inflammation markers, such as white blood cell count, neutrophil percentage, monocyte count, hs-CRP, and neutrophil-to-platelet ratio, progressively increase with the disease severity. This suggests that inflammation may accelerate the progression of atherosclerosis and act on vulnerable plaques, precipitating most cardiovascular events. Inflammation promotes the progression of atherosclerosis during clinical stability and triggers instability and acute coronary syndrome. Although hs-CRP is a benchmark biomarker for CHD inflammatory risk, it is possibly a downstream indicator of inflammatory pathway activation rather than a direct causative factor of cardiovascular events.15,16 Furthermore, our study revealed that blood glucose levels in patients with AMI were higher than those in healthy individuals and patients with SAP, possibly as a transient response to ischemic injury, independent of a history of diabetes.17 Elevation in blood glucose is strongly correlated with the worsening of conditions as hyperglycemia can further disrupt the dynamic balance of endothelial cells, amplify inflammation, and cause a prothrombotic state and ischemic burden.18 Therefore, controlling blood glucose levels post-AMI is crucial for myocardial recovery and prognosis.
The pathways with differences observed across the three groups underscored their significant roles in the various stages of CHD. Heart disease and cancer share numerous risk factors such as diabetes, dyslipidemia, cachexia, and immunosuppression. These risk factors may disrupt central carbon metabolism balance, affecting cardiac health and tumor growth.19 Glucagon stimulates the heart, potentially enhancing heart rate and myocardial contractility through interactions with glucagon receptors.20 However, noting that glucagon may have adverse effects on ischemic heart disease and could be significant in the progression of CHD is essential.21 Abnormalities in amino acid metabolism may be associated with an increased risk of cardiovascular diseases. Studies have found differences in amino acid metabolism between patients with CHD with and without diabetes.22 Myocardial cells experience persistent energy shortages during ischemia and heart failure, leading to metabolic and contractile dysfunction.23 Linoleic acid intake positively correlated with CHD severity.24 The intake of linoleic acid, a substitute for saturated fats and carbohydrates, may be beneficial in reducing the risk of CHD.25 Pyruvate metabolism is crucial in maintaining cardiac energy balance. Its metabolic node within cells has significant implications for adaptation in health and disease states, is considered a potential approach to enhance cardiac function, and provides metabolic support for the at-risk myocardium.26
Metabolites associated with disease severity may act as facilitators of disease progression or compensatory responses to metabolic dysregulation. For example, 2-oxoglutarate, a vital molecule in the citric acid cycle, functions as a cofactor in regulating PHD3 activity, which is related to the development of atherosclerosis.27 It can be produced from glutamate by oxidative deamination through glutamate dehydrogenase or converted to glutamate as part of nitrogen clearance.28 These two metabolites exhibit similar expression trends, which are consistent with the findings of this study. Similarly, 2-hydroxybutyric acid, which may arise from increased lipid oxidation and oxidative stress, exacerbates insulin resistance, shows an increasing trend in patients with diabetes,29 and is considered a biomarker of impaired glucose tolerance.30 Fish oil typically contains three types of n-3 long-chain polyunsaturated fatty acids: eicosapentaenoic acid (EPA), docosapentaenoic acid (DPA), and docosahexaenoic acid (DHA), with n-3 DPA being a metabolic extension of EPA and an intermediate between EPA and DHA. Platelet aggregation is in the early stage of thrombus formation. n-3 DPA interferes with the cyclooxygenase pathway and enhances the activity of the lipoxygenase pathway, exhibiting a greater capacity to inhibit arachidonic acid-induced platelet aggregation than EPA.31,32 Arginine is a regulatory factor in vascular homeostasis,33 generating nitric oxide and glutamate through multiple pathways, such as arginase and nitric oxide synthase, mitigating endothelial dysfunction and improving atherosclerosis.34 Dihydroxyphenyl-valerolactone inhibits the adhesion of TNF-α-induced THP-1 monocytes to human umbilical vein endothelial cells, demonstrating its high potential for preventing atherosclerosis.35 Glucose 6-phosphate promotes insulin production, decreasing blood glucose levels.36 LysoPC is implicated in the pathogenesis of acute coronary syndrome and is significantly reduced in narrowed or infarcted coronary arteries,37 aligning with the outcomes of this study.
In our constructed multiclass diagnostic model, a relationship between certain metabolites and CHD was established. For instance, d-fructose has been associated with the risk of CHD and is crucial in driving cardiovascular metabolic syndrome.38 The intake and metabolism of fructose in the cardiac tissue are regulated by HIF1a, which is mediated by SF3B1-induced alterations in gene splicing. This regulation promotes synthetic metabolic growth in the heart and leads to contractile and diastolic dysfunction under stress.39 Furthermore, elevated levels of glutamate in the circulation are associated with subclinical atherosclerosis and CHD, independent of established risk markers.40 Erythritol can induce the activation and aggregation of platelets, which may cause clot formation in individuals at high cardiovascular risk, increasing the risk of acute cardiovascular events.5,41,42 However, the association between other metabolites and CHD remains unclear. For example, TiB, which is highly abundant in AMI, is a testosterone prodrug convertible to testosterone in the body.43 Although testosterone replacement therapy reportedly increases the risk of cardiovascular diseases, evidence linking TiB to CHD is lacking. Additionally, N-acetyl-tryptophan protects against hepatic ischemia-reperfusion injury through the RIP2/caspase-1/IL-1β signaling pathway; however, its effects on ischemic cardiomyopathy remain unclear.44 Gluconic acid, a substance produced through the aerobic oxidation of glucose,45 has been associated with oxidative stress,46 hyperglycemia, and hypertension;47 however, evidence directly linking it to CHD is unavailable. The potential relationship between these metabolites and CHD remains a vital and challenging research area.
Notably, our study has some limitations. First, the racial homogeneity of the sample population restricts the generalizability of our findings. Although we endeavored to ensure scientific rigor through methodologies such as 10-fold cross-validation, calibration curves, and ROC analysis, our results remain unvalidated with targeted quantitative verification in other independent populations. Second, whether these biomarkers are causative of coronary artery disease or are merely a consequence thereof remains unelucidated. Conversely, whether they exert a specific biological impact on the ischemic myocardium requires further in-depth study and evaluation. Moreover, our study’s approach to examining changes in metabolites across different age stages in coronary heart disease presented additional limitations. Existing research has shown that microbial metabolites, such as TMAO, are significantly correlated with levels in young patients with acute coronary syndrome, emphasizing the importance of risk factors and potential mechanisms in acute coronary syndrome among young individuals.48 To more comprehensively address future research challenges and further enhance the quality of our findings, we plan to expand the sample size, diversify the collection of samples, and improve the generalizability of the study to cover a broader population and different ethnicities. This ensures the universality of our research results and includes a higher proportion of young patients, thereby more meticulously exploring the risk factors and potential mechanisms of acute coronary syndrome among young individuals.
The pathogenesis and progression of CHD involve many complex biological processes with metabolic alterations being vital. Through an in-depth metabolomic analysis, our study revealed a comprehensive and dynamic phenotypic landscape of CHD, revealing distinct metabolic features and pathway perturbations unique to SAP and AMI at various stages. We identified the core metabolites TiB, N-acetyl-tryptophan, d-fructose, l-glutamic acid, erythritol, and gluconic acid and used them to construct a multiclass diagnostic model that demonstrated excellent discriminatory ability and accuracy. This optimizes medical resources, provides a novel and effective tool for the early diagnosis of CHD, and offers fresh insights for future therapeutic strategies and interventions.
Acknowledgments
We would like to thank Shanghai Lu Ming Biotech Co., Ltd (Shanghai, China) for the sequencing and bioinformatics analysis of plasma metabolomics.
Glossary
Abbreviation
- ANCOVA
analysis of covariance
- ANOVA
one-way analysis of variance
- AUC
area under the curve
- CHD
coronary heart disease
- CTA
coronary CT angiography
- ESC
Eurpean Society of Cardiology
- ESV
end-systolic volume
- FBG
fasting blood glucose
- hs-CRP
high-sensitivity C-reactive protein
- LVDS
left ventricular systolic diameter
- LVEF
left ventricular ejection fraction
- NLR
neutrophil-to-lymphocyte ratio
- NPR
neutrophil-to-platelet ratio;
- OPLS-DA
orthogonal partial least squares-discriminant analysis
- PCA
principal component analysis
- PLR
platelet-to-lymphocyte ratio
- ROC
receiver operating characteristic
- TC
total cholesterol
- TG
triglycerides
- HDL-C
high-density lipoprotein cholesterol
- LDL-C
low-density lipoprotein cholesterol
Data Availability Statement
The data sets used and/or analyzed during the current study are available from the corresponding author on reasonable request.
Supporting Information Available
The Supporting Information is available free of charge at https://pubs.acs.org/doi/10.1021/acsomega.3c10474.
Inclusion and exclusion criteria for all study groups (Table S1); main diagnostic pathways for chronic coronary syndromes (Table S2); overview of diagnostic testing strategies and outcomes in patients with chronic coronary syndromes (Table S3) (PDF)
Author Contributions
R.L.: methodology, investigation, and writing–original draft. W.L.: software and visualization. Q.J. and D.W.: formal analysis. C.Z. and H.W.: investigation. T.C.: Data curation. J.G.: resources and project administration. X.W.: conceptualization, supervision, and resources acquisition.
We thank the General Program of the National Natural Science Foundation of China (no. 82074222 and No. 82374252), Shanghai Medical Innovation Research Project (Major Project) (no. 23Y31920200).
Trial registration: China Clinical Trial Registration Center, ChiCTR2200056686. Registered on February 10, 2022. This study protocol has been approved by the Ethics Committee of Shuguang Hospital Affiliated to Shanghai University of Traditional Chinese Medicine (approval number: 20210-1049-124, Date of Approval: January 17, 2022). All participants voluntarily agreed to participate after fully understanding the content and purpose of the study and agreed to the disclosure of their data and/or images in this article.
The authors declare no competing financial interest.
Supplementary Material
References
- Virani S. S.; Newby L. K.; Arnold S. V.; Bittner V.; Brewer L. C.; Demeter S. H.; Dixon D. L.; Fearon W. F.; Hess B.; Johnson H. M.; et al. 2023 AHA/ACC/ACCP/ASPC/NLA/PCNA Guideline for the Management of Patients With Chronic Coronary Disease: A Report of the American Heart Association/American College of Cardiology Joint Committee on Clinical Practice Guidelines. Circulation 2023, 148 (9), e9–e119. 10.1161/CIR.0000000000001168. [DOI] [PubMed] [Google Scholar]
- Hu S.; Wang Z. W. Overview of the China Cardiovascular Health and Disease Report 2022. Chin. J. Cardiovasc. Dis. 2023, 21, 577–600. [Google Scholar]
- Boden W. E.; Marzilli M.; Crea F.; Mancini G. B. J.; Weintraub W. S.; Taqueti V. R.; Pepine C. J.; Escaned J.; Al-Lamee R.; Gowdak L. H. W.; et al. Evolving Management Paradigm for Stable Ischemic Heart Disease Patients: JACC Review Topic of the Week. J. Am. Coll Cardiol 2023, 81 (5), 505–514. 10.1016/j.jacc.2022.08.814. [DOI] [PMC free article] [PubMed] [Google Scholar]
- Gulati M.; Levy P. D.; Mukherjee D.; Amsterdam E.; Bhatt D. L.; Birtcher K. K.; Blankstein R.; Boyd J.; Bullock-Palmer R. P.; Conejo T.; et al. 2021 AHA/ACC/ASE/CHEST/SAEM/SCCT/SCMR Guideline for the Evaluation and Diagnosis of Chest Pain: A Report of the American College of Cardiology/American Heart Association Joint Committee on Clinical Practice Guidelines. Circulation 2021, 144 (22), e368–e454. 10.1161/CIR.0000000000001029. [DOI] [PubMed] [Google Scholar]
- Wang Z.; Zhu C.; Nambi V.; Morrison A. C.; Folsom A. R.; Ballantyne C. M.; Boerwinkle E.; Yu B. Metabolomic Pattern Predicts Incident Coronary Heart Disease. Arterioscler Thromb Vasc Biol. 2019, 39 (7), 1475–1482. 10.1161/ATVBAHA.118.312236. [DOI] [PMC free article] [PubMed] [Google Scholar]
- Karagiannidis E.; Moysidis D. V.; Papazoglou A. S.; Panteris E.; Deda O.; Stalikas N.; Sofidis G.; Kartas A.; Bekiaridou A.; Giannakoulas G.; et al. Prognostic significance of metabolomic biomarkers in patients with diabetes mellitus and coronary artery disease. Cardiovasc Diabetol 2022, 21 (1), 70. 10.1186/s12933-022-01494-9. [DOI] [PMC free article] [PubMed] [Google Scholar]
- Lai Q.; Yuan G.; Shen L.; Zhang L.; Fu F.; Liu Z.; Zhang Y.; Kou J.; Liu S.; Yu B.; et al. Oxoeicosanoid receptor inhibition alleviates acute myocardial infarction through activation of BCAT1. Basic Res. Cardiol 2021, 116 (1), 3. 10.1007/s00395-021-00844-0. [DOI] [PubMed] [Google Scholar]
- Lu W.; Su X.; Klein M. S.; Lewis I. A.; Fiehn O.; Rabinowitz J. D. Metabolite Measurement: Pitfalls to Avoid and Practices to Follow. Annu. Rev. Biochem. 2017, 86, 277–304. 10.1146/annurev-biochem-061516-044952. [DOI] [PMC free article] [PubMed] [Google Scholar]
- Thygesen K.; Alpert J. S.; Jaffe A. S.; Chaitman B. R.; Bax J. J.; Morrow D. A.; White H. D. Executive Group on behalf of the Joint European Society of Cardiology /American College of Cardiology /American Heart Association /World Heart Federation Task Force for the Universal Definition of Myocardial, I. Fourth Universal Definition of Myocardial Infarction (2018). J. Am. Coll Cardiol 2018, 72 (18), 2231–2264. 10.1016/j.jacc.2018.08.1038. [DOI] [PubMed] [Google Scholar]
- Knuuti J.; Wijns W.; Saraste A.; Capodanno D.; Barbato E.; Funck-Brentano C.; Prescott E.; Storey R. F.; Deaton C.; Cuisset T.; et al. 2019 ESC Guidelines for the diagnosis and management of chronic coronary syndromes. Eur. Heart J. 2020, 41 (3), 407–477. 10.1093/eurheartj/ehz425. [DOI] [PubMed] [Google Scholar]
- Billoir E.; Navratil V.; Blaise B. J. Sample size calculation in metabolic phenotyping studies. Brief. Bioinform. 2015, 16 (5), 813–819. 10.1093/bib/bbu052. [DOI] [PubMed] [Google Scholar]
- Fan Y.; Li Y.; Chen Y.; Zhao Y. J.; Liu L. W.; Li J.; Wang S. L.; Alolga R. N.; Yin Y.; Wang X. M.; et al. Comprehensive Metabolomic Characterization of Coronary Artery Diseases. J. Am. Coll Cardiol 2016, 68 (12), 1281–1293. 10.1016/j.jacc.2016.06.044. [DOI] [PubMed] [Google Scholar]
- Qiu S.; Cai Y.; Yao H.; Lin C.; Xie Y.; Tang S.; Zhang A. Small molecule metabolites: discovery of biomarkers and therapeutic targets. Signal Transduct Target Ther 2023, 8 (1), 132. 10.1038/s41392-023-01399-3. [DOI] [PMC free article] [PubMed] [Google Scholar]
- Cholesterol Treatment Trialists C.; Mihaylova B.; Emberson J.; Blackwell L.; Keech A.; Simes J.; Barnes E. H.; Voysey M.; Gray A.; Collins R.; et al. The effects of lowering LDL cholesterol with statin therapy in people at low risk of vascular disease: meta-analysis of individual data from 27 randomised trials. Lancet 2012, 380 (9841), 581–590. 10.1016/S0140-6736(12)60367-5. [DOI] [PMC free article] [PubMed] [Google Scholar]
- Lawler P. R.; Bhatt D. L.; Godoy L. C.; Luscher T. F.; Bonow R. O.; Verma S.; Ridker P. M. Targeting cardiovascular inflammation: next steps in clinical translation. Eur. Heart J. 2021, 42 (1), 113–131. 10.1093/eurheartj/ehaa099. [DOI] [PubMed] [Google Scholar]
- Nayor M.; Brown K. J.; Vasan R. S. The Molecular Basis of Predicting Atherosclerotic Cardiovascular Disease Risk. Circ. Res. 2021, 128 (2), 287–303. 10.1161/CIRCRESAHA.120.315890. [DOI] [PMC free article] [PubMed] [Google Scholar]
- Upur H.; Li J. L.; Zou X. G.; Hu Y. Y.; Yang H. Y.; Abudoureyimu A.; Abliz A.; Abdukerim M.; Huang M. Short and long-term prognosis of admission hyperglycemia in patients with and without diabetes after acute myocardial infarction: a retrospective cohort study. Cardiovasc Diabetol 2022, 21 (1), 114. 10.1186/s12933-022-01550-4. [DOI] [PMC free article] [PubMed] [Google Scholar]
- Paolisso P.; Foa A.; Bergamaschi L.; Donati F.; Fabrizio M.; Chiti C.; Angeli F.; Toniolo S.; Stefanizzi A.; Armillotta M.; et al. Hyperglycemia, inflammatory response and infarct size in obstructive acute myocardial infarction and MINOCA. Cardiovasc Diabetol 2021, 20 (1), 33. 10.1186/s12933-021-01222-9. [DOI] [PMC free article] [PubMed] [Google Scholar]
- Karlstaedt A.; Moslehi J.; de Boer R. A. Cardio-onco-metabolism: metabolic remodelling in cardiovascular disease and cancer. Nat. Rev. Cardiol 2022, 19 (6), 414–425. 10.1038/s41569-022-00698-6. [DOI] [PMC free article] [PubMed] [Google Scholar]
- Hernandez-Cascales J. Does glucagon have a positive inotropic effect in the human heart?. Cardiovasc Diabetol 2018, 17 (1), 148. 10.1186/s12933-018-0791-z. [DOI] [PMC free article] [PubMed] [Google Scholar]
- Ng J. C. M.; Schooling C. M. Effect of Glucagon on Ischemic Heart Disease and Its Risk Factors: A Mendelian Randomization Study. J. Clin. Endocrinol. Metab. 2020, 105 (8), e2778 10.1210/clinem/dgaa259. [DOI] [PubMed] [Google Scholar]
- Nitz K.; Lacy M.; Atzler D. Amino Acids and Their Metabolism in Atherosclerosis. Arterioscler Thromb Vasc Biol. 2019, 39 (3), 319–330. 10.1161/ATVBAHA.118.311572. [DOI] [PubMed] [Google Scholar]
- Marazzi G.; Rosanio S.; Caminiti G.; Dioguardi F. S.; Mercuro G. The role of amino acids in the modulation of cardiac metabolism during ischemia and heart failure. Curr. Pharm. Des 2008, 14 (25), 2592–2604. 10.2174/138161208786071227. [DOI] [PubMed] [Google Scholar]
- Hodgson J. M.; Wahlqvist M. L.; Boxall J. A.; Balazs N. D. Can linoleic acid contribute to coronary artery disease?. Am. J. Clin. Nutr. 1993, 58 (2), 228–234. 10.1093/ajcn/58.2.228. [DOI] [PubMed] [Google Scholar]
- Farvid M. S.; Ding M.; Pan A.; Sun Q.; Chiuve S. E.; Steffen L. M.; Willett W. C.; Hu F. B. Dietary linoleic acid and risk of coronary heart disease: a systematic review and meta-analysis of prospective cohort studies. Circulation 2014, 130 (18), 1568–1578. 10.1161/CIRCULATIONAHA.114.010236. [DOI] [PMC free article] [PubMed] [Google Scholar]
- Mallet R. T.; Olivencia-Yurvati A. H.; Bunger R. Pyruvate enhancement of cardiac performance: Cellular mechanisms and clinical application. Exp Biol. Med. (Maywood) 2018, 243 (2), 198–210. 10.1177/1535370217743919. [DOI] [PMC free article] [PubMed] [Google Scholar]
- Liu H.; Xia Y.; Li B.; Pan J.; Lv M.; Wang X.; An F. Prolyl hydroxylase 3 overexpression accelerates the progression of atherosclerosis in ApoE–/– mice. Biochem. Biophys. Res. Commun. 2016, 473 (1), 99–106. 10.1016/j.bbrc.2016.03.058. [DOI] [PubMed] [Google Scholar]
- Wu N.; Yang M.; Gaur U.; Xu H.; Yao Y.; Li D. Alpha-Ketoglutarate: Physiological Functions and Applications. Biomol Ther (Seoul) 2016, 24 (1), 1–8. 10.4062/biomolther.2015.078. [DOI] [PMC free article] [PubMed] [Google Scholar]
- Kong X.; Zhu Q.; Dong Y.; Li Y.; Liu J.; Yan Q.; Huang M.; Niu Y. Analysis of serum fatty acid, amino acid, and organic acid profiles in gestational hypertension and gestational diabetes mellitus via targeted metabolomics. Front Nutr 2022, 9, 974902 10.3389/fnut.2022.974902. [DOI] [PMC free article] [PubMed] [Google Scholar]
- Cobb J.; Eckhart A.; Motsinger-Reif A.; Carr B.; Groop L.; Ferrannini E. alpha-Hydroxybutyric Acid Is a Selective Metabolite Biomarker of Impaired Glucose Tolerance. Diabetes Care 2016, 39 (6), 988–995. 10.2337/dc15-2752. [DOI] [PubMed] [Google Scholar]
- Akiba S.; Murata T.; Kitatani K.; Sato T. Involvement of lipoxygenase pathway in docosapentaenoic acid-induced inhibition of platelet aggregation. Biol. Pharm. Bull. 2000, 23 (11), 1293–1297. 10.1248/bpb.23.1293. [DOI] [PubMed] [Google Scholar]
- Kaur G.; Cameron-Smith D.; Garg M.; Sinclair A. J. Docosapentaenoic acid (22:5n-3): a review of its biological effects. Prog. Lipid Res. 2011, 50 (1), 28–34. 10.1016/j.plipres.2010.07.004. [DOI] [PubMed] [Google Scholar]
- Zaric B. L.; Radovanovic J. N.; Gluvic Z.; Stewart A. J.; Essack M.; Motwalli O.; Gojobori T.; Isenovic E. R. Atherosclerosis Linked to Aberrant Amino Acid Metabolism and Immunosuppressive Amino Acid Catabolizing Enzymes. Front Immunol 2020, 11, 551758 10.3389/fimmu.2020.551758. [DOI] [PMC free article] [PubMed] [Google Scholar]
- Popolo A.; Adesso S.; Pinto A.; Autore G.; Marzocco S. L-Arginine and its metabolites in kidney and cardiovascular disease. Amino Acids 2014, 46 (10), 2271–2286. 10.1007/s00726-014-1825-9. [DOI] [PubMed] [Google Scholar]
- Lee C. C.; Kim J. H.; Kim J. S.; Oh Y. S.; Han S. M.; Park J. H. Y.; Lee K. W.; Lee C. Y. 5-(3′,4′-Dihydroxyphenyl-γ-valerolactone), a Major Microbial Metabolite of Proanthocyanidin, Attenuates THP-1 Monocyte-Endothelial Adhesion. Int. J. Mol. Sci. 2017, 18 (7), 1363. 10.3390/ijms18071363. [DOI] [PMC free article] [PubMed] [Google Scholar]
- Al-aryahi S.; Kamato D.; Getachew R.; Zheng W.; Potocnik S. J.; Cohen N.; Guidone D.; Osman N.; Little P. J. Atherogenic, fibrotic and glucose utilising actions of glucokinase activators on vascular endothelium and smooth muscle. Cardiovasc Diabetol 2014, 13, 80. 10.1186/1475-2840-13-80. [DOI] [PMC free article] [PubMed] [Google Scholar]
- Kurano M.; Kano K.; Dohi T.; Matsumoto H.; Igarashi K.; Nishikawa M.; Ohkawa R.; Ikeda H.; Miyauchi K.; Daida H.; et al. Different origins of lysophospholipid mediators between coronary and peripheral arteries in acute coronary syndrome. J. Lipid Res. 2017, 58 (2), 433–442. 10.1194/jlr.P071803. [DOI] [PMC free article] [PubMed] [Google Scholar]
- Busnatu S. S.; Salmen T.; Pana M. A.; Rizzo M.; Stallone T.; Papanas N.; Popovic D.; Tanasescu D.; Serban D.; Stoian A. P. The Role of Fructose as a Cardiovascular Risk Factor: An Update. Metabolites 2022, 12 (1), 67. 10.3390/metabo12010067. [DOI] [PMC free article] [PubMed] [Google Scholar]
- Mirtschink P.; Jang C.; Arany Z.; Krek W. Fructose metabolism, cardiometabolic risk, and the epidemic of coronary artery disease. Eur. Heart J. 2018, 39 (26), 2497–2505. 10.1093/eurheartj/ehx518. [DOI] [PMC free article] [PubMed] [Google Scholar]
- Wang X.; Yang R.; Zhang W.; Wang S.; Mu H.; Li H.; Dong J.; Chen W.; Yu X.; Ji F. Serum glutamate and glutamine-to-glutamate ratio are associated with coronary angiography defined coronary artery disease. Nutr Metab Cardiovasc Dis 2022, 32 (1), 186–194. 10.1016/j.numecd.2021.09.021. [DOI] [PubMed] [Google Scholar]
- Witkowski M.; Nemet I.; Alamri H.; Wilcox J.; Gupta N.; Nimer N.; Haghikia A.; Li X. S.; Wu Y.; Saha P. P.; et al. The artificial sweetener erythritol and cardiovascular event risk. Nat. Med. 2023, 29 (3), 710–718. 10.1038/s41591-023-02223-9. [DOI] [PMC free article] [PubMed] [Google Scholar]
- Deidda M.; Noto A.; Cadeddu Dessalvi C.; Andreini D.; Andreotti F.; Ferrannini E.; Latini R.; Maggioni A. P.; Magnoni M.; Mercuro G.; et al. Why Do High-Risk Patients Develop or Not Develop Coronary Artery Disease? Metabolic Insights from the CAPIRE Study. Metabolites 2022, 12 (2), 123. 10.3390/metabo12020123. [DOI] [PMC free article] [PubMed] [Google Scholar]
- Gagliano-Juca T.; Basaria S. Testosterone replacement therapy and cardiovascular risk. Nat. Rev. Cardiol 2019, 16 (9), 555–574. 10.1038/s41569-019-0211-4. [DOI] [PubMed] [Google Scholar]
- Wang J.; Yu S.; Li J.; Li H.; Jiang H.; Xiao P.; Pan Y.; Zheng J.; Yu L.; Jiang J. Protective role of N-acetyl-l-tryptophan against hepatic ischemia-reperfusion injury via the RIP2/caspase-1/IL-1beta signaling pathway. Pharm. Biol. 2019, 57 (1), 385–391. 10.1080/13880209.2019.1617750. [DOI] [PMC free article] [PubMed] [Google Scholar]
- Anastassiadis S.; Morgunov I. G. Gluconic acid production. Recent Pat Biotechnol 2007, 1 (2), 167–180. 10.2174/187220807780809472. [DOI] [PubMed] [Google Scholar]
- Ament Z.; Bevers M. B.; Wolcott Z.; Kimberly W. T.; Acharjee A. Uric Acid and Gluconic Acid as Predictors of Hyperglycemia and Cytotoxic Injury after Stroke. Transl Stroke Res. 2021, 12 (2), 293–302. 10.1007/s12975-020-00862-5. [DOI] [PMC free article] [PubMed] [Google Scholar]
- Kijpaisalratana N.; Ament Z.; Patki A.; Bhave V. M.; Garcia-Guarniz A. L.; Judd S. E.; Cushman M.; Long D. L.; Irvin M. R.; Kimberly W. T. Association of Circulating Metabolites With Racial Disparities in Hypertension and Stroke in the REGARDS Study. Neurology 2023, 100 (22), e2312–e2320. 10.1212/WNL.0000000000207264. [DOI] [PMC free article] [PubMed] [Google Scholar]
- Tascanov M. B.; Tanriverdi Z.; Gungoren F.; et al. Comparisons of Microbiota-Generated Metabolites in Patients with Young and Elderly Acute Coronary Syndrome. Anatol J. Cardiol 2020, 24 (3), 175–182. 10.14744/AnatolJCardiol.2020.47995. [DOI] [PMC free article] [PubMed] [Google Scholar]
Associated Data
This section collects any data citations, data availability statements, or supplementary materials included in this article.
Supplementary Materials
Data Availability Statement
The data sets used and/or analyzed during the current study are available from the corresponding author on reasonable request.