

Abstract
The Channelized Hotelling observer (CHO) is well correlated with human observer performance in many CT detection/classification tasks but has not been widely adopted in routine CT quality control and performance evaluation, mainly because of the lack of an easily available, efficient, and validated software tool. We developed a highly automated solution – CT image quality evaluation and Protocol Optimization (CTPro), a web-based software platform that includes CHO and other traditional image quality assessment tools such as modulation transfer function and noise power spectrum. This tool can allow easy access to the CHO for both the research and clinical community and enable efficient, accurate image quality evaluation without the need of installing additional software. Its application was demonstrated by comparing the low-contrast detectability on a clinical photon-counting-detector (PCD)-CT with a traditional energy-integrating-detector (EID)-CT, which showed UHR-T3D had 6.2% higher d’ than EID-CT with IR (p = 0.047) and 4.1% lower d’ without IR (p = 0.122).
Keywords: low-contrast detectability, channelized Hotelling observer (CHO), image quality assessment, protocol optimization, web-based software platform
1. Introduction
It is important to perform accurate assessment of low-contrast detectability in CT quality control and performance evaluation [1]. The gold standard for image quality evaluation is a human observer study, but it is highly resource-demanding and time-consuming. To overcome these limitations, model observers were introduced to evaluate detectability and designed to correlate closely with the detection performances of human observers for task-based image quality assessment [2]. Among these methods, because of the good correlation with human observer performance in detection, classification and localization tasks in clinical CT [3–8], tremendous progress towards task-based image quality assessment using channelized Hotelling observer (CHO) has been made during the past decade [9, 10]. However, CHO has not been adopted in routine CT quality control and performance evaluation, mainly because of two reasons. First, it requires a large number of repeated scans (in the range of one hundred separate scans) to make sure the results are precise and accurate. Second, there has been a lack of accessibility to an efficient and validated software tool.
To address the above challenges, we have developed and optimized a CHO model that requires only 1-3 scans in a quality control setting [11] [12]. Based on this optimized CHO model and our previous extensive validation studies [3–8], we have developed a web-based software platform for CT image quality assessment and protocol optimization (CTPro). The validated CHO method, along with other common image quality assessment tools, was made readily accessible through this web platform for clinical users and researchers.
2. Methods
2.1. An Optimized CHO Model
In our previous work, the CHO method was optimized on the ACR phantom for routine CT quality control and achieved accurate low-contrast detectability estimates with only 1-3 repeat scans. The model was optimized by using multiple low-contrast objects, multiple slices per objects along the z-direction, and selected channel filters adaptive to the low-contrast objects [11]. The robustness of the model was validated against independent measurements in repeatability tests on multiple scanner models [12].
2.2. Design of the CTPro website and its architecture
Figure 1 shows the overall design of the CTPro web software platform, which consists of 5 major sections: software, database, use cases, user guide, and about information. Figure 2 shows the architecture of the website, which constitutes three major parts: frontend, back-end, and database.
Figure 1.

Overall design of the CTPro web software platform.
Figure 2.

The role of frontend website, backend, and database for software modules of image quality metric and database query, where the users select either images from our CTPro database or upload their own DICOM images, query the database, run image quality metric calculation function, and visualize the results on the webpage.
We selected JavaScript for our frontend website design with ReactJS library to build the user interface, Cornerstone DICOM viewer to display the images, and Plotly to show charts. The entire backend is written in Python with Flask as the micro web framework. The backend not only enables the interactive user interface, but also contains the image quality evaluation software and handles data query from the database. A MySQL database is set up on Google Cloud to store the image-related information and evaluation results for different IQ metrics, scanners, dose levels, reconstruction methods, etc, while the images are stored on Google Cloud Storage. It currently provides 4 software modules for objective assessment of CT image quality: CHO, Modulation Transfer Function (MTF), Noise Power Spectrum (NPS), and a module to automate quality control reporting for the ACR phantom and eliminate the need for most manual inputs. The user can retrieve the data from the MySQL database of this platform for visualizing the original images and comparing the evaluation results for different scan modes, image types and reconstruction methods. The platform also allows users to upload data from their local workstation for image quality assessments. Default settings are specified for each module, but users are also allowed to fine-tune important parameters before running the calculation of image quality assessment and protocol optimization. A major advantage of the web-based platform is its accessibility: any user using a web browser can access and run CTPro modules without the need of installing additional software. The assessment results can be either saved locally or a database for future query from any other users who would like to compare performance across sites or scanner models.
The CHO software allows users to upload local images or query from the CTPro database. The backend program automatically selects the image slices and detects the in-plane locations of the low-contrast objects, and the users are allowed to adjust image slice range and fine-tune the object ROI locations and sizes. CHO calculation parameters are adjustable with default values provided based on the phantom. Two evaluation metrics, index of detectability (d’) and area under the ROC curve (AUC) are returned as outputs.
3. Low-contrast detectability evaluation on a PCD-CT
As an example, the CHO tool is used to compare the low-contrast detectability on a clinical photon-counting-detector (PCD)-CT with a traditional energy-integrating-detector (EID)-CT. The ACR phantom was scanned 3 times under ultra-high-resolution (UHR) scan mode at 12 mGy and reconstructed with threshold-low (T3D) mode and two kernels (FBP Br44 and IR Br44-3) on PCD-CT. Images were acquired at matched dose and reconstruction kernels on EID-CT.
3. Results
Figure 3(a) shows an example of CHO calculation, where the data can be loaded from the database or from the DICOM images on the user’s local workstation. The user could fine tune the CHO parameters (including type of channel filter, number of passbands, directions, and phases) before running the calculation. The results of d’ and AUC for the low-contrast objects at contrast of 6 HU are obtained after CHO calculation, which can be exported for further use. Figure 3(b) shows database query result with Siemens/Alpha PCD-CT/ACR phantom from the web-based CTPro platform on Python WebApp Server. The images were acquired with CTDIvol at 6 mGy, 144x0.4 mm collimation (SR scan mode), T1 for spectral information (T3D reconstruction mode), and with an IR reconstruction (QIR, Br44-3 kernel) from the query result. The user could visualize the phantom images with the DICOM information, and the index of detectability (d’)/area under the ROC curve (AUC) for the 6-, 5-, and 4-mm low-contrast objects. Detailed information of scan/reconstruction parameters for the phantom images and the CHO calculation parameters were also provided in this user interface.
Figure 3.

User interface of the CHO calculation module and database on the CTPro website. (a) The user interface of the CHO module displays the images and key DICOM information and calculates the index of detectability (d’) and area under the ROC curve (AUC) for the 6-, 5-, and 4-mm low-contrast objects of the ACR phantom. (b) Image data query from CTPro database. The images were selected with Siemens Alpha PCD-CT, ACR phantom, CTDIvol at 6 mGy, 144x0.4 mm collimation (SR scan mode), T1 for spectral information (T3D reconstruction mode), and with an IR reconstruction (QIR, Br44-3 kernel).
Examples of NPS and MTF module calculation are shown in Figure 4(a) and 4(b), respectively, where the user could load data from database or local DICOM files for calculation and then export the results.
Figure 4.

Examples of (a) MTF module and (b) NPS module.
Figure 5(a) shows example images of the ACR low-contrast module from the standard resolution (SR, 144x0.4 mm collimation) and ultra-high-resolution (UHR, 120x0.2 mm) scans modes combined with threshold-low (T3D) and virtual-monoenergetic-image at 70 keV reconstruction modes on PCD-CT at 12 mGy with both FBP (Br44) and IR (Br44-3) reconstructions, along with the EID-CT images at matched dose and reconstruction methods. Ensemble average image of EID-CT with IR and PCD-CT UHR-T3D with IR are displayed with the signal (red) and background ROIs (blue and yellow). CHO-based index of detectability (d’) values were automatically calculated for the four scan-reconstruction modes on PCD-CT (SR-T3D, SR-70keV, UHR-T3D, and UHR-70keV) and EID-CT with both FBP and IR reconstructions, using the software platform. The d’ distribution came from 10 independent d’ measurements with repositioning of the ACR phantom.
Figure 5.
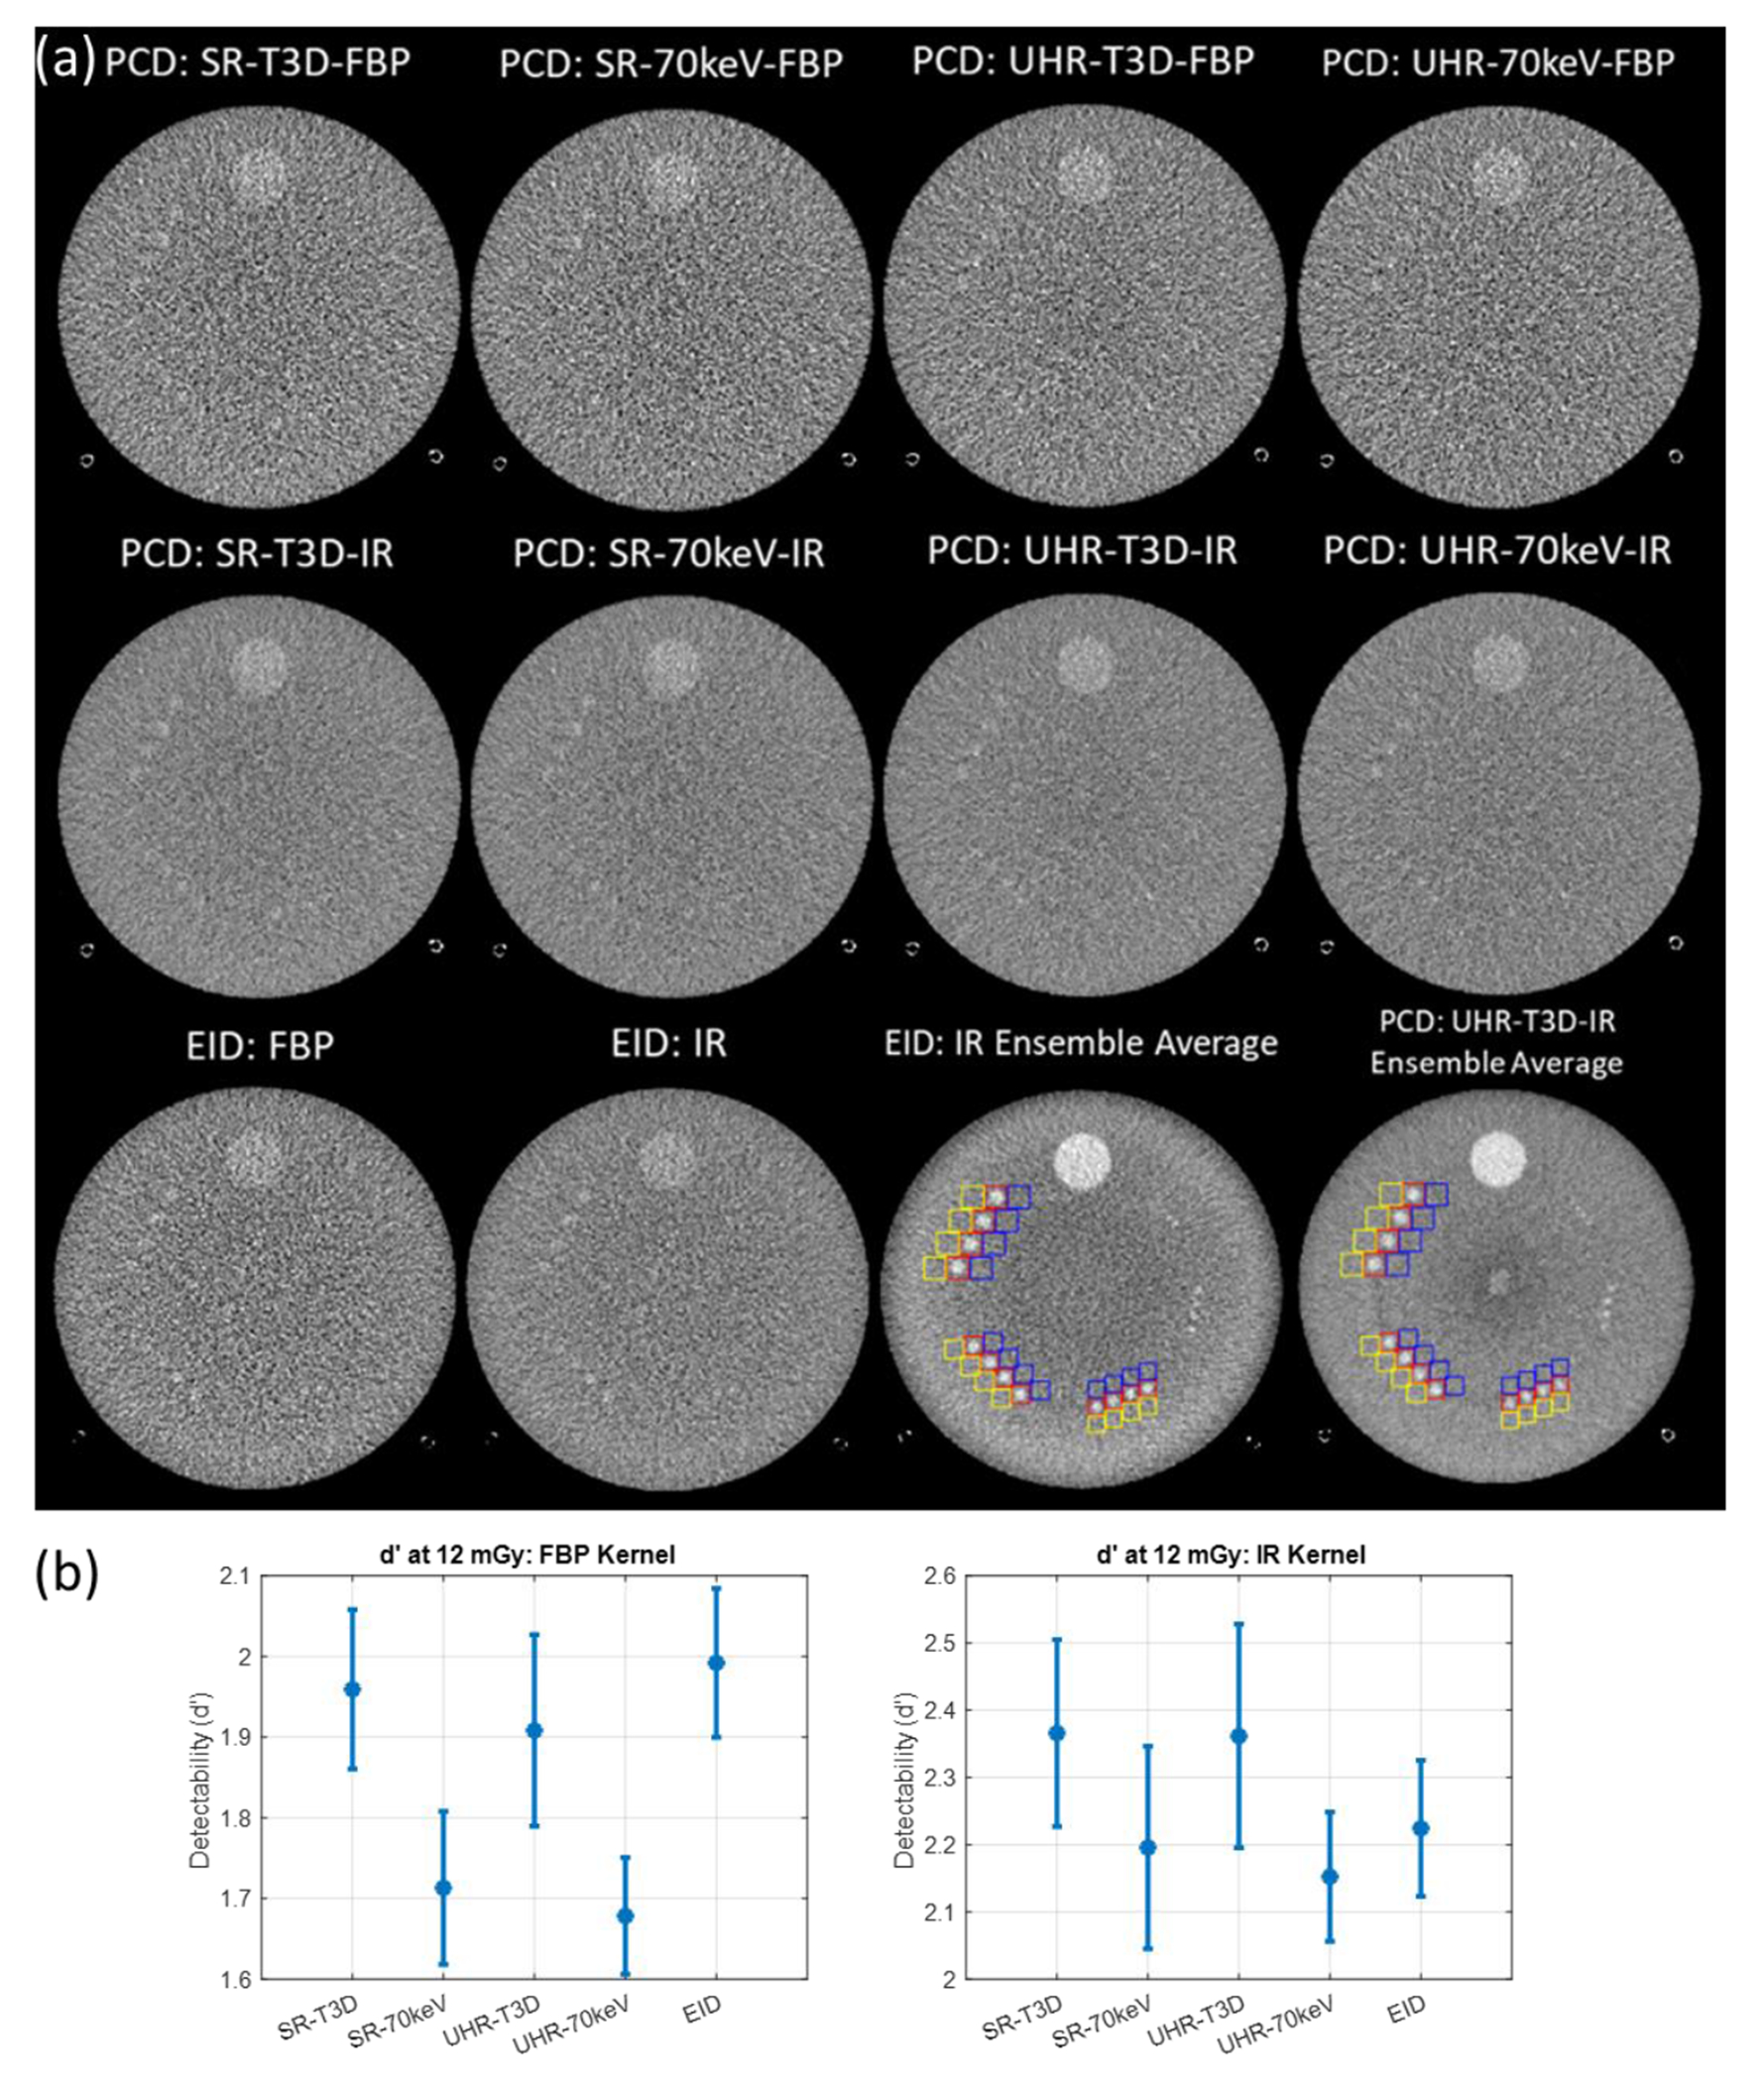
(a) Example images of the ACR low-contrast module from the standard resolution (SR, 144x0.4 mm collimation) and ultra-high-resolution (UHR, 120x0.2 mm) scans modes combined with threshold-low (T3D) and virtual-monoenergetic-image at 70 keV reconstruction modes on PCD-CT at 12 mGy with IR (Br44-3) reconstructions, along with the EID-CT images at matched dose and reconstruction methods. Ensemble average image of EID-CT with IR and PCD-CT UHR-T3D with IR are displayed with the signal (red) and background ROIs (blue and yellow). (b) d’ for the four scan-reconstruction modes on PCD-CT (SR-T3D, SR-70keV, UHR-T3D, and UHR-70keV) and EID-CT with both FBP and IR reconstructions. The d’ distribution came from 10 independent d’ measurements with repositioning of the ACR phantom.
4. Conclusions
This work introduces a web-based software platform CTPro, where various image quality assessment tools are easily accessible for clinical users and researchers without the need of installing additional software. Its application was demonstrated by comparing the low-contrast detectability on a clinical photon-counting-detector (PCD)-CT with a traditional energy-integrating-detector (EID)-CT, which showed UHR-T3D had 6.2% higher d’ than EID-CT with IR (p = 0.047) and 4.1% lower d’ without IR (p = 0.122).
Acknowledgement
Research reported in this work was supported by the National Institutes of Health under award number U24 EB028936 and R01 EB028590. The content is solely the responsibility of the authors and does not necessarily represent the official views of the National Institute of Health.
References
- 1.Mileto A, et al. , State of the Art in Abdominal CT: The Limits of Iterative Reconstruction Algorithms. Radiology, 2019. 293(3): p. 491–503. [DOI] [PubMed] [Google Scholar]
- 2.Noferini L, et al. , CT image quality assessment by a Channelized Hotelling Observer (CHO): Application to protocol optimization. Physica Medica-European Journal of Medical Physics, 2016. 32(12): p. 1717–1723. [DOI] [PubMed] [Google Scholar]
- 3.Yu LF, et al. , Prediction of human observer performance in a 2-alternative forced choice low-contrast detection task using channelized Hotelling observer: Impact of radiation dose and reconstruction algorithms. Medical Physics, 2013. 40(4). [DOI] [PMC free article] [PubMed] [Google Scholar]
- 4.Leng S, et al. , Correlation between model observer and human observer performance in CT imaging when lesion location is uncertain. Medical Physics, 2013. 40(8). [DOI] [PMC free article] [PubMed] [Google Scholar]
- 5.Zhang Y, et al. , Correlation between human and model observer performance for discrimination task in CT. Physics in Medicine and Biology, 2014. 59(13): p. 3389–3404. [DOI] [PMC free article] [PubMed] [Google Scholar]
- 6.Yu LF, et al. , Correlation between a 2D channelized Hotelling observer and human observers in a low-contrast detection task with multislice reading in CT. Medical Physics, 2017. 44(8): p. 3990–3999. [DOI] [PMC free article] [PubMed] [Google Scholar]
- 7.Dilger SKN, et al. , Localization of liver lesions in abdominal CT imaging: I. Correlation of human observer performance between anatomical and uniform backgrounds. Physics in Medicine and Biology, 2019. 64(10). [DOI] [PMC free article] [PubMed] [Google Scholar]
- 8.Dilger SKN, et al. , Localization of liver lesions in abdominal CT imaging: II. Mathematical model observer performance correlates with human observer performance for localization of liver lesions in abdominal CT imaging. Physics in Medicine and Biology, 2019. 64(10). [DOI] [PMC free article] [PubMed] [Google Scholar]
- 9.Ma C, et al. , Impact of number of repeated scans on model observer performance for a low-contrast detection task in computed tomography. J Med Imaging (Bellingham), 2016. 3(2): p. 023504. [DOI] [PMC free article] [PubMed] [Google Scholar]
- 10.Favazza CP, et al. , Use of a channelized Hotelling observer to assess CT image quality and optimize dose reduction for iteratively reconstructed images. J Med Imaging (Bellingham), 2017. 4(3): p. 031213. [DOI] [PMC free article] [PubMed] [Google Scholar]
- 11.Fan MD, et al. , Accurate and efficient measurement of channelized Hotelling observer-based low-contrast detectability on the ACR CT accreditation phantom. Medical Physics, 2023. 50(2): p. 737–749. [DOI] [PMC free article] [PubMed] [Google Scholar]
- 12.Fan M, et al. , Accurate and efficient measurement of channelized Hotelling observer-based low-contrast detectability on the ACR CT accreditation phantom: Part II. Repeatability study. Medical Physics (In press), 2023. [DOI] [PMC free article] [PubMed] [Google Scholar]