Abstract
Anion exchanger 1 (AE1), a member of the solute carrier (SLC) family, is the primary bicarbonate transporter in erythrocytes, regulating pH levels and CO2 transport between lungs and tissues. Previous studies characterized its role in erythrocyte structure and provided insight into transport regulation. However, key questions remain regarding substrate binding and transport, mechanisms of drug inhibition and modulation by membrane components. Here we present seven cryo-EM structures in apo, bicarbonate-bound and inhibitor-bound states. These, combined with uptake and computational studies, reveal important molecular features of substrate recognition and transport, and illuminate sterol binding sites, to elucidate distinct inhibitory mechanisms of research chemicals and prescription drugs. We further probe the substrate binding site via structure-based ligand screening, identifying an AE1 inhibitor. Together, our findings provide insight into mechanisms of solute carrier transport and inhibition.
AE1, or SLC4A1, is one of nine bicarbonate transporters in the solute carrier (SLC)4 family of membrane proteins that help regulate cellular pH in virtually all tissues. AE1 is a critical transporter in erythrocytes, where it shuttles CO2 between lungs and other tissues via bicarbonate transport, and contributes to the structural integrity of erythrocytes through interactions with the cytoskeleton1. The extracellular surface of AE1 binds antibodies of the Diego antigen system, a blood group of 21 antigens that can cause potentially fatal hemolytic disease of the newborn2. Antibodies produced by the mother can bind epitopes on AE1, thereby attacking erythrocytes of the fetus or the newborn3. Other mutations can disrupt AE1 structure and/or transport, resulting in red blood cell deformities and kidney disease, such as renal acidosis, due to the role of the transporter in renal proton secretion4,5.
AE1 consists of an N-terminal cytoplasmic domain (cdAE1), which binds the cytoskeleton, and a C-terminal membrane domain (mdAE1), which mediates substrate transport. AE1 is thought to serve as a hub on the erythrocyte plasma membrane, forming complexes with enzymes and effectors involved in a variety of processes in erythrocyte biology6,7. Recent structures of the ankyrin complex have uncovered much of the overall architecture of this complex within the erythrocyte membrane, revealing detailed interactions with rhesus proteins, glycophorins and even the water channel aquaporin-1 (refs. 8,9). By comparison however, mdAE1, the functional site of electroneutral Cl−/HCO3− exchange, remains poorly understood. mdAE1 contains an anion binding site, which can accommodate HCO3− and Cl−, but also other ions, such as sulfate or oxalate5. The precise nature of the binding site and the molecular details about how different residues coordinate the distinct ions are still unknown4. Furthermore, a diverse collection of chemical compounds, including several clinical drugs, has been shown to inhibit AE1, but the distinct mechanisms by which these compounds inhibit AE1 have been limited to early NMR studies of substrate binding5,10–13.
Although several studies have provided insight into the roles of specific residues in the transport and inhibition of the transporter, key questions regarding inhibitory modes and their molecular mechanisms remain. Answers have been elusive due to the absence of high-resolution structural insight into AE1, which has been limited to a low-resolution crystal structure of mdAE1 bound to a stilbene inhibitor14, as well as several ankyrin complex structures in the apo state8,9. Herein, we report seven AE1 cryo-EM structures at resolutions ranging between 2.95 and 3.37 Å. Our studies not only allow for the unambiguous characterization of how lipids, sterols, substrates and inhibitors bind to the ion-transporting AE1 membrane domain, but also lead to the generation of an AE1 inhibitor series using structure-based ligand discovery.
Results
Structure determination of full-length human AE1
Cryo-EM studies were carried out using the full-length human AE1 purified from Sf9 insect cells, and complexed with inhibitors, substrate or in the ‘apo’ state (Extended Data Figs. 1–4 and Table 1) (see Methods for details). Core areas of the structures reach local resolutions as high as 2.5 Å, as calculated by local resolution estimation in cryoSPARC, and reveal distinct lipid and sterol binding sites (Fig. 1 and Extended Data Fig. 1a,b).
Table 1 |.
Cryo-EM data collection, refinement and validation statistics
| AE1-apo (EMD-26165) (PDB 7TY4) |
AE1-bicarbonate (EMD-26168) (PDB 7TY7) |
AE1-DIDS (EMD-41082) (PDB 8T6V) |
AE1-H2DIDS (EMD-26167) (PDB 7TY6) |
AE1-DEPC (EMD-26171) (PDB 7TYA) |
AE1-dipyridamole (EMD-41081) (PDB 8T6U) |
AE1-NIF (EMD-26169) (PDB 7TY8) |
|
|---|---|---|---|---|---|---|---|
| Data collection and processing | |||||||
| Magnification | 64,000 | 64,000 | 81,000 | 64,000 | 81,000 | 64,000 | 64,000 |
| Voltage (kV) | 300 | 300 | 300 | 300 | 300 | 300 | 300 |
| Electron exposure (e−/Å2) | 51.85 | 59.99 | 52.09 | 51.85 | 51.18 | 51.69 | 59.99 |
| Defocus range (μm) | −0.5 to −1.8 | −0.5 to −1.8 | −0.5 to −1.8 | −0.5 to −1.8 | −0.5 to −1.8 | −0.5 to −1.8 | −0.5 to −1.8 |
| Pixel size (Å) | 1.076 | 1.076 | 1.083 | 1.076 | 1.083 | 1.076 | 1.076 |
| Symmetry imposed | C2 | C2 | C2 | C2 | C2 | C2 | C2 |
| Initial particle images (no.) | 4,357,888 | 2,660,401 | 9,728,456 | 2,460,255 | 3,156,841 | 4,488,247 | 2,977,492 |
| Final particle images (no.) | 238,474 | 173,471 | 914,784 | 267,008 | 191,625 | 270,791 | 79,981 |
| Map resolution (Å) | 2.99 | 3.37 | 2.95 | 2.98 | 3.07 | 3.13 | 3.18 |
| FSC threshold | 0.143 | 0.143 | 0.143 | 0.143 | 0.143 | 0.143 | 0.143 |
| Map sharpening B-factor (Å2) | −150.0 | −150.4 | −187.0 | −121.2 | −128.7 | −115.3 | −107.4 |
| Local resolution range (Å) | 2.5–45.6 | 3.0–50.5 | 2.5–10.1 | 2.5–40.9 | 2.7–36.2 | 2.7–28.2 | 2.7–51.5 |
| Refinement | |||||||
| Model composition | |||||||
| Non-hydrogen atoms | 8,665 | 8,584 | 8,686 | 8,728 | 8,674 | 8,647 | 8,578 |
| Protein residues | 1,032 | 1,034 | 1,032 | 1,032 | 1,028 | 1,032 | 1,032 |
| Ligand | 14 | 15 | 16 | 16 | 16 | 16 | 16 |
| R.m.s. deviations | |||||||
| Bond lengths (Å) | 0.014 | 0.013 | 0.025 | 0.013 | 0.027 | 0.010 | 0.013 |
| Bond angles (°) | 1.644 | 1.637 | 1.731 | 1.644 | 1.966 | 1.370 | 1.649 |
| Validation | |||||||
| Clashscore | 3.32 | 2.71 | 2.36 | 3.03 | 3.28 | 5.69 | 3.10 |
| Poor rotamers (%) | 0.49 | 1 | 0.33 | 1.44 | 0.22 | 0 | 1.89 |
| Ramachandran plot | |||||||
| Favored (%) | 95.02 | 94.43 | 97.07 | 94.82 | 96.05 | 97.07 | 95.8 |
| Allowed (%) | 4.98 | 5.57 | 2.93 | 5.18 | 3.95 | 2.73 | 4.20 |
| Disallowed (%) | 0 | 0 | 0 | 0 | 0 | 0.2 | 0 |
Fig. 1 |. Cryo-EM structure of full-length human AE1/SLC4A1.
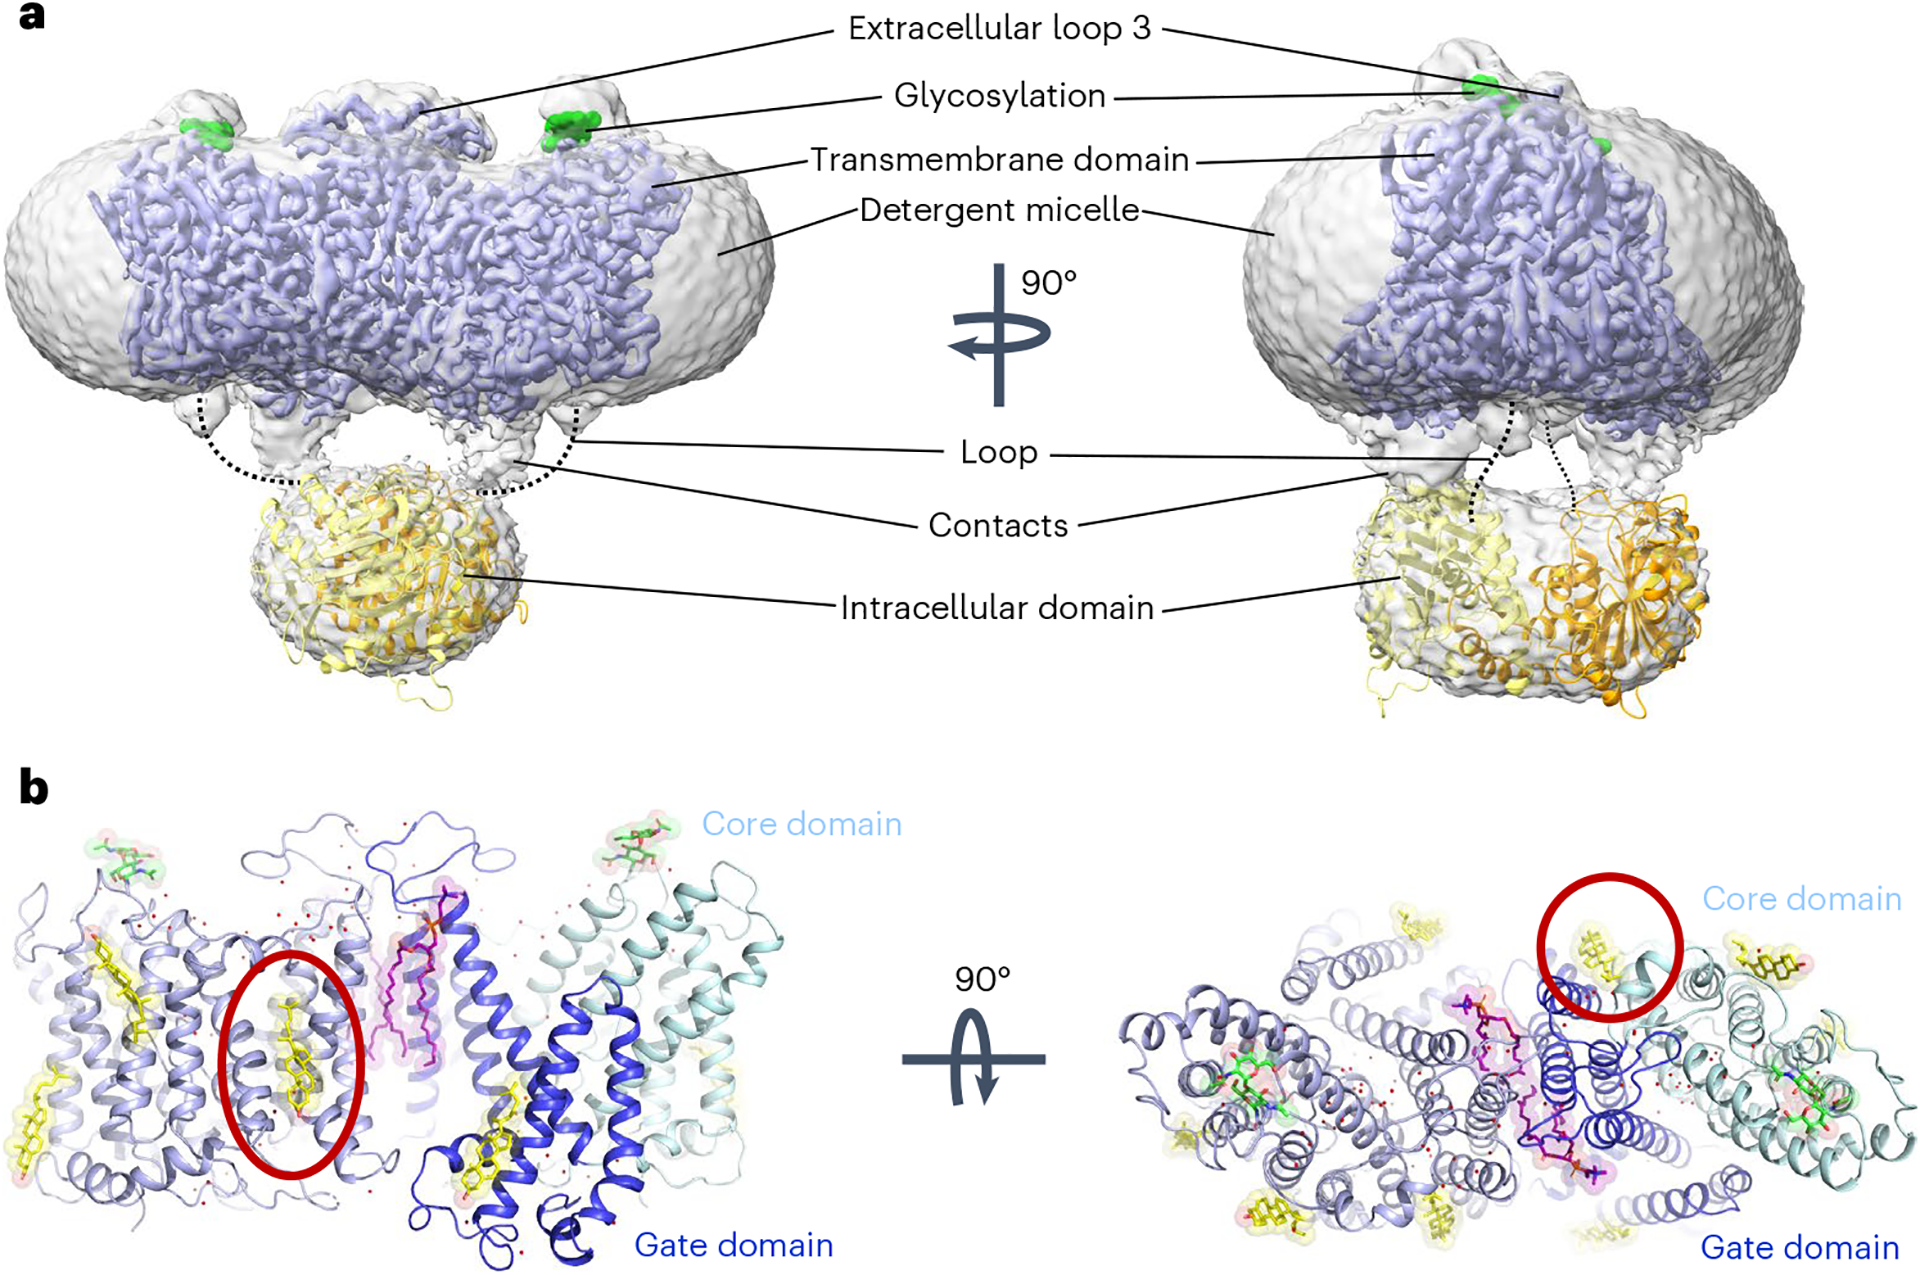
a, Cryo-EM density of overall AE1 homodimer and detergent micelle (gray), overlaid with density of the membrane domain of AE1 (mdAE1, light blue). Glycosylation sites are highlighted in green, and the crystal structure of the cytoplasmic domain (cdAE1, PDB 1HYN) homodimer (yellow/orange) is loosely fit into the density. Dotted lines highlight that the loop connecting cdAE1 and mdAE1 termini is in a different position from noncovalent contacts observed between the domains. b, mdAE1 structure (light blue) including bound phospholipids (purple) and cholesterol (yellow), glycosylation sites (green) and water molecules (red spheres). Gate and core domains of one of the protomers have been highlighted in dark blue and pale cyan, respectively. Presumed inhibitory cholesterol located between domains is encircled in red.
Our structures conform with known SLC4 architecture; two AE1 protomers form a homodimeric complex, with each protomer made up of 14 transmembrane (TM) helices that can be divided into a gate and a core domain (Fig. 1b). We observe the AE1 outward-facing state, as has previously been observed for this and related transporters8,9,14–16. The overall structural conformation of AE1 from Sf9 cells generated protein is nearly indistinguishable from that isolated from erythrocytes (Extended Data Fig. 1b), and, just like previous structures from native purification, now reveal the complete extracellular surface of the transporter. As seen before, we observe ordered extracellular loop regions, particularly extracellular loop 3, which is not stabilized by either disulfides or secondary structure elements (Fig. 1). We also observe glycosylation of N642, which, in agreement with previous studies17, does not appear to play an architectural or functional role in AE1 or the AE1–glycophorin complex8. While we do observe density for the cytosolic N-terminal domain (Fig. 1a), the resolution is too low to unambiguously fit previous structural data into our map18. The complete structure of the extracellular surface presented here allows us to map the position and architecture of all Diego blood group antigens located on AE1 (Extended Data Fig. 1c and Extended Data Table 1)19, detailing the molecular architecture of the epitopes targeted in various hemolytic diseases2,3,20.
We also observe density for multiple lipids and sterols in our structures. Two phospholipids appear bound within the dimer interface between mdAE1 protomers, with the head groups interacting with the extracellular side of AE1 (Fig. 1b and Extended Data Fig. 1b). This configuration is well in line with lipids bound to similar sites in the AE1–glycophorin complex and demonstrates their tight binding, being present in multiple detergent-solubilized structures. We were also able to unambiguously identify up to four cholesterol molecules per protomer in our AE1 structures. These findings are noticeably different from the AE1–glycophorin complex structure, which only appears to contain two cholesterols bound to each protomer. What is perhaps most striking is that a cholesterol molecule only observed in our structure is located at the interface of the gate and core domain between TM1 and TM7 (Fig. 1b and Extended Data Fig. 1b). Since substrate translocation relies on relative movements of these domains, cholesterol binding to this site could allosterically modulate the conformational changes required for transport and explain the inhibitory effect of cholesterol on AE1 reported by multiple groups21–23.
Elucidation of the AE1 bicarbonate binding site
To better understand the substrate binding mechanism and how ions are coordinated in the binding site, we determined structures of ‘apo’ and bicarbonate-bound AE1 (Fig. 2 and Extended Data Fig. 2). ‘Apo’ refers to AE1 purified in the presence of 100 mM chloride, the structure of which does not show any density for chloride near the presumed anion binding site or elsewhere. We suspect that the chloride concentration is insufficient to saturate the binding site. In contrast, AE1 purified in the presence of 100 mM sodium bicarbonate in a chloride-free buffer (Methods) showed strong electron density attributed to bicarbonate (Extended Data Fig. 5a). To our knowledge, our near-atomic resolution structure is the first structure of any human SLC4 transporter to reveal the precise binding site of a substrate. In both ‘apo’ and bicarbonate-bound structures, AE1 appears in the outward-facing state as observed in all previous SLC4 structures, with a channel-like cavity that connects the extracellular site to a positively charged cation selectivity filter/anion binding site near the ends of TM3 and TM10 (Fig. 2)4,24. Density for bicarbonate is located near R730, which has previously been implicated in transport4,14,24, and the coordination of bicarbonate in the binding pocket of AE1 is reminiscent of that of uracil bound to the SLC26 UraA transporter (Extended Data Fig. 5b)25 and distinct from sodium bicarbonate bound to rat NDCBE (SLC4A8) (Extended Data Fig. 5c,d)16. The negatively charged bicarbonate ion is bound in a small 23-Å3 pocket that is less than 3 Å from the side chain of R730, indicating a strong ionic interaction (Fig. 2). We observe weaker interactions between bicarbonate and backbone amide bonds in TM10, which was suggested as a positive dipole that can provide binding sites for anions4. Estimating the relative binding energy contributions of nearby residues in AMBER26 suggests that bicarbonate does not interact with residues at the N-terminal end of TM3, the other proposed dipole of the anion binding site (Extended Data Table 2). Moreover, while the R730 side chain is the key anchor, backbone interactions with T727, T728 and V729 contribute substantially to bicarbonate binding. Using simulated annealing of chemical potential (SACP) simulations27, we computationally estimate an apparent bicarbonate dissociation constant Kd of 1.6 mM for this site, which is similar to flux studies in erythrocytes that estimated a Kd of 2 mM (ref. 28), and NMR studies that estimated a Kd of 5.4 mM (ref. 13).
Fig. 2 |. Structural insight into bicarbonate binding at AE1.
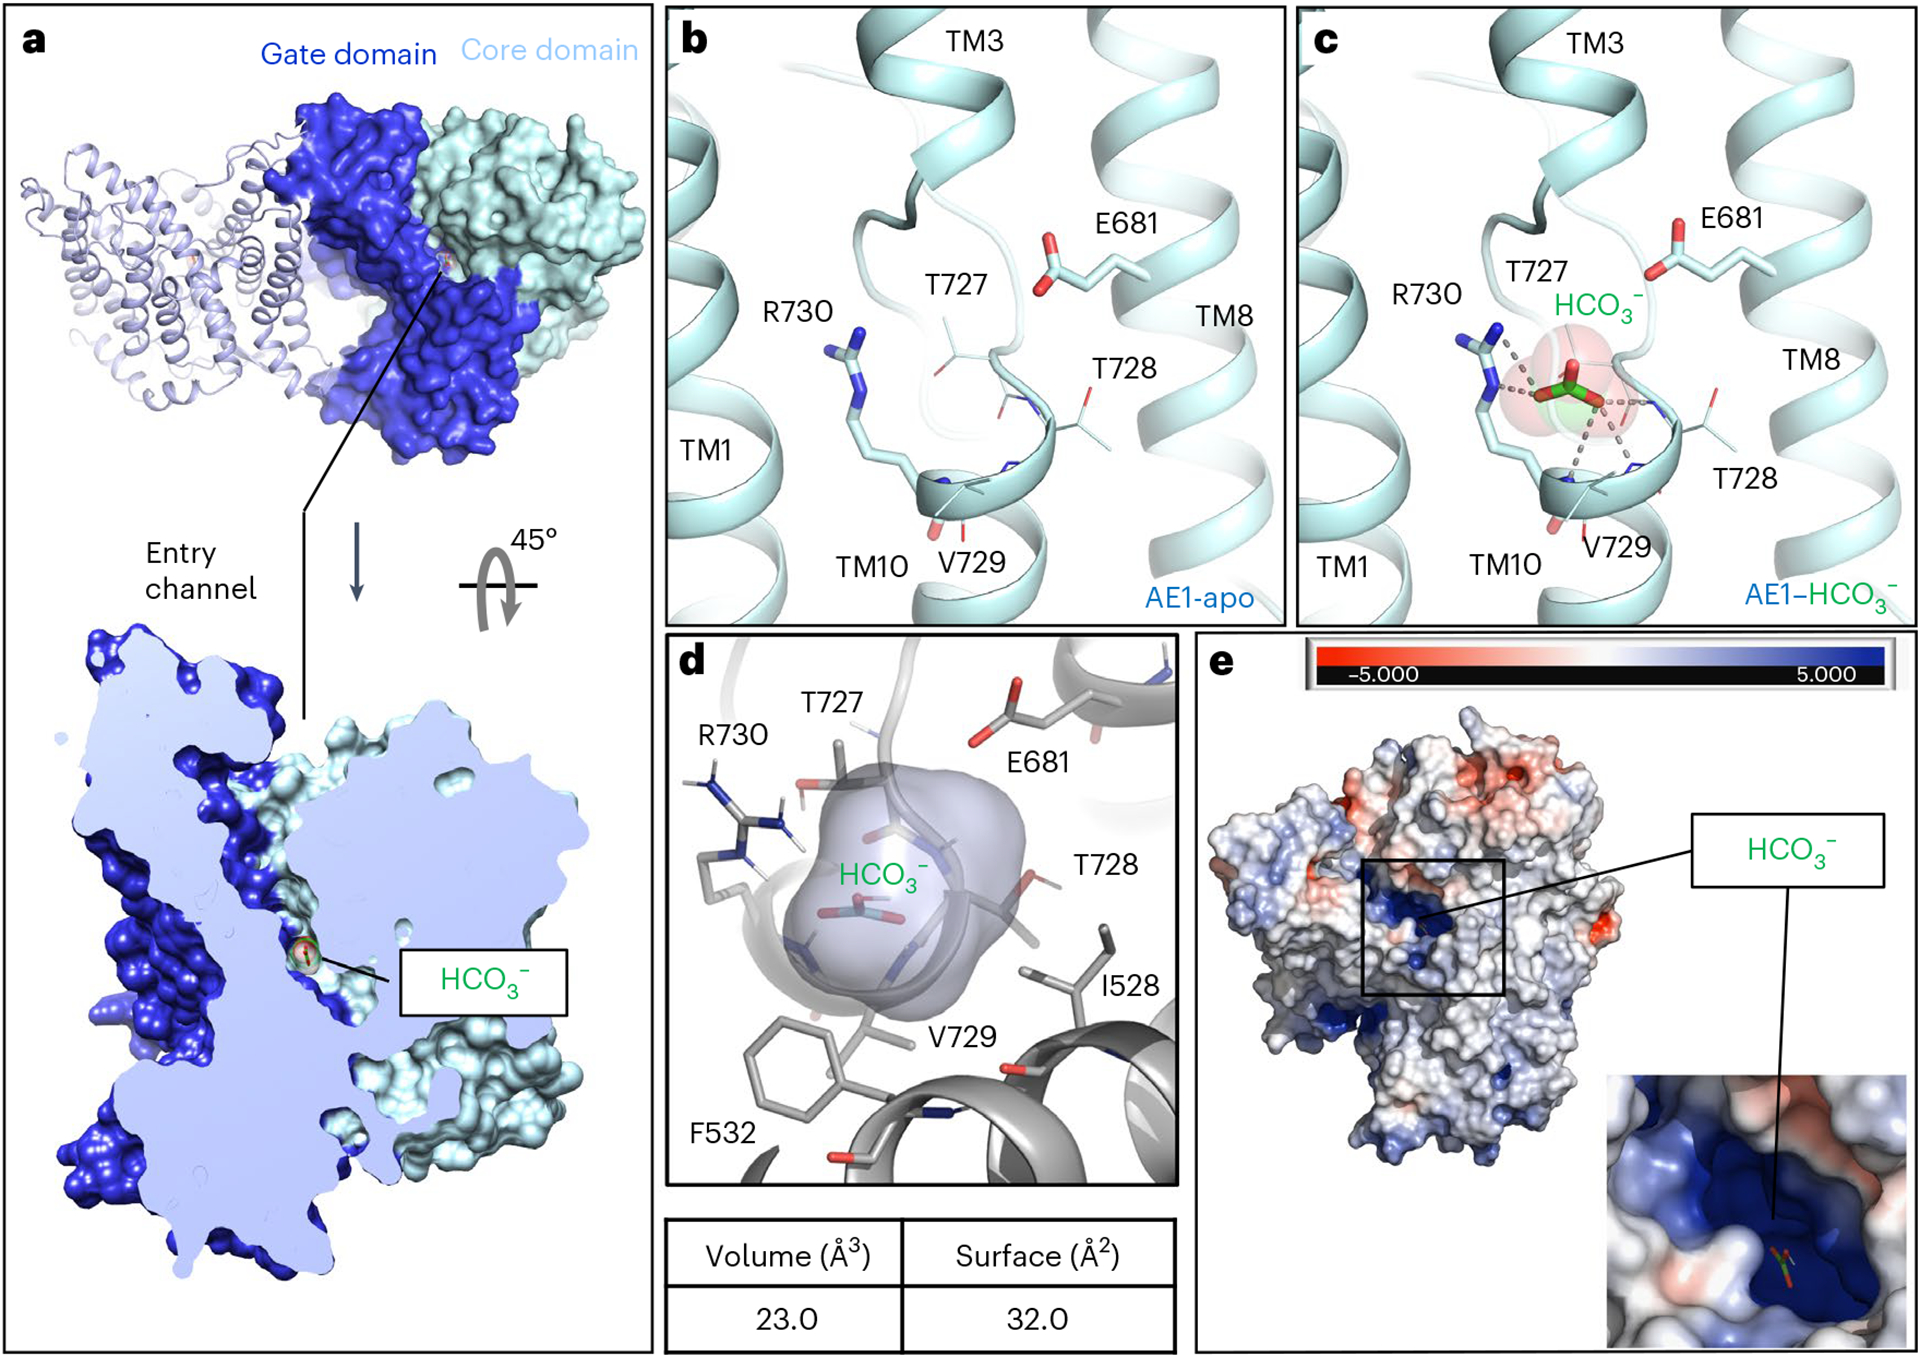
a, Extracellular view of mdAE1 homodimer (top) and cut-site view of monomer (bottom). Gate and core domains are shown in dark blue and pale cyan, respectively, and bound bicarbonate is shown in green. b,c, Close-up of anion binding site in apo (b) and bicarbonate-bound (c) AE1 structures with highlighted key residues. d, Calculation of bicarbonate binding site volume and surface using POVME3 (ref. 56). e, Extracellular view of mdAE1 colored by charge distribution highlighting positively (blue) and negatively (red) charged surfaces.
Located just below the bicarbonate binding site within mdAE1, we observe a cavity formed by TM5, TM8, TM10 and TM12 between the core and gate domains of AE1 (Extended Data Fig. 5e,f). This cavity is lined with two serines and constrained by R694 at the cytoplasmic side. These properties and the proximity to bicarbonate suggest that this cavity could expand to become part of a putative substrate exit tunnel in an inward-facing state. In fact, our SACP simulations identify a second bicarbonate binding site in which the anion binds to R694 and S525 (Extended Data Fig. 5e), providing further evidence for this proposed exit path.
Molecular mechanisms of transport inhibition
To investigate the structural basis of how different compounds inhibit SLC4-mediated substrate transport, we next determined several structures of AE1 bound to different inhibitors, including two clinical drugs (Fig. 3 and Extended Data Fig. 6).
Fig. 3 |. Structure of AE1 bound to chemically and pharmacologically diverse inhibitors.
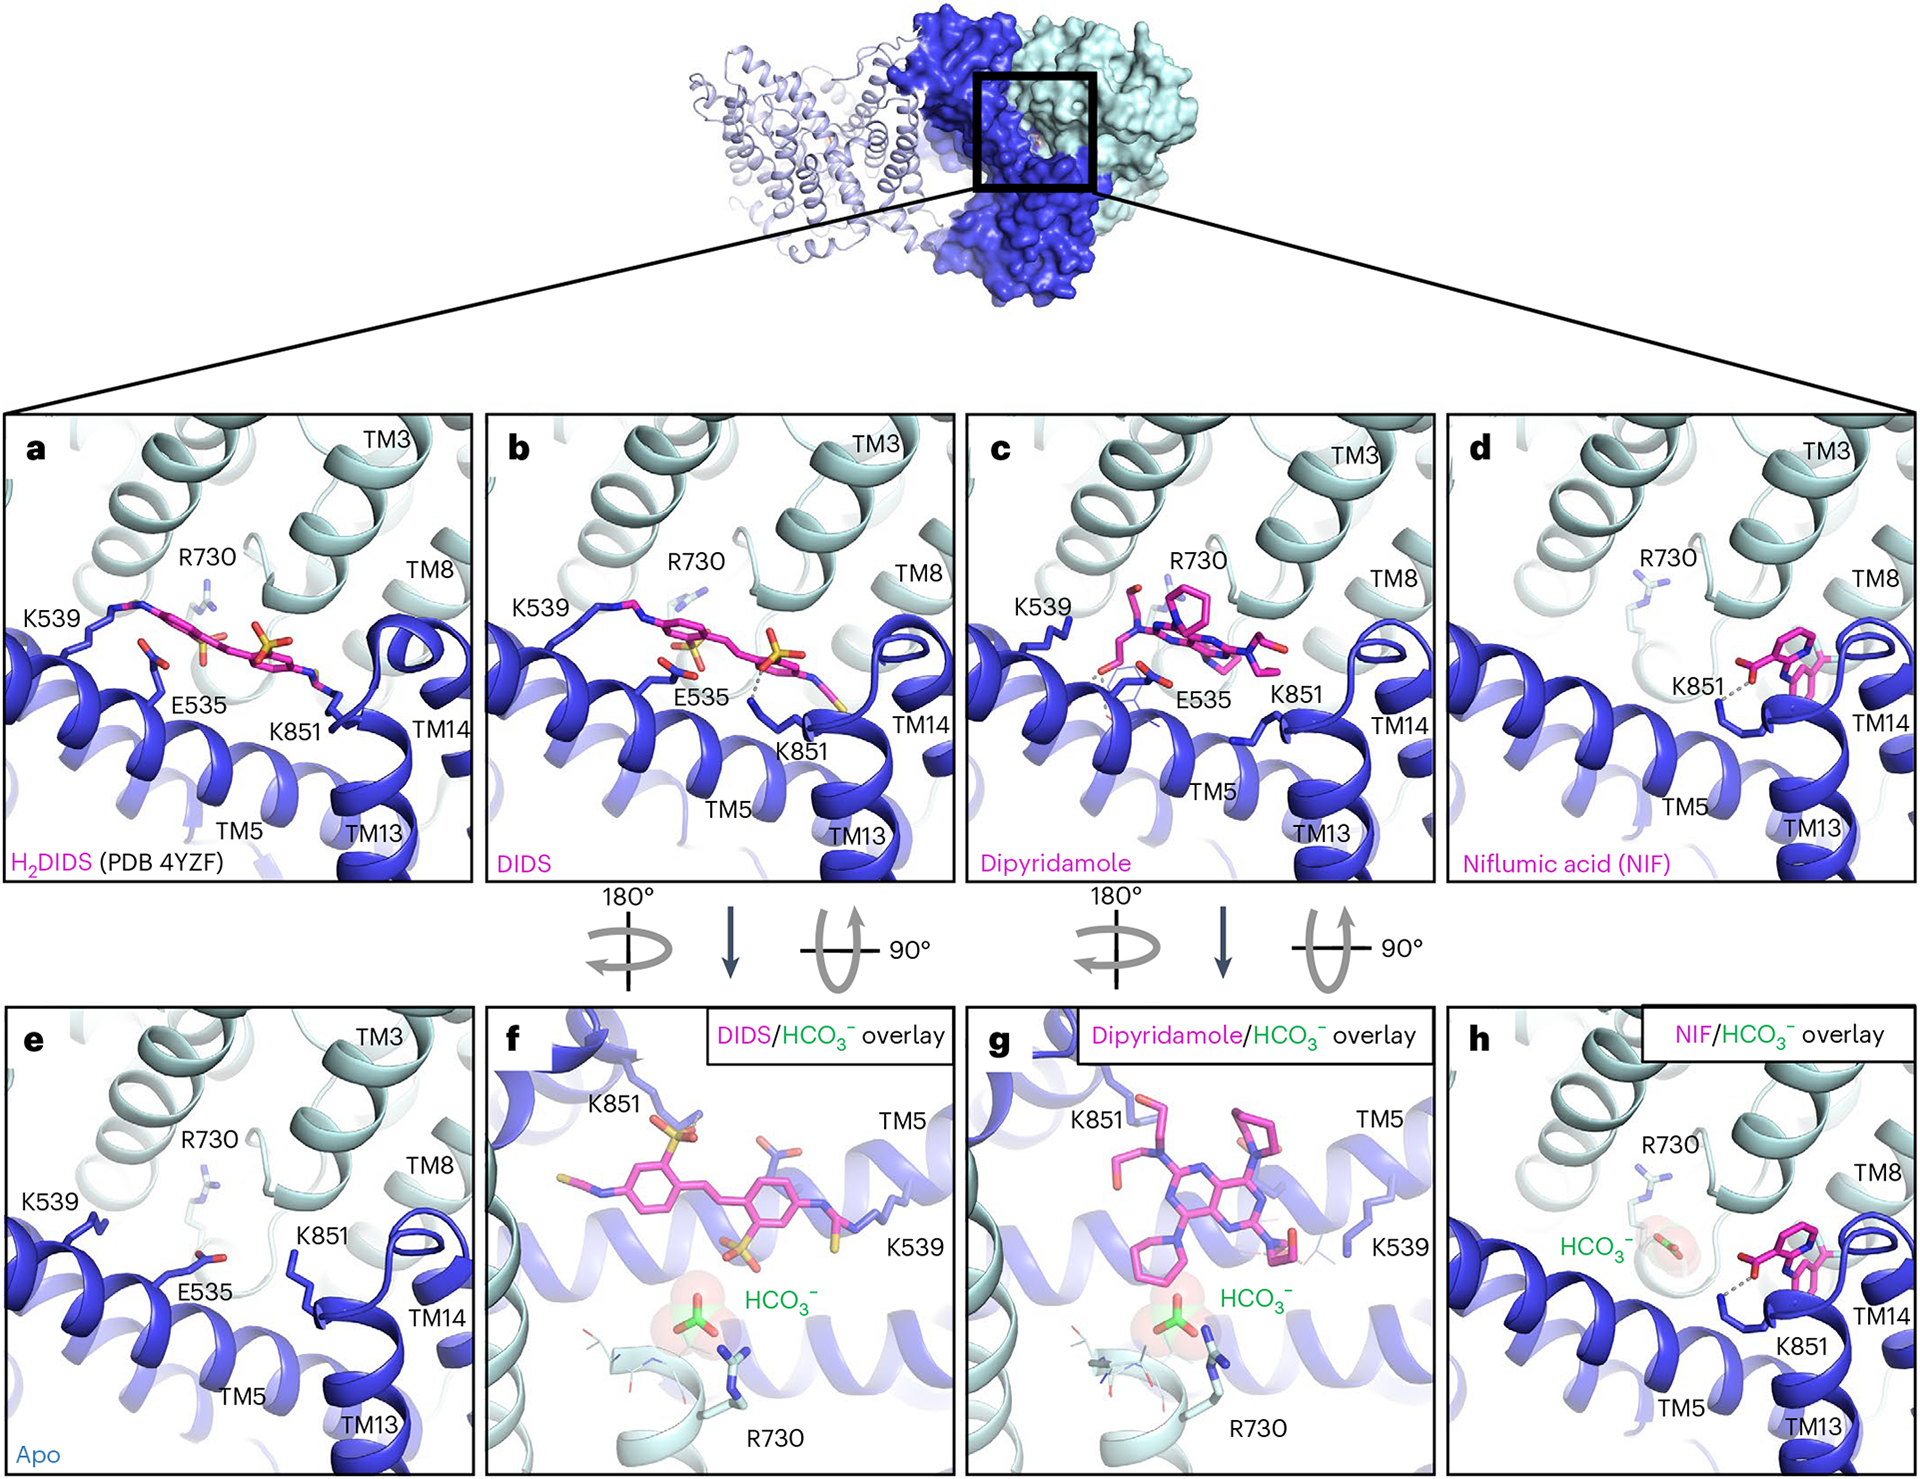
a, Previous mdAE1–H2DIDS crystal structure (PDB 4YZF)14 showing likely covalent binding of H2DIDS (magenta) to K539 and K851. b–e, Cryo-EM structures of AE1 bound to DIDS (b), dipyridamole (c), NIF (d) or apo state (e) reveal the binding location and pose of inhibitors (magenta). f–h, Overlay with bicarbonate-bound AE1 structure (green) shows that DIDS (f) and dipyridamole (g) restrict access to the anion binding site, while NIF (h) binds in a different location and leaves access to the anion binding site unobstructed. Ionic interactions and hydrogen bonds are shown as dotted lines. Gate and core domains are shown in dark blue and pale cyan, respectively.
Inhibition through competition for substrate binding.
The stilbene compound H2DIDS (4,4′-diisothiocyano-2,2′-dihydrostilbenedisulfonic acid) was used to obtain the previously published mdAE1 structure and appears to be covalently linked to both K539 in TM5 and K851 in TM13 (ref. 14). According to previous studies, both lysines are covalently bound at 37 °C and pH 9.5, while lower pH prevented linkage of K851 (ref. 29). Due to some poorly defined electron density in the lower resolution mdAE1–H2DIDS crystal structure14, there indeed remains some ambiguity regarding the bond with K851. We thus investigated transporter binding by stilbene inhibitors and determined sub-3-Å resolution structures of AE1–DIDS and AE1–H2DIDS formed under less alkaline conditions (pH 9, 22 °C) (Extended Data Figs. 1a and 3a). DIDS and H2DIDS differ only in the reduction of the central double bond, thus allowing us to examine whether steric hindrance would affect AE1 crosslinking. Structures of both AE1–DIDS and AE1–H2DIDS show covalent binding to K539 only, while K851 appears to form ionic interactions with the sulfonic acid group of stilbene (Fig. 3a,b and Extended Data Fig. 6b–d). These findings indicate that the previously reported rapid and reversible inhibition of SLC4 transporters by DIDS/H2DIDS30 could be due to ionic interactions with both lysines, as observed here for K851. We further reason that harsher conditions than we used are required to weaken these interactions and facilitate covalent binding to K851, indicating a higher pKa value for K851 as previously suggested4.
When compared with apo and bicarbonate-bound AE1, DIDS and H2DIDS are located in the access channel leading from the extracellular space to the buried anion binding site. We further observe that one of the sulfonic acid groups of stilbene is located less than 4 Å from the bicarbonate ion (Fig. 3f). These findings indicate that DIDS and H2DIDS probably compete with bicarbonate binding through charge repulsion, as there remains sufficient space to bind ions. Our findings thereby provide a structural explanation for NMR studies that showed that DIDS reduces substrate affinity10. It should be noted that previous studies investigated the substrate Cl−, not bicarbonate, but competition of both anions for the same site indicates a common or similar binding site13.
We next determined a 3.07-Å resolution structure of AE1 treated with diethyl pyrocarbonate (DEPC) (Extended Data Fig. 3b), which has been reported to inhibit transport and stilbene binding by stabilizing an inward-facing conformation via covalent modification of H834 (refs. 31,32). Surprisingly, our AE1–DEPC structure shows an outward-facing state, with no electron density accounting for a modified H834 side chain. Compared to the apo state, we instead observe that DEPC covalently modifies K539 and K851 (Extended Data Fig. 6e–h), indicating that modification of K851, rather than H834, might be an alternative explanation for the increased mass of an AE1 fragment observed in previous work31. Our observations, therefore, suggest that DEPC-mediated modification of K539 and K851 side chains sterically precludes H2DIDS binding rather than stabilizing an inward-facing state32. It should be noted, however, that previous work was done by treating ghost membranes for 30 minutes, compared to our use of treatment of detergent-solubilized AE1 overnight. We are thus unable to rule out whether this discrepancy could be due to the exposure of different AE1 states, or different reactivities of the side chains involved.
Inhibition through substrate channel blocking.
While DIDS reduces anion affinity10, other inhibitors have been described to only block access to the transport site11. One such inhibitor is the FDA-approved antiplatelet medicine dipyridamole, which has been shown to block AE1 substrate channels while not competing for anion binding11. To elucidate the different mechanisms by which stilbenes and dipyridamole inhibit transport, we determined a 3.13-Å resolution structure of AE1–dipyridamole (Fig. 3c and Extended Data Figs. 4a and 6l). This structure reveals that the drug occupies a similar site to DIDS and H2DIDS in the outward-facing transporter conformation. Specifically, dipyridamole stretches between the core and gate domain, where it forms hydrogen bonds with a backbone carbonyl in TM5 and S856 of TM3. One of the piperidine rings appears to stack in the dipole region between TM3 and TM10 towards E681 and closer to TM3. However, dipyridamole binding lacks the charge repulsion provided by the sulfonic acid group of the stilbene compounds, which probably explains why the compound does not compete for anion binding11 (Fig. 3g).
Inhibition of translocation.
Niflumic acid (NIF), an analgesic and anti-inflammatory drug used in the treatment of rheumatoid arthritis, is a voltage-gated chloride channel inhibitor33 that has previously been shown to inhibit AE1 substrate transport through a mechanism distinct from DIDS, H2DIDS or dipyridamole12. Specifically, studies have shown that NIF does not affect substrate affinity or access to the binding site, but instead inhibits transport by preventing transition between outward- and inward-facing states12. To investigate the molecular basis for this distinct pharmacology, we determined a 3.18-Å resolution cryo-EM structure of AE1–NIF (Extended Data Fig. 4b). Consistent with a different mechanism of action, we observe NIF bound to a different site than H2DIDS, DIDS and dipyridamole (Fig. 3d and Extended Data Fig. 7). NIF appears to be accommodated in a 138-Å3 sized pocket between the core and gate domains formed by TM3, TM8, TM13 and TM14 (Extended Data Fig. 7e), which overlaps only partially with the binding pose of dipyridamole and the nonattached isothiocyanate groups of DIDS/H2DIDS (Fig. 3). We also performed molecular docking, which provides further support for the unexpected binding pose and location of NIF (Extended Data Fig. 7b). NIF appears to be anchored by a salt bridge between its carboxylate group and K851, potentially explaining the mutually exclusive inhibition of AE1 by NIF and SITS34, a DIDS analog. In addition, the compound is wedged tightly between P467 in TM3 and L859 in TM14 causing structural rearrangements to accommodate the compound. We note subtle outward movements of the solvent-exposed tips of TM13 and TM14, as well as changes in F524, L859 and K851 (Extended Data Fig. 7d). Despite inhibiting transport akin to DIDS/H2DIDS, NIF does not seem to obstruct access to the bicarbonate binding pocket (Fig. 3h). Our structure thus suggests that NIF binding between the AE1 gate and core domains prevents translocation-related changes, while not interfering with substrate binding12. This mechanism is related to our proposal that cholesterol binding between gate and core domains similarly inhibits relative movements required for AE1-mediated transport.
Structure-based discovery of an AE1 inhibitor series
To further probe the molecular mechanisms of AE1 and explore therapeutic avenues for AE1-related pathologies, such as renal acidosis or several morphological erythrocyte disorders4,5, better tool compounds are necessary. Towards this goal, we sought to harness our structural data in proof-of-principle studies to generate chemical AE1 modulators using structure-based ligand discovery. Accordingly, we docked a virtual library of 2.4 million molecules from the ZINC ‘lead-like’ subset (http://zinc15.docking.org) against the substrate binding site in our apo-AE1 and DIDS-bound structures (Fig. 4a,b) (see Methods for details). We used Glide of the Schrödinger package to perform a three-step virtual screening35, and visually inspected the 1,000 top-scoring molecules for docking artifacts to select compounds for experimental testing36. A curated subset of 22 compounds was then experimentally tested in a cellular bicarbonate uptake assay validated with H2DIDS, DIDS and NIF (Fig. 4a). Using NIF as a positive control, we found that one of the tested leads, compound 22, exhibited strong inhibition of transport at 50 μM (Fig. 4c). We next performed concentration response experiments to determine apparent inhibitory potencies of compound 22 and NIF in bicarbonate uptake. Accordingly, compound 22 exhibits an apparent half-maximum inhibitory concentration (IC50) of 18 μM (pIC50 (negative logarithm of the IC50) = 4.746 ± 0.049) similar to the apparent IC50 of NIF of 15 μM (pIC50 = 4.823 ± 0.064) (Fig. 4d). To our knowledge, this is the first report of the apparent inhibitory potency of NIF in AE1-mediated bicarbonate transport, and it directly validates our approach that this comparatively shallow and solvent-accessible site is indeed tractable using structure-based drug discovery methodology. Moreover, we expand into previously untapped chemical space for AE1, as compound 22 is chemically dissimilar to the other AE1 inhibitors characterized herein, with the highest Tanimoto coefficient of 0.34 compared to NIF.
Fig. 4 |. Structure-based discovery of a chemical AE1 inhibitors.
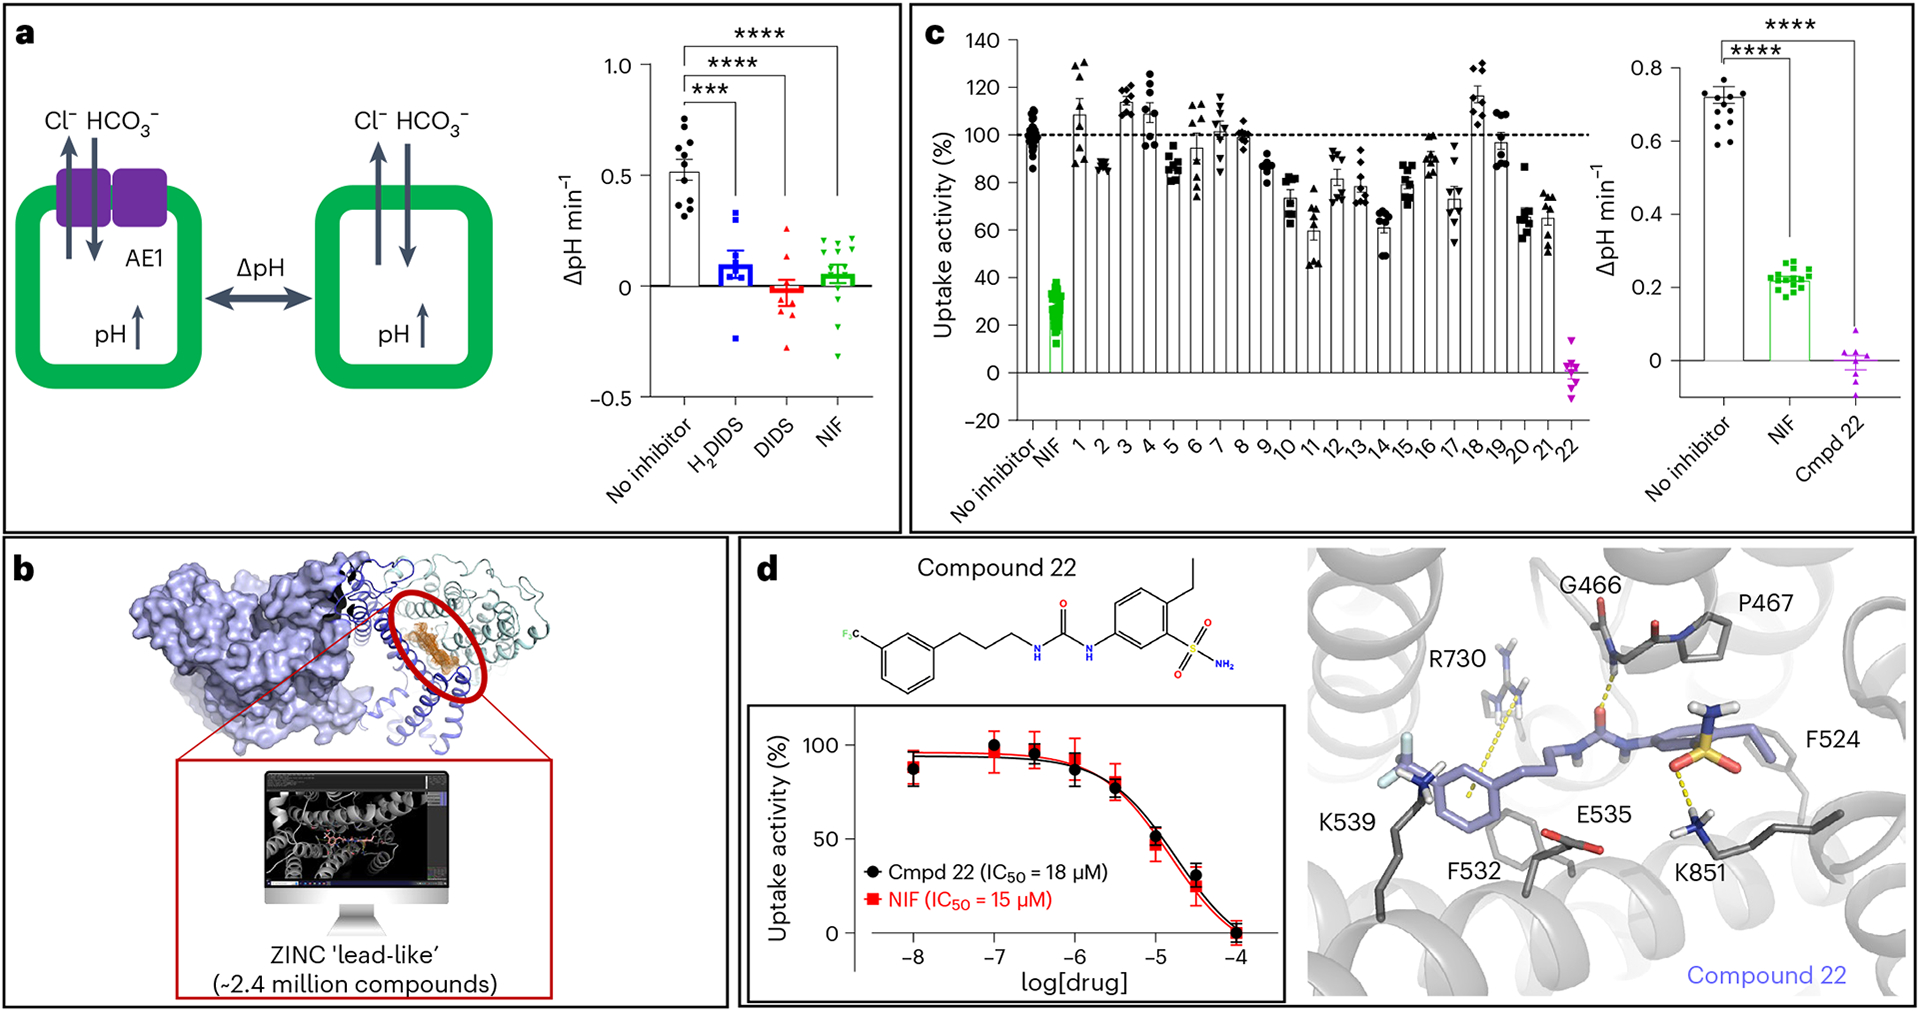
a, Measurement of cellular bicarbonate uptake in an inducible Flp-In T-REx 293 cell line, via cellular pH increase in response to AE1-mediated bicarbonate transport. AE1-specific activity was determined as pH differences measured after 1 min of uptake between uninduced and induced cells. H2DIDS (20 μM followed by washout), DIDS (20 μM followed by washout) and NIF (50 μM) show statistically significant AE1 inhibition. Uptake experiments were performed with 2–6 technical repeats and are averaged from three independent experiments (n = 3). Data are represented as mean ± s.e.m. Statistical significance was determined via one-way ANOVA (Dunnett’s multiple comparison); ***P < 0.0001, ****P < 0.0001; P = 0.0002400 (H2DIDS), P = 0.0000070 (DIDS), P = 0.0000005 (NIF). b, 2.4 million purchasable compounds from the ZINC library were docked against the herein defined substrate binding site (orange mesh) of the apo and DIDS-bound AE1 structures. c, A total of 22 compounds were experimentally tested for inhibitory activity, and compound 22 shows inhibitory activity at 50 μM in a single dose experiment. Uptake experiments were performed with 2–6 technical repeats and are averaged from three independent experiments (n = 3). Data are represented as mean ± s.e.m. Statistical significance was determined via one-way ANOVA (Dunnett’s multiple comparison); ****P < 10−14. d, Chemical structure and docking pose of compound 22 from virtual screening. Compound and transporter are shown in violet and gray, respectively, and hydrogen bonds, salt bridges and pi–cation interactions are indicated as yellow dashes. Concentration response experiments reveal comparable inhibitory potencies of compound 22 (IC50 = 18 μM, pIC50 = 4.746 ± 0.049) and NIF (IC50 = 15 μM, pIC50 = 4.823 ± 0.064). Apparent potencies are calculated as IC50 (mean) and pIC50 (mean ± s.e.m.). Uptake experiments were performed in triplicate and are averaged from four independent experiments (n = 4), and data are represented as mean ± s.e.m.
Compound 22 contains a trifluoromethyl benzene group, as found in NIF, and a benzenesulfonamine, which is reminiscent of the benzenesulfonic acid groups in DIDS and H2DIDS (Fig. 4d). The docking pose, however, indicates that these groups do not form the same interactions with AE1 that are observed for NIF and the stilbene inhibitors (Figs. 3 and 4d). Given the comparable potency relative to known AE1 inhibitors such as NIF, we reasoned that compound 22 has potential for subsequent development into AE1 probes. To further validate this scaffold as a bona fide AE1 inhibitor and test its potential for optimization, we tested 24 commercially available analogs at 20 μM compound concentration: the approximate apparent IC50 of compound 22 (Extended Data Fig. 8). To our surprise, we observed that the majority, 18 of the 24 compounds tested, reduce AE1-mediated bicarbonate transport at 20 μM (Extended Data Fig. 8a), thus validating the potential of this scaffold for future optimization. For instance, concentration response experiments show that replacing the trifluoromethyl benzene with aliphatic trifluoromethyl groups entirely disrupts inhibition, which was also observed when the sulfonamide and ethyl substituents were exchanged for a methylacetate (Extended Data Fig. 8b,d). In contrast, adding a branching methyl group to the aliphatic chain (IC50 = 14 μM, pIC50 = 4.857 ± 0.063), as well as removing the trifluoromethyl substituent (IC50 = 25 μM, pIC50 = 4.598 ± 0.090) or replacing it with a methylacetate (IC50 = 14 μM, pIC50 = 4.851 ± 0.078), resulted in apparent potencies comparable to that of compound 22 (Extended Data Fig. 8b,c). Together, our studies not only identify a chemical AE1 inhibitor with comparable potency to the clinically used drug NIF, but also further validate the potential of this scaffold for future optimization using rational and targeted medicinal chemistry. This work thus serves as a foundation for the generation of potent and transporter-selective probes to explore both fundamental AE1 mechanisms and therapeutic applications.
Discussion
Herein we report seven high-resolution cryo-EM structures of the human AE1 transporter bound to substrate and multiple different drugs, and discover and analyze an AE1 inhibitor series. We elucidate the Diego blood group antigens associated with severe hemolytic diseases, and identify several bound lipids and sterols, whose effects on AE1 structure and function have not been fully known22,37,38. By contrast with previous studies, we only observe cholesterol bound on membrane-facing surfaces22. Similar to previous work8, we also observe lipids bound to the dimer interface, which has been proposed to stabilize and regulate the structure function of the transporter22. While our findings are in line with previous work extracting AE1 from human erythrocytes8, it should be noted that we obtained protein heterologously expressed in Sf9 insect cells.
At global resolutions ranging from 2.95 to 3.37 Å, we also show how the substrate bicarbonate binds to AE1, and structurally charac terize how chemically and pharmacologically distinct inhibitors differentially affect both substrate binding and transport (Fig. 5). On the basis of structures, uptake assays and computational studies, we propose that R730 forms the center of the anion binding site and holds the anion in place with low millimolar affinity, before conformational transition and substrate translocation. This conclusion is supported by the drastic physiological effects of R730 mutations on anion transport, such as R730C, which causes overhydrated cation leak stomatocytosis in humans39. We do, however, further suggest that interactions with nearby backbone atoms in TM8 are critical for efficient binding of the substrate, and we suspect that other substrates, such as oxalate, sulfate and other anions, may form distinct interactions in the vicinity of R730. For instance, we observe that E681 is located approximately 5–6 Å from the bicarbonate ion, but its protonation is critical for efficient transport of divalent sulfate40. Sulfate could thus conceivably be bound closer to E681 in the outward-facing state, or conformational transitions between different states bring the anions in closer proximity to E681. Both cases would require protonation of this residue to prevent prohibitory repulsive forces. This residue was further suggested to form an anomalous interaction with S725R, a mutation causing anemia and renal acidosis through loss of AE1 transport function41. Our structure provides further evidence for this suggestion, since S725 is located more than 9 Å from the bicarbonate ion, making a direct effect on anion binding in the outward-facing state unlikely. Our observed bicarbonate binding site is distinct from that of a related but mechanistically different sodium-dependent bicarbonate transporter NDCBE (SLC4A8)16 (Extended Data Fig. 6c,d), but is similar to that predicted computationally using molecular dynamics (MD) simulations42.
Fig. 5 |. Model of AE1-mediated bicarbonate transport and diverse mechanisms of AE1 transport inhibition by pharmacologically different drugs.
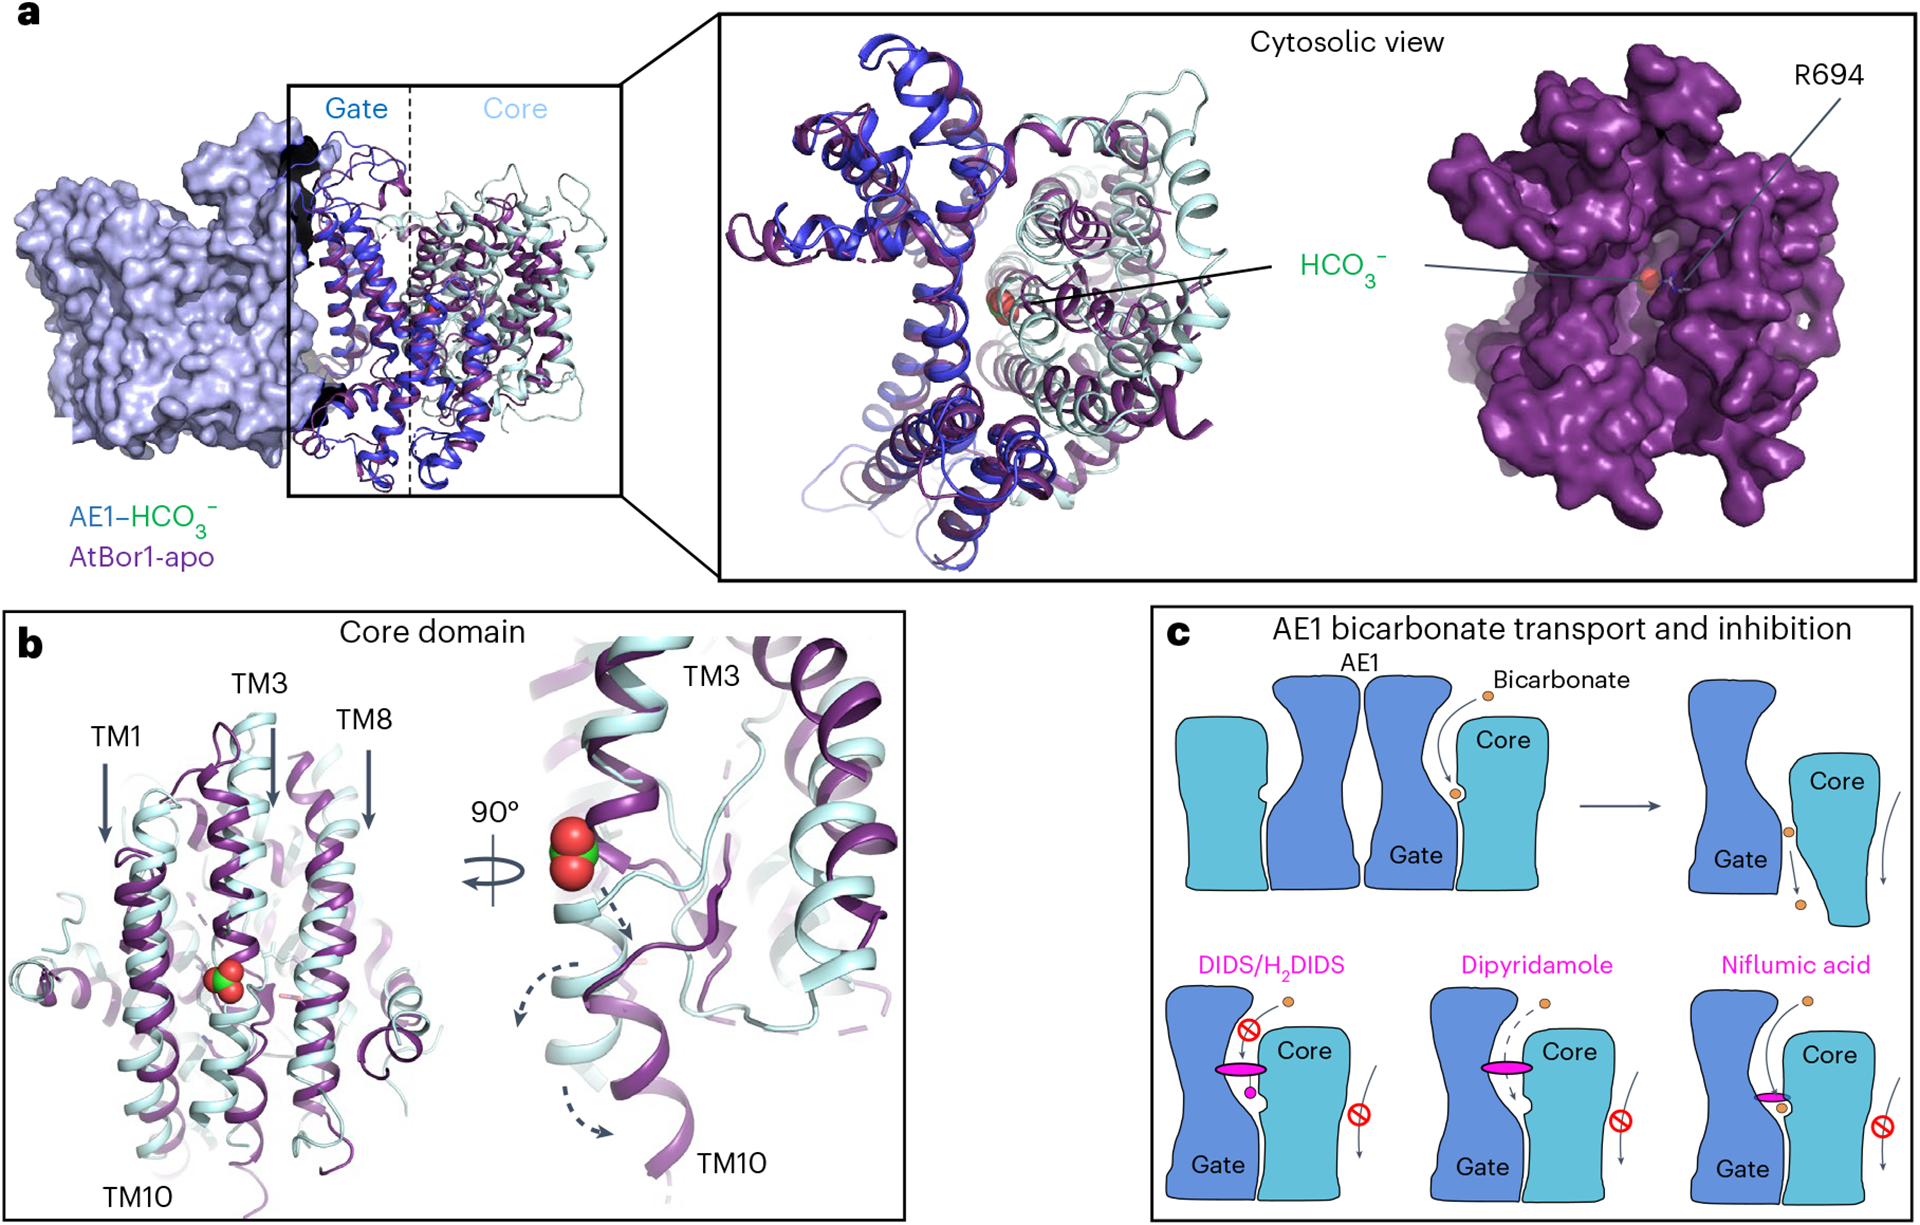
a, Overlay of membrane domains of human AE1 and AtBor1 from A. thaliana (purple) showing similar gate conformations, while the core domains appear in different states. Cytoplasmic view of the overlay reveals a channel in AtBor1 that overlaps with the putative anion exit channel in AE1 ending near R694, and connecting the AE1 bicarbonate binding site and the cytosol. b, Overlay of AE1 and AtBor1 anion binding sites suggests an elevator mechanism where the core domain moves towards the cytoplasmic site (black arrows) and TM10 kinks away from the gate domain (black arrow) to release substrates towards the cytoplasm (dashed arrows). c, Schematic illustrating AE1-mediated bicarbonate (orange) transport, as well as pharmacological differences between the inhibitors DIDS/H2DIDS, dipyridamole and niflumic acid (magenta). Note, all tested inhibitors prevent translocation-related relative movements of gate and core domains, which are shown in dark blue and pale cyan, respectively.
Analysis of our structures in the context of other transporter structures provides intriguing insights into the transport mechanisms of AE1, which have remained largely elusive. When compared to a previous SLC4 borate transporter structure from Arabidopsis thaliana (AtBor1)43, our findings strongly suggest that AE1 transports bicarbonate via an elevator mechanism (Fig. 5), as proposed in previous studies44,45. The well-ordered EL3 and lipids facilitating dimerization22 argue for a stationary gate domain, which is consistent with an elevator mechanism, but not, for example, with a rocker-switch model46, and has been described as a common feature of oligomeric elevator transporters47. Superposition of AE1 with the AtBor1 structure shows that the gate domains align well, while the AtBor1 core domain appears shifted downward (Fig. 5a,b). TM3 and TM10, which form the AE1 bicarbonate binding site, move downwards by about 5–7 Å, and TM10 bends away from the gate domain, thus likely releasing bound substrate towards the intracellular site. This is further supported by a cytoplasmic exit channel in AtBor1 that connects to the AE1 bicarbonate binding site, even before translocation of the core domain of AE1. A cavity we observe in our AE1 structures (Extended Data Fig. 5e,f) overlaps well with this channel, and probably expands into a substrate exit channel during substrate translocation. In fact, our studies suggest that R694 located at the cytoplasmic exit could form a second bicarbonate binding site. Our studies suggest that this site is accessible from the cytoplasm in the outward-facing state (Extended Data Fig. 5e,f), and could explain the autoinhibitory role of bicarbonate at high concentrations, where anions bind to an intracellular site and prevent outward-to-inward translocation48.
Further evidence for our transport model comes from a cholesterol bound between the core and gate domain at the interface of TM1 and TM7 (Fig. 1b), which conceivably prevents translocation-related conformational changes and thereby explains the inhibitory effects of cholesterol21,23. Indeed, structural studies of the elevator transporter ASCT2 noted relocation of bound cholesterol molecules could be exploited to develop allosteric binders with inhibitory activity49.
Similarly, the binding sites of NIF, dipyridamole, as well as DIDS and H2DIDS, are all located between the core and gate domain and thus also likely to share the prevention of relative domain movements necessary for AE1 transport. However, our structures also uncover drug-specific binding locations and residue interactions that explain their distinct effects on substrate binding and diffusion between the extracellular space and the anion binding site. Overall, our studies suggest a general ‘ping-pong’ exchange mechanism in which bicarbonate or chloride share a binding site13 and one ion is transported one way, before the counterion is transported the opposite way and AE1 is returned to its resting state50.
To initiate the development of selective and potent AE1 inhibitor compounds, we performed high-throughput docking experiments against the newly characterized bicarbonate binding site, leading to the discovery of an AE1 inhibitor series (Fig. 4 and Extended Data Fig. 8). These experiments not only confirm the druggability of this particular binding site, but also provide conceptual proof that our structures can be utilized to discover lead molecules against AE1 binding sites. In the future, we aim to develop AE1-selective molecules with different modalities, targeting different binding surfaces. These tools will be invaluable towards a further dissection of the molecular mechanisms of AE1, such as investigating distinct conformational states. Such probes will also enable enquiries into the tractability of AE1 as a drug target in the treatment of, for example, stomatocytosis, renal acidosis and other AE1-linked disorders.
The work presented here not only reveals mechanisms of AE1-mediated substrate binding and transport, but also is likely to translate to the similar SLC23 and SLC26 anion transporter families. Going beyond basic AE1 function, we also illuminate the different pharmacological mechanisms by which distinct research compounds and clinically used drugs, such as niflumic acid and dipyridamole, inhibit transport. In fact, the antiplatelet medication dipyridamole binds to AE1 under physiological conditions51–53, which facilitates healthy red blood cell circulation54, probably via the role of AE1 in shaping erythrocyte structure55.
Given the physiological importance of AE1 in erythrocyte structure and pH regulation, CO2 transport and acid secretion in the kidney, our structural insights thus have potential implications for human health and disease. Moreover, our molecular insights have already enabled the generation of an AE1 inhibitor, which showcases a path towards generating pharmacological tools to study distal renal tubular acidosis, hemolytic anemias and other AE1-associated pathologies.
Methods
Construct and expression
Structural studies reported herein were performed with the full-length human AE1 transporter (UniprotKB-P02730), which was cloned into a modified pFastBac vector to introduce a C-terminal 3C protease cleavage site followed by a 10× His tag. Bacmid DNA was generated in DH10Bac cells (Invitrogen) and protein was expressed in Sf9 cells (Expression Systems, catalog no. 94–001S) using the Bac-to-Bac baculovirus expression system (Invitrogen). Then, ~2.5 μg recombinant bacmid DNA and 3 μl FuGENE HD transfection reagent (Promega) in 100 μl Sf900 II media (Invitrogen) were added to 500,000 Sf9 cells plated in 2 ml of SF900 II media in wells of a 12-well plate. After 5 d at 27 °C the supernatant was collected as P0 viral stock, and high-titer recombinant P1 baculovirus (>109 viral particles per ml) was obtained by adding 200 μl P0 to 40 ml of 3 × 10⁶ cells per ml and incubating cells for 3 d while shaking at 27 °C. Titers were determined by flow cytometric analysis staining P1 infected cells with gp64-PE antibody (Expression Systems, catalog no. 97–201) using a 1:200 dilution of antibody in phosphate-buffered saline to stain cells. Expression of AE1 for structural studies was carried out by infection of Sf9 cells at a cell density of 2–3 × 10⁶ cells per ml with P1 virus at a multiplicity of infection of 5. After 48 h of shaking at 27 °C, cells were collected by centrifugation at 48 h postinfection and stored at −80 °C until use.
Protein purification and grid preparation
Typically, we purified protein from ~3 l of expression culture to prepare grids for cryo-EM experiments. Insect cell membranes were disrupted by thawing frozen cell pellets in a hypotonic buffer containing 10 mM HEPES pH 7.5, 10 mM MgCl2, 20 mM KCl and homemade protease inhibitor cocktail (500 μM AEBSF, 1 μM E-64, 1 μM leupeptin, 150 nM aprotinin) (Gold Biotechnology). Total cellular membranes were collected by ultracentrifugation, and extensively washed by repeated (2–4 times) homogenization and centrifugation in a high osmotic buffer containing 1 M NaCl, 10 mM HEPES pH 7.5, 10 mM MgCl2, 20 mM KCl and homemade protease inhibitor cocktail. Purified membranes were directly flash-frozen in liquid nitrogen and stored at −80 °C until further use.
Purified membranes were resuspended in buffer containing 10 mM HEPES pH 7.5, 10 mM MgCl2, 20 mM KCl, 150 mM NaCl, homemade protease inhibitor cocktail and 25 μM DIDS or H2DIDS, or 100 μM dipyridamole or NIF for the different AE1-inhibitor complexes. Complexation was initiated by agitation for 1 h at room temperature, a step that was skipped for the AE1 ‘apo’, AE1–bicarbonate and AE1–DEPC samples. Before solubilization, membranes were equilibrated at 4 °C and incubated for 30 min in the presence of 2 mg ml−1 iodoacetamide (Sigma). Membranes were then solubilized in 10 mM HEPES pH 7.5, 150 mM NaCl, 1% (w/v) n-dodecyl-β-d-maltopyranoside (DDM, Anatrace), 0.2% (w/v) cholesteryl hemisuccinate (CHS, Anatrace), inhibitor and homemade protease inhibitor cocktail for 2 h at 4 °C. Unsolubilized material was removed by centrifugation at 200,000g for 30 min, and buffered imidazole was added to the supernatant for a final concentration of 20 mM. Proteins were bound to TALON IMAC resin (Clontech) overnight at 4 °C. Purification of the dipyridamole- and NIF-bound complexes was carried out in the presence of 50 μM inhibitor, and the bicarbonate-bound complex was purified in the presence of 100 mM sodium bicarbonate. The resin was then washed with 10 column volumes of wash buffer I (25 mM HEPES pH 7.5, 500 mM NaCl, 0.1% (w/v) DDM, 0.02% (w/v) CHS, 20 mM imidazole, 10% (v/v) glycerol). The detergent was then exchanged for LMNG by successively incubating the resin with the following buffers for 1 h each: wash buffer II (25 mM HEPES pH 7.5, 500 mM NaCl, 0.05% (w/v) DDM, 0.05% (w/v) LMNG, 0.02% (w/v) CHS), wash buffer III (25 mM HEPES pH 7.5, 500 mM NaCl, 0.025% (w/v) DDM, 0.075% (w/v) LMNG, 0.02% (w/v) CHS), wash buffer IV (25 mM HEPES pH 7.5, 500 mM NaCl, 0.05% (w/v) LMNG, 0.02% (w/v) CHS), wash buffer V (25 mM HEPES pH 7.5, 500 mM NaCl, 0.025% (w/v) LMNG, 0.02% (w/v) CHS). After the final incubation step, the proteins were eluted with 25 mM HEPES pH 7.5, 500 mM NaCl, 0.025% (w/v) LMNG, 0.02% (w/v) CHS and 250 mM imidazole. Protein purity and monodispersity were tested by SDS–PAGE and analytical size-exclusion chromatography (aSEC). Typically, the protein purity exceeded 95%, and the aSEC profile showed a single peak, indicative of transporter monodispersity. For the AE1–DEPC sample, we then added 5 mM DEPC and incubated the sample overnight at 4 °C. All complexes were finally purified over a S200 SEC column equilibrated in 20 mM HEPES pH 7.5, 150 mM NaCl, 0.0011% (w/v) LMNG, 0.00011% (w/v) CHS, 0.00025% GDN. For AE1 bound to NIF and dipyridamole, 50 μM of the respective compound was added to the buffer. The bicarbonate complex was purified in 20 mM HEPES pH 7.5, 100 mM NaCHO3 0.001% (w/v) LMNG, 0.0001% (w/v) CHS, 0.0001% GDN. Peak fractions were then pooled, concentrated to ~3–7 mg ml−1 and immediately used to prepare grids for cryo-EM data collection.
Grid preparation, cryo-EM data collection and processing
To prepare cryo-EM grids for imaging, 3 μl of purified AE1-apo at ~6.3 mg ml−1, AE1–bicarbonate at 5 mg ml−1, AE1–DIDS at ~5 mg ml−1, AE1–H2DIDS at ~4.1 mg ml−1, AE1–DEPC at 5 mg ml−1, AE1–dipyridamole at 4.8 mg ml−1 or AE1–NIF at 5 mg ml−1 were applied to glow-discharged holey carbon EM grids (Quantifoil 300 copper mesh, R1.2/1.3) in an EM-GP2 plunge freezer (Leica). The EM-GP2 chamber was set to 95% humidity at 12 °C. Sample-coated grids were blotted for 3–3.3 s before plunge freezing into liquid ethane and stored in liquid nitrogen for data collection.
All automatic data collection was performed on a FEI Titan Krios equipped with a Gatan K3 direct electron detector run and operated by the Simons Electron Microscopy Center in the New York Structural Biology Center, or the Laboratory of BioMolecular Structure at Brookhaven National Laboratory. The microscope was operated at 300 kV accelerating voltage, at a nominal magnification of ×64,000–×81,000 corresponding to a pixel size of 1.08 Å. For each dataset, at least 3,500 movies were obtained at a dose rate of 25–30 e−/Å2/s with a defocus ranging from −0.5 to −1.8 μm. The total exposure time was 2 s and intermediate frames were recorded in 0.05-s intervals, resulting in an accumulated dose of 50–60 e−/Å2 and a total of 40 frames per micrograph.
Movies were motion corrected using MotionCor2 (ref. 57) and imported to cryoSPARC for further processing58. For CTF estimation we used patchCTF in cryoSPARC or Ctffind4 (ref. 59). An initial model was produced using a subset of micrographs and manual picking. Subsequent models were produced from particles found using templates. Datasets were curated by the removal of micrographs deemed irredeemable by poor CTF estimation. Particles were subject to two-dimensional (2D) classification, which quickly identified both the mdAE1 and cdAE1. A good initial model of mdAE1 was generated using ab initio model building in cryoSPARC, as were several bad models from rejected particles as decoys for heterogeneous refinement. Multiple rounds of heterogeneous refinement were carried out to select final particle stacks and continuously improve resolution. Final maps were obtained using either NU-refinement58,60 or local refinement with a masked mdAE1 domain. We applied C2 symmetry and additionally optimized per-particle defocus and per-group CTF parameters during NU-refinement. Despite several attempts to resolve the structure of the cytoplasmic domain using masks, three-dimensional (3D) variability analysis, 3D sorting, local refinement and varied fulcrum placement, we were unsuccessful. Structures of the membrane domains were further refined in ServalCat61, and final maps were generated in PHENIX62 before import into PyMOL63 for generating figures shown in the manuscript.
Bicarbonate transport assay
A polyclonal cell line that stably expresses AE1 upon tetracycline induction was generated based on the Flp-In T-REx 293 cell line (Invitrogen, T-REx-293 cells, catalog no. R71007). Cells were plated in a 96-well plate and incubated overnight with or without 2 μg ml−1 tetracycline at 37 °C. The next day, induced cells were again incubated with tetracycline for 3–4 h. Cellular bicarbonate uptake was then determined via cellular changes in pH, as previously described for other SLC4 transporters15. Cells were loaded with 5 μM of the pH-sensitive fluorescent dye BCECF-AM (2′,7′-bis-(2-carboxyethyl)-5-(and-6)-carboxyfluorescein, acetoxymethyl ester) for 30 min. Following another short incubation in HBSS buffered with 50 mM HEPES pH 7.5, the intracellular fluorescence ratio (excitation 495 ± 20 nm and 435 ± 20 nm; emission 540 ± 30 nm) was measured using a multimode plate reader (Victor NIVO, Perkin Elmer). To initiate uptake, cells were then diluted 1:3 in Cl-free buffer (50 mM HEPES pH 7.5 adjusted with NaOH, 115 mM Na gluconate, 2.5 mM K2HPO4, 7 mM Ca gluconate, 1 mM Mg gluconate, 5 mM glucose, 30 μM amiloride), supplemented with 16.7 mM NaHCO3. Fluorescence was then measured after 1 min. A calibration experiment using 10 μM nigericin in modified HBSS (1.26 mM CaCl2, 0.493 mM MgCl2, 0.407 mM MgSO4, 140 mM KCl, 0.441 mM KH2PO4, 4.17 mM NaHCO3, 0.338 mM Na2HPO4, 10 mM HEPES) at a range of pH values between 7 and 8 was then performed to convert fluorescence to pH values64. Activation of AE1 was determined as the pH difference (ΔpH) between induced (AE1 expressing) and noninduced cells following uptake. To measure AE1 inhibition, this experiment was performed in induced and uninduced cells using NaHCO3. For DIDS and H2DIDS, cells were preincubated with 20 μM inhibitor in HEPES-buffered HBSS for 1 h, after which DIDS and H2DIDS were omitted from the experiment. Dipyridamole has spectral overlap with BCECF and could therefore not be included in our measurements. For NIF and the 22 new compounds tested in the initial screen, 50 μM were added throughout the experiment after dye loading. For the 24 analogs of compound 22 tested in the second round of screening, 20 μM were added throughout the experiment after dye loading. All experiments were performed in triplicate, and data were averaged from three independent experiments and are shown as mean ± s.e.m. Statistical significance was determined by one-way analysis of variance (ANOVA) in GraphPad Prism.
MD simulations
Although AE1 exists in a dimeric form, it appears that the functional properties of each monomer are independent of the other. Thus only one monomer was selected for the construction. The system was built with CHARMM-GUI65 adding two cholesterol molecules and one cholesteryl succinate in the positions identified in the cryo-EM structure. The membrane was constructed from 200 POPC in both layers divided to account for the different surface area of the protein in the upper and lower leaves. The concentration of neutralizing K+ and Cl− counterions in the rectangular box was set to ~0.15 mM. The initial apo-AE1 structure was translated using the charmm2lipid routine in AMBER, and the simulations were conducted in AMBER 2020 (ref. 26). The system was minimized and equilibrated with the restraints designed in CHARMM-GUI. At the end of the equilibration, the MD simulations were executed at NPT conditions for 1,000 ns. The final trajectory included 10,000 structures. A similar design and simulations were performed on the bicarbonate-occupied structure. The analysis of the trajectories was performed with cpptraj in AMBER and the simulaid facility66. The root mean squared deviation (r.m.s.d.) of the protein stabilizes after 100 ns and remains nearly constant for the rest of the simulation.
Molecular docking
To characterize the binding mode of NIF at AE1 using molecular docking calculations, we first removed the ligand from the cryo-EM structure of the AE1–NIF complex. Glide of the Schrödinger suite was used for molecular docking35. AE1 was prepared with the Protein Preparation Wizard under default parameters67. The binding site was defined by generating a grid with the Receptor Grid Generation Panel. The binding site outlining box was defined around the reference NIF ligand in the AE1 template structure.
The NIF compound structure was obtained from PubChem (PubChem 4488), and it was prepared for docking using LigPrep with the default parameters, where the possible states were generated at target pH values of 7 ± 2. Docking was performed using Glide from the Schrödinger suite35. Finally, we used molecular mechanics generalized with Born surface area solvation (MM-GBSA) with Prime in the Schrödinger suite to estimate the relative binding affinity between NIF and AE1 (ref. 68), where a more negative value of ΔG binding indicates higher binding affinity.
Virtual ligand screening
The newly determined cryo-EM structures of AE1 in the apo and DIDS-bound forms were used for virtual screening with Glide. Before docking, we removed the ligand from the AE1–DIDS complex structure. We used a library of lead-like and in-stock compounds (2.4 million compounds) from the ZINC15 database69. The protein was prepared for docking using the Protein Preparation Wizard from the Schrödinger suite, where the structure was first refined by optimization and minimization67. The protein structure was energy minimized until r.m.s.d. was 0.30 Å for heavy atoms with the OPLSe3 force field70. The binding site of both the apo and DIDS-bound structure were defined on the basis of DIDS coordinates for the Receptor Grid Generation.
The grid files were used as input for the virtual screening workflow tool of Glide, Maestro, which performs a three-step virtual screening processes35. First, high-throughput virtual screening was performed where 10% top-scoring compounds were used in standard-precision (SP) docking. Then the 10% top-scoring compounds from the SP docking screen were used in extra-precision (XP) docking71, and the compounds were then reranked on the basis of the XP docking scores. Finally, MM-GBSA with Prime in the Schrödinger suite was used to estimate the relative binding affinity of the compounds68. Since MM-GBSA calculations are computationally expensive, only top-ranking ligand–protein complexes (top 2,000) identified in the virtual screening were used as input for MM-GBSA calculations. Ligands were ranked on the basis of the calculated binding energies (MM-GBSA DG Bind), where a more negative value indicates higher binding affinity.
The 1,000 top-scoring compounds based on MM-GBSA from each virtual screen were subjected to visual inspection using PyMOL63, to discard likely false-positive predictions. Erroneous docking often occurs in large screens, where typical errors include docking poses with high internal energies or unbound polar groups, as well as molecules with strained conformations36,72. A total of 22 compounds were ultimately purchased and tested.
Calculation of bicarbonate binding energies
To compute the binding energy of bicarbonate we took the approach of SACP27. Briefly, the system is placed in a periodic box, which is divided into an inner box, whose dimensions are 10 Å beyond the boundaries of the molecule, and an outer (‘bulk’) box of additional 5 Å thickness. Using a grand canonical ensemble/Monte Carlo (GC/MC) approach, the entire system is equilibrated with inserting/deleting bicarbonate to reach a density of 0.15 g l−1. The B parameter73 (B = μεχ + ln<N>), which reflects the excess chemical potential μεχ and the total number of particles N in the ‘bulk solution’ box, is then decreased progressively. The change in the B parameter increases the probability of deletion of bicarbonate until the system equilibrates. The value of the B parameter at the point where the last bicarbonate is deleted equals the most negative energy of bicarbonate to the protein. An analysis of the B value at which bicarbonate is most proximal to a specific site (for example, R730) yields the affinity of bicarbonate to this site. To enhance the statistical significance of the computed values, the MD trajectory was divided into ten clusters and the center of the cluster was extracted to perform the SACP on each of them. The final result is the population-weighted average of all the clusters for a specific location of the bicarbonate.
Pocket volume analysis
POVME3 (ref. 56) was used to calculate binding site volumes. We used default parameters for ligand-defined inclusion region, using the recently resolved structures as input in the Protein Data Bank. Pocket volume was visualized using PyMOL63.
Extended Data
Extended Data Fig. 1 |. Cryo-EM structure determination of AE1 complexes as exemplified by AE1-DIDS complex.
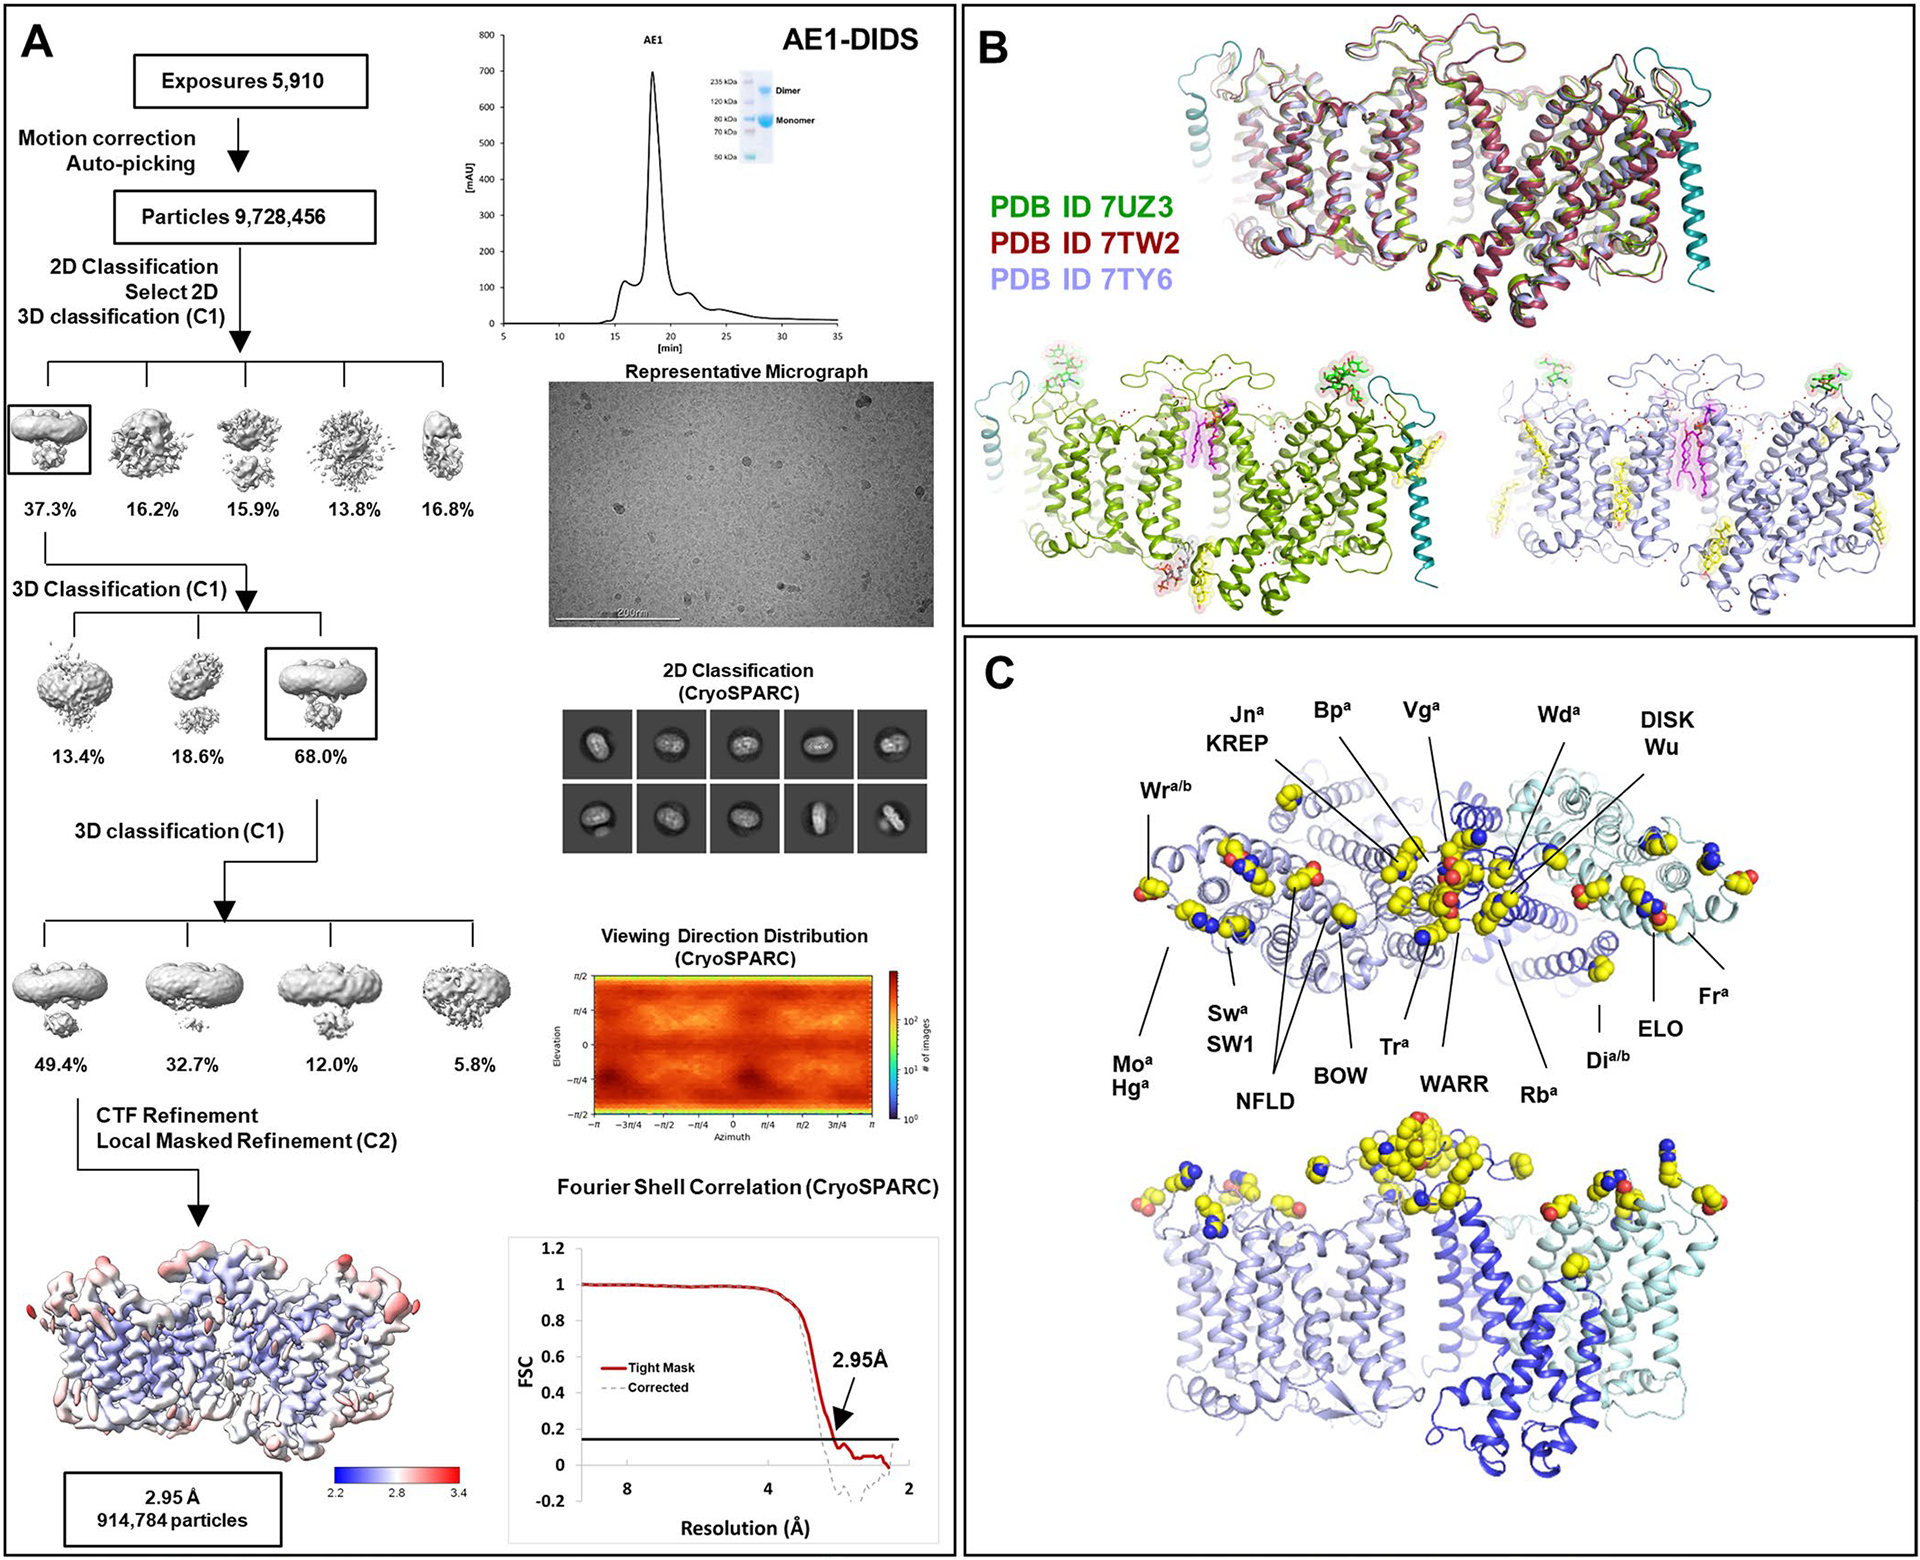
a, Analytical size exclusion chromatography and SDS-PAGE show monodisperse and pure protein of AE1-DIDS. Data were collected on 300 keV Krios, a representative micrograph is shown, and processed in cryoSPARC: particles were picked from motion corrected micrographs, subjected to 2D classification (representative classes are shown), followed by ab initio model building and 3D classification. After multiple rounds of 3D classification, the final particle stack was subjected to local CTF refinement followed by local refinement of the masked AE1 membrane domain with imposed C2 symmetry. Final map was obtained with GS-FSC indicating a resolution of 2.95 Å (AE1-DIDS) applying the 0.143 cutoff. Viewing direction distribution analysis (cryoSPARC) indicates sufficient coverage. An initial model was built in PHENIX, and then further refined in ServalCat for the generation of final maps and coordinates of mdAE1. Calculations in cryoSPARC indicate local resolutions of up to 2.5 Å around substrate and inhibitor binding sites. Viewing direction analysis indicates isotropic distribution of views in final particle stack. b, Superposition with other AE1 structures (AE1, PDB ID: 7TW2, dark red; AE1-Glycophorin complex, PDB ID: 7UZ3, lime green)7,8. Root mean square deviations of 0.997 Å (7TW2) and 0.372 Å (7UZ3) highlight similarity of protein conformation. Glycosylation modifications, cholesterols, lipids, waters, PIP2, and Glycophorin are shown in green, yellow, purple, red, grey, and teal, respectively. c, Cryo-EM structures allowed us to assign the complete extracellular surface including all Diego antigens (see Extended Data Table 2) with sidechains shown as spheres with yellow carbon atoms.
Extended Data Fig. 2 |. Cryo-EM Structure Determination of Apo AE1 and AE1-Bicarbonate complexes.
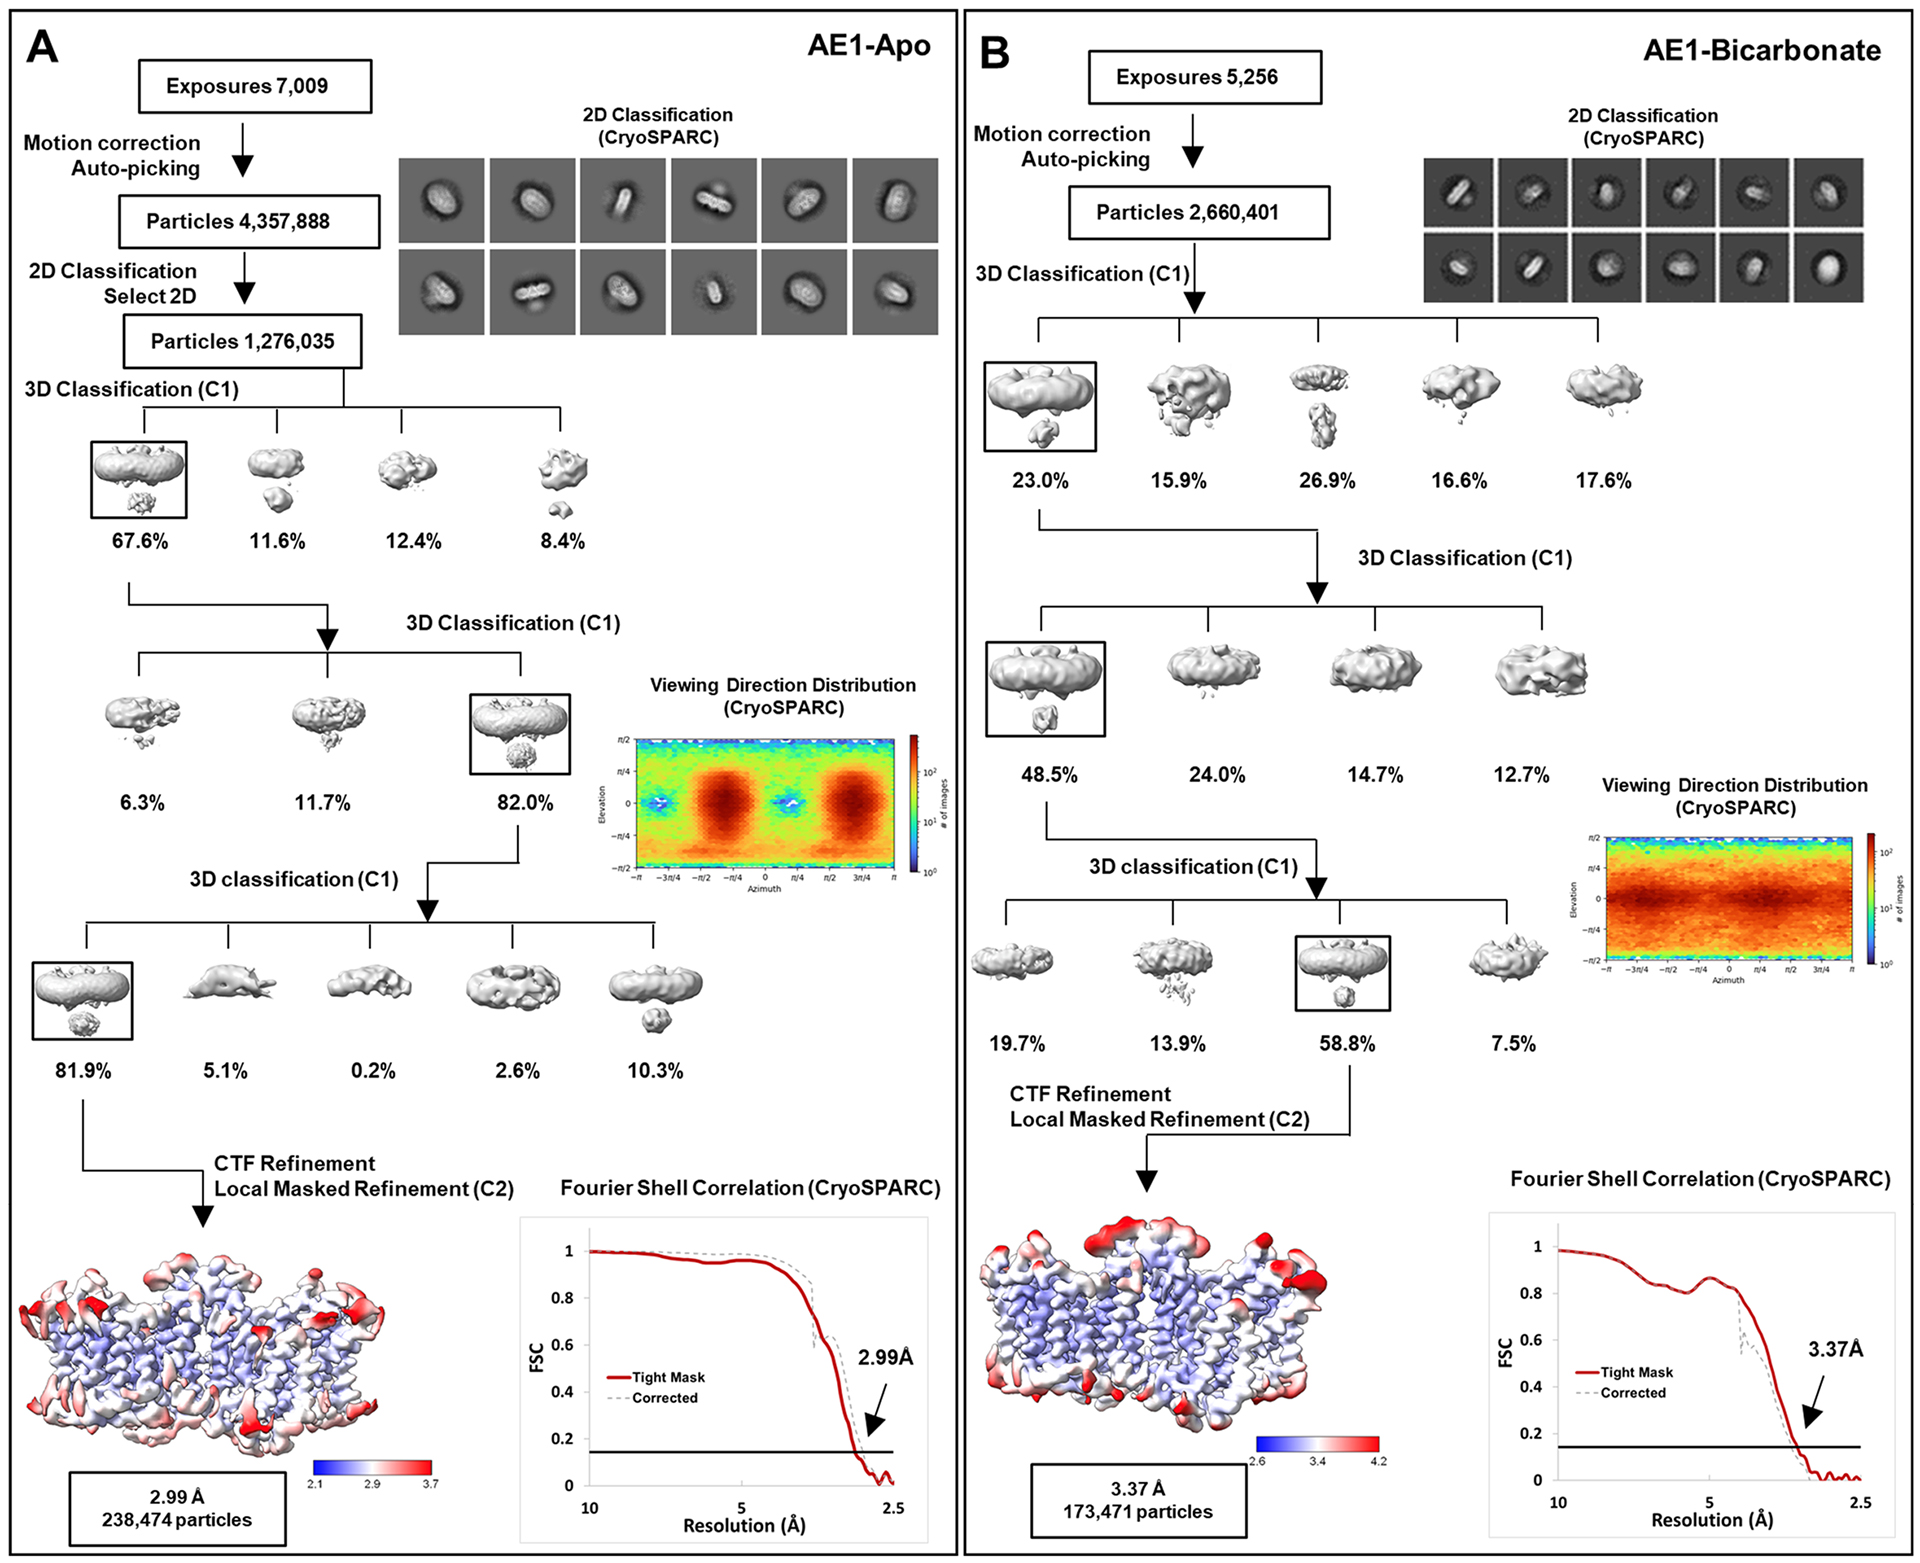
a, b, workflow of Apo AE1 (a) and AE1-Bicarbonate (b) data processing, showing representative 2D classes, followed by 2D classification, ab initio modeling and several rounds of 3D classification, with representative 3D classes shown. After multiple rounds of 3D classification, final particle stacks were subjected to CTF refinement followed by local refinement of the masked AE1 membrane domain with imposed C2 symmetry. GS-FSC calculations indicate global resolutions of 2.99 Å (Apo AE1) and 3.37 (AE1-Bicarbonate) applying the 0.143 cutoff. Viewing direction distribution analysis (cryoSPARC) indicates sufficient coverage. Initial models were built in PHENIX, and then further refined in ServalCat for the generation of final maps and coordinates. Calculations in cryoSPARC indicate local resolutions of lower than 3 Å around substrate and inhibitor binding sites.
Extended Data Fig. 3 |. Cryo-EM Structure Determination of AE1-H2DIDS and AE1-DEPC complexes.
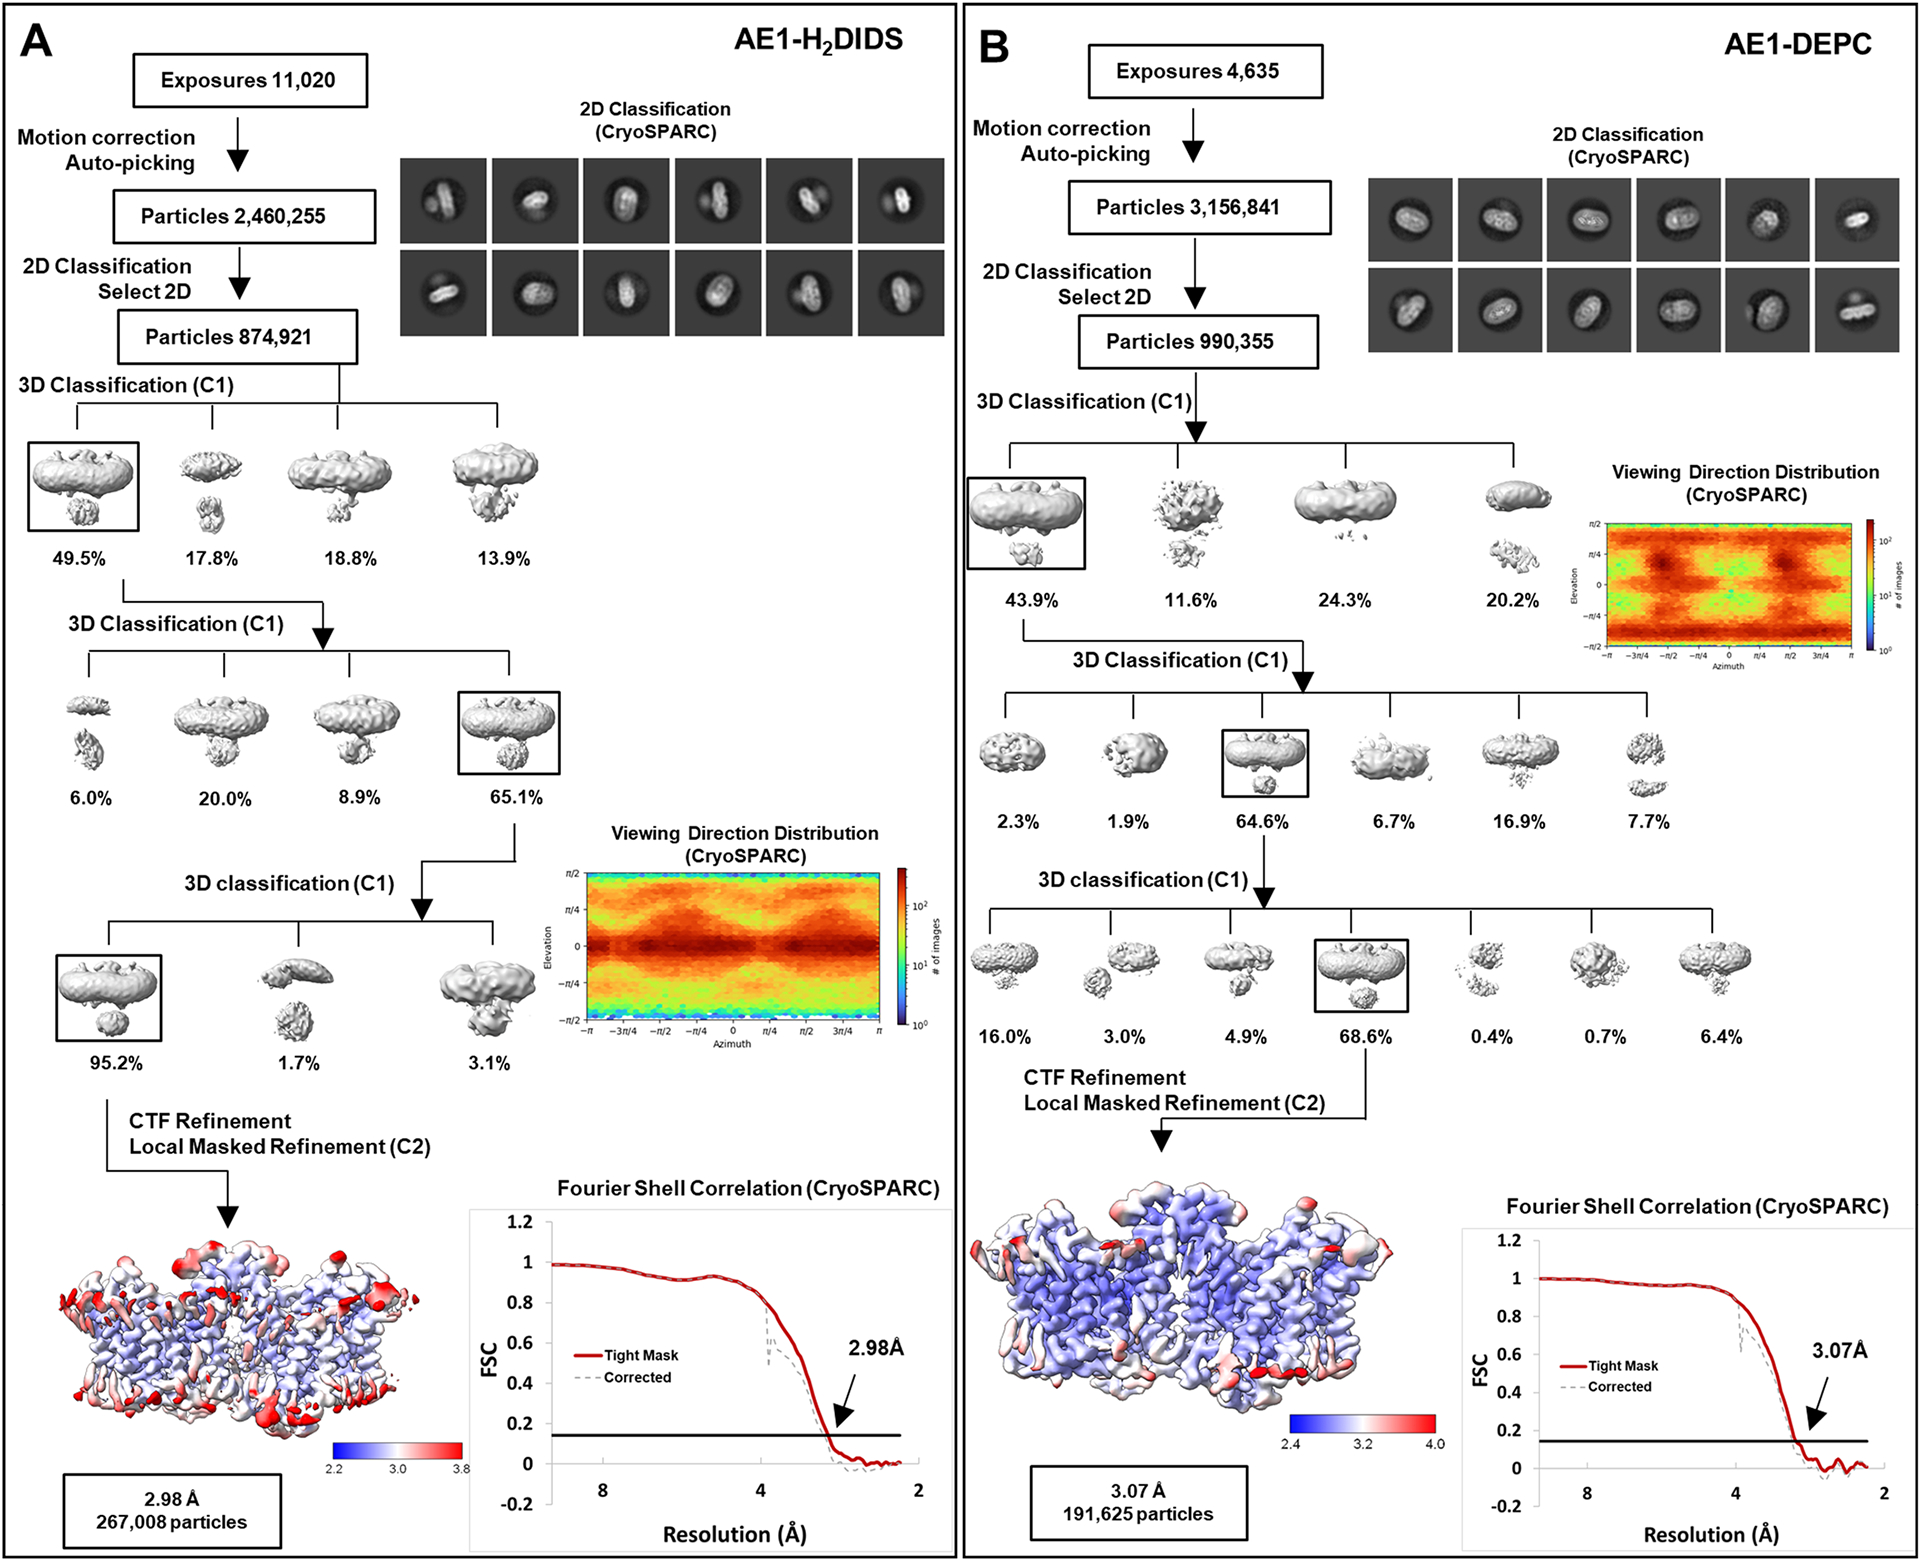
a, b, workflow of AE1-H2DIDS (a) and AE1-DEPC (b) data processing, showing representative 2D classes, followed by 2D classification, ab initio modeling and several rounds of 3D classification, with representative 3D classes shown. After multiple rounds of 3D classification, final particle stacks were subjected to CTF refinement followed by local refinement of the masked AE1 membrane domain with imposed C2 symmetry. GS-FSC calculations indicate global resolutions of 2.98 Å (AE1-H2DIDS) and 3.07 (AE1-DEPC) applying the 0.143 cutoff. Viewing direction distribution analysis (cryoSPARC) indicates sufficient coverage. Initial models were built in PHENIX, and then further refined in ServalCat for the generation of final maps and coordinates. Calculations in cryoSPARC indicate local resolutions of lower than 3 Å around substrate and inhibitor binding sites.
Extended Data Fig. 4 |. Cryo-EM Structure Determination of AE1-Dipyridamole and AE1-NIF complexes.
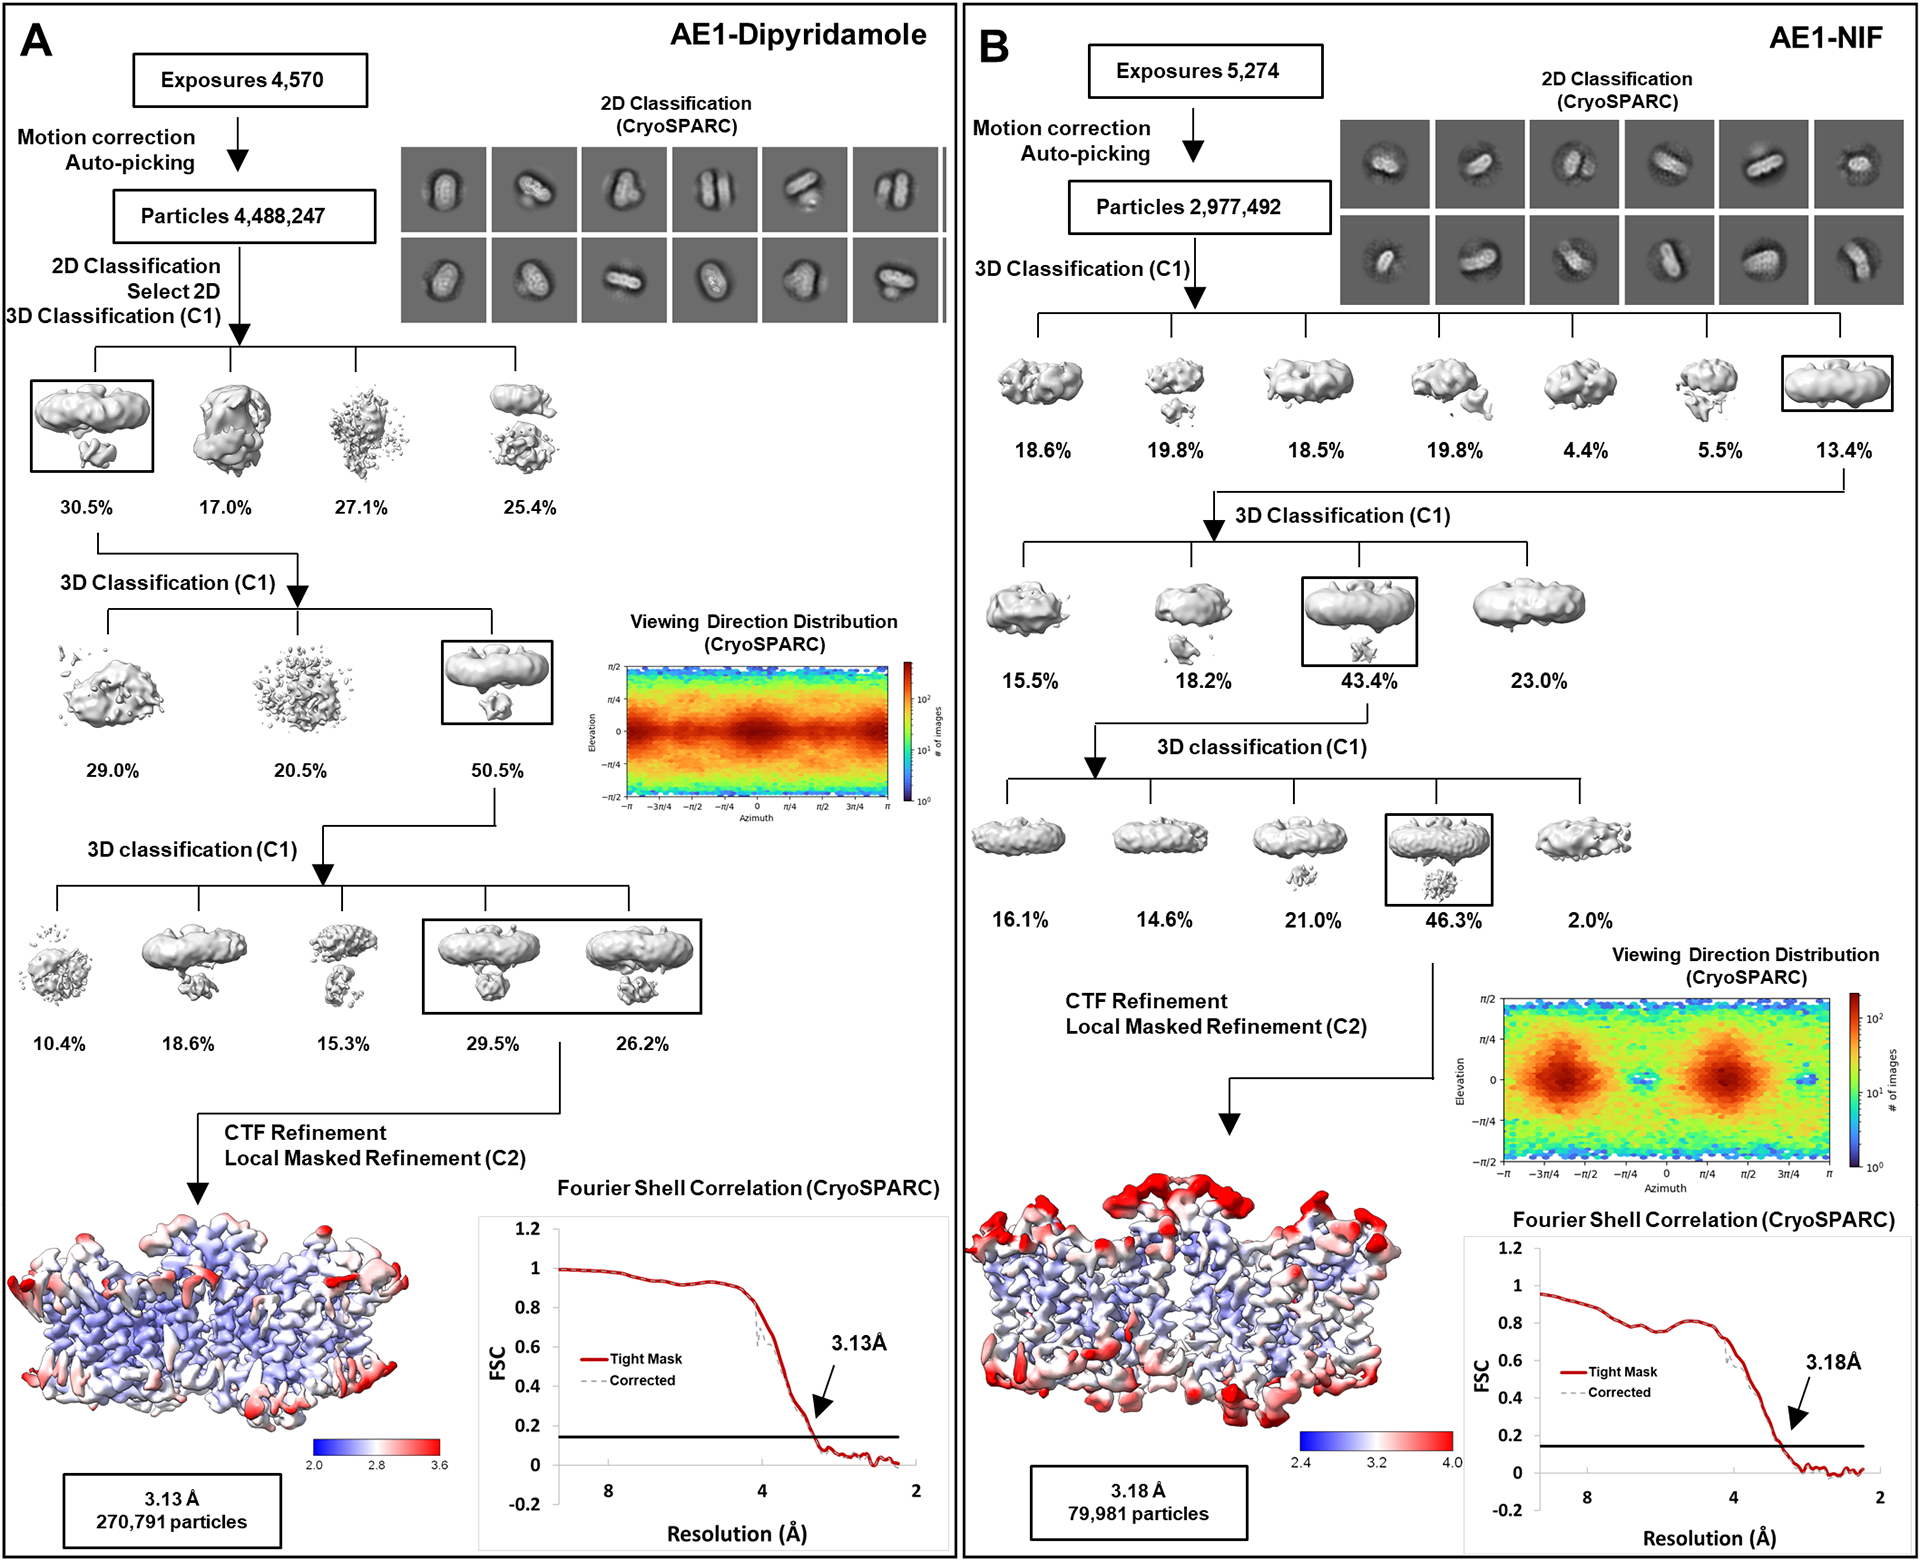
a, b, workflow of AE1-Dipyridamole (a) and AE1-NIF (b) data processing, showing representative 2D classes, followed by 2D classification, ab initio modeling and several rounds of 3D classification, with representative 3D classes shown. After multiple rounds of 3D classification, final particle stacks were subjected to CTF refinement followed by local refinement of the masked AE1 membrane domain with imposed C2 symmetry. GS-FSC calculations indicate global resolutions of 3.13 Å (AE1-Dipyridamole) and 3.18 (AE1-NIF) applying the 0.143 cutoff. Viewing direction distribution analysis (cryoSPARC) indicates sufficient coverage. Initial models were built in PHENIX, and then further refined in ServalCat for the generation of final maps and coordinates. Calculations in cryoSPARC indicate local resolutions of lower than 3 Å around substrate and inhibitor binding sites.
Extended Data Fig. 5 |. Substrate-Binding in SLC4 and SLC26 Transporters.
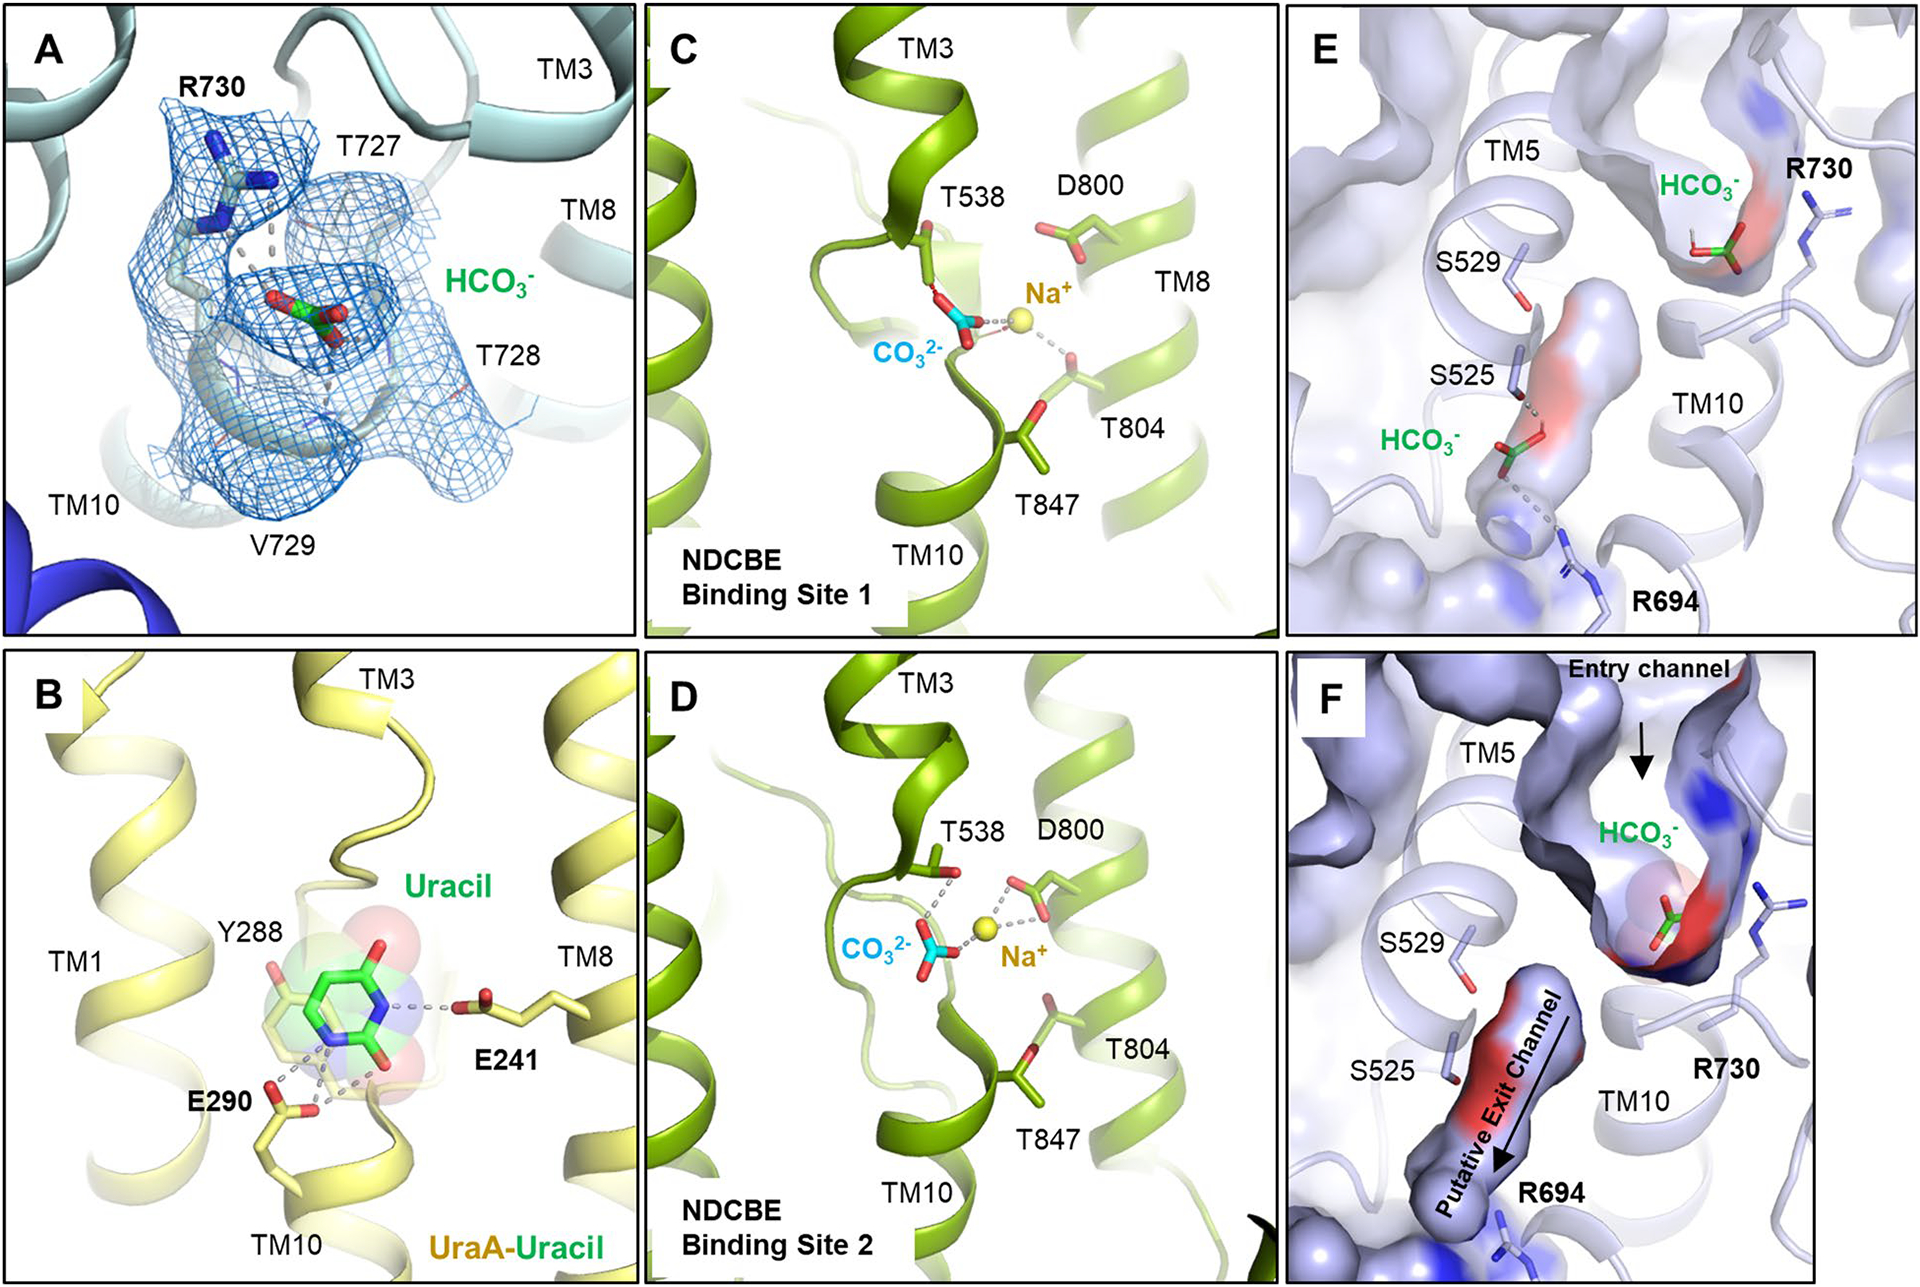
a, Cryo-EM density of bicarbonate and binding site residues (marine mesh) using a contour level of 6σ. b, Binding site of uracil in the UraA-Uracil structure (PDB ID: 3QE7)24. c, d, Carbonate and sodium ions in the rabbit NDCBE (SLC4A8) cryo-EM structure (PDB ID: 7RTM, EMD-24683)15, with clashes between CO32− and T538, as well as Na+ and the backbone shown as red dotted lines. Ionic interactions and hydrogen bonds are shown as grey dotted lines. e, SACP simulations allow to calculate bicarbonate affinity to AE1 anion binding site (see methods). In some structures (~5%) we have identified a second bicarbonate binding site in the putative exit channel. f, Surface display shows putative anion exit channel leading from the bicarbonate binding site to the cytoplasmic site. Channel extends below the plane of section.
Extended Data Fig. 6 |. Structure and Density of AE1-Bound Inhibitors.
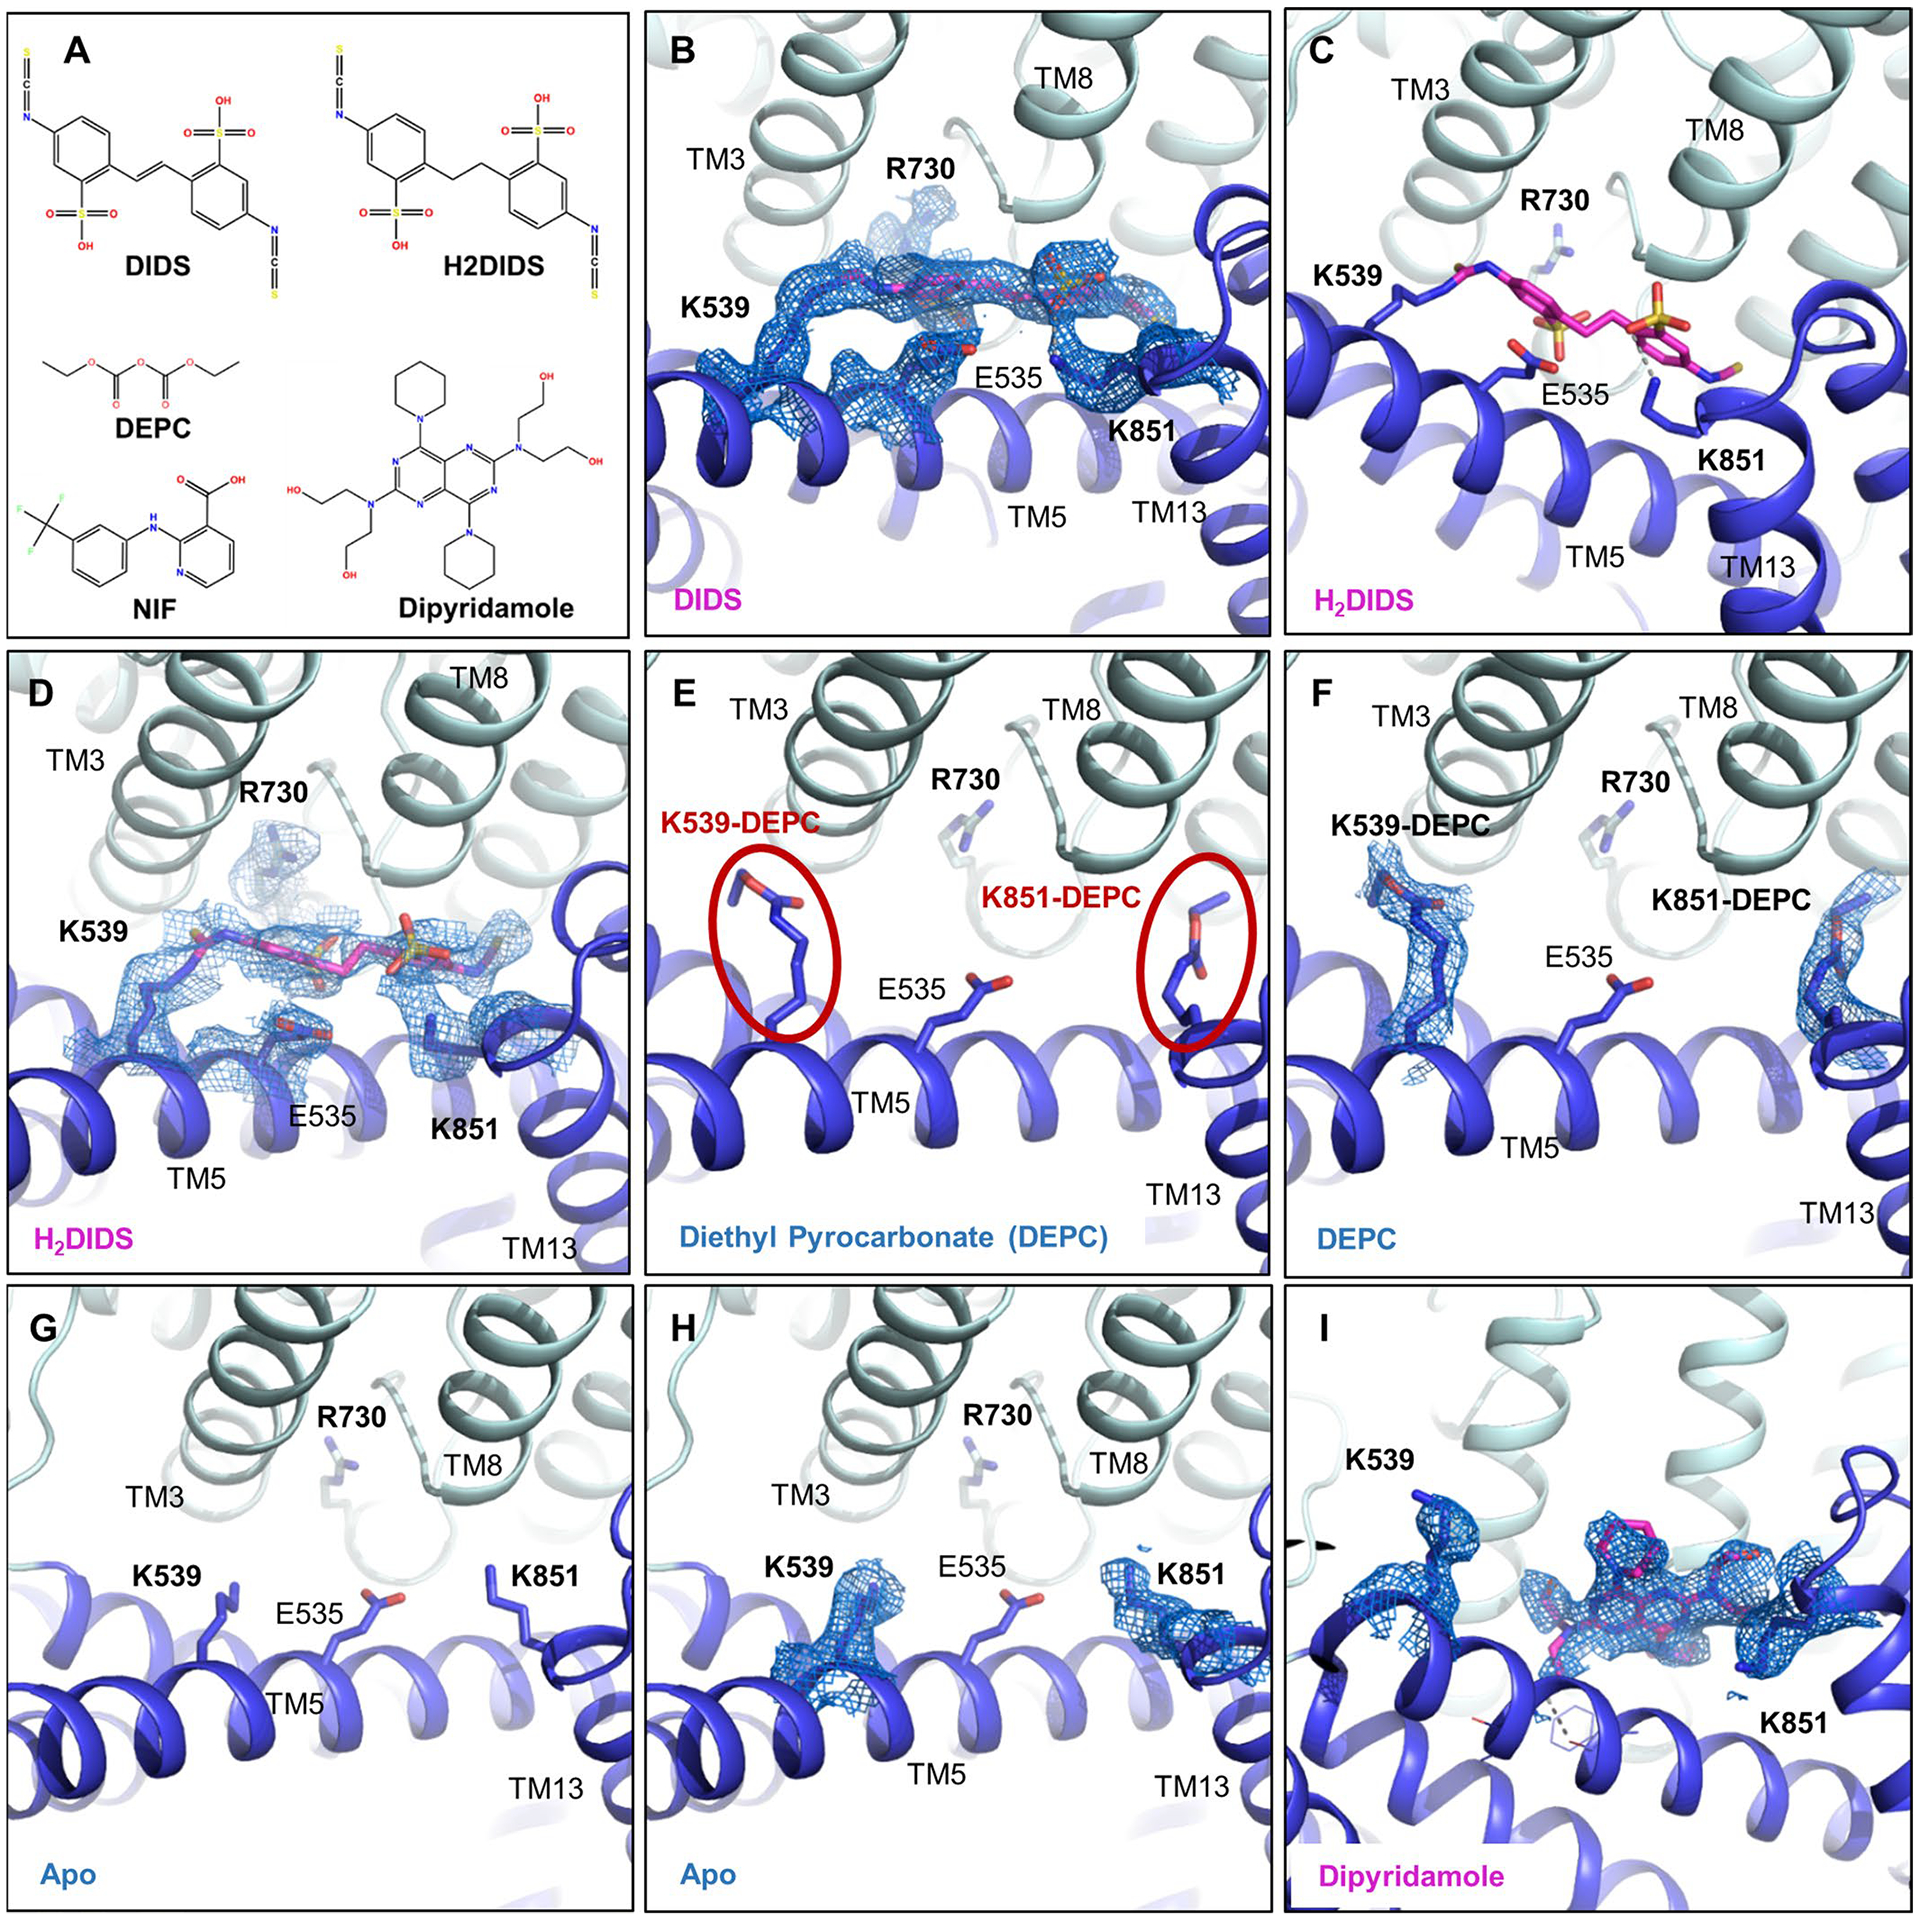
a, Chemical structures of different AE1 inhibitors and ligands used in this study. b, Cryo-EM density of DIDS (magenta) and key residues at a contour level of 6σ. c, H2DIDS (magenta) binding mode. d, Cryo-EM density of H2DIDS (magenta) and key residues at a contour level of 5σ. e, f, DEPC modifications of K539 and K851 (e) and corresponding cryo-EM densities (f) shown at a contour level of 8σ. g, h, Binding pocket of apo structure (g) and cryo-EM densities of residues (h) at a contour level of 6σ shown for comparison. i, Cryo-EM density of Dipyridamole (magenta) and key lysines at a contour level of 6σ. AE1’s gate and core domains are shown in tv blue and palecyan, respectively, and cryo-EM densities are shown as marine colored mesh.
Extended Data Fig. 7 |. Binding of NIF to AE1.
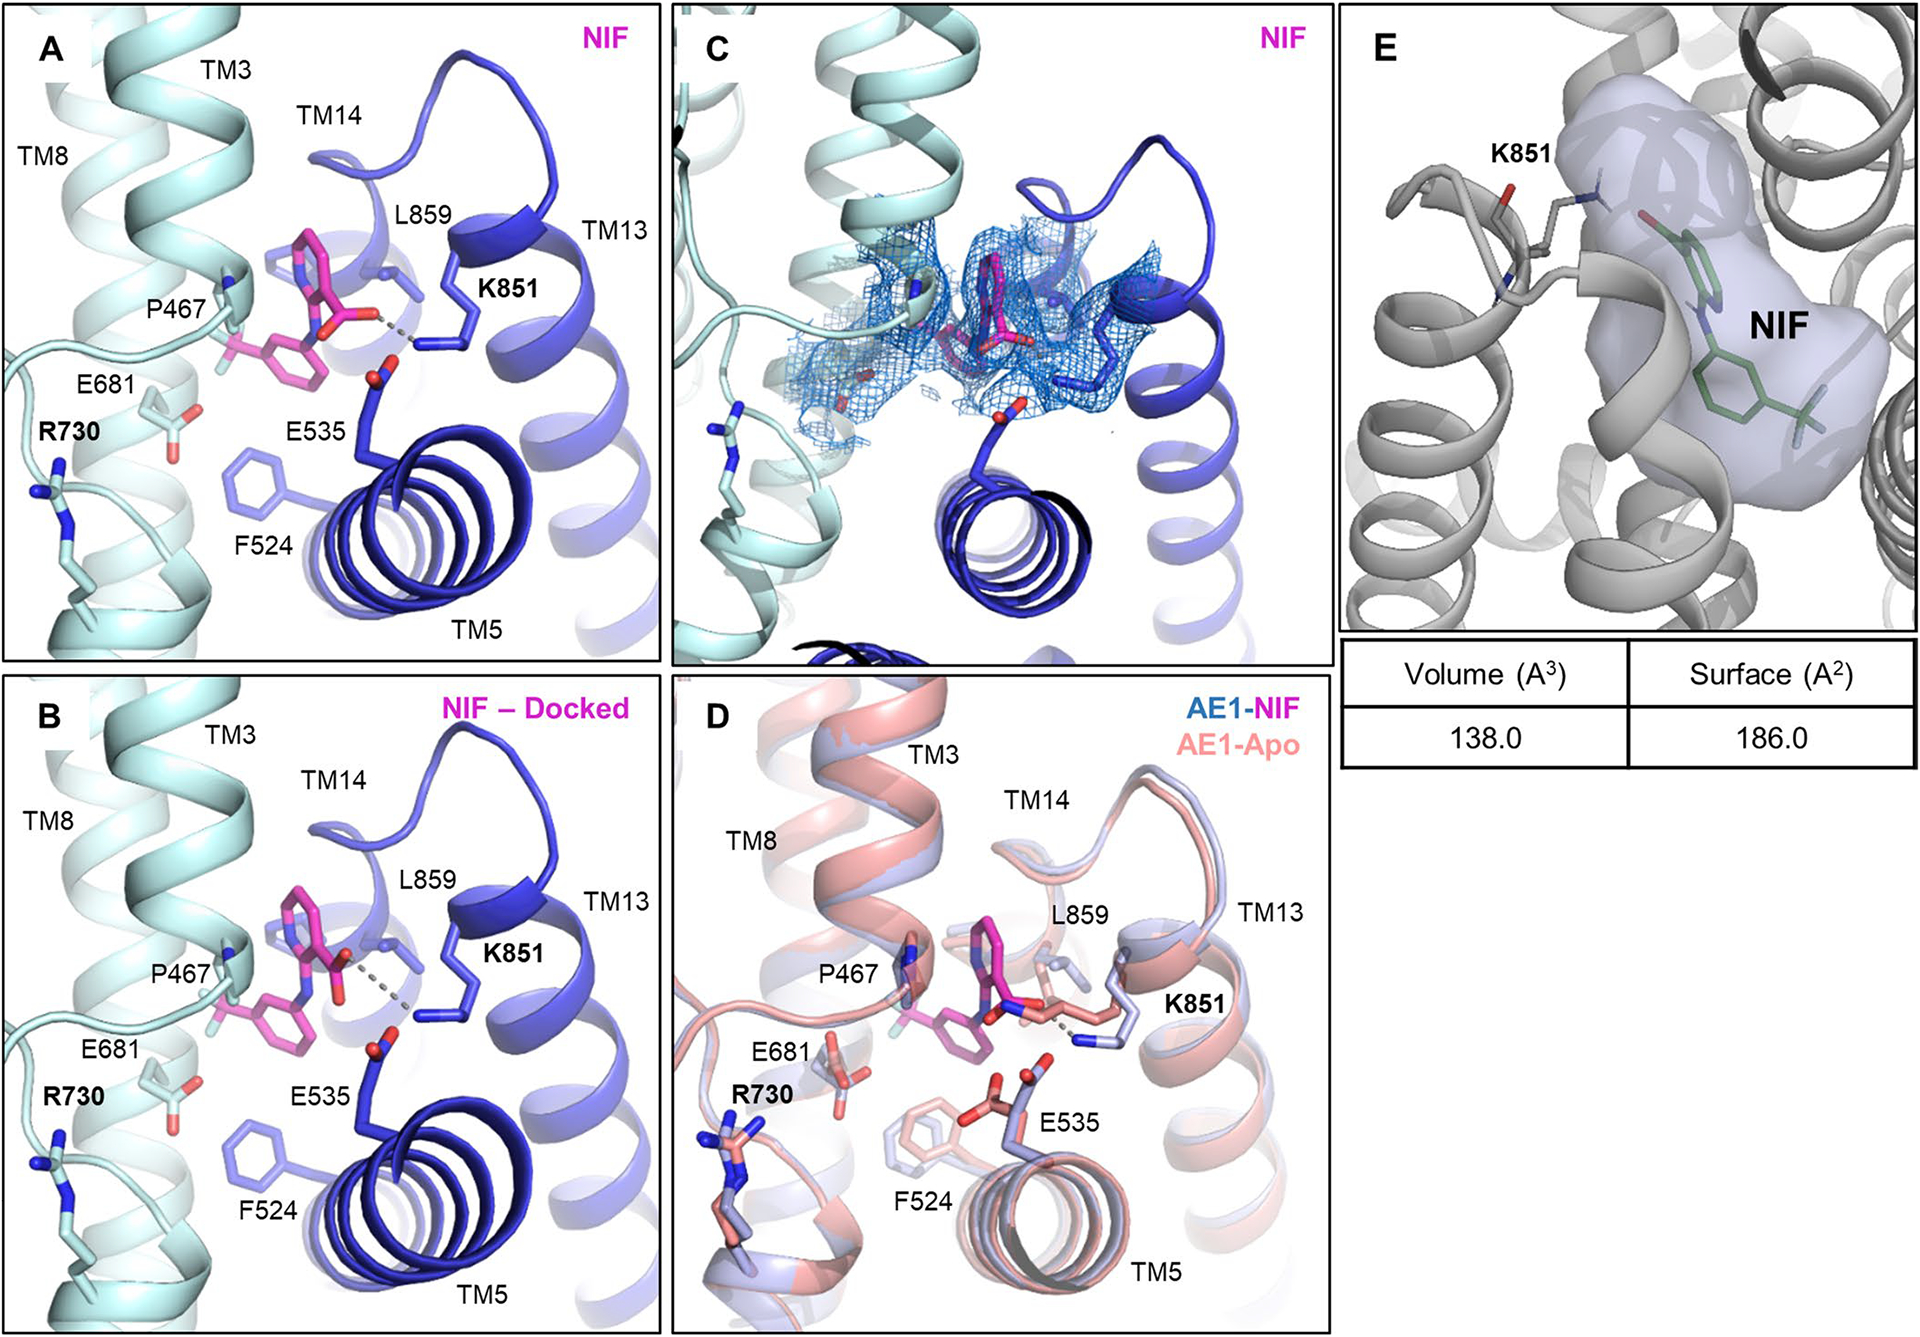
a-e, Close up of NIF binding site (a) and validation by molecular docking (b), with the best scoring docking pose shown (ΔG binding score: −52.33). c, Cryo-EM density of NIF and NIF binding site residues shown at a contour level of 3.5σ. d, Overlay of Apo (salmon) and NIF-bound AE1 (light blue) reveals subtle conformational rearrangements required for NIF binding. e, Calculation of NIF binding pocket volume and surface in POVME355. AE1’s gate and core domains are shown in tv blue and palecyan, respectively, and cryo-EM densities are shown as marine colored mesh.
Extended Data Fig. 8 |. Experimental testing of Compound 22 (Cmpd 22) analogs.
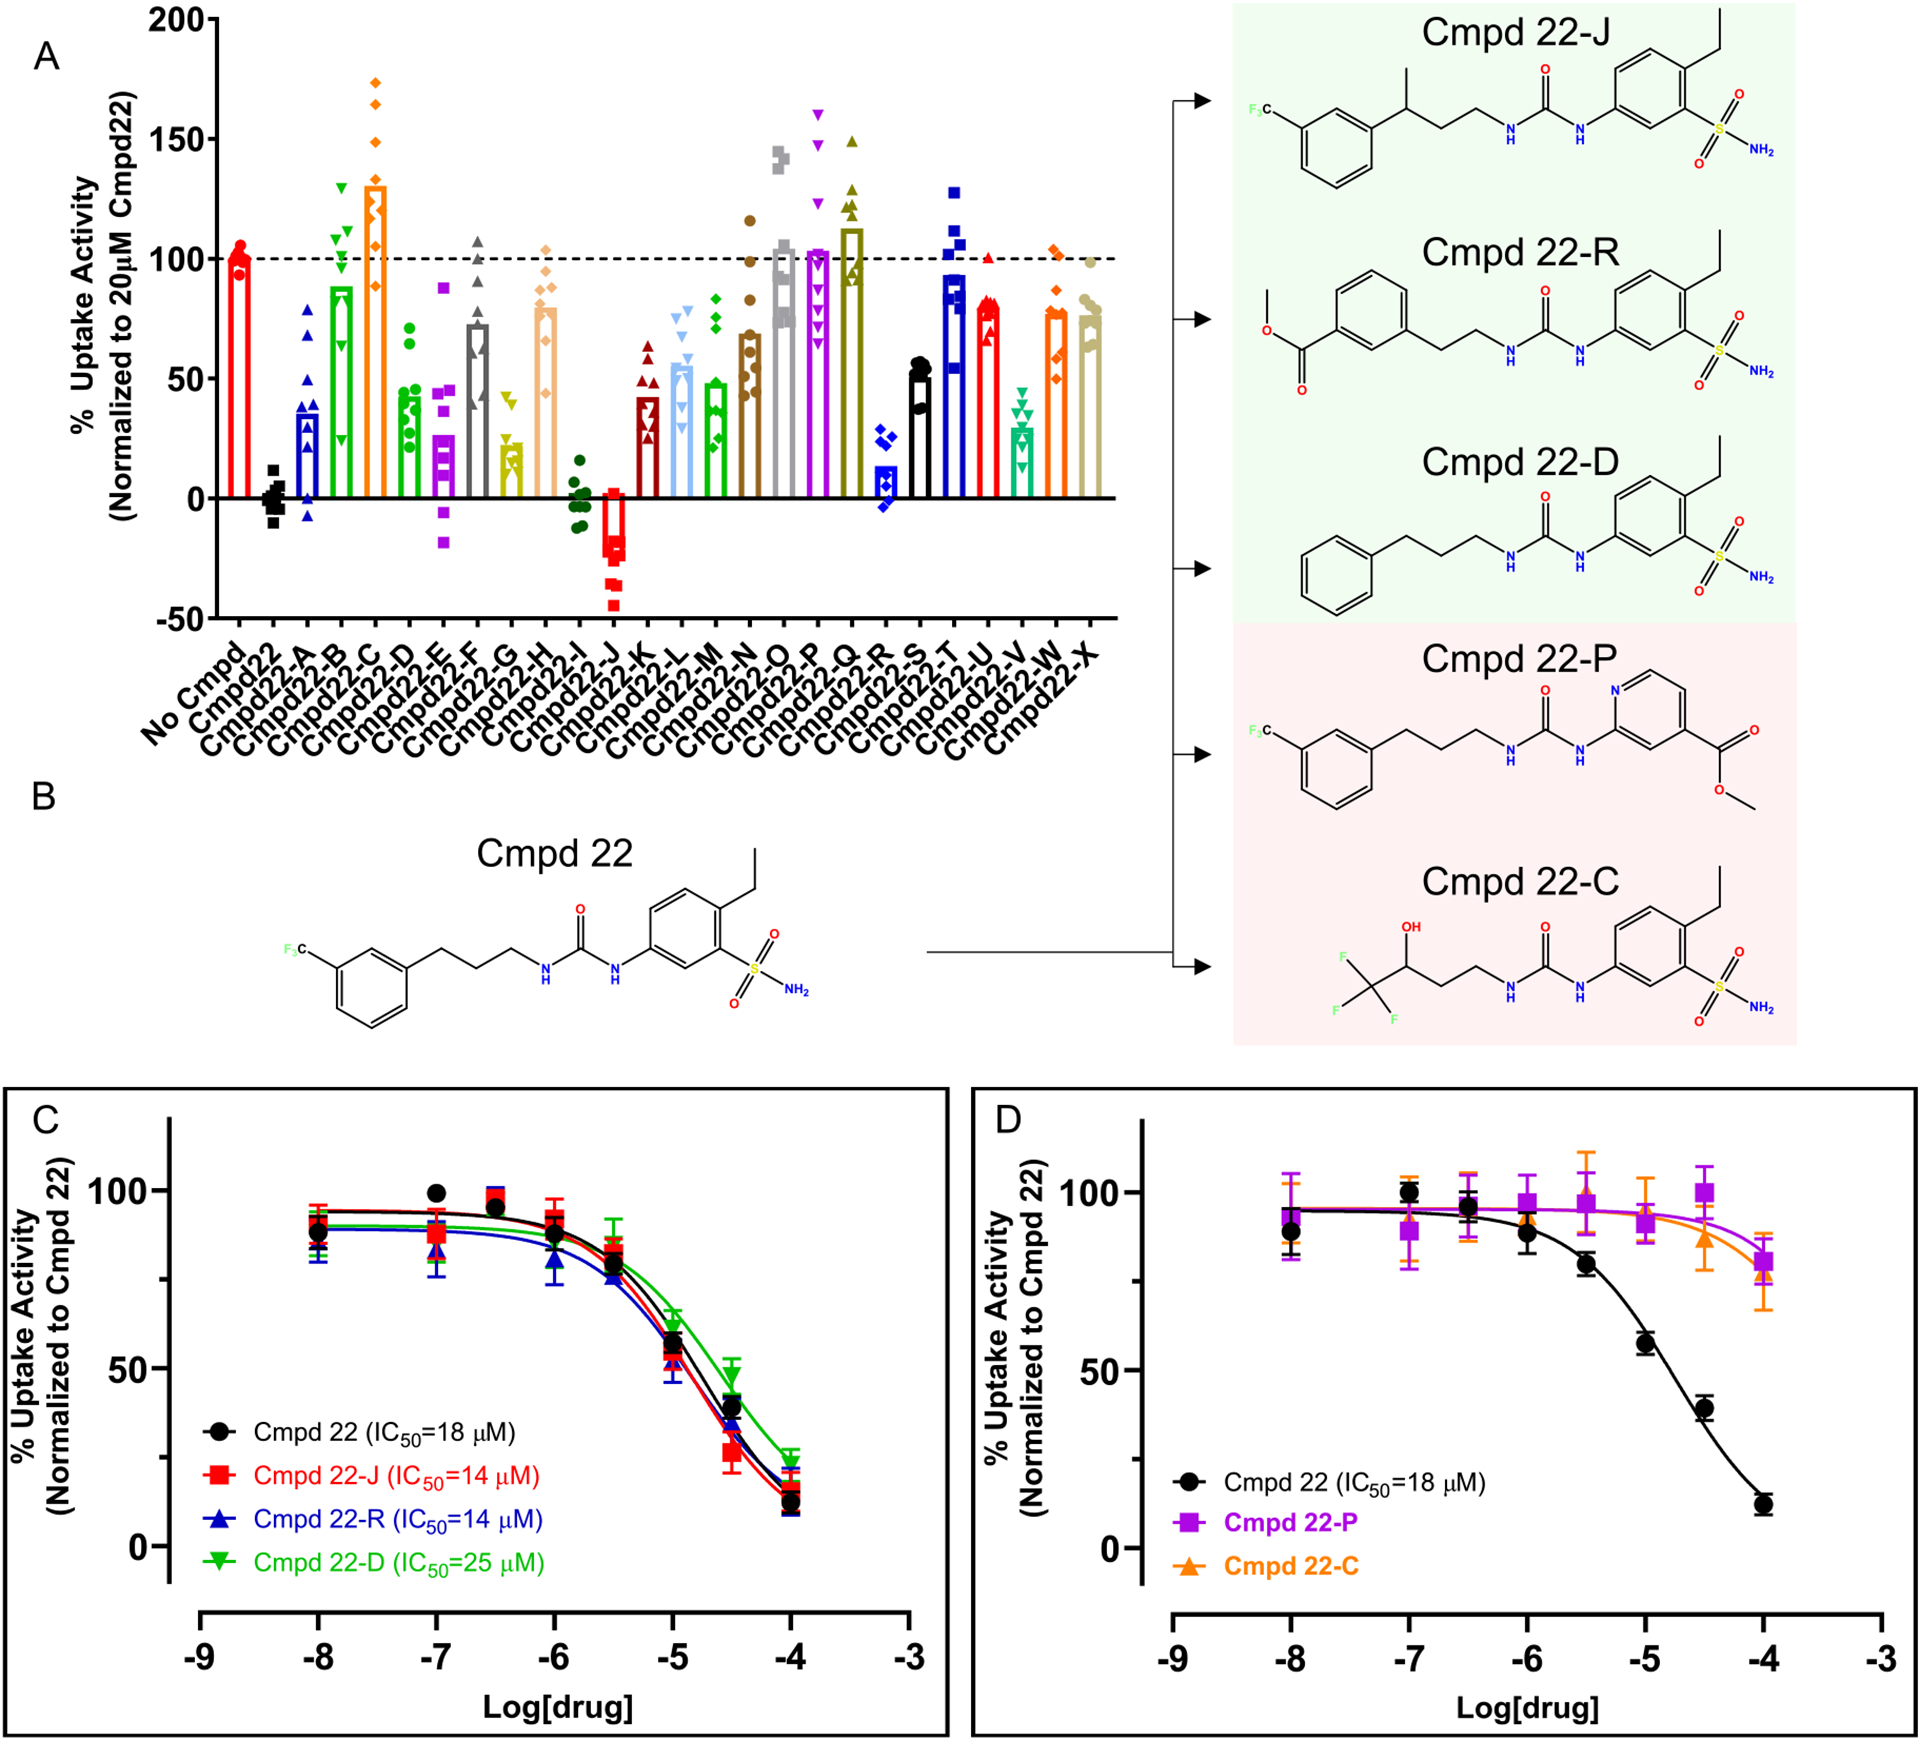
a, Inhibitory activity of 24 commercially available analogs of Cmpd 22 at 20 μM. Uptake experiments were performed with 2–6 technical repeats and are averaged from 3 independent experiments (n = 3). Data are represented as mean±s.e.m. b, Chemical structure of Cmpd 22 and selected analogs. c, d, Concentration response experiments show that Cmpd 22-J, Cmpd 22-R, and Cmpd 22-D have comparable inhibitory potencies as Cmpd 22 (c), while Cmpd 22-P and Cmpd 22-C appear to not inhibit AE1 (d). Concentration response uptake experiments were performed in triplicates and are averaged from 4 independent experiments (n = 4). Apparent potencies are calculated as apparent IC50 (mean) and error bars denote 95% confidence intervals. All uptake data have been normalized to Cmpd 22.
Extended Data Table 1 |.
Diego Antigens
| ISBT Number | Common Term | Historical Term | Residue | Nucleotide Change | Extracellular Loop |
|---|---|---|---|---|---|
| DI1 | Dia | Diego a | L854 | 2561T | 7 |
| DI2 | Dib | Diego b | P854 | 2561C | 7 |
| DI3 | Wra | Wright a | K658 | 1972A | 4 |
| DI4 | Wrb | Wright b | E658 | 1972G | 4 |
| DI5 | Wda | Waldner | V557M | 1669G>A | 3 |
| DI6 | Rba | Redelberger | P548L | 16430T | 3 |
| DI7 | WARR | Warrior | T552I | 1654C>T | 3 |
| DI8 | ELO | R432W | 1294C>T | 1 | |
| DI9 | Wu | Wulfsberg | G565A | 1694G>C | 3 |
| DI10 | Bpa | Bishop | N569K | 17070A | 3 |
| DI11 | Moa | Moen | R656H | 1967G>A | 4 |
| DI12 | Hga | Hughes | R656C | 1966G>T | 4 |
| DI13 | Vga | van Vugt | Y555H | 1663T>C | 3 |
| DI14 | Swa | Swann | R646N/R646W | 1937G>A/1936C>T | 4 |
| DI15 | BOW | Bowyer | P561S | 1681C>T | 3 |
| DI16 | NFLD | E429D, P561A | 1287A>T; 1681C>G | 1,3 | |
| DI17 | Jna | Nunhart | P566S | 1696C>T | 3 |
| DI18 | KREP | P566A | 1696C>G | 3 | |
| DI19 | Tra | Traversu | K551N | 1653C>G | 3 |
| DI20 | Fra | Froese | E480K | 1438G>A | 2 |
| DI21 | SW1 | R646W | 1936C>T | 4 | |
| DI22 | DISK | G565A | 1694G>C | 3 |
ISBT = International Society of Blood Transfusion
Extended Data Table 2 |.
Calculated bicarbonate binding energies for residues in the AE1 anion binding site
| Residue | Binding Energy |
|---|---|
| S465 | −0.19 |
| I528 | −0.62 |
| S529 | 0.12 |
| I531 | −0.17 |
| F532 | −0.25 |
| E681 | 0.37 |
| A726 | −0.46 |
| T727 | −6.66 |
| T728 | −2.55 |
| V729 | −3.97 |
| R730 | −11.33 |
| S731 | −0.38 |
| V732 | −0.15 |
| T733 | −0.21 |
| M795 | −0.13 |
Calculated bicarbonate binding energies for residues in the AE1 anion binding site
Supplementary Material
Acknowledgements
This work was supported by NIH grant GM133504, a Sloan Research Fellowship in Neuroscience, an Edward Mallinckrodt, Jr. Foundation Grant, a McKnight Foundation Scholars Award (all to D.W.), NIH T32 Training Grant GM062754 and DA053558 (G.Z.), R01 CA277794 (A.S. and K.H.), NIH grant U01AG046170 (B.Z.), NIH grant RF1AG057440 (B.Z.), NIH grant R01AG068030 (B.Z.) and NIH grants R01DK073681, R01DK067555 and R01DK061659 (R.O.). Some of this work was performed at the National Center for cryo-EM Access and Training (NCCAT) and the Simons Electron Microscopy Center located at the New York Structural Biology Center, supported by the NIH Common Fund Transformative High Resolution Cryo-Electron Microscopy program (U24 GM129539,) and by grants from the Simons Foundation (SF349247) and NY State Assembly. We further acknowledge cryo-EM resources at the National Resource for Automated Molecular Microscopy located at the New York Structural Biology Center, supported by grants from the Simons Foundation (SF349247), NYSTAR and the NIH National Institute of General Medical Sciences (GM103310) with additional support from Agouron Institute (F00316) and NIH (OD019994). For additional data collection we are also grateful to staff at the Laboratory for BioMolecular Structure (LBMS), which is supported by the DOE Office of Biological and Environmental Research (KP160711). This work was supported in part through the computational resources and staff expertise provided by Scientific Computing at the Icahn School of Medicine at Mount Sinai. We also thank J. F. Fay for help with initial data processing.
Footnotes
Online content
Any methods, additional references, Nature Portfolio reporting summaries, source data, extended data, supplementary information, acknowledgements, peer review information; details of author contributions and competing interests; and statements of data and code availability are available at https://doi.org/10.1038/s41594-023-01085-6.
Reporting summary
Further information on research design is available in the Nature Portfolio Reporting Summary linked to this article.
Competing interests
The authors declare no competing interests.
Extended data is available for this paper at https://doi.org/10.1038/s41594-023-01085-6.
Supplementary information The online version contains supplementary material available at https://doi.org/10.1038/s41594-023-01085-6.
Data availability
Density maps and structure coordinates have been deposited in the Electron Microscopy Data Bank (EMDB) and the Protein Data Bank (PDB): AE1-apo (EMD-26165 and PDB 7TY4), AE1–bicarbonate (EMD-26168 and PDB 7TY7), AE1–DIDS (EMD-41082 and PDB 8T6V), AE1–H2DIDS (EMD-26167 and PDB 7TY6), AE1–DEPC (EMD-26171 and PDB 7TYA), AE1–dipyridamole (EMD-41081 and PDB 8T6U), AE1–NIF (EMD-26169 and PDB 7TY8). Source data are provided with this paper.
References
- 1.Elgsaeter A, Stokke BT, Mikkelsen A & Branton D The molecular basis of erythrocyte shape. Science 234, 1217–1223 (1986). [DOI] [PubMed] [Google Scholar]
- 2.Poole J The Diego blood group system–an update. Immunohematology 15, 135–143 (1999). [PubMed] [Google Scholar]
- 3.Levine P, Robinson EA, Layrisse M, Arends T & Domingues Sisco R The Diego blood factor. Nature 177, 40–41 (1956). [DOI] [PubMed] [Google Scholar]
- 4.Reithmeier RA et al. Band 3, the human red cell chloride/bicarbonate anion exchanger (AE1, SLC4A1), in a structural context. Biochim. Biophys. Acta 1858, 1507–1532 (2016). [DOI] [PubMed] [Google Scholar]
- 5.Jennings ML Cell physiology and molecular mechanism of anion transport by erythrocyte band 3/AE1. Am. J. Physiol. Cell Physiol 321, C1028–C1059 (2021). [DOI] [PMC free article] [PubMed] [Google Scholar]
- 6.Kodippili GC et al. Analysis of the mobilities of band 3 populations associated with ankyrin protein and junctional complexes in intact murine erythrocytes. J. Biol. Chem 287, 4129–4138 (2012). [DOI] [PMC free article] [PubMed] [Google Scholar]
- 7.Thornell IM & Bevensee MO Regulators of Slc4 bicarbonate transporter activity. Front. Physiol 6, 166 (2015). [DOI] [PMC free article] [PubMed] [Google Scholar]
- 8.Vallese F et al. Architecture of the human erythrocyte ankyrin-1 complex. Nat. Struct. Mol. Biol 29, 706–718 (2022). [DOI] [PMC free article] [PubMed] [Google Scholar]
- 9.Xia X, Liu S & Zhou ZH Structure, dynamics and assembly of the ankyrin complex on human red blood cell membrane. Nat. Struct. Mol. Biol 29, 698–705 (2022). [DOI] [PMC free article] [PubMed] [Google Scholar]
- 10.Falke JJ & Chan SI Molecular mechanisms of band 3 inhibitors. 1. Transport site inhibitors. Biochemistry 25, 7888–7894 (1986). [DOI] [PubMed] [Google Scholar]
- 11.Falke JJ & Chan SI Molecular mechanisms of band 3 inhibitors. 2. Channel blockers. Biochemistry 25, 7895–7898 (1986). [DOI] [PubMed] [Google Scholar]
- 12.Falke JJ & Chan SI Molecular mechanisms of band 3 inhibitors. 3. Translocation inhibitors. Biochemistry 25, 7899–7906 (1986). [DOI] [PubMed] [Google Scholar]
- 13.Galanter WL & Labotka RJ The binding of nitrate to the human anion exchange protein (AE1) studied with 14N nuclear magnetic resonance. Biochim. Biophys. Acta 1079, 146–151 (1991). [DOI] [PubMed] [Google Scholar]
- 14.Arakawa T et al. Crystal structure of the anion exchanger domain of human erythrocyte band 3. Science 350, 680–684 (2015). [DOI] [PubMed] [Google Scholar]
- 15.Huynh KW et al. CryoEM structure of the human SLC4A4 sodium-coupled acid-base transporter NBCe1. Nat. Commun 9, 900 (2018). [DOI] [PMC free article] [PubMed] [Google Scholar]
- 16.Wang W et al. Cryo-EM structure of the sodium-driven chloride/bicarbonate exchanger NDCBE. Nat. Commun 12, 5690 (2021). [DOI] [PMC free article] [PubMed] [Google Scholar]
- 17.Casey JR, Pirraglia CA & Reithmeier RA Enzymatic deglycosylation of human Band 3, the anion transport protein of the erythrocyte membrane. Effect on protein structure and transport properties. J. Biol. Chem 267, 11940–11948 (1992). [PubMed] [Google Scholar]
- 18.Zhang D, Kiyatkin A, Bolin JT & Low PS Crystallographic structure and functional interpretation of the cytoplasmic domain of erythrocyte membrane band 3. Blood 96, 2925–2933 (2000). [PubMed] [Google Scholar]
- 19.Figueroa D The Diego blood group system: a review. Immunohematology 29, 73–81 (2013). [PubMed] [Google Scholar]
- 20.Daniels GL et al. Blood group terminology 2004: from the International Society of Blood Transfusion committee on terminology for red cell surface antigens. Vox Sang. 87, 304–316 (2004). [DOI] [PubMed] [Google Scholar]
- 21.Schubert D & Boss K Band 3 protein–cholesterol interactions in erythrocyte membranes. Possible role in anion transport and dependency on membrane phospholipid. FEBS Lett. 150, 4–8 (1982). [DOI] [PubMed] [Google Scholar]
- 22.Kalli AC & Reithmeier RAF Interaction of the human erythrocyte Band 3 anion exchanger 1 (AE1, SLC4A1) with lipids and glycophorin A: molecular organization of the Wright (Wr) blood group antigen. PLoS Comput. Biol 14, e1006284 (2018). [DOI] [PMC free article] [PubMed] [Google Scholar]
- 23.Gregg VA & Reithmeier RA Effect of cholesterol on phosphate uptake by human red blood cells. FEBS Lett. 157, 159–164 (1983). [DOI] [PubMed] [Google Scholar]
- 24.Zhu Q & Casey JR The substrate anion selectivity filter in the human erythrocyte Cl−/HCO3− exchange protein, AE1. J. Biol. Chem 279, 23565–23573 (2004). [DOI] [PubMed] [Google Scholar]
- 25.Lu F et al. Structure and mechanism of the uracil transporter UraA. Nature 472, 243–246 (2011). [DOI] [PubMed] [Google Scholar]
- 26.Case DA et al. AMBER 2020 (Univ. California, San Francisco, 2020). [Google Scholar]
- 27.Guarnieri F & Mezei M Simulated annealing of chemical potential: a general procedure for locating bound waters. Application to the study of the differential hydration propensities of the major and minor grooves of DNA. J. Am. Chem. Soc 118, 8493–8494 (1996). [Google Scholar]
- 28.Knauf PA, Law FY, Leung TW, Gehret AU & Perez ML Substrate-dependent reversal of anion transport site orientation in the human red blood cell anion-exchange protein, AE1. Proc. Natl Acad. Sci. USA 99, 10861–10864 (2002). [DOI] [PMC free article] [PubMed] [Google Scholar]
- 29.Okubo K, Kang D, Hamasaki N & Jennings ML Red blood cell band 3. Lysine 539 and lysine 851 react with the same H2DIDS (4,4′-diisothiocyanodihydrostilbene-2,2′-disulfonic acid) molecule. J. Biol. Chem 269, 1918–1926 (1994). [PubMed] [Google Scholar]
- 30.Lu J & Boron WF Reversible and irreversible interactions of DIDS with the human electrogenic Na/HCO3 cotransporter NBCe1-A: role of lysines in the KKMIK motif of TM5. Am. J. Physiol. Cell Physiol 292, C1787–C1798 (2007). [DOI] [PubMed] [Google Scholar]
- 31.Jin XR, Abe Y, Li CY & Hamasaki N Histidine-834 of human erythrocyte band 3 has an essential role in the conformational changes that occur during the band 3-mediated anion exchange. Biochemistry 42, 12927–12932 (2003). [DOI] [PubMed] [Google Scholar]
- 32.Izuhara K, Okubo K & Hamasaki N Conformational change of band 3 protein induced by diethyl pyrocarbonate modification in human erythrocyte ghosts. Biochemistry 28, 4725–4728 (1989). [DOI] [PubMed] [Google Scholar]
- 33.Liantonio A et al. Niflumic acid inhibits chloride conductance of rat skeletal muscle by directly inhibiting the CLC-1 channel and by increasing intracellular calcium. Br. J. Pharmacol 150, 235–247 (2007). [DOI] [PMC free article] [PubMed] [Google Scholar]
- 34.Cousin JL & Motais R Inhibition of anion permeability by amphiphilic compounds in human red cell: evidence for an interaction of niflumic acid with the band 3 protein. J. Membr. Biol 46, 125–153 (1979). [DOI] [PubMed] [Google Scholar]
- 35.Friesner RA et al. Glide: a new approach for rapid, accurate docking and scoring. 1. Method and assessment of docking accuracy. J. Med. Chem 47, 1739–1749 (2004). [DOI] [PubMed] [Google Scholar]
- 36.Carlsson J et al. Ligand discovery from a dopamine D3 receptor homology model and crystal structure. Nat. Chem. Biol 7, 769–778 (2011). [DOI] [PMC free article] [PubMed] [Google Scholar]
- 37.Maneri LR & Low PS Structural stability of the erythrocyte anion transporter, band 3, in different lipid environments. A differential scanning calorimetric study. J. Biol. Chem 263, 16170–16178 (1988). [PubMed] [Google Scholar]
- 38.Maneri LR & Low PS Fatty acid composition of lipids which copurify with band 3. Biochem. Biophys. Res. Commun 159, 1012–1019 (1989). [DOI] [PubMed] [Google Scholar]
- 39.Stewart AK et al. Functional characterization and modified rescue of novel AE1 mutation R730C associated with overhydrated cation leak stomatocytosis. Am. J. Physiol. Cell Physiol 300, C1034–C1046 (2011). [DOI] [PMC free article] [PubMed] [Google Scholar]
- 40.Jennings ML & Smith JS Anion–proton cotransport through the human red blood cell band 3 protein. Role of glutamate 681. J. Biol. Chem 267, 13964–13971 (1992). [PubMed] [Google Scholar]
- 41.Yang E et al. A Ser725Arg mutation in Band 3 abolishes transport function and leads to anemia and renal tubular acidosis. Blood 131, 1759–1763 (2018). [DOI] [PMC free article] [PubMed] [Google Scholar]
- 42.Zhekova HR et al. Identification of multiple substrate binding sites in SLC4 transporters in the outward-facing conformation: insights into the transport mechanism. J. Biol. Chem 296, 100724 (2021). [DOI] [PMC free article] [PubMed] [Google Scholar]
- 43.Thurtle-Schmidt BH & Stroud RM Structure of Bor1 supports an elevator transport mechanism for SLC4 anion exchangers. Proc. Natl Acad. Sci. USA 113, 10542–10546 (2016). [DOI] [PMC free article] [PubMed] [Google Scholar]
- 44.Ficici E, Faraldo-Gomez JD, Jennings ML & Forrest LR Asymmetry of inverted-topology repeats in the AE1 anion exchanger suggests an elevator-like mechanism. J. Gen. Physiol 149, 1149–1164 (2017). [DOI] [PMC free article] [PubMed] [Google Scholar]
- 45.Kalli AC & Reithmeier RAF Organization and dynamics of the red blood cell band 3 anion exchanger SLC4A1: insights from molecular dynamics simulations. Front. Physiol 13, 817945 (2022). [DOI] [PMC free article] [PubMed] [Google Scholar]
- 46.Colas C, Ung PM & Schlessinger A SLC transporters: structure, function, and drug discovery. MedChemComm 7, 1069–1081 (2016). [DOI] [PMC free article] [PubMed] [Google Scholar]
- 47.Garaeva AA & Slotboom DJ Elevator-type mechanisms of membrane transport. Biochem. Soc. Trans 48, 1227–1241 (2020). [DOI] [PMC free article] [PubMed] [Google Scholar]
- 48.Gasbjerg PK & Brahm J Kinetics of bicarbonate and chloride transport in human red cell membranes. J. Gen. Physiol 97, 321–349 (1991). [DOI] [PMC free article] [PubMed] [Google Scholar]
- 49.Garaeva AA, Guskov A, Slotboom DJ & Paulino C A one-gate elevator mechanism for the human neutral amino acid transporter ASCT2. Nat. Commun 10, 3427 (2019). [DOI] [PMC free article] [PubMed] [Google Scholar]
- 50.Gunn RB & Frohlich O Asymmetry in the mechanism for anion exchange in human red blood cell membranes. Evidence for reciprocating sites that react with one transported anion at a time. J. Gen. Physiol 74, 351–374 (1979). [DOI] [PMC free article] [PubMed] [Google Scholar]
- 51.Bjornsson TD & Mahony C Clinical pharmacokinetics of dipyridamole. Thromb. Res. Suppl 4, 93–104 (1983). [DOI] [PubMed] [Google Scholar]
- 52.Legrum B & Passow H Inhibition of inorganic anion transport across the human red blood cell membrane by chloride-dependent association of dipyridamole with a stilbene disulfonate binding site on the band 3 protein. Biochim. Biophys. Acta 979, 193–207 (1989). [DOI] [PubMed] [Google Scholar]
- 53.Offman E et al. Pharmacokinetics and pharmacodynamics of the antiplatelet combination aspirin (acetylsalicylic acid) plus extended-release dipyridamole are not altered by coadministration with the potent CYP2C19 inhibitor omeprazole. Am. J. Cardiovasc. Drugs 13, 113–120 (2013). [DOI] [PubMed] [Google Scholar]
- 54.Saniabadi AR et al. Dipyridamole increases human red blood cell deformability. Eur. J. Clin. Pharmacol 42, 651–654 (1992). [DOI] [PubMed] [Google Scholar]
- 55.Gimsa J & Ried C Do band 3 protein conformational changes mediate shape changes of human erythrocytes? Mol. Membr. Biol 12, 247–254 (1995). [DOI] [PubMed] [Google Scholar]
- 56.Wagner JR et al. POVME 3.0: software for mapping binding pocket flexibility. J. Chem. Theory Comput 13, 4584–4592 (2017). [DOI] [PMC free article] [PubMed] [Google Scholar]
- 57.Zheng SQ et al. MotionCor2: anisotropic correction of beam-induced motion for improved cryo-electron microscopy. Nat. Methods 14, 331–332 (2017). [DOI] [PMC free article] [PubMed] [Google Scholar]
- 58.Punjani A, Rubinstein JL, Fleet DJ & Brubaker MA cryoSPARC: algorithms for rapid unsupervised cryo-EM structure determination. Nat. Methods 14, 290–296 (2017). [DOI] [PubMed] [Google Scholar]
- 59.Rohou A & Grigorieff N CTFFIND4: fast and accurate defocus estimation from electron micrographs. J. Struct. Biol 192, 216–221 (2015). [DOI] [PMC free article] [PubMed] [Google Scholar]
- 60.Punjani A, Zhang H & Fleet DJ Non-uniform refinement: adaptive regularization improves single-particle cryo-EM reconstruction. Nat. Methods 17, 1214–1221 (2020). [DOI] [PubMed] [Google Scholar]
- 61.Yamashita K, Palmer CM, Burnley T & Murshudov GN Cryo-EM single-particle structure refinement and map calculation using Servalcat. Acta Crystallogr. D Struct. Biol 77, 1282–1291 (2021). [DOI] [PMC free article] [PubMed] [Google Scholar]
- 62.Liebschner D et al. Macromolecular structure determination using X-rays, neutrons and electrons: recent developments in Phenix. Acta Crystallogr. D Struct. Biol 75, 861–877 (2019). [DOI] [PMC free article] [PubMed] [Google Scholar]
- 63.The PyMOL Molecular Graphics System, Version 2.0 (Schrödinger, LLC; ). [Google Scholar]
- 64.Sanematsu K et al. Intracellular acidification is required for full activation of the sweet taste receptor by miraculin. Sci. Rep 6, 22807 (2016). [DOI] [PMC free article] [PubMed] [Google Scholar]
- 65.Jo S, Kim T, Iyer VG & Im W CHARMM-GUI: a web-based graphical user interface for CHARMM. J. Comput. Chem 29, 1859–1865 (2008). [DOI] [PubMed] [Google Scholar]
- 66.Mezei M Simulaid: a simulation facilitator and analysis program. J. Comput. Chem 31, 2658–2668 (2010). [DOI] [PubMed] [Google Scholar]
- 67.Sastry GM, Adzhigirey M, Day T, Annabhimoju R & Sherman W Protein and ligand preparation: parameters, protocols, and influence on virtual screening enrichments. J. Comput. Aided Mol. Des 27, 221–234 (2013). [DOI] [PubMed] [Google Scholar]
- 68.Lyne PD, Lamb ML & Saeh JC Accurate prediction of the relative potencies of members of a series of kinase inhibitors using molecular docking and MM-GBSA scoring. J. Med. Chem 49, 4805–4808 (2006). [DOI] [PubMed] [Google Scholar]
- 69.Sterling T & Irwin JJ ZINC 15—ligand discovery for everyone. J. Chem. Inf. Model 55, 2324–2337 (2015). [DOI] [PMC free article] [PubMed] [Google Scholar]
- 70.Jorgensen WL, Maxwell DS & Tirado-Rives J Development and testing of the OPLS all-atom force field on conformational energetics and properties of organic liquids. J. Am. Chem. Soc 118, 11225–11236 (1996). [Google Scholar]
- 71.Friesner RA et al. Extra precision glide: docking and scoring incorporating a model of hydrophobic enclosure for protein-ligand complexes. J. Med. Chem 49, 6177–6196 (2006). [DOI] [PubMed] [Google Scholar]
- 72.Schlessinger A et al. Structure-based discovery of prescription drugs that interact with the norepinephrine transporter, NET. Proc. Natl Acad. Sci. USA 108, 15810–15815 (2011). [DOI] [PMC free article] [PubMed] [Google Scholar]
- 73.Adams DJ Grand canonical ensemble Monte Carlo for a Lennard–Jones Fluid. Mol. Phys 29, 307–311 (1975). [Google Scholar]
Associated Data
This section collects any data citations, data availability statements, or supplementary materials included in this article.
Supplementary Materials
Data Availability Statement
Density maps and structure coordinates have been deposited in the Electron Microscopy Data Bank (EMDB) and the Protein Data Bank (PDB): AE1-apo (EMD-26165 and PDB 7TY4), AE1–bicarbonate (EMD-26168 and PDB 7TY7), AE1–DIDS (EMD-41082 and PDB 8T6V), AE1–H2DIDS (EMD-26167 and PDB 7TY6), AE1–DEPC (EMD-26171 and PDB 7TYA), AE1–dipyridamole (EMD-41081 and PDB 8T6U), AE1–NIF (EMD-26169 and PDB 7TY8). Source data are provided with this paper.


