

Abstract
Human exposure to known carcinogen 1,3-butadiene (BD) is common due to its high concentrations in automobile exhaust, cigarette smoke, and forest fires, as well as its widespread use in the polymer industry. The adverse health effects of BD are mediated by epoxide metabolites such as 3,4-epoxy-1-butene (EB), which reacts with DNA to form 1-hydroxyl-3-buten-1-yl adducts on DNA nucleobases. EB derived mercapturic acids (1- and 2-(N-acetyl-L-cysteine-S-yl)-1-hydroxybut-3-ene (MHBMA) and N-acetyl-S-(3,4-dihydroxybutyl)-L-cysteine (DHBMA)) and urinary N7-(1-hydroxyl-3-buten-1-yl) guanine DNA adducts (EB-GII) have been used as biomarkers of BD exposure and cancer risk in smokers and occupationally exposed workers. However, low but significant levels of MHBMA, DHBMA, and EB-GII have been reported in unexposed cultured cells, animals, and humans, suggesting that these metabolites and adducts may form endogenously and complicate risk assessment of butadiene exposure. In the present work, stable isotope labeling in combination with high resolution mass spectrometry was employed to accurately quantify endogenous and exogenous butadiene metabolites and DNA adducts in vivo. Laboratory rats were exposed to 0.3, 0.5, or 3 ppm of BD-d6 by inhalation, and the amounts of endogenous (d0) and exogenous (d6) DNA adducts and metabolites were quantified in tissues and urine by isotope dilution capillary liquid chromatography/high resolution electrospray ionization tandem mass spectrometry (capLC-ESI-HRMS/MS). Our results reveal that EB-GII adducts and MHBMA originate exclusively from exogenous exposure to BD, while substantial amounts of DHBMA are formed endogenously. Urinary EB-GII concentrations were associated with genomic EB-GII levels in tissues of the same animals. Our findings confirm that EB-GII and MHBMA are specific biomarkers of exposure to BD, while endogenous DHBMA predominates at sub-ppm exposures to BD.
Keywords: 1,3-butadiene; DNA adduct; mercapturic acid metabolites; endogenous; exogenous
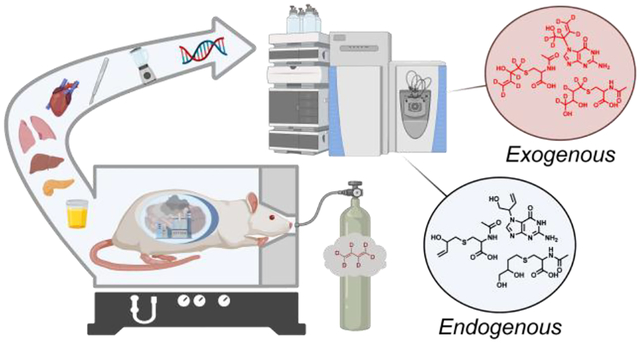
Graphical Abstract
Introduction
In December 2019, the US EPA designated the known human and animal carcinogen 1,3-butadiene (BD) as a high-priority substance for risk evaluation as required by of the Toxic Substances Control Act.1 BD is an important industrial and environmental chemical that is formed as a product of incomplete combustion of organic matter and fossil fuel, leading to widespread exposure of human populations. Following inhalation exposure, BD is metabolized to several epoxides that modify genomic DNA to give promutagenic DNA adducts. BD is metabolically activated to 3,4-epoxy-1-butene (EB, Figure 1),2 which can be detoxified via hydrolysis and conjugation with glutathione to form mercapturic acids: (1- and 2-(N-acetyl-L-cysteine-S-yl)-1-hydroxybut-3-ene (MHBMA) and N-acetyl-S-(3,4-dihydroxybutyl)-L-cysteine (DHBMA)) (Figure 1).3–6 BD-mercapturic acids are considered detoxification products and are excreted in urine.7
Figure 1.
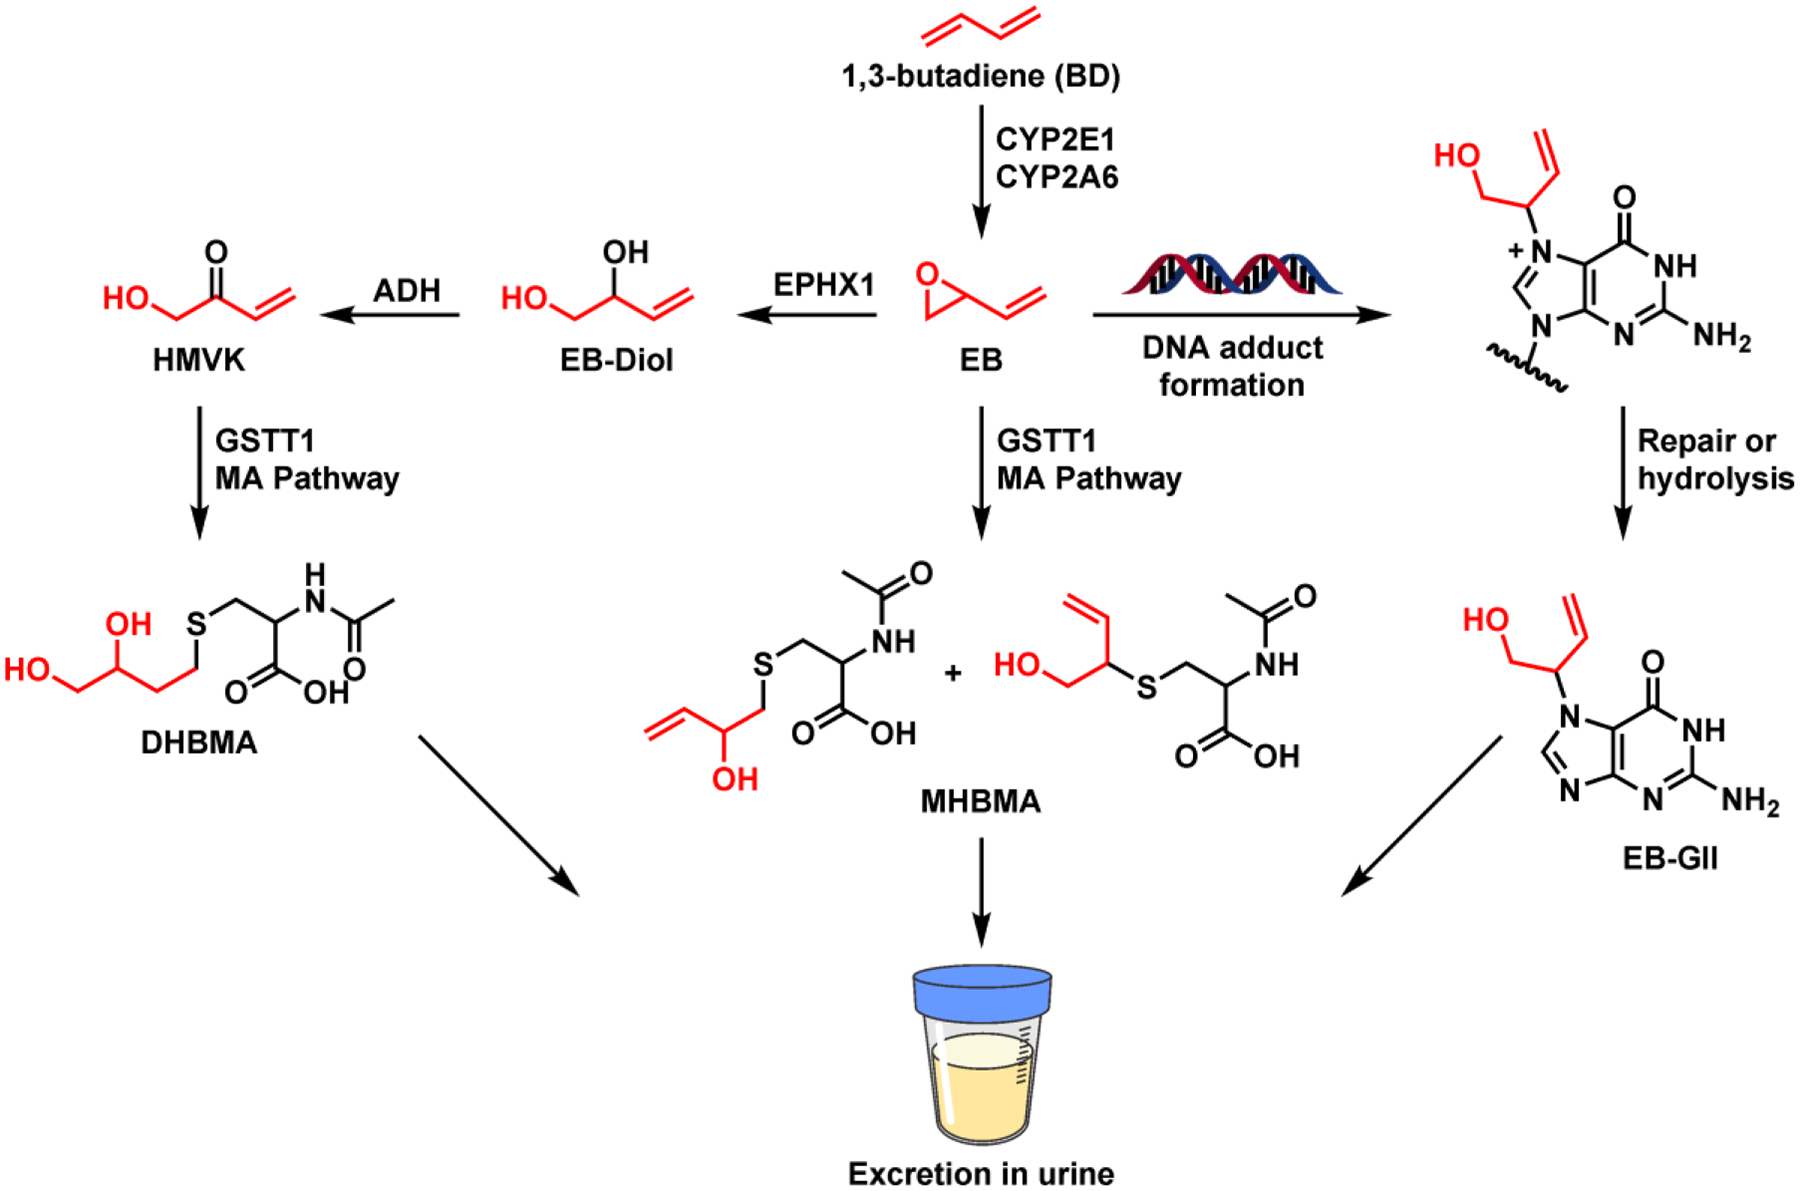
Metabolism of 1,3-butadiene (BD) and the formation of BD-DNA adducts.
Our earlier studies revealed that interspecies and gender differences observed in BD-induced cancer were directly related to differences in BD metabolism to DNA-reactive epoxides.8 If not detoxified, EB can react at nucleophilic sites in DNA to form DNA adducts such as EB-GII (Figure 1).9 Due to the inherent lability of the β-glycosidic bond upon N7-alkylation of dG, EB-GII adducts are spontaneously released from the DNA backbone (t1/2, 2.20 ± 0.12 days, Figure 1) and excreted in urine.10 Although EB-GII adducts are unlikely to be responsible for the carcinogenic effects of BD due to their ability to pair with the correct base (cytosine) during DNA replication, they can be converted to blocking and mutagenic formamidopyrimidine lesions.11–13 Due to their abundance and propensity to be spontaneously released from the DNA backbone, EB-GII adduct are useful biomarkers of total DNA damage associated with exposure to BD.9
Urinary metabolites (MHBMA and DHBMA) and free base DNA adducts (EB-GII) that result from spontaneous depurination of N7-guanine adducts from DNA (Figure 1) have been previously evaluated as biomarkers of exposure to BD in humans. The concentrations of all three urinary biomarkers were higher in smokers as compared to non-smokers14,15 and were associated with ethnicity15 and lung cancer risk in smokers (Jokipii Krueger et al., manuscript in revision). While urinary MHBMA and EB-GII significantly decreased upon smoking cessation,7,16 DHBMA excretion in urine was unaffected by smoking status, suggesting that it can be formed from another source.7,16 Genomic EB-GII has similarly been used to evaluate occupational exposure to BD in polymer industry workers.17,18 Despite their common use as biomarkers of exposure to BD, EB-GII, MHBMA and DHBMA have been reported in biological samples collected from non-smokers with no known exposures to BD,16,19 suggesting that they could potentially be formed as a result of normal cellular metabolism.
Endogenous formation of adducts and metabolites can complicate their use as biomarkers in risk assessment, as they interfere with the determination of specific exogenous exposure to carcinogens like BD. If endogenous concentrations of BD-like adduct species are similar in concentration to exogenous values, the observed inter-individual differences in biomarker levels could be attributed to differences in their endogenous formation rather than exogenous exposure. For example, the Swenberg laboratory has previously shown that formaldehyde-DNA adducts present in tissues originated primarily from endogenous sources, and their levels were unaffected by exposure to low levels of formaldehyde.20,21 Similar studies have determined that the contributions of endogenous metabolites to adduct formation can significantly outweigh the effects of exogenous exposure to acrolein, ethylene oxide, methylglyoxal, and acetaldehyde.20,22,23
The goal of the present work was to accurately quantify endogenous and exogenous contributions to EB-GII, MHBMA, and DHBMA adducts in an animal exposure model. To our knowledge, this study is the first to interrogate endogenous and exogenous sources of BD adducts and metabolites in vivo, allowing us to evaluate their utility in epidemiological studies evaluating inter-individual differences in cancer risk and quantitative risk assessment.
Materials and Methods
Chemicals and materials
Liquid chromatography-mass spectrometry (LC-MS) grade water and acetonitrile were purchased from Fisher Scientific (Pittsburg, PA). Strata X polymeric reversed phase SPE cartridges (30 mg/1 mL) were procured from Phenomenex (Torrance, CA). Oasis HLB reversed-phase cartridges (30 mg) were obtained from Waters (Milford, MA). MHBMA, DHBMA, and d7-DHBMA standards were purchased from Toronto Research Chemicals (Toronto, ON, Canada). EB-GII and 15N5-EB-GII standards were synthesized as previously reported.24,25 Salmon sperm DNA used in genomic EB-GII method validation was purchased from Invitrogen, a subsidiary of ThermoFisher Scientific (Waltham, MA). Urine creatinine (Cr) concentrations were determined with creatinine assay kit (p/n KGE005) from R&D Systems a subsidiary of Bio-Techne (Minneapolis, MN). All other chemicals and solvents were purchased from Sigma-Aldrich (St. Louis, MO) unless otherwise specified.
Animal treatments with d6-BD and sample collection
All animal treatments were conducted at the Lovelace Biomedical Research Institute (Albuquerque, NM). Forty Sprague-Dawley rats (aged 23–78 weeks) were used in this study. The rats were selected at random and matched by body weight into 4 groups of 10 animals (5 male and 5 female) per group (Table S1). Animals of different ages were included in order to investigate the effects of age on the biomarkers measured in this study, as age could affect the formation of both endogenous and exogenous DNA adducts and metabolites.26,27 Prior to exposure, animals were conditioned in metabolism cages for 24 h. Rats were exposed to BD-d6 gas using a flow past nose-only inhalation chamber for 6 h/day for 7 days. The exposure concentrations were 0.3, 0.5, and 3 ppm. The control group was exposed to filtered air for 6 h/day for 7 days using a flow past exposure chamber. At the conclusion of exposures on day 7, animals were placed into metabolism cages for 18 h. Urine was collected following the last day of BD-exposure and stored at −80 °C prior to analysis. As much urine as possible was collected in metabolic cages with an average range of 1–10 mL. Animals were euthanized by intraperitoneal injection of the barbiturate based sedative Euthasol, and euthanasia was confirmed by pneumothorax. Following the confirmation of death, necropsy was performed to collect liver, pancreas, heart, and lungs. These tissues were selected as they are sites for tumor formation upon butadiene exposure of rats.28 Tissue samples were flash frozen in liquid nitrogen and stored at −80 °C until DNA extraction. Urinary creatinine levels were measured using the ParameterTM Creatinine Assay Kit (R&D Systems, Minneapolis, MN) according to the manufacturer instructions.
capLC-ESI−-HRMS/MS analysis of urinary MHBMA and DHBMA
Urine samples were processed as previously described,16 with the exception that MHBMA-d0 (27 ng) was used as an internal standard for quantification of MHBMA-d6. The previously described HPLC-ESI−-MS/MS method16 was adapted for use with a Dionex UlitMate 3000 RSLCnano HPLC system (Thermo Fisher Scientific Corp., Waltham, MA) fitted with a 5 μL injection loop and interfaced to a Q Exactive Orbitrap instrument (Thermo Fisher Scientific Corp., Waltham, MA). DHBMA eluted as a sharp peak at 7.3 min, while MHBMA eluted as two peaks at 10.4 and 11.1 minutes corresponding to MHBMA-1 and MHBMA-2 (Figure 2D).
Figure 2.

Representative traces for capLC-ESI+-HRMS/MS analysis BD-mercapturic acids in urine of control and exposed rats. (A) DHBMA in urine of control rat (B) DHBMA in urine of d6-BD exposed rats (C) MHBMA in urine of control rats and (D) MHBMA in urine of d6-BD exposed rats.
Tandem mass spectrometry analyses were conducted by fragmenting [M-H]− ions of MHBMA-d0 (m/z 232.1) in the collision activated dissociation (CAD) cell of the instrument using the normalized collision energy (NCE) of 25 and isolation width (IW) of 1.0 amu (Table S2). The resulting fragment ions [M-N-acetyl-Cys-H]− (m/z 103.0223) were detected in the mass range of m/z 50–270 using an Orbitrap Q Exactive mass analyzer (HRMS) operated at a resolution of 70,000. MHBMA-d6 was detected using an analogous scan event consisting of fragmentation of m/z 238.1 → 109.0600. DHBMA was detected by fragmenting the ions at m/z 250.1 ([M-H]−) to m/z 121.0329 with NCE of 35. DHBMA-d5 and DHBMA-d7 were detected through analogous scan events consisting of fragmentation of m/z 255.1 → 126.0643 and m/z 257.1 → 128.0768, respectively.
Internal QC samples (pooled rat urine) were included after every 10 samples on 96-well plates. Statistical analyses were conducted to determine coefficient of variation (CV). The %CV of urinary MHBMA-d6 (pmol/mL urine) and DHBMA-d5 (pmol/mL urine) were 4.4% and 6.4%, respectively. Method’s LOD and LOQ were estimated as 3.3σ/S and 10σ/S, where S is the slope of the validation curve in synthetic urine spiked with MHBMA and DHMBA standards and σ is the standard deviation of the slope.29 Method’s LOD was 0.22 pmol/mg Cr and 0.58 pmol/mg Cr urine and method’s LOQ was 0.73 pmol/mg Cr and 1.66 pmol/mg Cr for MHBMA and DHBMA, respectively.
NanoLC-ESI+-HRMS/MS analysis of urinary EB-GII
Urine samples were processed as previously described.10,15,16 The published nanoLC-ESI+-HRMS3 method was adapted for use with a Dionex UltiMate 3000 RSLCnano HPLC system (Thermo Fisher Scientific Corp., Waltham, MA) fitted with a 5 μL injection loop and interfaced to a Q Exactive Orbitrap equipped with a nanospray source (Thermo Fisher Scientific Corp., Waltham, MA). EB-GII (Figure 3A) eluted as a sharp peak at 17.4 min.
Figure 3.
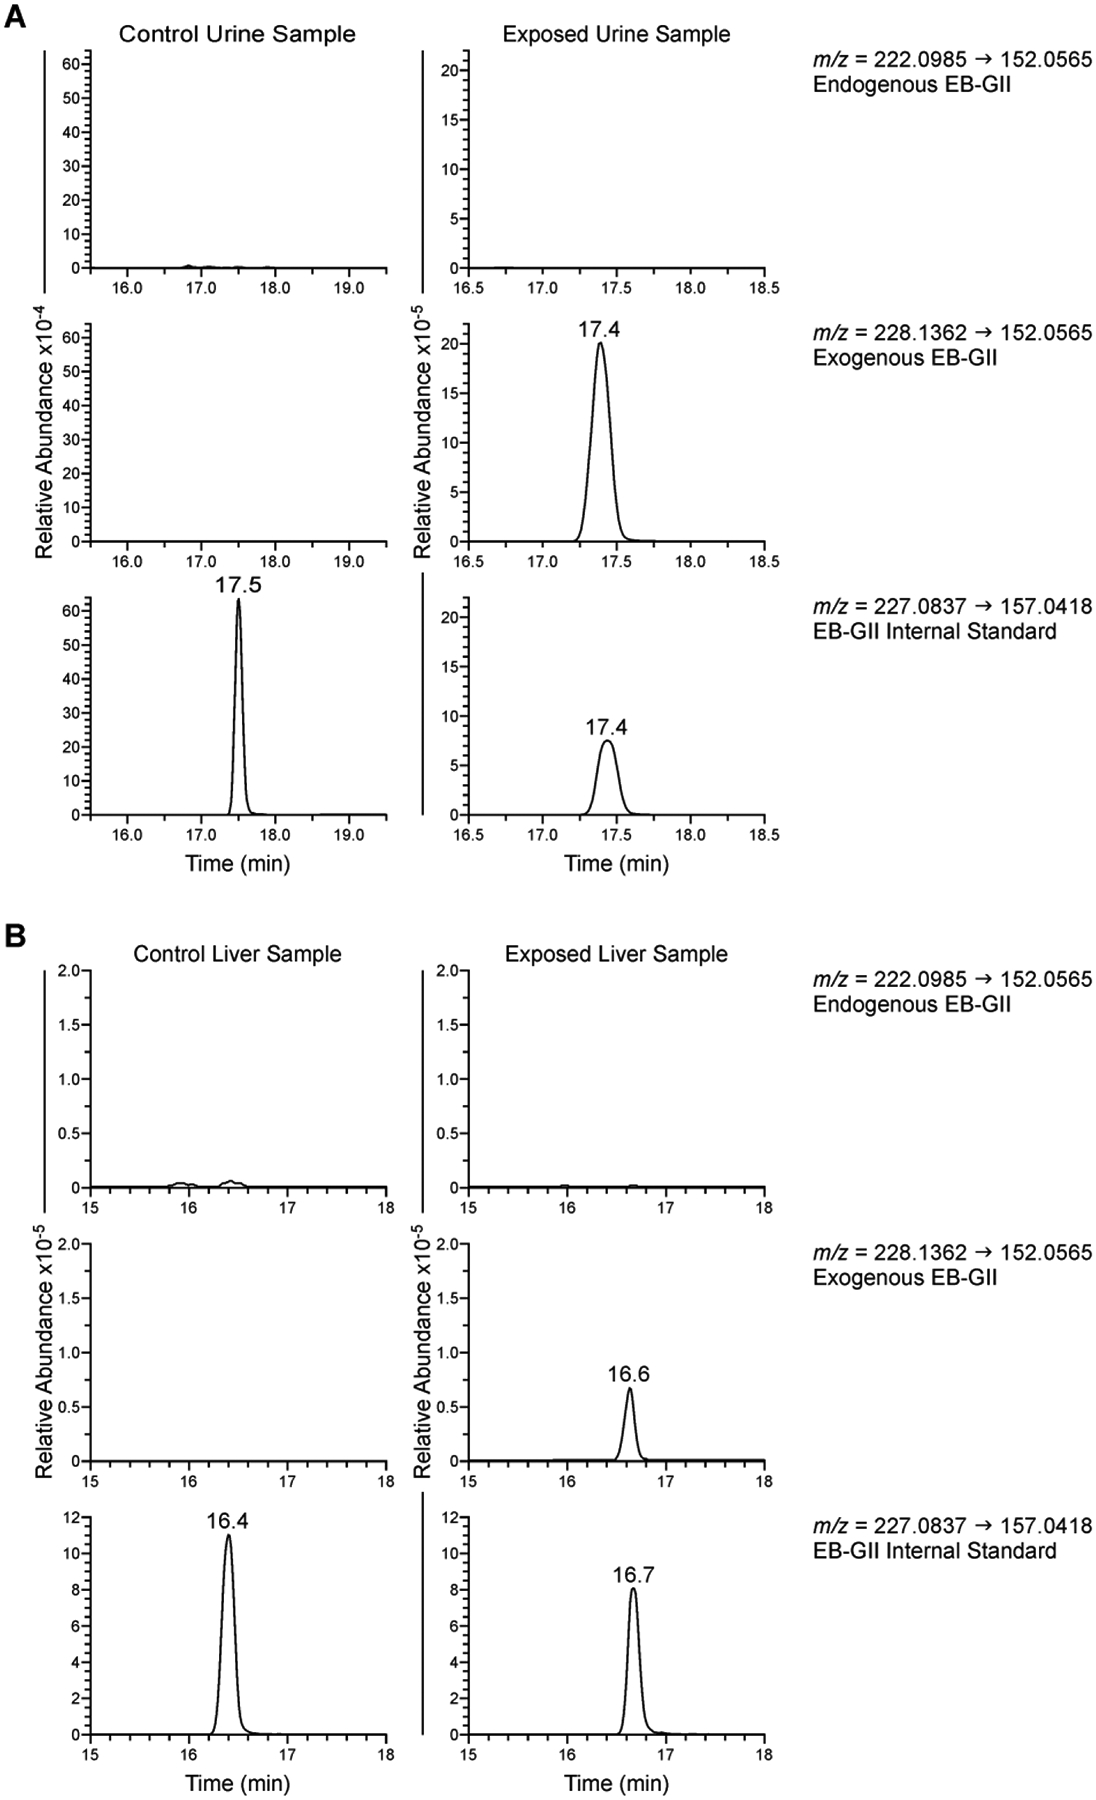
Typical nanoLC-NSI+-HRMS/MS traces of EB-GII adducts in urine (A) and genomic DNA (B).
Tandem mass spectrometry analysis was conducted by fragmenting the [M+H]+ ions of EB-GII (m/z 222.1) in the CAD cell of the instrument using the NCE of 30 and IW of 1.0 amu (Table S2). The resulting fragment ions ([Gua+H]+ m/z 152.0565) were detected in the mass range of m/z 50–270 using the Orbitrap mass analyzer (HRMS) at a resolution of 70,000. The d6-labeled adducts originating from BD-d6 treatment were detected using a second MS/MS scan event consisting of fragmentation of m/z 228.1 ([M+H]+) to m/z 152.0565 ([Gua+H]+). The 15N5-labeled internal standard was detected using an MS/MS scan event consisting of fragmentation of m/z 227.1 ([M+H]+) to m/z 157.0418 ([15N5-Gua+H]+). EB-GII and EB-GII-d6 amounts were determined by comparing the peak areas of extracted ion chromatograms corresponding to the analyte and the internal standard using standard curves generated by analyzing known analyte amounts.
Internal QC samples (pooled rat urine) were included after every 10 samples on 96 well plates. Statistical analyses were conducted to determine the coefficient of variation (CV). The %CV for EB-GII-d6 was 8.5%. Method’s LOD and LOQ were estimated as 3.3σ/S and 10σ/S, where S is the slope of the validation curve in synthetic urine spiked with synthetic EB-GII standards and σ is the standard deviation of the slope.29 Method’s LOD was 0.32 fmol/mL urine and method’s LOQ was 0.96 fmol/mL urine.
NanoLC-ESI+-HRMS/MS analysis of genomic EB-GII
DNA was isolated from frozen tissues using a previously described method,30 with the following modifications to enhance purity. Briefly, 200 mg of tissue was homogenized into 6 mL of cell lysis solution using a TissueRuptor II (Qiagen, Hilden, Germany), followed by the addition of 30 μL of Puregene Proteinase K solution (Qiagen, Hilden, Germany). Samples were incubated overnight to achieve cell lysis, followed by incubation with 30 μL of Puregene RNase A solution (Qiagen, Hilden, Germany) for 2 h for RNA digestion. Proteins were precipitated with 2 mL of protein precipitation solution (Qiagen, Hilden, Germany), followed by centrifugation at 2000 × g for 15 min. DNA was precipitated with 10 mL of isopropyl alcohol and stored at −20 °C overnight, followed by centrifugation at 2000 g to pellet DNA. DNA was reconstituted in 1 mL of 10 mM Tris-HCl, pH 7.5 and subjected to a second incubation with 30 μL of RNase A solution (Qiagen, Hilden, Germany) for 2 h. RNase A was precipitated via the addition of 750 μL of Protein Precipitation Solution (Qiagen, Hilden, Germany), followed by centrifugation at 2000 × g for 15 min. A 24:1 mixture of chloroform and isoamyl alcohol (Sigma Aldrich, St. Louis, MO, USA) (1.75 mL) was added to each sample, vortexed for 20 sec, and centrifuged at 3100 × g for 15 min. The upper layer containing DNA was removed, and DNA was precipitated with the addition of isopropyl alcohol (4 mL). DNA was washed with 70% ethanol in water (1 mL) and 100% ethanol (1 mL).
DNA samples (50–150 μg) were concentrated under reduced pressure, spiked with 5 fmol of 15N5-EB-GII (internal standard for mass spectrometry), and brought up to the final volume of 100 μL with water. The sample solution was heated at 70 °C for 1 h and filtered through 10K Nanosep spin filter (Pall, Port Washington, NY, USA). The filtrates were combined with 5 μL of a 0.1 mg/mL solution of dA (HPLC retention time marker) and subjected to offline HPLC cleanup on an Agilent 1260 series HPLC system equipped with a fraction collector and UV detector (Agilent Technologies, Santa Clara, CA, USA). A Supelcosil LC-18-DB column (250 mm × 4.6 mm, 5 μm, Phenomenex, Torrance, CA, USA) was eluted at a flow rate of 1 mL/min with a gradient of 0.4% formic acid in water (A) and acetonitrile (B). Solvent composition began at 0% B and was linearly increased to 10% B over 6 min, 12% B over 6 min, and 60% B over 18 min. The solvent composition was held at 60% B for 1 min, returned to 0% B over 1 min, and maintained at 0% B for 8 min. Under these conditions, dA eluted at 8 min, and the fraction containing EB-GII and its internal standard was collected between 8.9 and 10 min (1.1 mL). Samples were dried under reduced pressure and subjected to another offline HPLC cleanup step as previously described.16 Fractions containing EB-GII and its internal standard were dried under nitrogen, reconstituted in 15 μL of 0.01% acetic acid in water, and subjected to nanoLC-ESI+-HRMS/MS analysis as described above for urinary EB-GII.
Method QC samples were included at the beginning and end of each offline-HPLC purification sequence to check method precision and background analyte signals. Method’s LOD and LOQ were estimated as 3.3σ/S and 10σ/S, where S is the slope of the validation curve in salmon sperm DNA spiked with synthetic EB-GII standards and σ is the standard deviation of the slope.29 Method’s LOD was 0.078 adducts/109 nucleotides and method’s LOQ was 0.237 adducts/109 nucleotides.
Statistical Methods
Baseline characteristics and lab outcomes were summarized for all animals and by dose level using descriptive statistics. To investigate the association between dose level and baseline characteristics, Student’s t-tests or Kruskal Wallis tests were used for continuous variables; Chi-square tests were used for categorical variables. Lab values that were less than the LOD were imputed with the LOD/2, values that were between the LOD and LOQ were imputed with LOQ/2, and all other values were unchanged. Visual tests for outliers were performed, as well as Grubb’s and Rosner’s tests for outliers. To investigate the effect of covariates on outcomes, multivariable linear regression models were used. Outcomes were log transformed and presented as ratios of geometric means (GM) and 95% confidence intervals (CI). Similar analyses were used to investigate the association between biomarkers of exposure and exogenous urinary EB-GII. All reported p-values are two-sided and a significance level of 0.05 was used. Statistical analyses were performed using R (version 4.1.2, R Core Team) and SAS (version 9.4, SAS Institute Inc., Cary, North Carolina).
Results
Study design
The primary goal of this study was to compare the levels of endogenous and exogenous BD metabolites and DNA adducts following inhalation exposure to sub ppm and low ppm levels of BD. For reference, typical exposure levels to BD in monomer and polymer industry are < 1 ppm,31,32 while environmental exposures to BD are significantly lower.33,34 Sprague-Dawley rats (male and female, 5 per group) were exposed to 0.3, 0.5, and 3 ppm BD-d6 for 6 h/day for 7 days using nose-only inhalation chambers (Table S1). Since endogenous adduct concentrations may vary with age, we included animals aged 23–78 weeks. A control group was matched by age and weight and was exposed to filtered air. Urine was collected on day 7 using metabolic cages. Following exposure, animals were sacrificed and liver, lung, heart, and pancreas tissues were collected and frozen until analysis. Since BD-d6 was used, any metabolites or adducts originating from exogenous exposure carried a stable isotope tag and could be readily distinguished from endogenously generated species from their molecular weight, as the addition of each deuterium atom adds 1.0063 mass units (Table S2). Sensitive and specific capillary liquid chromatography/electrospray ionization tandem mass spectrometry (capLC-ESI+-HRMS/MS) methods developed in our laboratory15,16 utilized high resolution mass spectrometry analysis on an Orbitrap Q Exactive mass analyzer to allow for accurate mass determination.
Urinary excretion of endogenous and exogenous BD-mercapturic acids
MHBMA, MHBMA-d6, DHBMA, and DHBMA-d5 were quantified in rats exposed to 0–3 ppm BD-d6. It should be noted that DHBMA-d5, rather than DHBMA-d6, is formed upon exposure to BD-d6 due to the loss of one deuterium atom upon alcohol dehydrogenase mediated oxidation of EB-diol to HMVK during the formation of DHBMA from BD-d6 (Table S2, Figure 1). Endogenous and exogenous metabolites were distinguished based on their molecular weight during HRMS analysis. Figure 2 shows representative traces for capLC-ESI−-HRMS/MS analysis of DHBMA and MHBMA in urine of control animals exposed to filtered air and animals exposed to BD-d6 (0.5 ppm). In control animals, only the endogenous DHBMA (m/z 250.0755) was observed (Figure 2A). In BD-d6 treated animals, we observed capLC-ESI−-HRMS/MS peaks corresponding to both endogenous (m/z 250.0755) and exogenous DHBMA (m/z 255.1069). Exogenous DHBMA levels increased with elevated exposure levels (421.09 ± 1.40, 422.06 ± 1.64, and 4062.21 ± 1.58 pmol/mg creatinine (Cr) urine at 0.3, 0.5, and 3 ppm BD respectively, Figure 4A and Table S3), showing a strong association of DHBMA with BD exposure concentrations (p<0.001, Table S4).
Figure 4.

Urinary DHBMA (A) and MHBMA (B) and EB-GII (C) by BD dose: exogenous adducts/metabolites (gold) and endogenous adducts/metabolites (red).
Endogenous DHBMA levels in unexposed animals stayed within the range of 2042.67 ± 1.37 pmol/mg Cr urine (Table S3, Figure 4A), with higher concentrations observed in female rats (p=0.017, Table S5). Endogenous DHBMA excretion was not associated with exposure level (p=0.101, Table S5). In animals treated with sub-ppm levels of BD-d6 (0.3 and 0.5 ppm), the concentrations of endogenous DHBMA were 4–5-fold greater than exogenous DHBMA-d5 originating from BD-d6 (Table S3). In the highest exposure group (3 ppm), the contribution of endogenous metabolites was approximately 30% of the total DHBMA excreted (1718.70 vs 4062.21 pmol/mg creatinine, Table S3). Overall, our data provide unambiguous evidence that endogenous sources contribute significantly to the overall levels of urinary DHBMA, providing a possible explanation for poor association of this biomarker with smoking status in previous studies.7,16
MHBMA concentrations in rat urine changed non-linearly upon increasing BD-d6 exposure levels (422.73 ± 1.56, 341.19 ± 1.28, and 3447.53 ± 1.73 pmol/mg Cr urine at 0.3, 0.5, and 3 ppm BD respectively, Table S3). In contrast to DHBMA, no endogenous MHBMA (m/z 232.0649) was observed in any samples (Table S3, Figures 4B), indicating that their levels are below the method’s LOD (method’s LOD was 0.22 pmol/mg Cr and 0.58 pmol/mg Cr urine and method’s LOQ was 0.73 pmol/mg Cr and 1.66 pmol/mg Cr for MHBMA and DHBMA).
Urinary excretion of endogenous and exogenous BD-DNA adducts (EB-GII)
As described above, EB-GII lesions are hydrolytically unstable and are excreted in urine as free base adducts. We employed stable isotope labeling to quantify the relative contributions of endogenous and exogenous sources to total urinary BD-DNA adduct levels. Figure 3A shows a representative nanoLC-ESI+-HRMS/MS chromatogram for quantification of EB-GII (endogenous adducts) and EB-GII-d6 (exogenous adducts) in urine of control animals exposed to filtered air. Endogenously formed EB-GII (m/z 222.0985) were observed in animals exposed to 3 ppm BD (0.62 ± 1.28 fmol/mg Cr urine, Table S3). Animals exposed to BD-d6 excreted both endogenous and exogenous EB-GII (m/z 228.1362) with a majority of samples having endogenous EB-GII levels lower than the method’s limit of detection (0.32 fmol/mL urine, Figure 4C). There was a statistically significant association of urinary EB-GII with BD exposure levels (p=0.003, Table S5). Exogenous EB-GII-d6 increased in a dose dependent manner (98.43 ± 1.25, 124.88 ± 1.34, and 793.58 ± 1.48 fmol/mg Cr urine at 0.3, 0.5, and 3 ppm BD respectively, Table S3) and this association was significant (p<0.001, Table S4). In BD-d6 treatment groups, exogenous adducts were over 500-fold more abundant than endogenous species (Table S3). These results indicate that despite the presence of low levels of endogenous EB-GII adducts in urine, their quantities are too small to affect exposure and risk assessment based on urinary EB-GII quantification. Therefore, urinary EB-GII adducts can be considered a specific biomarker of exposure to butadiene.
Quantification of endogenous and exogenous EB-GII in genomic DNA
Genomic EB-GII and EB-GII-d6 were also quantified in DNA isolated from tissues of BD-d6 exposed animals (liver, lung, heart, and pancreas). These tissues were selected because they are the target tissues for the development of cancer in rats exposed to BD.35 The levels of endogenous EB-GII adducts in tissues were below the method’s limit of quantification (0.237 adducts/109 nucleotides, Table 1 and Table S6), indicating that these biomarkers are specific for exposures to BD and validating their future use in risk assessment.
Table 1.
Quantitative Analysis of Genomic EB-GII Adducts (Adducts/109 nucleotides) in Tissues of Rats Treated with BD-d6a,b
| Exposure Level (ppm BD-d6) | ||||||
|---|---|---|---|---|---|---|
| Tissue | Source | All | 0 | 0.3 | 0.5 | 3 |
| Liver | Exogenous | 0.21c ± 3.83 | ND | 0.19c ± 1.76 | 0.25 ± 2.23 | 0.93 ± 2.90 |
| Endogenous | ND | ND | 0.10c ± 1.64 | ND | ND | |
| Lung | Exogenous | 0.18c ± 4.20 | ND | 0.08c ± 1.02 | 0.18c ± 1.81 | 1.24 ± 1.21 |
| Endogenous | ND | ND | ND | ND | ND | |
| Heart | Exogenous | 0.22c ± 4.03 | ND | 0.14c ± 1.16 | 0.15c ± 1.10 | 1.75 ± 1.26 |
| Endogenous | 0.10c ± 1.70 | 0.16c ± 1.19 | ND | 0.10c ± 1.65 | 0.14c ± 1.09 | |
| Pancreas | Exogenous | 0.80 ± 4.69 | ND | 0.88 ± 1.20 | 1.02 ± 1.38 | 5.25 ± 1.36 |
| Endogenous | ND | 0.11c ± 1.86 | ND | ND | ND | |
Results are shown As GM ± GSD
ND indicates not detectable above detection limit of 0.078 adducts/109 nucleotides
indicates a value reported above detection limit of 0.078 adducts/109 nucleotides but less than quantitation limit of 0.237 adducts/109 nucleotides
Genomic levels of exogenous EB-GII adducts increased in a dose-dependent manner in each tissue type investigated (all p<0.001, Table 1 and S6). In the liver, adduct levels were 0.19 ± 1.76 (0.3 ppm BD-d6), 0.25 ± 2.23 (0.5 ppm BD-d6), and 0.93 ± 2.90 adducts/109 nucleotides (3 ppm BD-d6). In the lung, adduct levels were 0.08 ± 1.02 (0.3 ppm BD-d6), 0.18 ± 1.81 (0.5 ppm BD-d6), and 1.24 ± 1.21 adducts/109 nucleotides (3 ppm BD-d6). In the heart, adduct levels were 0.14 ± 1.16 (0.3 ppm BD-d6), 0.15 ± 1.10 (0.5 ppm BD-d6), and 1.75 ± 1.26 adducts/109 nucleotides (3 ppm BD-d6). In the pancreas, adduct levels were 0.88 ± 1.20 (0.3 ppm BD-d6), 1.02 ± 1.38 (0.5 ppm BD-d6), and 5.25 ± 1.36 adducts/109 nucleotides (3 ppm BD-d6). To our knowledge, this is the first report of tissue specific formation of BD adducts in genomic DNA of laboratory rats exposed to sub-ppm levels of BD.
Associations between various biomarkers of exposure to 1,3-butadiene
In order to examine the associations between various biomarkers of exposure to BD, linear regression analyses were conducted with each metabolite and urinary EB-GII-d6. Urinary MHBMA-d6 and DHBMA-d5 were significantly associated with urinary EB-GII-d6 (both p<0.001, Table S4).
EB-GII adducts initially form in genomic DNA and are excreted in urine following spontaneous hydrolysis or DNA repair. To determine whether urinary EB-GII adducts can be used as a non-invasive biomarker for genomic EB-GII, we investigated the associations between urinary EB-GII-d6 and genomic EB-GII-d6 in each animal. Urinary EB-GII-d6 was significantly associated with genomic EB-GII-d6 in the liver (p=0.030), lung (p<0.001), heart (p<0.001) and pancreas (p<0.001, Table S6). These results indicate that urinary EB-GII measurements can be used to estimate the levels of exogenous genomic EB-GII in studies where invasive tissue collections are not feasible.
Discussion
DNA adducts play a key role in mutagenesis and carcinogenesis and thus are commonly used as biomarkers of carcinogen exposure and risk.36 However, covalent DNA modifications are also found in tissues of animals and humans with no known exposure to carcinogens, with total numbers of spontaneously produced DNA lesions estimated to be greater than 40,000 per cell.37 In cases when endogenous and exogenous DNA adducts are structurally identical, it is challenging to distinguish between internal and external exposures, complicating cancer risk assessment.38,39
Stable isotope labeling in combination with mass spectrometry is a powerful tool that can be used to accurately quantify exogenous and endogenous DNA adducts.39 In this approach, cultured cells or animals are treated with a stable isotope labeled carcinogen. DNA adducts originating from this treatment will contain the isotope label, while any endogenously forming adducts will be unlabeled and can be readily distinguished by mass spectrometry. Using this approach, the Swenberg laboratory previously evaluated exogenous and endogenous sources of formaldehyde-DNA and acetaldehyde-DNA adducts in laboratory animals, revealing that following low exposures, endogenous adducts were more prevalent than those forming from the exogenous sources, while exogenous adducts predominated at higher exposure conditions.38,40–43
Smoking represents a major source of human exposure to 1,3-butadiene (BD).44 BD is known human and animal carcinogen. Non-smokers may be exposed to BD in urban environments through inhalation of automobile exhaust, urban air, and wood burning smoke, while BD monomer and polymer industry workers can come in contact with BD in occupational settings.44,45 Workers exposed to 1,3-butadiene have been reported to be at an increased risk of cancers of the stomach, blood, and lymphatic system.4
Human exposure to BD can be evaluated using its urinary metabolites (MHBMA and DHBMA) and DNA adducts such as EB-GII (Figure 1).7,10,14–16,46,47 We have previously reported ethnic differences in excretion of MHBMA and DHBMA46 and urinary EB-GII adducts in current smokers.15 Furthermore, smokers who subsequently develop lung cancer excrete higher concentrations of MHBMA, DHBMA, and EB-GII, validating their use as biomarkers of cancer risk (Jokipii Krueger et al, in revision).
While urinary MHBMA, DHBMA and EB-GII adducts are commonly attributed to external exposures to BD, there is a possibility that that the same species are also formed endogenously, complicating biomarker data interpretation. Indeed, low levels of urinary EB-GII adducts have been previously detected in unexposed laboratory animals (65.3–391 fmol/mL urine)10 and non-smokers with no known external exposures to BD (0.19 (95% CI: 0.15–0.22) fmol/mL urine).15 In smoking cessation studies, MHBMA and EB-GII concentrations decreased significantly post exposure, but did not reach zero,7,16 while DHBMA concentrations were unchanged.7 The presence of BD biomarkers originating from internal exposures in humans complicates risk assessment and raises questions about the relative contributions of environmental, dietary, and endogenous sources of DNA damage to cancer development.
The main goal of this study was to accurately quantify endogenous and exogenous metabolites and DNA adducts commonly used as biomarkers of exposure to BD using stable isotope labeling in combination with mass spectrometry. Laboratory rats were treated with isotopically labeled BD (BD-d6) by inhalation, and high resolution mass spectrometry was used to accurately quantify the contribution of endogenous and exogenous MHBMA, DHBMA, and EB-GII to the overall biomarker levels in biological samples. Our results indicate that significant amounts of DHBMA can form endogenously, while the only source of MHBMA and EB-GII is inhalation exposure to BD. This is consistent with previous data showing that urinary MHBMA and EB-GII are strongly affected by smoking status while DHBMA is unaffected by smoking cessation.7 Our results indicate that urinary MHBMA and EB-GII and genomic EB-GII can be used as accurate biomarkers of exposure to BD.
Our results reveal that DHBMA can be formed from multiple sources, with the ratio of exogenous to endogenous DHBMA between 0.21 and 2.36, depending on BD exposure concentration (Table S3). The endogenous metabolite was more prevalent at the low exposure levels (0.3 and 0.5 ppm) while the exogenous DHBMA only became more prevalent at the highest exposure level (3 ppm) (Table S3, Figure 4A). This indicates that at human exposure levels to BD (~1 ppm for occupationally exposed workers, 16–361 μg/cigarette), endogenous DHBMA contributes significantly to total measured DHBMA amounts. This helps explain previous reports that DHBMA levels in smokers were unaffected by smoking cessation.7,46,47 Overall, our results suggest that DHBMA is not an appropriate biomarker for use in assessing risk from exposure to BD.
Further studies are needed to help identify potential metabolic and dietary precursors of DHBMA in humans. Endogenous DHBMA was not associated with age, gender, or weight (Table S5). This indicates that other factors, such as dietary sources, may be more likely to influence endogenous formation of this metabolite. We have previously observed other four carbon metabolites such as trihydroxybutyl mercapturic acid (THBMA) and DNA adducts such as N7-(2,3,4-trihydroxybut-1-yl)-guanine in non-smokers with no known exposure to BD.5,48,49 The exact pathways for endogenous DHBMA formation in cells and tissues remain to be established.
Unlike DHBMA, the contributions of endogenous MHBMA and EB-GII to total urinary biomarker levels were low to negligible. No endogenous MHBMA was detected, and even in the lowest treatment group (0.3 ppm), exogenous EB-GII-d6 were over 319-fold more prevalent than the endogenous adducts (Table S3). This is in contrast to our previous results in smokers, showing 5-fold greater levels of urinary EB-GII in smokers as compared to non-smokers15 and smoking cessation studies showing only a 34% decrease in urinary EB-GII following termination of smoking.16 One possible explanation for this discrepancy is that non-smokers could be exposed to BD from other sources such as secondhand tobacco smoke, wood burning smoke, and automobile exhaust, while laboratory animals are not exposed to any of these environmental sources of BD. Overall, endogenous EB-GII represent a very small fraction of the total adduct load and are unlikely to affect risk assessment using urinary EB-GII. Therefore, urinary EB-GII can be considered an accurate biomarker of external exposure to BD.
Urinary MHBMA-d6 and DHBMA-d5 were highly associated with urinary EB-GII-d6 (Table S4). This is consistent with our previous studies in smokers, where we observed that MHBMA and DHBMA were associated with EB-GII.15 Overall, our results indicate that urinary DNA adducts and metabolites of EB-GII equally reflect BD exposures.
Another useful finding of this study is that urinary EB-GII concentrations were associated with genomic EB-GII levels in tissues of the same animals. Our laboratory has utilized urinary EB-GII as a biomarker of BD exposure in smokers and occupationally exposed workers.10,15,16 However, several literature reports50,51 and reviews52,53 have questioned the use of urinary DNA adducts in risk assessment because they can potentially originate from free nucleotides and RNA rather than from genomic DNA. However, our data shown here indicate that urinary EB-GII-d6 was strongly associated with genomic EB-GII-d6 in the liver, lung, heart and pancreas (Table S6), validating urinary EB-GII adducts as a surrogate for genomic adduct levels. This information is useful since in many large-scale epidemiological studies, urine samples are more readily available than genomic DNA.
In summary, this study for the first time separately quantified endogenous and exogenous BD-DNA adducts and metabolites in laboratory rats exposed to isotopically labeled BD. We quantified the contribution of endogenous adducts and metabolites to the overall load, showing that MHBMA and EB-GII (both urinary and genomic) are sensitive and specific biomarkers of BD exposure, while DHBMA cannot be used as a biomarker of exogenous BD exposure under low exposure conditions due to the high endogenous levels of the metabolite. Our results reveal a strong association between urinary and genomic DNA adducts, validating urinary EB-GII as a non-invasive surrogate biomarker for genomic BD DNA damage. These findings support future use of urinary EB-GII and MHBMA as biomarkers of BD exposure and warrant further investigation to identify the sources of endogenous formation of DHBMA.
Supplementary Material
Funding Information.
Research reported in this publication was supported by NCI grant R01 CA100670 to NT, grant P30 CA77598 utilizing the Biostatistics Core shared resource of the Masonic Cancer Center, University of Minnesota, and by the National Center for Advancing Translational Sciences of the National Institutes of Health award number UL1 TR002494. The content is solely the responsibility of the authors and does not necessarily represent the official views of the National Institutes of Health.
Footnotes
Supplementary Information. Design of the animal study and characteristics of the animals; PRM transitions; results for nanoLC-ESI+-HRMS/MS; associations of exogenous urinary butadiene biomarkers with exposure concentration and animal age, gender, and weight; asssociations of endogenous urinary DHBMA and EB-GII with exposure concentration and animal age, gender, and weight; associations of exogenous genomic EB-GII adducts with exposure concentration and animal age, gender and weight.
Conflict of Interest Disclosure. The authors declare no competing financial interest.
References
- 1.Valdez-Flores C, Erraguntla N, Budinsky R, Cagen S, and Kirman CR (2022) An updated lymphohematopoietic and bladder cancers risk evaluation for occupational and environmental exposures to 1,3-butadiene. Chem. Biol. Interact 366, 110077. doi: 10.1016/j.cbi.2022.110077. [DOI] [PubMed] [Google Scholar]
- 2.National Toxicology Program. (2021) 1,3-butadiene, In Report on Carcinogens, Fifteenth Edition, U.S. Department of Health and Human Services, Public Health Service, Research Triangle Park, NC. doi: 10.22427/NTP-OTHER-1003 [DOI] [Google Scholar]
- 3.Boogaard PJ, van Sittert NJ, and Megens HJ (2001) Urinary metabolites and haemoglobin adducts as biomarkers of exposure to 1,3-butadiene: A basis for 1,3-butadiene cancer risk assessment. Chem. Biol. Interact 135–136, 695–701. [DOI] [PubMed] [Google Scholar]
- 4.van Sittert NJ, Megens HJ, Watson WP, and Boogaard PJ (2000) Biomarkers of exposure to 1,3-butadiene as a basis for cancer risk assessment. Toxicol. Sci 56, 189–202. doi: 10.1093/toxsci/56.1.189. [DOI] [PubMed] [Google Scholar]
- 5.Kotapati S, Matter BA, Grant AL, and Tretyakova NY (2011) Quantitative analysis of trihydroxybutyl mercapturic acid, a urinary metabolite of 1,3-butadiene, in humans. Chem. Res. Toxicol 24, 1516–1526. doi: 10.1021/tx2001306. [DOI] [PMC free article] [PubMed] [Google Scholar]
- 6.Kotapati S, Sangaraju D, Esades A, Hallberg L, et al. (2014) Bis-butanediol-mercapturic acid (bis-BDMA) as a urinary biomarker of metabolic activation of butadiene to its ultimate carcinogenic species. Carcinogenesis 35, 1371–1378. doi: 10.1093/carcin/bgu047. [DOI] [PMC free article] [PubMed] [Google Scholar]
- 7.Carmella SG, Chen M, Han S, Briggs A, et al. (2009) Effects of smoking cessation on eight urinary tobacco carcinogen and toxicant biomarkers. Chem. Res. Toxicol 22, 734–741. doi: 10.1021/tx800479s. [DOI] [PMC free article] [PubMed] [Google Scholar]
- 8.Goggin M, Swenberg JA, Walker VE, and Tretyakova N (2009) Molecular dosimetry of 1,2,3,4-diepoxybutane-induced DNA-DNA cross-links in B6C3F1 mice and F344 rats exposed to 1,3-butadiene by inhalation. Cancer Res. 69, 2479–2486. doi: 10.1158/0008-5472.Can-08-4152. [DOI] [PMC free article] [PubMed] [Google Scholar]
- 9.Koc H, Tretyakova NY, Walker VE, Henderson RF, and Swenberg JA (1999) Molecular dosimetry of N-7 guanine adduct formation in mice and rats exposed to 1,3-butadiene. Chem. Res. Toxicol 12, 566–574. doi: 10.1021/tx980265f. [DOI] [PubMed] [Google Scholar]
- 10.Sangaraju D, Boldry EJ, Patel YM, Walker V, et al. (2017) Isotope Dilution nanoLC/ESI+-HRMS3 quantitation of urinary N7-(1-hydroxy-3-buten-2-yl) guanine adducts in humans and their use as biomarkers of exposure to 1,3-butadiene. Chem. Res. Toxicol 30, 678–688. doi: 10.1021/acs.chemrestox.6b00407. [DOI] [PMC free article] [PubMed] [Google Scholar]
- 11.Groehler AS 4th, Najjar D, Pujari SS, Sangaraju D, and Tretyakova NY (2018) N6-(2-deoxy-d- erythro-pentofuranosyl)-2,6-diamino-3,4-dihydro-4-oxo-5- N-(2-hydroxy-3-buten-1-yl)-formamidopyrimidine adducts of 1,3-butadiene: Synthesis, structural identification, and detection in human cells. Chem. Res. Toxicol 31, 885–897. doi: 10.1021/acs.chemrestox.8b00123. [DOI] [PMC free article] [PubMed] [Google Scholar]
- 12.Pujari SS, Jokipii Krueger CC, Chao C, Hutchins S, et al. (2021) DEB-FAPy-dG adducts of 1,3-butadiene: Synthesis, structural characterization, and formation in 1,2,3,4-diepoxybutane treated DNA*. Chemistry 28, e202103245. doi: 10.1002/chem.202103245. [DOI] [PMC free article] [PubMed] [Google Scholar]
- 13.Pujari SS, and Tretyakova N (2017) Chemical biology of N5-substituted formamidopyrimidine DNA adducts. Chem. Res. Toxicol 30, 434–452. doi: 10.1021/acs.chemrestox.6b00392. [DOI] [PMC free article] [PubMed] [Google Scholar]
- 14.Roethig HJ, Munjal S, Feng S, Liang Q, et al. (2009) Population estimates for biomarkers of exposure to cigarette smoke in adult U.S. cigarette smokers. Nicotine Tob. Res 11, 1216–1225. doi: 10.1093/ntr/ntp126. [DOI] [PubMed] [Google Scholar]
- 15.Jokipii Krueger CC, Park SL, Madugundu G, Patel Y, et al. (2021) Ethnic differences in excretion of butadiene-DNA adducts by current smokers. Carcinogenesis 42, 694–704. doi: 10.1093/carcin/bgab020. [DOI] [PMC free article] [PubMed] [Google Scholar]
- 16.Jokipii Krueger CC, Madugundu G, Degner A, Patel Y, et al. (2020) Urinary N7-(1-hydroxy-3-buten-2-yl) guanine adducts in humans: Temporal stability and association with smoking. Mutagenesis 35, 19–26. [DOI] [PMC free article] [PubMed] [Google Scholar]
- 17.Tretyakova N, Chaing S-Y, Walker V, and Swenberg J (1998) Quantitative analysis of 1,3-butadiene-induced DNA adducts in vivo and in vitro using liquid chromatography electrospray ionization tandem mass spectrometry. J. Mass Spectrom 33, 363–376. [DOI] [PubMed] [Google Scholar]
- 18.Swenberg JA, Bordeerat NK, Boysen G, Carro S, et al. (2011) 1,3-Butadiene: Biomarkers and application to risk assessment. Chem. Biol. Interact 192, 150–154. doi: 10.1016/j.cbi.2010.10.010. [DOI] [PMC free article] [PubMed] [Google Scholar]
- 19.Schettgen T, Musiol A, Alt A, Ochsmann E, and Kraus T (2009) A method for the quantification of biomarkers of exposure to acrylonitrile and 1,3-butadiene in human urine by column-switching liquid chromatography-tandem mass spectrometry. Anal. Bioanal. Chem 393, 969–981. doi: 10.1007/s00216-008-2510-1. [DOI] [PubMed] [Google Scholar]
- 20.Lu K, Craft S, Nakamura J, Moeller BC, and Swenberg JA (2012) Use of LC-MS/MS and stable isotopes to differentiate hydroxymethyl and methyl DNA adducts from formaldehyde and nitrosodimethylamine. Chem. Res. Toxicol 25, 664–675. doi: 10.1021/tx200426b. [DOI] [PMC free article] [PubMed] [Google Scholar]
- 21.Leng J, Liu CW, Hartwell HJ, Yu R, et al. (2019) Evaluation of inhaled low-dose formaldehyde-induced DNA adducts and DNA-protein cross-links by liquid chromatography-tandem mass spectrometry. Arch. Toxicol 93, 763–773. doi: 10.1007/s00204-019-02393-x. [DOI] [PMC free article] [PubMed] [Google Scholar]
- 22.Lu K, Gul H, Upton PB, Moeller BC, and Swenberg JA (2012) Formation of hydroxymethyl DNA adducts in rats orally exposed to stable isotope labeled methanol. Toxicol. Sci 126, 28–38. doi: 10.1093/toxsci/kfr328. [DOI] [PMC free article] [PubMed] [Google Scholar]
- 23.Lu K, Hsiao YC, Liu CW, Schoeny R, et al. (2022) A review of stable isotope labeling and mass spectrometry methods to distinguish exogenous from endogenous DNA adducts and improve dose-response assessments. Chem. Res. Toxicol 35, 7–29. doi: 10.1021/acs.chemrestox.1c00212. [DOI] [PubMed] [Google Scholar]
- 24.Citti L, Gervasi PG, Turchi G, Bellucci G, and Bianchini R (1984) The reaction of 3,4-epoxy-1-butene with deoxyguanosine and DNA in vitro: Synthesis and characterization of the main adducts. Carcinogenesis 5, 47–52. doi: 10.1093/carcin/5.1.47. [DOI] [PubMed] [Google Scholar]
- 25.Tretyakova N, Lin Y, Sangaiah R, Upton PB, and Swenberg JA (1997) Identification and quantitation of DNA adducts from calf thymus DNA exposed to 3,4-epoxy-1-butene. Carcinogenesis 18, 137–147. doi: 10.1093/carcin/18.1.137. [DOI] [PubMed] [Google Scholar]
- 26.Maynard S, Fang EF, Scheibye-Knudsen M, Croteau DL, and Bohr VA (2015) DNA damage, DNA repair, aging, and neurodegeneration. Cold Spring Harb. Perspect. Med 5. doi: 10.1101/cshperspect.a025130. [DOI] [PMC free article] [PubMed] [Google Scholar]
- 27.Catic A (2018) Cellular metabolism and aging. Prog. Mol. Biol. Transl. Sci 155, 85–107. doi: 10.1016/bs.pmbts.2017.12.003. [DOI] [PMC free article] [PubMed] [Google Scholar]
- 28.Owen PE, Glaister JR, Gaunt IF, and Pullinger DH (1987) Inhalation toxicity studies with 1,3-butadiene. 3. Two year toxicity/carcinogenicity study in rats. Am. Ind. Hyg. Assoc. J 48, 407–413. doi: 10.1080/15298668791384959. [DOI] [PubMed] [Google Scholar]
- 29.International Conference on Harmonization. (2005) Q2(R1) Validation of Analytical Procedure: Text and Methodology, https://www.fda.gov/regulatory-information/search-fda-guidance-documents/q2r1-validation-analytical-procedures-text-and-methodology-guidance-industry (accessed 4/13/2023).
- 30.Sangaraju D, Villalta PW, Wickramaratne S, Swenberg J, and Tretyakova N (2014) NanoLC/ESI+ HRMS3 quantitation of DNA adducts induced by 1,3-butadiene. J. Am. Soc. Mass. Spectrom 25, 1124–1135. doi: 10.1007/s13361-014-0916-x. [DOI] [PMC free article] [PubMed] [Google Scholar]
- 31.Delzell E, Sathiakumar N, Hovinga M, Macaluso M, et al. (1996) A follow-up study of synthetic rubber workers. Toxicology 113, 182–189. [DOI] [PubMed] [Google Scholar]
- 32.Fajen JM, Roberts DR, Ungers LJ, and Krishnan ER (1990) Occupational exposure of workers to 1,3-butadiene. Environ. Health Perspect 86, 11–18. doi: 10.1289/ehp.908611. [DOI] [PMC free article] [PubMed] [Google Scholar]
- 33.Borgie M, Garat A, Cazier F, Delbende A, et al. (2014) Traffic-related air pollution. A pilot exposure assessment in Beirut, Lebanon. Chemosphere 96, 122–128. doi: 10.1016/j.chemosphere.2013.09.034. [DOI] [PubMed] [Google Scholar]
- 34.Boyle EB, Viet SM, Wright DJ, Merrill LS, et al. (2016) Assessment of exposure to VOCs among pregnant women in the National Children’s Study. Int. J. Environ. Res. Public Health 13, 376. doi: 10.3390/ijerph13040376. [DOI] [PMC free article] [PubMed] [Google Scholar]
- 35.Melnick RL, Shackelford CC, and Huff J (1993) Carcinogenicity of 1,3-butadiene. Environ. Health Perspect 100, 227–236. [DOI] [PMC free article] [PubMed] [Google Scholar]
- 36.Tretyakova N, Goggin M, Sangaraju D, and Janis G (2012) Quantitation of DNA adducts by stable isotope dilution mass spectrometry. Chem. Res. Toxicol 25, 2007–2035. doi: 10.1021/tx3002548. [DOI] [PMC free article] [PubMed] [Google Scholar]
- 37.Nakamura J, Mutlu E, Sharma V, Collins L, et al. (2014) The endogenous exposome. DNA Repair 19, 3–13. doi: 10.1016/j.dnarep.2014.03.031. [DOI] [PMC free article] [PubMed] [Google Scholar]
- 38.Mutlu E, Jeong YC, Collins LB, Ham AJ, et al. (2012) A new LC-MS/MS method for the quantification of endogenous and vinyl chloride-induced 7-(2-oxoethyl)guanine in Sprague-Dawley rats. Chem. Res. Toxicol 25, 391–399. doi: 10.1021/tx200447w. [DOI] [PMC free article] [PubMed] [Google Scholar]
- 39.Lai Y, Yu R, Hartwell HJ, Moeller BC, et al. (2016) Measurement of endogenous versus exogenous formaldehyde-induced DNA-protein crosslinks in animal tissues by stable isotope labeling and ultrasensitive mass spectrometry. Cancer Res. 76, 2652–2661. doi: 10.1158/0008-5472.CAN-15-2527. [DOI] [PMC free article] [PubMed] [Google Scholar]
- 40.Marsden DA, Jones DJ, Britton RG, Ognibene T, et al. (2009) Dose-response relationships for N7-(2-hydroxyethyl)guanine induced by low-dose [14C]ethylene oxide: evidence for a novel mechanism of endogenous adduct formation. Cancer Res. 69, 3052–3059. doi: 10.1158/0008-5472.CAN-08-4233. [DOI] [PubMed] [Google Scholar]
- 41.Lu K, Moeller B, Doyle-Eisele M, McDonald J, and Swenberg JA (2011) Molecular dosimetry of N2-hydroxymethyl-dG DNA adducts in rats exposed to formaldehyde. Chem. Res. Toxicol 24, 159–161. doi: 10.1021/tx1003886. [DOI] [PMC free article] [PubMed] [Google Scholar]
- 42.Mutlu E, Collins L, Stout M, Upton P, et al. (2010) Development and application of an LC-MS/MS method for the detection of the vinyl chloride-induced DNA adduct N2,3-ethenoguanine in tissues of adult and weanling rats following exposure to [13C2]-VC. Chem. Res. Toxicol 23, 1485–1491. [DOI] [PMC free article] [PubMed] [Google Scholar]
- 43.Moeller BC, Recio L, Green A, Sun W, et al. (2013) Biomarkers of exposure and effect in human lymphoblastoid TK6 cells following [13C2]-acetaldehyde exposure. Toxicol. Sci 133, 1–12. doi: 10.1093/toxsci/kft029. [DOI] [PMC free article] [PubMed] [Google Scholar]
- 44.Brunnemann KD, Kagan MR, Cox JE, and Hoffmann D (1990) Analysis of 1,3-butadiene and other selected gas-phase components in cigarette mainstream and sidestream smoke by gas chromatography-mass selective detection. Carcinogenesis 11, 1863–1868. doi: 10.1093/carcin/11.10.1863. [DOI] [PubMed] [Google Scholar]
- 45.Occupational Safety and Health Administration. (1910) Toxic and Hazardous Substances. 1,3-Butadiene, https://www.osha.gov/laws-regs/regulations/standardnumber/1910/1910.1051 (accessed 4/13/2023).
- 46.Boldry EJ, Patel YM, Kotapati S, Esades A, et al. (2017) Genetic determinants of 1,3-butadiene metabolism and detoxification in three populations of smokers with different risks of lung cancer. Cancer Epidemiol. Biomarkers Prev 26, 1034–1042. doi: 10.1158/1055-9965.EPI-16-0838. [DOI] [PMC free article] [PubMed] [Google Scholar]
- 47.Park SL, Kotapati S, Wilkens LR, Tiirikainen M, et al. (2014) 1,3-Butadiene exposure and metabolism among Japanese American, Native Hawaiian, and White smokers. Cancer Epidemiol. Biomarkers Prev 23, 2240–2249. doi: 10.1158/1055-9965.EPI-14-0492. [DOI] [PMC free article] [PubMed] [Google Scholar]
- 48.Sangaraju D, Villalta P, Goggin M, Agunsoye MO, et al. (2013) Capillary HPLC-accurate mass MS/MS quantitation of N7-(2,3,4-trihydroxybut-1-yl)-guanine adducts of 1,3-butadiene in human leukocyte DNA. Chem. Res. Toxicol 26, 1486–1497. doi: 10.1021/tx400213m. [DOI] [PMC free article] [PubMed] [Google Scholar]
- 49.Fustinoni S, Soleo L, Warholm M, Begemann P, et al. (2002) Influence of metabolic genotypes on biomarkers of exposure to 1,3-butadiene in humans. Cancer Epidemiol. Biomarkers Prev 11, 1082–1090. [PubMed] [Google Scholar]
- 50.Topal MD, and Baker MS (1982) DNA precursor pool: A significant target for N-methyl-N-nitrosourea in C3H/10T1/2 clone 8 cells. Proc. Natl. Acad. Sci. USA 79, 2211–2215. [DOI] [PMC free article] [PubMed] [Google Scholar]
- 51.Evans MD, Mistry V, Singh R, Gackowski D, et al. (2016) Nucleotide excision repair of oxidised genomic DNA is not a source of urinary 8-oxo-7,8-dihydro-2’-deoxyguanosine. Free Radic. Biol. Med 99, 385–391. doi: 10.1016/j.freeradbiomed.2016.08.018. [DOI] [PubMed] [Google Scholar]
- 52.Cooke MS, Evans MD, Herbert KE, and Lunec J (2000) Urinary 8-oxo-2’-deoxyguanosine – source, significance and supplements. Free Radic. Res 32, 381–397. doi: 10.1080/10715760000300391. [DOI] [PubMed] [Google Scholar]
- 53.Evans MD, Saparbaev M, and Cooke MS (2010) DNA repair and the origins of urinary oxidized 2’-deoxyribonucleosides. Mutagenesis 25, 433–442. doi: 10.1093/mutage/geq031. [DOI] [PubMed] [Google Scholar]
Associated Data
This section collects any data citations, data availability statements, or supplementary materials included in this article.