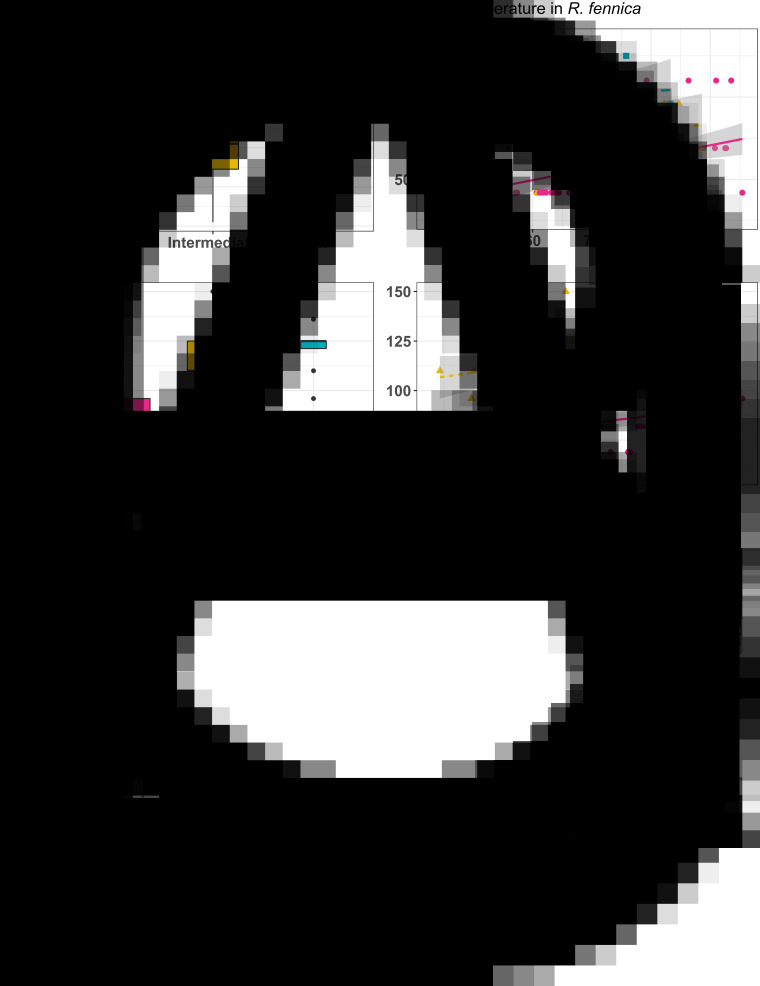
Fig. 3.
(A, C) Boxplots for number of days needed to start (A) and stop (C) cercariae release in Rhipidocotyle fennica under different temperature treatments (2 study populations combined). Width of box reflects the sample size, height of box denotes limits of upper and lower quartiles, horizontal line is the median of vales, whiskers mark the highest and lowest values within the 1.5 × interquartile range and dots indicate values outside that range. (B, D) Respective plots accounting for size of the mussel host, Anodonta anatina, where high temperature marked with dots and continuous line, intermediate temperature with triangles and dotted line, and low temperature with squares and broken line.

