

Key words: Fleas, host spectrum, ordination, phylogeny, similarity, traits
Abstract
We investigated the patterns of phylogenetic and functional (dis)similarity in the species composition of host spectra between co-habitating generalist flea species in regional assemblages from four continents (Europe, Asia, North America and Africa) using a recently developed ordination approach (Double Similarity Principal Component Analysis). From the functional perspective, we considered physiological [body mass and basal metabolic rate (BMR)] and ecological (shelter depth and complexity) host traits. We asked (a) whether host phylogeny, physiology or ecology is the main driver of (dis)similarities between flea host spectra and (b) whether the patterns of phylogenetic and functional (dis)similarity in host spectra vary between flea assemblages from different continents. Phylogenetic similarity between the host spectra was highest in Africa, lowest in North America and moderate in Europe and Asia. In each assemblage, phylogenetic clusters of hosts dominating in the host spectra could be distinguished. The functional similarity between the host spectra of co-occurring fleas was low for shelter structure in all assemblages and much higher for body mass and BMR in three of the four assemblages (except North America). We conclude that host phylogeny and shelter structure are the main drivers of (dis)similarity between the host spectra of co-habitating fleas. However, the effects of these factors on the patterns of (dis)similarity varied across continents.
Introduction
A host–parasite association can be established if two conditions are met: encounter (a parasite and a host co-occur) and compatibility (a parasite is able to extract resources from a host and overcome its defences) (Combes, 2001; Araujo et al., 2015). Obviously, the prerequisite of encounter is easily met because every locality is usually inhabited by multiple host species, so a parasite can theoretically exploit any host species in a locality. However, in the majority of parasite taxa, co-habitating species exploit different sets of co-habitating hosts and often differ, both intra- and interspecifically, in the abundance that they attain on these hosts. A parasite's selection of its hosts in a locality is thus determined by this parasite's compatibility with some hosts and incompatibility with other hosts. Ultimately, a parasite selects those hosts from the available pool of host species that the parasite can successfully exploit. This selection may be determined by the interplay between a certain set of host traits and a certain set of parasite traits (Krasnov et al., 2016). Given that many host traits (e.g., Roll et al., 2006) and many parasite traits (e.g., Poulin et al., 2011) are phylogenetically conserved, host selection by a parasite may have a substantial phylogenetic component (Krasnov et al., 2016; Gupta et al., 2020).
Many comparative studies that have aimed to elucidate the factors determining the compositional and phylogenetic structure of host spectra were carried out using fleas (Siphonaptera) parasitic on small mammals as a model taxon (Krasnov et al., 2005a, 2014, 2019). These studies repeatedly demonstrated that the species and phylogenetic compositions of host spectra in these parasites were strongly affected by the species composition and/or phylogenetic structure of the available host pool. The analyses in these studies were carried out at the continental scale and focused on comparisons of host spectra between or within flea species across different regions. It is thus not surprising that the effect of local environmental conditions constraining the composition of a host spectrum of a given flea species was also found (e.g. Krasnov et al., 2019). This environmental effect could mask the ‘pure’ effect of host phylogeny and traits on the composition of flea host spectra.
Krasnov et al. (2016) demonstrated that flea species exploiting the same host species across regions were more phylogenetically related and more similar in their traits than expected by chance (see also Hadfield et al., 2014). However, it remained unclear (a) whether the reciprocal pattern (i.e. host species exploited by a flea species are phylogenetically or functionally similar) is also true and (b) whether this pattern holds within rather than across regional flea assemblages. Here, we investigated patterns of phylogenetic and functional (=trait-based) (dis)similarity in the species composition of the host spectra among co-habitating flea species in regional assemblages. We focused on host generalist fleas and compared similarities in their host spectra in terms of host phylogeny, as well as their physiological [body mass and basal metabolic rate (BMR)] and ecological (shelter depth and complexity) traits. We asked whether host phylogeny, physiology or ecology is the main driver of dissimilarities between fleas in their host species composition (occurrence in different hosts and abundance achieved in these hosts).
We also asked whether the patterns of phylogenetic and functional similarity in host spectra vary between flea assemblages in different continents because these assemblages have profoundly different evolutionary histories. To understand this, we analysed the phylogenetic and functional similarity of host spectra in regional flea assemblages from four continents (Europe, Asia, North America and Africa). Fleas are thought to have originated in Gondwana (Zhu et al., 2015); their diversification likely peaked in the mountain Palearctic (mostly in Asia) (Medvedev, 2014), while they migrated to the Nearctic from the Palearctic (Medvedev, 2005). As a result, African flea fauna is represented by many species of the basal families Pulicidae and Chimaeropsyllidae, whereas the youngest families Leptopsyllidae and Ceratopsyllidae are the most species-rich in North America. We expected that the longer history of flea-mammal relationships would result in higher phylogenetic and functional similarity of host spectra, between co-habitating fleas, in Africa than in North America.
Recently, Pavoine (2019) developed a new ordination approach [Double Similarity Principal Component Analysis (DSPCA)] for the analyses of phylogenetic or functional (=trait-based) similarities between species communities. DSPCA allows placing species and communities in the same ordination space and identifying species that drive phylogenetic or functional similarity patterns in accordance with their traits or phylogenetic positions. We adapted DSPCA to elucidate the patterns of similarity among co-habitating flea species in the phylogenetic and functional composition of their host spectra. We considered a flea species' host spectrum as a community, with the host species as the species composing this community, and applied DSPCA to the host spectra of fleas in regional assemblages.
Materials and methods
Data on fleas and hosts
Data on fleas and hosts were taken from four regional surveys that reported the number of fleas of a particular species collected from the given number of hosts of a particular species. These surveys were done in Europe (Moscow region of Russia, 1948–1949; Darskaya et al., 1970), Asia (northern Khangai Mountains of Mongolia, 1957–1958; Labunets, 1967), North America (central California, 1937–1954; Linsdale and Davis, 1956) and Africa (Western Cape, Eastern Cape, Northern Cape, North-West, Gauteng and KwaZulu Natal provinces of South Africa, 2009–2013; van der Mescht and Matthee, 2017). Further, we refer to these regional assemblages as European, Asian, North American and African assemblages, respectively. Details of the sampling design and methods, as well as other sampling-related information, can be found in the source publications. For the analyses, we selected flea species that exploited at least five host species in a region. This resulted in the selection of 12, 11, nine and six flea species in Europe, Asia, North America and Africa, respectively, exploited by 16, 16, 13 and 22 host species, respectively (see Supplementary Material, Appendix 1 for the list of flea and host species used in the analyses). Selection of flea species exploiting less than five host species would result in unreliable measurements of phylogenetic similarity, whereas selection of flea species exploiting more than five host species would result in too few species remained for the analyses.
Host phylogeny
Host phylogenies (topologies and branch lengths) for each region were taken as phylogenetic subsets from species-level trees of Upham et al. (2019). We took these subsets from 10 000 set of mammals birth-death tip-dated completed trees for 5911 species (DNA-only trees did not include many species from our dataset). As recommended by Upham et al. (2019), we took 100 random trees for each region and then constructed a consensus region-specific tree using function ‘consensus.edge’ of the R package ‘phytools’ (Revell, 2012). Then, the resulted tree was ultrametrized using function ‘force.ultrametric’ of ‘phytools’. The trees of Upham et al. (2019) did not include three Rhabdomys species from South Africa (R. dilectus, R. interedius and R. bechuanae). We added these species to the African tree manually with their topology based on Ganem et al. (2020) and assigned branch lengths for them to an equal length of 1 using the program Mesquite 3.51 (Maddison and Maddison, 2018).
Host traits
We selected host traits that are considered important for flea parasitism. These traits were (a) body mass expresses in grams (g), (b) BMR and (c) shelter structure (combined variable describing shelter depth and complexity). Body mass is the fundamental characteristic of a species, correlating with various behavioural and physiological traits (Peters, 1983). From the flea perspective, host body mass may influence flea abundance (for obvious reasons) and host specificity. The latter is because a larger host species lives longer and, thus, represents a more predictable resource, so that larger hosts are often exploited by flea species with higher host specificity (Krasnov et al., 2006). Data on the mean body mass of a host species were obtained from Silva and Downing (1995), the PanTHERIA database (Jones et al., 2009), and Genoud et al. (2018). BMR in mammals has been shown to correlate with parasite species richness (Morand and Harvey, 2000), thus suggesting that an investment in a high BMR could compensate for a costly immune response as a defence against multiple parasite challenges. Data on BMR were obtained from Kalabukhov (1969), the PanTHERIA database (Jones et al., 2009) and Genoud et al. (2018). In these sources, BMR was expressed either as O2 consumption per unit time or in energetic units. We recalculated all data in energetic units, assuming 20.08 J mL−2 O2. Then, we calculated mass-specific BMR dividing raw BMR value by body mass2/3 (White and Seymour, 2005). In the case of sexual size dimorphism in body mass, the median between male and female body mass was used. If several values of body mass or BMR were available for the same species, we averaged these values. If a BMR value for a species was unavailable, we took the BMR value of the phylogenetically closest species and recalculated it for the species of interest using its body mass. The rationale behind this is that BMR has been shown to demonstrate a strong phylogenetic signal (Capellini et al., 2010).
The importance of host shelter structure for fleas is associated with the pattern of flea parasitism (alternating periods on a host's body and in its burrow/nest) and the fact that the development of pre-imaginal fleas, in the species considered in this study, takes place solely in the host's burrows/nests. Different flea species (both adults and pre-imago) demonstrate different preferences for the microclimate and substrate texture of a host's burrow, which in turn are determined by burrow structure (Shenbrot et al., 2002; Krasnov, 2008). Therefore, shelter complexity and depth influence host selection by a flea species (Krasnov et al., 2016). We described shelter depth and complexity as four binary variables, namely (a) a nest aboveground or in a rock crevice; (b) a simple burrow with a depth of up to 50 cm and 1–2 exits; (c) a burrow of moderate complexity with a depth more than 50 cm, a single horizon and up to 10 exits; and (d) a complex burrow with multiple horizons and more than 10 exits. Data on shelter depth and complexity were taken from Wilson et al. (2016, 2017), Mittermeier and Wilson (2018) and references therein. Information on other host traits that could affect the pattern of flea parasitism and, thus, the suitability of a given host for a given flea, such as blood biochemistry, hair density and skin thickness, is unavailable for the majority of the host species considered in this study. Traits such as the level of sociality (Bordes et al., 2007) or hibernation pattern (Krasnov, 2008) do not substantially vary among these host species and thus cannot be used for (dis)similarity analyses.
Data analyses
DSPCA (Pavoine, 2019) is a novel ordination method that summarizes multidimensional phylogenetic or functional (=trait-based) similarities among communities into orthogonal axes. In brief, DSPCA (a) considers a matrix of either phylogenetic or functional similarities between species, (b) produces a series of independent axes from eigen-decomposition of this matrix, and (c) positions species into the resultant space according to their similarities. The matrix of species × communities, with entries being the species proportions, is subsequently used to position communities in the centres of the species that they contain (and the abundances of these species) and to distribute them in the above-mentioned space. This means that the positions of the communities in the ordination space are based on the coordinates of the species in this space. Then, DSPCA produces new axes that best describe the similarities between communities based on their species composition. Finally, the coordinates of species and communities are projected on these new axes (principal components). These principal components are orthogonal and reflect (from the first to the last) the ever-decreasing portion of similarities between communities, with the first principal component containing the largest part of the similarities and the last principal component containing the smallest part of similarity (i.e., dissimilarity). Details of the method and the mathematics behind it can be found in Pavoine (2019).
In the final ordination space of DSPCA, species and communities are displayed by arrows, starting from the origin. A point of a community is directed to the centre of its species (weighted by their abundances), which is defined by a weighted mean of species' arrows, with weights being the relative species abundances in this community. The coordinates of communities and species are bounded between −1 and 1, so the points (and, obviously, the arrows) of the communities and species are restricted to a sphere with a radius equal to 1. The more acute the angle between the arrows of any two communities, the more similar they are. The coordinate of a species on an axis (principal component) reflects the level of this species' representativeness in the similarity pattern (higher coordinates indicate higher representativeness). This allows to identify species that drive each pattern of similarity based on species' phylogenetic positions or traits. An arrow of a species is directed towards the communities in which it occurs, and the length of the arrow depends on how well this species represents the composition of each community.
As mentioned above, in our application of DSPCA, each flea species is considered as a community (i.e. a set of host species exploited by a given flea), whereas host species composing a host spectrum of each flea are seen as species in this community. Consequently, fleas with the highest coordinates on the first principal component would be those that exploit hosts with the most common values of a trait or the most common phylogenetic position (considered across all host species used by all fleas in a region), whereas fleas with the lowest coordinates on the first principal component would be those that mainly exploit hosts with the most ‘original’ trait values (i.e. differing in this trait from the majority of other host species) or isolated positions on a phylogenetic tree.
Prior to the construction of data matrices (see below), we tested whether differential sampling efforts (i.e. variation between host species within a region in the number of examined individuals) could introduce bias in the abundance estimates. To do this, we regressed the mean flea abundance against the number of examined host individuals for each flea species in each region after log + 1-transformation. Raw estimates of mean abundance appeared to be independent of the number of host individuals examined (r2 = 0.0007–0.18, P > 0.10 for all).
For each regional flea assemblage, we constructed (a) a community matrix, namely, a matrix with flea species in rows and host species in columns, with entries being the mean abundance of a given flea species on a given host species (the mean number of flea individuals per examined host individual); (b) a phylogenetic tree of host species exploited by fleas; and (c) host trait matrices with host species as rows and traits as columns, separately for body mass (continuous variable), BMR (continuous variable) and shelter structure (four binary variables). Then, we calculated the phylogenetic and functional (for each trait separately) similarities between host species of each region using the SOchiai indices of similarity developed by Pavoine and Ricotta (2014). This was done using the functions ‘dsimTree’ and ‘dsimFun’, respectively, of the package ‘adiv’ (Pavoine, 2020), implemented in the R statistical environment (R Core Team, 2020). Finally, we ran the DCPCA for each region, using the function ‘dspca’ of the package ‘adiv’. We focused on principal components with eigenvalues ≥1, except in cases when this was true for the first eigenvalue only. In these cases, we focused on the first and second principal components.
Results
Phylogenetic similarity of host spectra
The mean abundance of a flea species differed substantially between hosts with different phylogenetic affinities (Fig. 1). The DSPCA for phylogenetic similarities of host spectra produced from six (for the African assemblage) to 12 (for the European assemblage) principal components, with one to three of them, per regional assemblage, being >1 (Table 1). The average pairwise phylogenetic similarity among the host spectra of co-habitating fleas was 0.55 in the European assemblage, 0.53 in the Asian assemblage, 0.39 in the North American assemblage and 0.91 in the African assemblage.
Fig. 1.

Mean abundance of fleas on host species mapped against host phylogeny in four regional assemblages. (A) Europe (Moscow region of Russia), (B) Asia (Western Khangai Mountains of Mongolia), (C) North America (central California), (D) Africa (South Africa). Size of the circle corresponds to the mean abundance value. See Supplementary Material, Appendix 1 for flea and host species names.
Table 1.
Eigenvalues produced by Double Similarity Principal Component Analysis (DSPCA) for phylogenetic similarity in the host spectra of fleas in four regional assemblages
| Assemblage | Nt | N1 | 1st eigenvalue | Last eigenvalue |
|---|---|---|---|---|
| Europe | 12 | 2 | 7.84 | 0.00007 |
| Asia | 11 | 2 | 7.15 | 0.003 |
| North America | 9 | 2 | 4.58 | 0.000001 |
| Africa | 6 | 1 | 5.58 | 0.005 |
Nt, total number of eigenvalues; N1, number of eigenvalues >1.
Host species distribution along the first principal component allowed distinguishing the hosts that were the most and the least representative in the flea host spectra. The most representative species were those exploited by the majority of fleas in a region and, concomitantly, represented the most common lineages on a phylogenetic tree, whereas the least representative (=the most original) species were those exploited by a few fleas only and, concomitantly, represented the most isolated lineages on a phylogenetic tree. In the European assemblage, the most representative hosts were voles of the genera Microtus, Arvicola and Myodes, whereas the most original hosts were shrews of the genera Neomys, Sorex and Crocidura, and a birch mouse (Sicista betulina) (Fig. 2A). In the Asian assemblage, the most representative species in the flea host spectra were hamsters and voles (Phodopus, Allocricetulus, Cricetulus, Alticola and Eolagurus), and the least representative species were pikas (Ochotona) (Fig. 2B). Neotomine rodents (Peromyscus and Neotoma) represented by multiple phylogenetic lineages were parasitized by the majority of fleas in North America, whereas a single flea-harbouring soricid (Sorex ornatus) was used by a single flea species (Hystrichopsylla dippei; Fig. 3A). The most representative species in the host spectra of the African fleas were the deomyine Rhabdomys and some murines (Micaelamys, Aethomys and Lemniscomys), whereas the least representatives were shrews (Myosorex and Crocidura) and an elephant shrew (Elephantulus) (Fig. 3B).
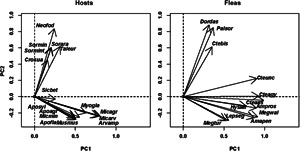
Fig. 2.

Results of DSPCA applied to the host spectra of fleas (=communities in DCPCA) based on the abundance of fleas on different host species and phylogenetic similarities among hosts (=species in DSPCA). Hosts: host scores on principal components (PC), fleas: flea scores on principal components. (A) Europe (Moscow region of Russia; PC1 and PC2), (B) Asia (Western Khangai Mountains in Mongolia; PC 1 and PC2). See Supplementary Material, Appendix 1 for flea and host species names.
Fig. 3.

Results of DSPCA applied to the host spectra of fleas (=communities in DCPCA) based on the abundance of fleas on different host species and phylogenetic similarities among hosts (=species in DSPCA). Hosts: host scores on the first two principal components (PC1 and PC2), fleas: flea scores on the first two principal components (PC1 and PC2). A: North America (central California), B: Africa (South Africa). See Supplementary Material, Appendix 1 for flea and host species names.
The distribution of host and flea species in the space of principal components allowed envisaging phylogenetic clusters of hosts that were mainly exploited by clusters of flea species (both in terms of occurrence and mean abundance). In particular, the distribution of European hosts and fleas along the second principal component suggested that shrews and a mole were used mostly by Doratopsylla dasycnema, Palaeopsylla soricis and Ctenophthalmus bisoctodentatus (Fig. 2A), whereas the distribution of these species along the third principal component demonstrated that the two former flea species mostly parasitized shrews, whereas the latter flea mainly exploited a mole (Fig. 2B). In the Asian assemblage, pikas (Ochotona) were mainly exploited by the fleas Amphalius runatus and Ochotonobius hirticrus, whereas a marmot (Marmota sibirica), a ground squirrel (Spermophilus undulatus) and a jerboa (Orientallactaga sibirica) were exploited by the flea Citellophilus tesquorum (Fig. 2C). In North America, two sciurid species (Tamias merriami and Spermophilus beechyi) were characteristic hosts for the fleas Hoplopsyllus anomalus and Oropsylla montana (Fig. 3A). In Africa, gerbillines (Gerbillurus paeba, Desmodillus auricularis and Gerbilliscus brantsii) and a cricetomyine (Steatomys pratensis) were the main hosts for Xenopsylla eridos, but not for other fleas.
Trait similarity of host spectra
The DSPCA for host trait similarities produced from four (for similarity in shelter structure) to 6–12 (for similarity in body mass or BMR) principal components, with 1–4 of them for shelter structure and 1–2 for body mass and BMR being >1 (Table 2). In three of four assemblages (European, Asian and African), the average pairwise similarity between the host spectra of co-occurring flea species in a region was high for body mass and BMR (0.85–0.95 and 0.90–0.98, respectively) and much lower for shelter structure (0.49–0.58). This suggests that hosts with different body masses or BMR were equally represented (in terms of their relative abundances) in the host repertoires of different fleas. In the North American assemblage, similarity of host spectra, in terms of body mass and BMR, was lower than that in other assemblages (0.59 and 0.60, respectively), although the values of the last eigenvalues (which express the dissimilarity between host spectra; see above) were as low as those in the remaining assemblages (Table 2). Similarity of the host spectra of North American fleas, in terms of shelter structure, was the lowest among all assemblages (0.33). This means that co-habitating fleas differed in their abundances and frequency of occurrence between host species with different shelter structures. This was true for the assemblages in all continents and is highlighted by clear differences in the eigenvalues of the last principal components produced by DSPCAs for host similarity in body mass and BMR, on one hand, and host similarity in shelter structure, on the other hand (Table 2). In the North American assemblage, DSPCAs identified small and medium-sized mammals with a relatively low BMR as the most common hosts for the majority of fleas. In other words, many flea species used small and medium-sized hosts in terms of both occurrence and abundance. On the contrary, only a few fleas attained high abundance in larger hosts with a higher BMR (e.g., H. anomalus and O. montana in S. beechyi) (Fig. 4).
Table 2.
Eigenvalues produced by Double Similarity Principal Component Analysis (DSPCA) for trait similarity in the host spectra of fleas in four regional assemblages
| Trait | Assemblage | Nt | N1 | 1st eigenvalue | Last eigenvalue |
|---|---|---|---|---|---|
| Body mass | Europe | 12 | 2 | 10.49 | 0.000003 |
| Asia | 11 | 1 | 10.85 | 0.000007 | |
| North America | 9 | 2 | 6.40 | 0.0000006 | |
| Africa | 6 | 1 | 5.79 | 0.008 | |
| BMR | Europe | 12 | 1 | 10.90 | 0.00001 |
| Asia | 11 | 1 | 10.85 | 0.000007 | |
| North America | 9 | 2 | 6.22 | 0.0000001 | |
| Africa | 6 | 1 | 5.79 | 0.008 | |
| Shelter | Europe | 4 | 3 | 6.79 | 0.91 |
| Asia | 4 | 4 | 6.79 | 1.07 | |
| North America | 4 | 4 | 4.25 | 1.27 | |
| Africa | 4 | 1 | 4.45 | 0.003 |
BMR, basal metabolic rate; shelter, shelter depth and complexity (see text for details); Nt, total number of eigenvalues; N1, number of eigenvalues >1.
Fig. 4.

Results of DSPCA applied to the host spectra of fleas (=communities in DCPCA) based on the abundance of fleas on different host species and similarities among hosts (=species in DSPCA) in body mass (A) and basal metabolic rate (BMR) for the North American flea assemblage (central California). Hosts: host scores on principal components (PC; PC1 and PC2), fleas: flea scores on principal components (PC; PC1 and PC2). See Supplementary Material, Appendix 1 for flea and host species names.
In the European assemblage, the host spectra of the majority of fleas were composed of species with either simple burrows or burrows with moderate complexity, whereas hosts with either aboveground nests (e.g. Micromys minutus) or complex burrows (Talpa europea) were rarely represented in the host spectra (Fig. 5A). The second principal component highlighted the differences between fleas exploiting hosts with simple vs moderately complex burrows (e.g. P. soricis on shrews vs Ctenophthalmus agyrtes on voles), and the third principal component reflected the differences between fleas using hosts with complex burrows (C. bisoctodentatus on a mole) and fleas using hosts with aboveground nests and shallow and moderately complex burrows (Fig. 5A and B). In Asia, the host species with the highest scores on the first principal component (i.e. the most representative in the host spectra of all fleas) were those with moderately (e.g. Meriones meridianus) or very complex burrows (e.g. S. undulatus), whereas species with shelters in rocky crevices had the lowest scores (e.g. Ochotona pallasi) (Fig. 6A). The two former species categories were differentiated along the second principal component (Fig. 6A). The third and the fourth principal components highlighted the differences between fleas attaining high abundances on either (a) hosts with moderately complex burrows (Amphipsylla longispina on Stenocranius gregalis) or (b) hosts sheltering in rocky crevices (e.g. O. chirticrus on Ochotona daurica), respectively, and the remaining host species (Fig. 6B). In North America, the most representative hosts in fleas' host spectra were those with simple burrows (e.g. S. ornatus), and the least representative hosts were those with deep complex burrows (e.g. Thomomys bottae) (Fig. 7A). The majority of fleas attained high abundance on the former, whereas only a few species were abundant on the latter. The second principal component showed the differences between flea species predominantly parasitic on hosts with complex burrows and the remaining hosts (Fig. 7A). The fleas that were dominant on hosts with (a) aboveground nests (e.g. Atyphloceras multidentatus on Neotoma fuscipes) and (b) simple burrows (e.g. Aetheca wagneri on Peromyscus species) had negative and positive scores, respectively, along the third principal component. The fourth principal component highlighted the differences between fleas predominantly exploiting hosts with moderately complex burrows (e.g. Carteretta carteri on Chaetodipus californicus) and the remaining fleas (Fig. 7B). In Africa, the first and second principal components discriminated mainly between fleas predominantly using hosts with moderately complex burrows (e.g. Dinopsyllus ellobius on G. paeba) and fleas predominantly using hosts with deep complex burrows (e.g. X. eridos on G. brantsii) (Fig. 8). The former hosts were also the most representative of the majority of flea species. Host species distribution along the first principal component also suggested that the abundance of the majority of fleas (except X. eridos) was the highest on these hosts, followed by the abundance on hosts with aboveground nests or shelters in rock crevices, and attaining zero on hosts with deep complex burrows (Fig. 7).
Fig. 5.

Results of DSPCA applied to the host spectra of fleas (=communities in DCPCA) based on the abundance of fleas on different host species and similarities among hosts (=species in DSPCA) in their shelter structures (see text for details) for the European flea assemblage (Moscow region of Russia). Hosts: host scores on principal components (PC; A: PC1 and PC2, B: PC2 and PC3), fleas: flea scores on principal components (PC; A: PC1 and PC2, B: PC2 and PC3). See Supplementary Material, Appendix 1 for flea and host species names.
Fig. 6.

Results of DSPCA applied to the host spectra of fleas (=communities in DCPCA) based on the abundance of fleas on different host species and similarities among hosts (=species in DSPCA) in their shelter structures (see text for details) for the Asian flea assemblage (Western Khangai Mountains in Mongolia). Hosts: host scores on principal components (PC; A: PC1 and PC2, B: PC3 and PC4), fleas: flea scores on principal components (PC; A: PC1 and PC2, B: PC3 and PC4). See Supplementary Material, Appendix 1 for flea and host species names.
Fig. 7.

Results of DSPCA applied to the host spectra of fleas (=communities in DCPCA) based on the abundance of fleas on different host species and similarities among hosts (=species in DSPCA) in their shelter structures (see text for details) for the North American flea assemblage (central California). Hosts: host scores on principal components (PC; A: PC1 and PC2, B: PC3 and PC4), fleas: flea scores on principal components (PC; A: PC1 and PC2, B: PC3 and PC4). See Supplementary Material, Appendix 1 for flea and host species names.
Fig. 8.

Results of DSPCA applied to the host spectra of fleas (=communities in DCPCA) based on the abundance of fleas on different host species and similarities among hosts (=species in DSPCA) in their shelter structures (see text for details) for the African flea assemblage (South Africa). Hosts: host scores on principal components (PC; PC1 and PC2), fleas: flea scores on principal components (PC; PC1 and PC2).
Discussion
The application of DSPCA allowed us to reveal the main drivers of (dis)similarity in host spectra between co-habitating fleas. We found that the host spectra of fleas differed in terms of the abundance attained by these fleas on hosts (a) of different phylogenetic affinities and (b) possessing shelters of different complexity types. In three of the four continents, flea occurrences and abundances did not substantially differ in dependence on the body size or the metabolic rate of their hosts, leading to a high level of functional similarity (based on either of these traits) among host spectra. Furthermore, patterns of phylogenetic and functional (dis)similarity in host spectra varied between the flea assemblages from the four continents.
Host phylogeny
Relatively low average phylogenetic similarity in host spectra suggests that (a) a given flea species selects hosts belonging to certain phylogenetic lineages from a pool of available hosts, and (b) some flea species differ in the phylogenetic composition of their host spectra, whereas others do not. The phylogenetic composition of a parasite's host spectrum is mostly determined by at least three, not mutually exclusive, factors. First, a parasite may select hosts of the lineage they originated on (e.g. Hafner and Nadler, 1988). Although the original host lineage for any flea lineage is unknown, the distribution of fleas across mammalian lineages and the links between the morphological traits of fleas (e.g. chaetotaxy) and the morphological traits of their hosts (e.g. hair structure and density) suggest that this may be the case (Traub, 1972, 1985). Second, hosts may be added to a flea's host spectrum via host switching or host colonization, which were both proved to be frequent events in flea evolution (e.g. Whiting et al., 2008). Third, a flea may merely use an available host (Krasnov et al., 2014). A host to which a flea switches or which it colonizes and a host that is available for a flea in a given locality or region are not necessarily close phylogenetic relatives of the original host. Indeed, mapping of host association onto flea phylogeny indicated four independent shifts from a mammal host to a bird host (Whiting et al., 2008).
Flea species differ in their ability to expand their host spectra. This is one of the reasons behind the great variation in host specificity (in terms of the number of host species and their phylogenetic relatedness) among fleas (Poulin et al., 2006; Krasnov et al., 2014). Furthermore, host species can be more or less prone to flea parasitism due to variation in, for example, skin thickness (Sokolov, 1982) or behavioural defence abilities (anti-parasitic grooming) (Nikitina and Nikolaeva, 1979). These features seem to be characteristic of hosts of certain phylogenetic lineages. As a result, some lineages could be suitable hosts for many flea species, whereas other lineages may be used by only a few fleas. These abilities may determine the degree of representativeness of a species as a host for the majority of flea species in a regional assemblage. For example, voles (Microtus, Myodes and Arvicola) are the most representative hosts for European fleas (Fig. 4A). These species are closely related (Fig. 1) and support large numbers of 8–12 flea species. In contrast, a birch mouse (Sicista) is the most uncommon (=‘original’ sensu Pavoine, 2019) host (Fig. 5). From the phylogenetic perspective, this host is the most isolated on the phylogenetic tree (Fig. 1), parasitized by only four flea species that do not attain high abundance.
Interestingly, fleas exploiting phylogenetically close hosts are not usually phylogenetic relatives themselves. For example, D. dasycnema and P. soricis, which are both parasitic on shrews in Europe although belong to the same family (Hystrichopsyllidae) but to different tribes (Doratopsyllini and Ctenophthalmini, respectively). Similarly, A. nuperus and O. hirticrus, which exploit pikas in Asia, belong to different families (Hystrichopsyllidae and Leptopsyllidae, respectively). The same is true for H. anomalus and O. montana parasitic on sciurids in North America (Pulicidae and Ceratophyllidae, respectively) and Hypsophthalmus temporis and Listropsylla agrippinae parasitic on Rhabdomys species in Africa (Chimaeropsyllidae and Hystrichopsyllidae, respectively). This contradicts our earlier results (Krasnov et al., 2019). The discrepancy between the pattern found by Krasnov et al. (2019) (phylogenetic relatedness of fleas parasitic on the same hosts) and the results of this study (phylogenetic unrelatedness of fleas parasitic on the same hosts) could have arisen because of differences in the considered scales. Krasnov et al. (2019) analysed the host spectra of fleas across regions of the entire northern Palearctic, whereas this study focused on the patterns within a region, so that the large-scale pattern might have not been realized at the small scale.
The patterns of phylogenetic similarity of fleas' host spectra varied across continents, being the highest in Africa and lower in Europe, Asia and North America. The likely reason behind this variation is the longer uninterrupted history of the flea-mammal associations in Africa than in North America and Eurasia. Although fleas originated in Gondwana and could periodically migrate from South America to North America at the Caribbean region during the Late Cretaceous (Zhu et al., 2015), the Quaternary periodic glaciations in the Northern Hemisphere could have disrupted flea–host associations, thus forcing fleas to establish new host associations. Despite the fact that central California was not covered by extensive ice sheets (Barendregt and Irving, 1998), periodic glaciations in the northern parts of North America could influence flea–host associations in the southern regions of the continent. The longer common history of mammals and fleas in Africa might have increased the chances of host switching and host colonization within phylogenetically related host groups, thus resulting in higher phylogenetic similarity of host spectra among fleas. Another, not necessarily alternative reason for high phylogenetic similarity between fleas' host spectra in Africa might be the fact that Africa has a much higher mammalian diversity than other continents with many host species in local communities being closely related (e.g. García-Navas, 2019 for muroid rodents)
Host traits: physiology
In three of the four regional assemblages, body mass- and BMR-based similarity among fleas' host spectra was high. This is despite the high variability of host species in these traits within the host spectrum of almost all fleas. For example, in the Asian assemblage, Amphipsylla primaris occurred on both a large M. sibirica (average body mass ca. 8000 g) and a much smaller Phodopus sungorus (average body mass 33.2 g). Mean abundance attained by fleas on a host may or may not correlate positively with host size (Kiffner et al., 2013; Goldberg et al., 2020). No study that aims to test the effect of a host's BMR on flea abundance has been performed, but indirect evidence suggests that this effect is unlikely. First, no relationship between host body mass or BMR and flea species richness was found (Krasnov et al., 2004). Second, a flea's abundance on a host appeared to be negatively correlated with the species richness of fleas on this host (Krasnov et al., 2005b). Taken together, these findings suggest that the distribution of a flea among host species with different body masses or BMRs is unlikely to follow any general rule resulting in the among-flea similarity in host spectra in terms of host body mass and BMR. One of the mechanisms behind this could be physiological and morphological constraints on flea reproduction, which are independent of host physiology (Krasnov, 2008). Nevertheless, the relatively low similarity in host spectra in the North American assemblage, in regard to host body mass and BMR, requires some explanation. This might be associated with the relatively shorter history of flea–mammal associations in this region (see above), so that some North American fleas that originally exploited large hosts with high BMRs did not have enough evolutionary time to include smaller hosts with low BMRs in their host spectra. We recognize, however, that this explanation is highly speculative and is not supported by any empirical evidence. In addition, the last eigenvalues of the DSPCAs for body mass and BMR similarities among host spectra in North America were extremely low (Table 2). This suggests that, despite the relatively low average similarity in host spectra among North American fleas, the full dissimilarity between them is practically non-existent (Pavoine, 2019), so that the DSPCA indicated low differences in host body mass and BMR within and between the host spectra of these fleas.
Host traits: ecology
The structure of a host's shelter is of the utmost importance for the majority of flea species. This is because (a) pre-imaginal development takes place in a host's burrow or nest, and (b) many fleas spend a substantial part of their lives off-host. The depth and complexity of a mammal's burrow determine the burrow environment, in terms of temperature, relative humidity and CO2 concentration (Shenbrot et al., 2002; Brickner-Braun et al., 2014). Both pre-imaginal and adult fleas are sensitive to these factors (Krasnov et al., 2001, 2002; Downs et al., 2015). Flea species, even congenerics, often differ substantially in their microclimatic preferences (see review in Krasnov, 2008). Differential microclimatic preferences result in differential occurrences and abundances of flea species on hosts with different shelter structures, which, in turn, is the most likely reason behind the low average similarity in host shelter structure among co-occurring fleas found in this study.
Flea species that exploit hosts with similar traits often demonstrate a similarity in their own traits (Krasnov et al., 2016). This appeared to be at least partly true for fleas in our study, in regard to host shelter structure. For example, all fleas that were most abundant on hosts with simple shallow burrows (woodmice and shrews) in Europe (Leptopsylla segnis, D. dasycnema, P. soricis and Megabothris turbidus; Fig. 5A) possess sclerotized combs (ctenidia), and three of them (except M. turbidus) are so-called ‘body’, ‘hair’ or ‘fur’ species that spend most of their lives on a host's body (as contrasted to the ‘nest’ species that spend most of their lives in a host's burrow/nest and attack the host only to obtain a blood meal), sometimes even ovipositing there (Krasnov, 2008). However, trait similarity in fleas parasitic on hosts with similar burrowing habits is not always the case. For example, the African fleas L. agrippinae, Chiastopsylla rossi, and H. temporis are characteristic (in terms of occurrence and abundance) parasites of Rhabdomys species that have moderately complex burrows (Fig. 8). These three fleas have different strategies of host exploitation with the first being a ‘body’ flea and the latter two being ‘nest’ fleas (i.e. they spend most of their lives in a host's burrow/nest and attack the host only to obtain a blood meal) (de Meilon et al., 1961; van der Mescht et al., 2016). However, all three species have pronotal combs, while genal combs are characteristic for C. rossi and H. temporis but not L. agrippinae (de Meilon et al., 1961). From the first glance, it seems that the reason for more flea species being recorded on hosts possessing simple burrows than on hosts possessing complex burrows could be a mere consequence of higher number of host species with simple shelters than those with complex shelters. However, this is unlikely because the number of the former is substantially greater than the number of the latter in the European assemblage only (11 vs 4, respectively), whereas in other assemblages these numbers either do not substantially differ (8 vs 5, respectively, in North America and 12 vs 8, respectively, in Africa) or even the number of host species using simple burrows is greater than that of host species using complex burrows (6 vs 11, respectively, in Asia).
We recognize, however, that our datasets have some limitations. First, the regional surveys that we used as data sources could be biased because some host species might be not sampled (e.g. those that require hunting rather than trapping) and some flea species could be misidentified. Second, an assemblage of species in a given locality comprises two components, namely species that are present and species that may potentially inhabit this locality, due to suitable ecological conditions, but that are absent (dark diversity; Pärtel et al., 2011) either because of, for example, dispersal limitations or merely by chance. The latter reason is the most probable for parasites because of their aggregated distributions which also may affect estimations of their abundance (although we did our best to avoid the confounding effect of unequal sampling effort; see above). Third, trapping design and construction of traps differed between studies due to historical reasons and technological limitations so that the degree and direction on biases could, potentially, differ between studies. All this suggests that the results of the studies based on data from regional surveys should be interpreted cautiously. However, it should also be noted that the aims of the studies used as data sources here were to record as many flea species parasitic on small mammals and inhabiting a given region as possible. Furthermore, the trends found in our study [strong influence of host phylogeny and shelter structure and lower influence of host morphophysiological traits on the patterns of (dis)similarity in host spectra between fleas] appeared to be qualitatively robust being very similar in four flea–host assemblages from four continents despite profoundly different species composition of both fleas and hosts.
In conclusion, the main drivers of (dis)similarity between the host spectra of fleas within a regional assemblage are host phylogenetic affinities and ecological traits, whereas the role of host physiology in the patterns of (dis)similarity between flea host spectra is less pronounced. In addition, the effects of host phylogeny, physiology and ecology on the species composition of host spectra and their (dis)similarity may vary across continents and may be associated with the evolutionary histories of continental flea faunas.
Acknowledgements
This is publication no. 1101 of the Mitrani Department of Desert Ecology.
Author contribution
B.R.K. conceived and designed the study. B.R.K., I.S.K., L.V.D.M. and S.M. collected the data. B.R.K. and I.S.K. performed statistical analyses. B.R.K. and I.S.K. wrote the first draft of the article. All authors finalized the article.
Financial support
This study was partly supported by the Israel Science Foundation (grant number 149/17 to B.R.K. and I.S.K.).
Ethical standards
This study is based on published data, and therefore, ethical standards are not applicable.
Supplementary material
For supplementary material accompanying this paper visit https://doi.org/10.1017/S0031182021001621.
click here to view supplementary material
Conflict of interest
None.
References
- Araujo SBL, Braga MP, Brooks DR, Agosta SJ, Hoberg EP, von Hartenthal FW and Boeger WA (2015) Understanding host-switching by ecological fitting. PLoS ONE 10, e0139225. [DOI] [PMC free article] [PubMed] [Google Scholar]
- Barendregt RW and Irving E (1998) Changes in the extent of North American ice sheets during the late Cenozoic. Canadian Journal of Earth Sciences 35, 504–509. [Google Scholar]
- Bordes F, Blumstein DT and Morand S (2007) Rodent sociality and parasite diversity. Biology Letters 3, 692–694. [DOI] [PMC free article] [PubMed] [Google Scholar]
- Brickner-Braun I, Zucker-Milwerger D, Braun A, Turner JS, Pinshow B and Berliner P (2014) Ventilation of multi-entranced rodent burrows by boundary layer eddies. Journal of Experimental Biology 217, 4141–4148. [DOI] [PubMed] [Google Scholar]
- Capellini I, Venditti C and Barton RA (2010) Phylogeny and metabolic scaling in mammals. Ecology 91, 2783–2793. [DOI] [PubMed] [Google Scholar]
- Combes C (2001) Parasitism. The Ecology and Evolution of Intimate Interactions. Chicago: University of Chicago Press. [Google Scholar]
- Darskaya NF, Bragina ZS and Petrov VG (1970) On fleas of the common vole and shrews in dependence on sharp density fluctuations of these mammals. In Tiflov VE (ed.), Vectors of Particularly Dangerous Diseases and Their Control. Stavropol, USSR: Scientific Anti-Plague Institute of Caucasus Trans-Caucasus, pp. 132–152 (in Russian). [Google Scholar]
- de Meilon B, Davis DHS and Hardy F (1961) Plague in Southern Africa. Vol. I. The Siphonaptera (Excluding Ischnopsyllidae). Pretoria, South Africa: Government Printer. [Google Scholar]
- Downs CJ, Pinshow B, Khokhlova IS and Krasnov BR (2015) Flea fitness is reduced by high fractional concentrations of CO2 that simulate levels found in their hosts’ burrows. Journal of Experimental Biology 218, 3596–3603. [DOI] [PubMed] [Google Scholar]
- Ganem G, Dufour CMS, Avenant NL, Caminade P, Eiseb SJ, Tougard C and Pillay N (2020) An update on the distribution and diversification of Rhabdomys sp. (Muridae, Rodentia). Journal of Vertebrate Biology 69, 20013. [Google Scholar]
- García-Navas V (2019) Phylogenetic and functional diversity of African muroid rodents at different spatial scales. Organisms Diversity & Evolution 19, 637–650. [Google Scholar]
- Genoud M, Isler K and Martin RD (2018) Comparative analyses of basal rate of metabolism in mammals: data selection does matter. Biological Reviews 93, 404–438. [DOI] [PubMed] [Google Scholar]
- Goldberg AR, Conway CJ and Biggins DE (2020) Flea sharing among sympatric rodent hosts: implications for potential plague effects on a threatened sciurid. Ecosphere (Washington, DC) 11, e03033. [Google Scholar]
- Gupta P, Vishnudas CK, Robin VV and Dharmarajan G (2020) Host phylogeny matters: examining sources of variation in infection risk by blood parasites across a tropical montane bird community in India. Parasites & Vectors 13, 536. [DOI] [PMC free article] [PubMed] [Google Scholar]
- Hadfield JD, Krasnov BR, Poulin R and Nakagawa S (2014) Tale of two phylogenies: comparative analyses of ecological interactions. The American Naturalist 183, 174–187. [DOI] [PubMed] [Google Scholar]
- Hafner MS and Nadler SA (1988) Phylogenetic trees support the coevolution of parasites and their hosts. Nature 332, 258–259. [DOI] [PubMed] [Google Scholar]
- Jones KE, Bielby J, Cardillo M, Fritz SA, O'Dell J, Orme CDL, Safi K, Sechrest W, Boakes EH, Carbone C, Connolly C, Cutts MJ, Foster JK, Grenyer R, Habib M, Plaster CA, Price SA, Rigby EA, Rist J, Teacher A, Bininda-Emonds ORP, Gittleman JL, Mace GM and Purvis A (2009) PanTHERIA: a species-level database of life history, ecology, and geography of extant and recently extinct mammals. Ecology 90, 2648. [Google Scholar]
- Kalabukhov NI (1969) Periodical (Seasonal and Annual) Changes in Organism of Rodents. Moscow, USSR: Nauka (in Russian). [Google Scholar]
- Kiffner C, Stanko M, Morand S, Khokhlova IS, Shenbrot GI, Laudisoit A, Leirs H, Hawlena H and Krasnov BR (2013) Sex-biased parasitism is not universal: evidence from rodent–flea associations from three biomes. Oecologia 173, 1009–1022. [DOI] [PubMed] [Google Scholar]
- Krasnov BR (2008) Functional and Evolutionary Ecology of Fleas. A Model for Ecological Parasitology. Cambridge, UK: Cambridge University Press. [Google Scholar]
- Krasnov BR, Khokhlova IS, Fielden LJ and Burdelova NV (2001) The effect of air temperature and humidity on the survival of pre-imaginal stages of two flea species (Siphonaptera: Pulicidae). Journal of Medical Entomology 38, 629–637. [DOI] [PubMed] [Google Scholar]
- Krasnov BR, Khokhlova IS, Fielden LJ and Burdelova NV (2002) Time to survival under starvation in two flea species (Siphonaptera: Pulicidae) at different air temperatures and relative humidities. Journal of Vector Ecology 27, 70–81. [PubMed] [Google Scholar]
- Krasnov BR, Shenbrot GI, Khokhlova IS and Degen AA (2004) Flea species richness and parameters of host body, host geography and host ‘milieu’. Journal of Animal Ecology 73, 1121–1128. [Google Scholar]
- Krasnov BR, Shenbrot GI, Mouillot D, Khokhlova IS and Poulin R (2005a) Spatial variation in species diversity and composition of flea assemblages in small mammalian hosts: geographic distance or faunal similarity? Journal of Biogeography 32, 633–644. [Google Scholar]
- Krasnov BR, Mouillot D, Shenbrot GI, Khokhlova IS and Poulin R (2005b) Abundance patterns and coexistence processes in communities of fleas parasitic on small mammals. Ecography 28, 453–464. [Google Scholar]
- Krasnov BR, Morand S, Mouillot D, Shenbrot GI, Khokhlova IS and Poulin R (2006) Resource predictability and host specificity in fleas: the effect of host body mass. Parasitology 133, 81–88. [DOI] [PubMed] [Google Scholar]
- Krasnov BR, Pilosof S, Shenbrot GI, Khokhlova IS and Degen AA (2014) Phylogenetic structure of host spectra in Palaearctic fleas: stability versus spatial variation in widespread, generalist species. Parasitology 141, 181–191. [DOI] [PubMed] [Google Scholar]
- Krasnov BR, Shenbrot GI, Khokhlova IS and Degen AA (2016) Trait-based and phylogenetic associations between parasites and their hosts: a case study with small mammals and fleas in the Palearctic. Oikos 125, 29–38. [Google Scholar]
- Krasnov BR, Shenbrot GI, van der Mescht L, Warburton EM and Khokhlova IS (2019) Phylogenetic and compositional diversity are governed by different rules: a study of fleas parasitic on small mammals in four biogeographic realms. Ecography 42, 1000–1011. [Google Scholar]
- Labunets NF (1967) Zoogeographic characteristics of fleas of Western Khangai. Proceedings of Irkutsk State Scientific Anti-Plague Institute of Siberia and Far East 27, 231–240, (in Russian). [Google Scholar]
- Linsdale JM and Davis BS (1956) Taxonomic appraisal and occurrence of fleas at the Hastings Reservation in Central California. University of California Publications in Zoology 54, 293–370. [Google Scholar]
- Maddison WP and Maddison DR (2018) Mesquite: a modular system for evolutionary analysis, Version 3.51. Available at http://mesquiteproject.org.
- Medvedev SG (2005) An attempted system analysis of the evolution of the order of fleas (Siphonaptera). Lectures in Memoriam N. A. Kholodkovsky, No. 57. Saint Petersburg, Russia: Russian Entomological Society and Zoological Institute of Russian Academy of Sciences (in Russian).
- Medvedev SG (2014) The Palaearctic centers of taxonomic diversity of fleas (Siphonaptera). Entomological Review 94, 345–358. [Google Scholar]
- Mittermeier RA and Wilson DE (eds) (2018). Handbook of the Mammals of the World. Volume 8. Insectivores, Sloths and Colugos. Barcelona, Spain: Lynx Edicions. [Google Scholar]
- Morand S and Harvey PH (2000) Mammalian metabolism, longevity and parasite species richness. Proceedings of the Royal Society of London B 267, 1999–2003. [DOI] [PMC free article] [PubMed] [Google Scholar]
- Nikitina NA and Nikolaeva G (1979) Study of the ability of some rodents to get rid of fleas. Zoologicheskyi Zhurnal 58, 931–933, (in Russian). [Google Scholar]
- Pärtel M, Szava-Kovats R and Zobel M (2011) Dark diversity: shedding light on absent species. Trends in Ecology and Evolution 26, 124–128. [DOI] [PubMed] [Google Scholar]
- Pavoine S (2019) An ordination approach to explore similarities among communities. Journal of Theoretical Biology 462, 85–96. [DOI] [PubMed] [Google Scholar]
- Pavoine S (2020) adiv: An R package to analyse biodiversity in ecology. Methods in Ecology and Evolution 11, 1106–1112. [Google Scholar]
- Pavoine S and Ricotta C (2014) Functional and phylogenetic similarity among communities. Methods in Ecology and Evolution 5, 666–675. [Google Scholar]
- Peters RH (1983) The Ecological Implications of Body Size. Cambridge, UK: Cambridge University Press. [Google Scholar]
- Poulin R, Krasnov BR, Shenbrot GI, Mouillot D and Khokhlova IS (2006) Evolution of host specificity in fleas: is it directional and irreversible? International Journal of Parasitology 36, 185–191. [DOI] [PubMed] [Google Scholar]
- Poulin R, Krasnov BR, Mouillot D and Thieltges DW (2011) The comparative ecology and biogeography of parasites. Philosophical Transactions of the Royal Society of London B 366, 2379–2390. [DOI] [PMC free article] [PubMed] [Google Scholar]
- R Core Team (2020) R: A Language and Environment for Statistical Computing. R Foundation for Statistical Computing, Vienna, Austria. Available at https://www.R-project.org/. [Google Scholar]
- Revell LJ (2012) phytools: An R package for phylogenetic comparative biology (and other things). Methods in Ecology and Evolution 3, 217–223. [Google Scholar]
- Roll U, Dayan T and Kronfeld-Schor N (2006) On the role of phylogeny in determining activity patterns of rodents. Evolutionary Ecology 20, 479–490. [Google Scholar]
- Shenbrot G, Krasnov B, Khokhlova I, Demidova T and Fielden L (2002) Habitat-dependent differences in architecture and microclimate of the burrows of Sundevall's jird (Meriones crassus) (Rodentia: Gerbillinae) in the Negev Desert, Israel. Journal of Arid Environments 51, 265–279. [Google Scholar]
- Silva M and Downing JA (1995) CRC Handbook of Mammalian Body Masses. Boca Raton, Florida: CRC Press. [Google Scholar]
- Sokolov VE (1982) Mammal Skin. Berkley: University of California Press. [Google Scholar]
- Traub R (1972) The relationship between the spines, combs and other skeletal features of fleas (Siphonaptera) and the vestiture, affinities and habits of their hosts. Journal of Medical Entomology 9, 601. [Google Scholar]
- Traub R (1985) Coevolution of fleas and mammals. In Kim KC (ed.), Coevolution of Parasitic Arthropods and Mammals. New York: John Wiley, pp. 295–437. [Google Scholar]
- Upham NS, Esselstyn JA and Jetz W (2019) Inferring the mammal tree: species-level sets of phylogenies for questions in ecology, evolution, and conservation. PLoS Biology 17, e3000494. [DOI] [PMC free article] [PubMed] [Google Scholar]
- van der Mescht L and Matthee S (2017) Host range and distribution of small mammal fleas in South Africa, with a focus on species of medical and veterinary importance. Medical and Veterinary Entomology 31, 402–413. [DOI] [PubMed] [Google Scholar]
- van der Mescht L, le Roux PC, Matthee CA, Raath MJ and Matthee S (2016) The influence of life history characteristics on flea (Siphonaptera) species distribution models. Parasites & Vectors 9, 178. [DOI] [PMC free article] [PubMed] [Google Scholar]
- White CR and Seymour RS (2005) Allometric scaling of mammalian metabolism. Journal of Experimental Biology 208, 1611–1619. [DOI] [PubMed] [Google Scholar]
- Whiting MF, Whiting AS, Hastriter MW and Dittmar K (2008) A molecular phylogeny of fleas (Insecta: Siphonaptera): origins and host associations. Cladistics 24, 677–707. [Google Scholar]
- Wilson DE, Lacher TE Jr and Mittermeier RA (eds) (2016) Handbook of the Mammals of the World. Volume 6. Lagomorphs and Rodents I. Barcelona, Spain: Lynx Edicions. [Google Scholar]
- Wilson DE, Mittermeier RA and Lacher TE Jr (eds) (2017) Handbook of the Mammals of the World. Volume 7. Rodents II. Barcelona, Spain: Lynx Edicions. [Google Scholar]
- Zhu Q, Hastriter MW, Whiting MF and Dittmar K (2015) Fleas (Siphonaptera) are cretaceous, and evolved with Theria. Molecular Phylogenetic and Evolution 90, 129–139. [DOI] [PubMed] [Google Scholar]
Associated Data
This section collects any data citations, data availability statements, or supplementary materials included in this article.
Supplementary Materials
For supplementary material accompanying this paper visit https://doi.org/10.1017/S0031182021001621.
click here to view supplementary material