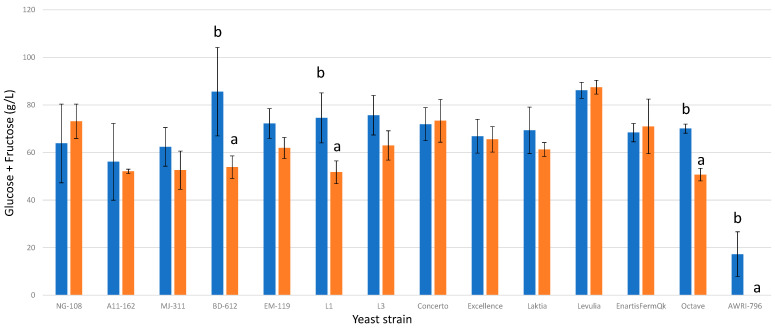
Figure 2.
The final glucose + fructose concentrations (g/L) of the final wines fermented by the examined yeast strains are illustrated, indicating their fermentation in chitosan-free SGM (blue) and chitosan-enriched SGM (orange). Distinct letters are used to indicate statistically significant differences at a significance level of p = 0.05.

