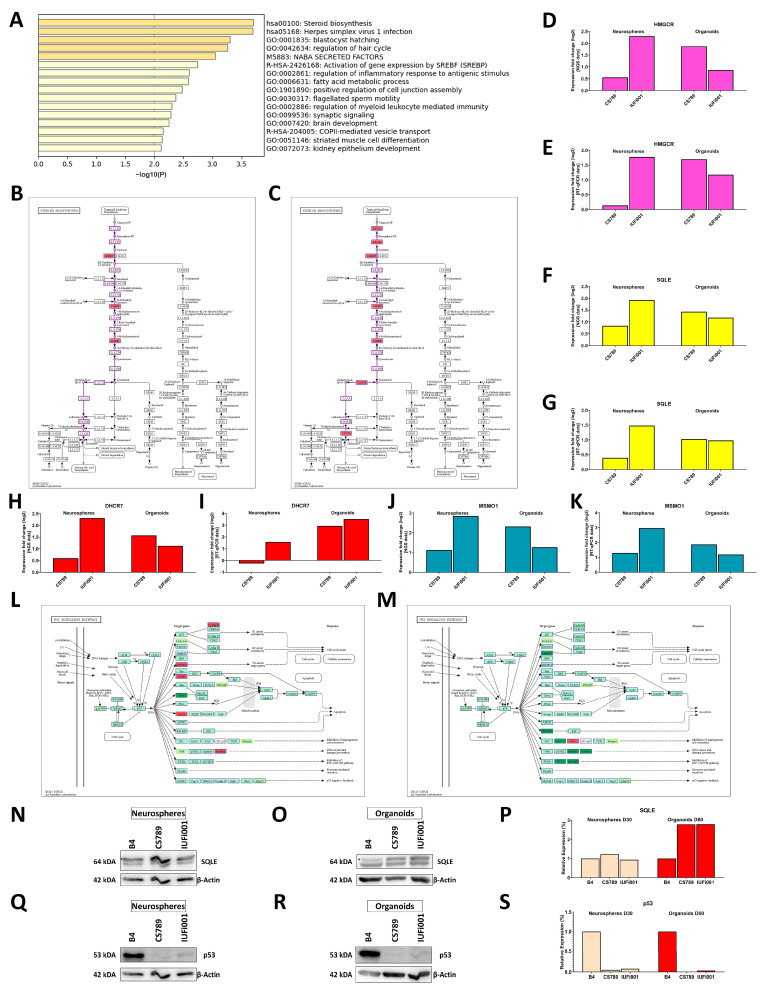
Figure 7.
Metascape-based analysis of common genes dysregulated in day 30 CS neurospheres and day CS 60 organoids. (A) Bar graph of the 16 enrichment clusters attributable to the 181 DEGs regulated in both day 30 CS NS and day 60 CS COs in comparison to CTRL (B4). (B,C) Schematic of the pathway steroid biosynthesis with the genes upregulated in CSB-deficient day 30 NS (B) and day 60 COs (C) indicated in red. (D,F,H,J) Relative mRNA expression analysis of HMGCR (D), SQLE (F), DHCR7 (H) and MSMO1 (J) in CS789 and IUFi001 organoids compared to CTRL (B4). (E,G,I,K) qRT-PCR analysis of HMGCR (E), SQLE (G), DHCR7 (I) and MSMO1 (K) mRNA expression in CS789 and IUFi001 organoids relative to CTRL (B4). (L,M) Schematic of p53 signalling pathway with genes upregulated in CSB-deficient day 30 NS (L) and day 60 COs (M) indicated in red and genes downregulated indicated in green. Genes which are not expressed are indicated in yellow. (N,O) Western blot analysis for SQLE in day 30 NS (N) and day 60 COs (O). (P) Quantification of SQLE Western blot analysis at the day 30 NS and day 60 CO stage in CTRL (B4), CS789 and IUFi001. SQLE expression of CS789 and IUFi001 is compared to SQLE expression in CTRL (B4) of the respective timepoint. (Q,R) Western blot analysis for p53 in day 30 NS (Q) and day 60 COs (R). (S) Quantification of p53 Western blot analysis at the day 30 NS and day 60 CO stage in CTRL (B4), CS789 and IUFi001. SQLE expression of CS789 and IUFi001 is compared to p53 expression in CTRL (B4) of the respective timepoint. (N,O) Asterisks (*) indicate bands of interest.

