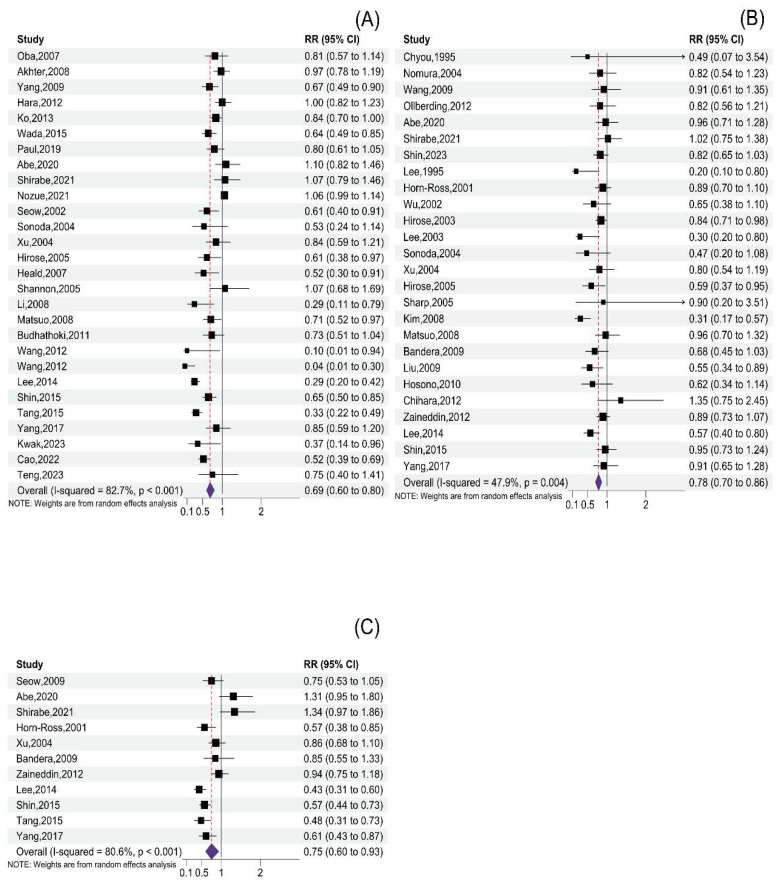
Figure 2.
Forest plot of cancer risk for the highest versus lowest categories of soy product consumption: (A) Forest plot of cancer risk for the highest versus lowest categories of total soy product consumption. Data is from references [14,15,16,18,19,20,35,36,37,39,40,41,45,47,60,61,63,64,66,69,70,72,73,74,75,80,82,83]. (B) Forest plot of cancer risk for the highest versus lowest categories of tofu consumption. Data is from references [12,13,14,15,16,17,18,20,38,44,46,56,57,60,61,62,65,67,68,71,72,76,77,79,81,83]. (C) Forest plot of cancer risk for the highest versus lowest categories of soymilk consumption. Data is from references [15,18,20,56,61,67,71,72,73,78,83].

