

SUMMARY
Non-canonical lipolysis induced by inflammatory cytokines or Toll-like receptor ligands is required for the regulation of inflammation during endotoxemia and sepsis. Canonical lipolysis induced by catecholamines declines during aging due to factors including an expansion of lymphocytes, pro-inflammatory macrophage polarization, and an increase in chronic low-grade inflammation; however, the extent to which the non-canonical pathway of lipolysis is active and impacted by immune cells during aging remains unclear. Therefore, we aimed to define the extent to which immune cells from old mice influence non-canonical lipolysis during sepsis. We identified age-associated impairments of non-canonical lipolysis and an accumulation of dysfunctional B1 B cells in the visceral white adipose tissue (vWAT) of old mice. Lifelong deficiency of B cells results in restored non-canonical lipolysis and reductions in pro-inflammatory macrophage populations. Our study suggests that targeting the B cell-macrophage signaling axis may resolve metabolic dysfunction in aged vWAT and attenuate septic severity in older individuals.
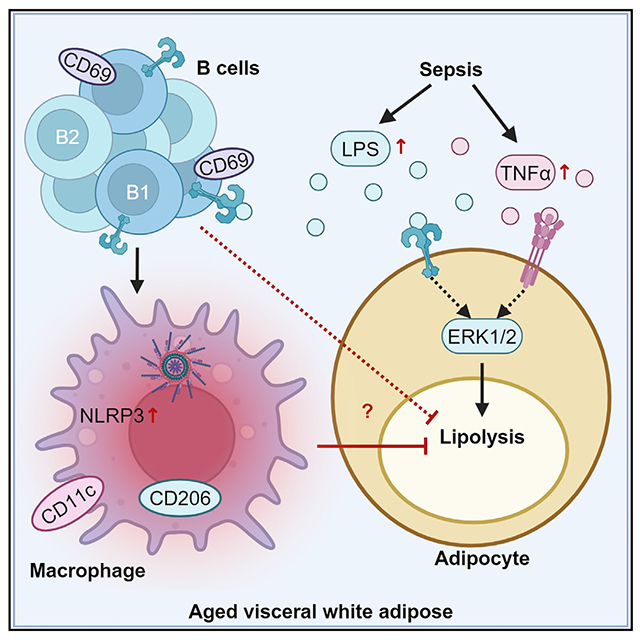
Graphical abstract
In brief
Carey et al. demonstrate that inflammation is increased but lipolysis is reduced following sepsis or endotoxemia in old mice. They identify an accumulation of inflammatory B1 B cells and B2 B cells in the visceral white adipose tissue (vWAT) of old mice. They find that B cells promote pro-inflammatory macrophages and impair non-canonical vWAT lipolysis.
INTRODUCTION
Aging is accompanied by an increase in visceral adiposity, immune cell activation, and decreased ability of visceral white adipose tissue (vWAT) to maintain homeostatic functions such as lipolysis that is required for the generation of free fatty acids.1–7 Lipolysis is activated via canonical (catecholamine) or non-canonical pathways (bacteria or inflammatory cytokines).8–13 The chronic inflammatory activation of macrophages and B cells seen during aging suppresses catecholamine-stimulated lipolysis by limiting the bioavailability of catecholamines,3,14 but it is unclear whether these vWAT immune cells from older organisms would enhance or suppress the stimulated lipolysis in the context of sepsis and inflammation.
The non-canonical lipolysis pathway is activated when lipopolysaccharide (LPS), a component of gram-negative bacteria, or cytokines bind Toll-like receptor 4 (TLR4) or cytokine receptors, respectively, on adipocytes. This leads to phosphorylation of ERK1/2 and downstream adipocyte lipase activation.9,13,15,16 Under chronic conditions, this signaling pathway and lipid availability leads to lipotoxicity and inflammation.17 However, lipolysis and the fatty acids produced are acutely required for the regulation of bacteria-induced inflammation in young mice.18–20
LPS also induces an acute inflammatory response mediated by activated neutrophils, macrophages, and lymphocytes through TLR4 in young individuals.21,22 However, older individuals have a dysfunctional immune system that results in hyperinflammatory but inefficient immune responses.23,24 The exact causes of age-associated immune dysfunction are unclear, but immunosenescence is a contributing factor. Ultimately, the failure of the immune system to properly respond drives increased morbidity and mortality of older individuals to endotoxemia and sepsis.25–27
The data presented herein demonstrate acute and simultaneous vWAT lipolysis and cytokine inflammatory responses in young mice experiencing systemic inflammation during cecal slurry (CS)-induced polymicrobial sepsis or sterile LPS-induced endotoxemia. In contrast, vWAT from old mice fails to exhibit lipolytic activation despite an amplified inflammatory cytokine response. Flow-cytometry analysis identified an age-dependent accumulation of vWAT B1 B cells that fail to become activated by pathogen challenge. Lifelong deficiency of B cells reduced pro-inflammatory macrophages and activation of the NLRP3 inflammasome, which could support improved lipolysis. These data reveal that B cells promote metabolic dysfunction and inflammation during septic challenges by supporting the pro-inflammatory activation of macrophages.
RESULTS
Bacterial sepsis-induced inflammation and lipolysis in vWAT
Initial experiments were performed to document the inflammatory and lipolytic responses in vWAT from young and old mice during CS-induced polymicrobial sepsis. We treated young (4-month-old) mice with decreasing doses of CS (1.3, 0.975, or 0.65 mg/g body weight) or vehicle (PBS with 15% glycerol) to test the hypothesis that CS injection would result in a dose-dependent loss of core body temperature (BT) and an increase in vWAT inflammation, hormone-sensitive lipase (HSL) phosphorylation, and serum non-esterified fatty acids (NEFAs). CS-treated mice showed a dose-dependent reduction in BT over the course of 4 h (Figure 1A). CS induced a significant increase in HSL phosphorylation and a nearly significant increase in serum NEFAs (p = 0.0527) at the 0.975 mg/g dose (Figures 1B and 1C). Multiple immune cell types in the vWAT, including neutrophils, macrophages, and lymphocytes, can respond rapidly to bacteria components, which results in cytokine production localized to the stromovascular fraction of vWAT.28,29 CS injection induced an increase in cytokine (e.g., Il1b, Tnf, Il6, and Il10) mRNA expression in vWAT (Figure S1A). We also analyzed the frequency and mean fluorescence intensity (MFI) of CD69 on lymphocytes30–32 and CD11b on neutrophils33 to identify the activation status of immune cells from vWAT (Figures S1B and S1C). CD69 expression was increased on B and T cells (Figures 1D and 1E), and CD11b MFI was increased on neutrophils (Figure 1F) from vWAT, at all CS doses (Figures 1D and S1C; vehicle and 0.975 mg/g shown). However, apart from the frequency of CD69+ T cells in mice given the lowest dose of CS, there were no differences identified in the spleen (Figures S1D–S1F). From this dose-response experiment, we concluded that the 0.975 mg/g dose of CS induces activation of phosphorylated HSL (pHSL) and immune cell activation in vWAT from young mice; therefore, it was selected for measuring age-related differences.
Figure 1. Old vWAT shows hyperinflammation, metabolic dysfunction, and B cell dysfunction during sepsis.
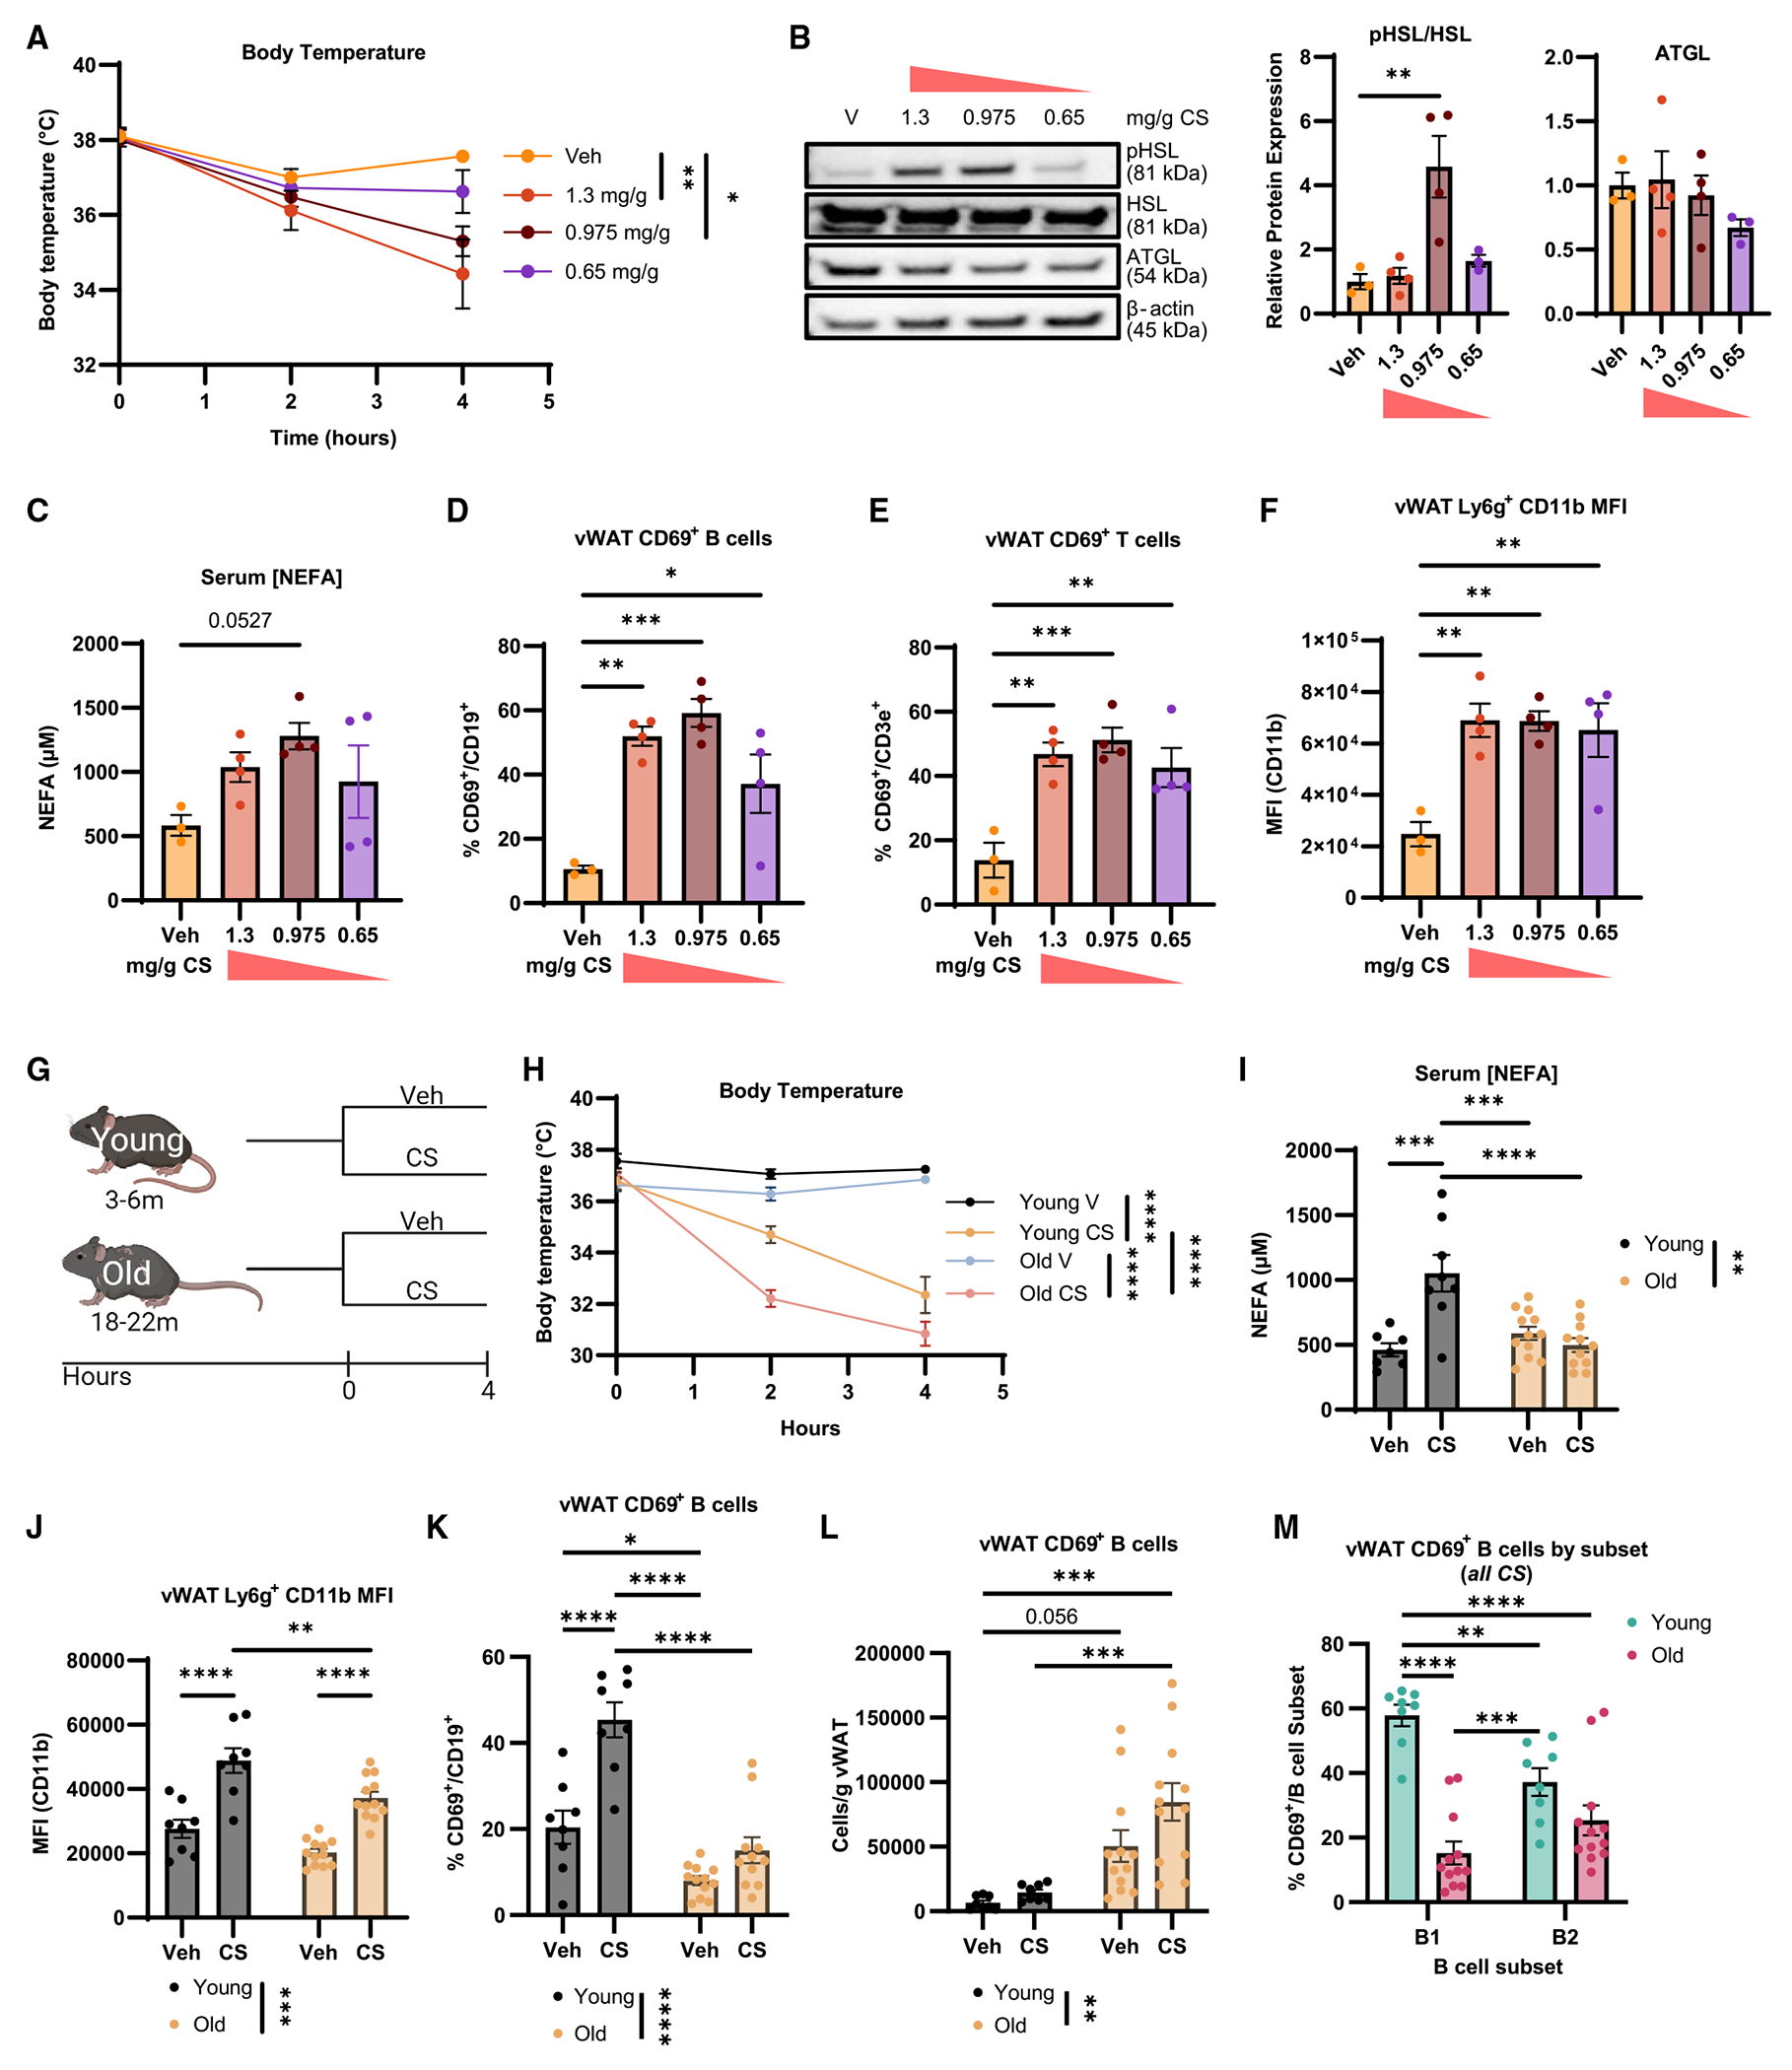
(A–F) Young mice were treated with vehicle (veh; n = 3; yellow), 1.3 mg/g (n = 4; orange), 0.975 mg/g CS (n = 4; maroon), or 0.65 mg/g cecal slurry (CS) (n = 4; purple) for 4 h. (A) Core BT measured at hours 0, 2, and 4. (B) Representative western blot of pHSL, HSL, ATGL, and β-actin from vWAT of treated mice with quantification below. (C) Serum NEFAs. (D) Frequency of CD69+ B cells in whole vWAT. (E) Proportion of CD69+ CD3+ T cells in vWAT. (F) Mean fluorescence intensity (MFI) of CD11b on Ly6g+ vWAT cells.
(G–M) Young and old mice were challenged with vehicle (young n = 8, black; old n = 12, blue) or 0.975 mg/g CS (young n = 8, yellow; old n = 12, pink). (G) Experimental schematic; created with biorender.com. (H) Core BT measured at hours 0, 2, and 4. (I) Serum NEFAs. (J) MFI of CD11b on Ly6G+ neutrophils in vWAT. (K) CD69+ B cells as a proportion of total B cells. (L) Cells/g vWAT of CD69+ B cells. (M) Comparison of CS-induced CD69 expression on vWAT B1 (purple) and B2 (blue) B cells from young and old mice.
Data are expressed as mean ± SEM. Statistical significance was determined by ANOVA with Dunnett (A–F) or Tukey (H–M) test to adjust for multiple corrections.
*p < 0.05, **p < 0.01, ***p < 0.001, ****p < 0.0001. See also Figure S1.
In the context of infection and elevated cytokines, it is unclear how inflammation-induced lipolysis would be impacted in older individuals. To address this, we treated young (3–6 months old) and old (18–22 months old) mice with 0.975 mg/g CS or vehicle for 4 h (Figure 1G). Old mice showed amplified core BT loss compared to young mice treated with the same CS (Figure 1H) as well as elevated Tnf (but not other cytokines) mRNA expression in vWAT (Figure S1G). Interestingly, old mice treated with CS failed to show CS-induced serum NEFAs that are seen in young mice (Figure 1I). These results show that an impaired stimulated lipolytic response accompanies an amplified inflammatory response in old mice.
Myeloid cells, B cells, and T cells in vWAT experience a number of alterations during aging, including changes in frequency, cell number, and inflammatory phenotype.6,14,34–36 Given the increase in cytokine expression in old mice during CS challenge, we wanted to test whether leukocytes from vWAT of old mice exhibited signs of altered activation. Expected age-related differences were present in vWAT, including an expansion of the lymphocyte populations (Figures S1H and S1I). There were no significant changes in vWAT myeloid populations (Figures S1H and S1I) or splenic (Figure S1J) immune cell composition induced by CS in the young or old mice at this 4-h time point. However, B and T cell cellularity was increased by CS in the old vWAT (Figure S1I). Although not statistically significant, there were trends toward increased neutrophils in the vWAT following CS administration (Figures S1H and S1I), which is consistent with their role as an acute innate responder.37 We analyzed the activation of neutrophils and T cells in the vWAT and spleens. CD11b MFI on neutrophils from vWAT increased with CS challenge in both young and old mice. However, while vWAT neutrophils from CS-treated old mice exhibited increased CD11b MFI compared to vehicle treatment, they had significantly reduced CD11b MFI compared to neutrophils from CS-treated young mice (Figure 1J). Splenic neutrophils from old mice showed a small, but significant, increase in CD11b MFI (Figure S1K). There were no age- or CS-induced increases in CD69 MFI on T cells from vWAT (Figure S1L), but splenic T cells from old mice had elevated CD69 expression (Figure S1M). We found that B cells from the vWAT of CS-challenged old mice failed to upregulate CD69 to the same extent as those from the vWAT of young mice (Figures 1K and S1N), which was not seen in the spleen (Figures S1O and S1P). However, given the numerical increase in total B cells in the vWAT during aging, there were significantly more CD69+ B cells/g vWAT in old as compared to the young mice (Figure 1L). These results suggest that B cells may have a greater potential for impact on inflammatory and metabolic activity in vWAT from old mice due to their numbers.
B cells can be further classified as innate-like B1 B cells that acutely produce non-specific natural antibodies during bacterial infections38 or adaptive B2 B cells that become memory B cells and produce high-affinity antibodies.39 These subsets expand equally with age and can be distinguished by the expression of CD11b on the B1 subset but not the B2 subset (Figure S1B).14,40 Given the role of B1 B cells in responding to bacterial pathogens,38,41–44 we wondered whether B1 and B2 B cells would show equivalent activation in young mice. During the CS challenge, a greater proportion of vWAT B1 B cells expressed CD69 than B2 B cells in young mice, whereas B1 B cells from vWAT of old mice had reduced CD69 expression (Figure 1M). Together, these data indicate that CS-induced sepsis induces an acute inflammatory response that includes elevated cytokine expression, reduced B cell activation, and reduced lipolytic activity in the vWAT of old mice as compared to young mice.
Endotoxemia-induced inflammation and lipolysis in vWAT
To examine non-canonical lipolysis more directly in vWAT in the absence of sepsis, we measured the metabolic and inflammatory response to purified LPS in young mice. While LPS-induced endotoxemia does not fully reproduce the hemodynamic changes seen in septic humans,45 this model has several advantages including higher reproducibility and a well-characterized acute inflammatory response.21,46,47 Young mice showed no change in BT when given the 0.1 mg LPS/kg dose compared to a commonly used dose of 1 mg/kg or a lethal dose of 18 mg/kg (Figure S2A). We predicted that even at the lowest LPS dose, old mice would exhibit more severe outcomes as measured by hypothermia and cytokine gene expression (Figure 2A). BT was significantly reduced in old mice (4–16 h post LPS) (Figure 2B). Inflammatory cytokine gene expression was amplified in vWAT and kidney tissue from old mice compared to young mice (Figure S2B). We also identified significantly increased Il1b, Il6, Tnf, and Il10 gene expression in vWAT from old mice at 4 h compared to young LPS-treated mice (Figure 2C).
Figure 2. vWAT from old mice has altered non-canonical lipolytic and inflammatory responses to LPS-induced endotoxemia.
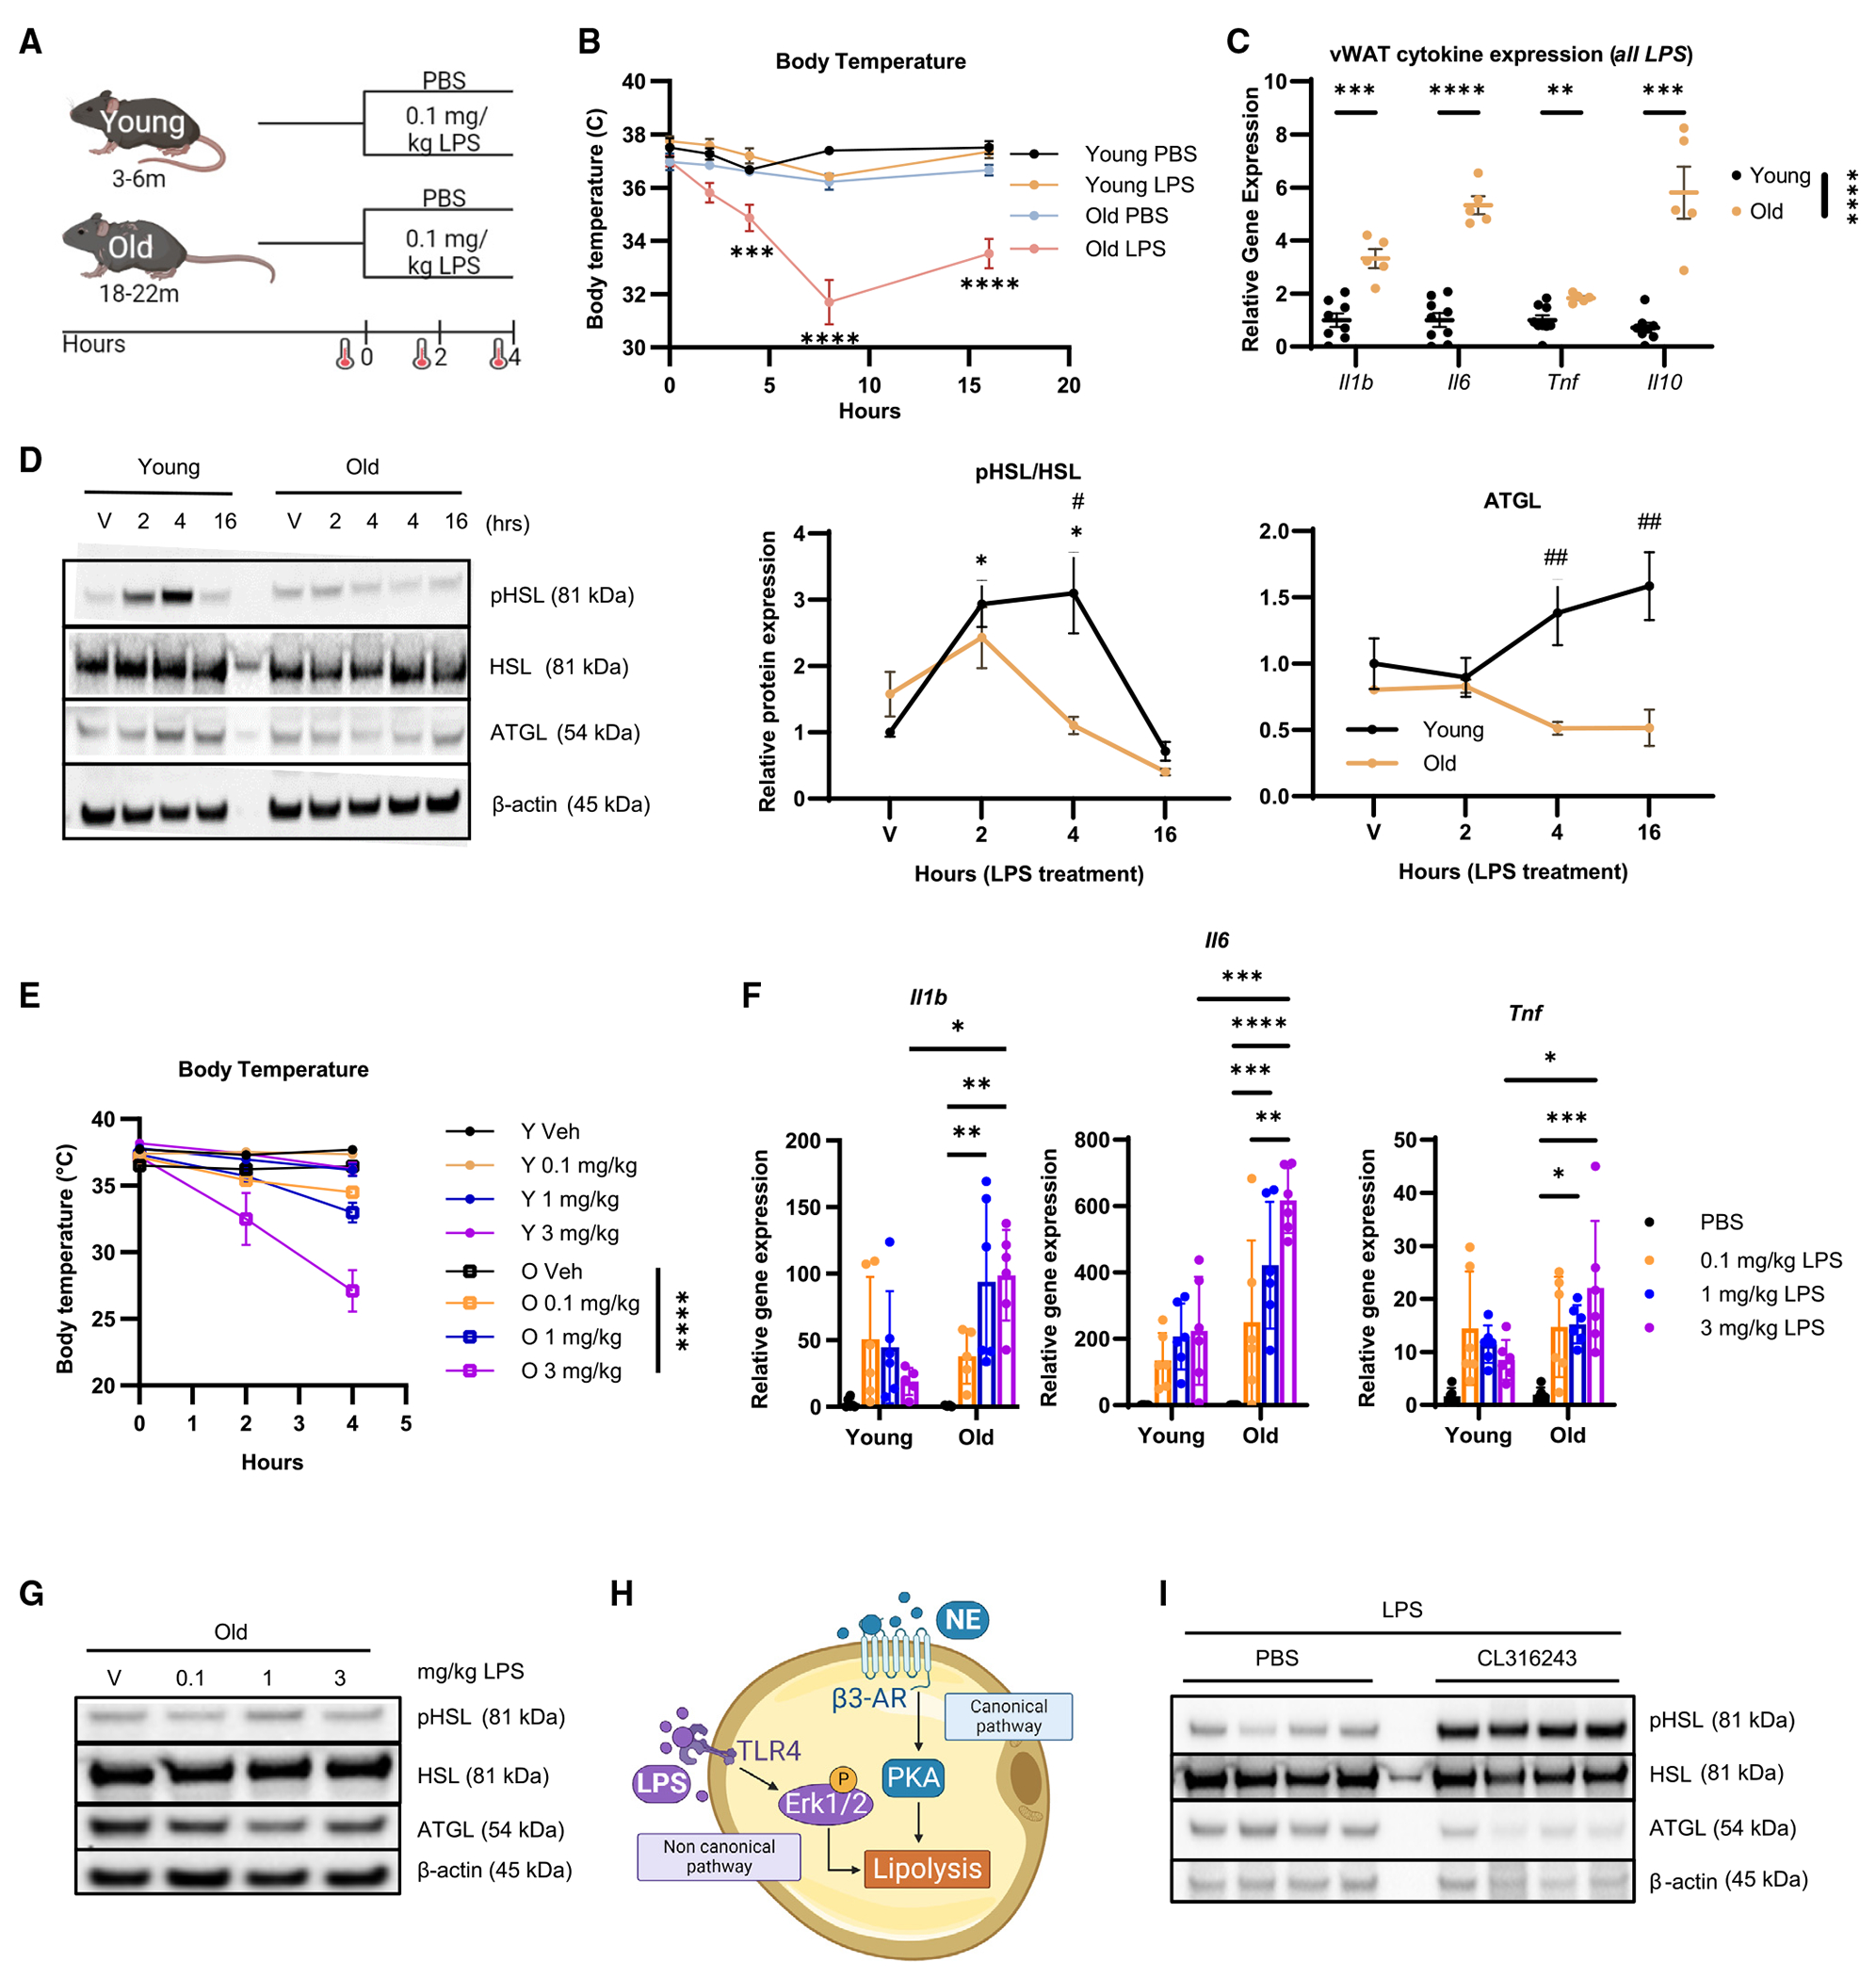
(A–D) Young (3-month-old) and old (20-month-old) female mice were treated with PBS or 0.1 mg/kg LPS. Young PBS, black; young LPS, yellow; old PBS, blue; old LPS, pink. (A) Schematic showing the 0.1 mg/kg LPS challenge experimental design; created with biorender.com. (B) Mean core BT at 0, 2, 4, 8, and 16 h. Young PBS, n = 3–8; young LPS, n = 5–16; old PBS, n = 1–10; old LPS, n = 6–14. (C) Il1b, Il6, Tnf, and Il10 gene expression from whole vWAT of young (n = 8–9; black) and old (n = 5–6; yellow) mice treated with LPS for 4 h measured by qPCR; normalized to young LPS. (D) pHSL, HSL, ATGL, and β-actin by western blot from whole vWAT of young and old mice treated with PBS (n = 5 young, n = 4 old; V) or LPS for 2 h (n = 6 young, n = 4 old), 4 h (n = 7 young, n = 5 old), or 16 h (n = 2 young, n = 3 old) with quantification to age-matched PBS (*) and to treatment-matched old (#).
(E–G) Young and old mice were treated with PBS (black), 0.1 mg/kg LPS (orange), 1 mg/kg LPS (blue), or 3 mg/kg LPS (purple) for 4 h (n = 6/group). (E) Mean core BT of young (circles) or old (open squares) mice treated with PBS, 0.1 mg/kg LPS, 1 mg/kg LPS, or 3 mg/kg LPS at 0, 2, and 4 h. (F) Gene expression of Il1b, Il6, and Tnf in whole vWAT measured by qPCR; normalized to young PBS. (G) Representative western blot of pHSL, HSL, ATGL, and β-actin from whole vWAT from old mice.
(H) Simplified schematic showing the canonical and non-canonical lipolysis pathways; created with biorender.com.
(I) Western blot of pHSL, HSL, ATGL, and β-actin from vWAT of old mice treated with PBS or 0.5 mg/kg CL316,243 prior to 8-h 0.1 mg/kg LPS challenge (n = 4/group).
Data are expressed as mean ± SEM. Statistical significance was determined by multiple t test with Holm-Sidak correction (C), or ANOVA with Dunnett (D) or Tukey (D–F) test to adjust for multiple corrections. *p < 0.05, **p < 0.01, ***p < 0.001, ****p < 0.0001. See also Figure S2.
We next tested the lipolytic response of vWAT during LPS endotoxemia and found elevated pHSL in the vWAT at 2 h and 4 h after LPS administration (Figure 2D). There was also an increase in adipose triglyceride lipase (ATGL) at 16 h post LPS challenge in the young vWAT only (Figure 2D). HSL phosphorylation was highly variable and not different across any groups in the liver or subcutaneous white adipose tissue (sWAT) from young or old mice challenged with LPS (Figures S2C and S2D). Together, these data suggest there is an amplified inflammatory response, but reduced lipolytic response, in old vWAT during acute LPS challenge that replicates what was seen in the CS-induced sepsis model.
We wondered whether increasing the dose of LPS would induce activation of HSL in vWAT from old mice. Young and old mice were injected with either 0.1, 1.0, or 3.0 mg/kg LPS for a 4-h treatment, where 3.0 mg/kg is a dose that induces mortality in 80% of old mice by 72 h.26 Young mice did not show a difference in BT when challenged with any dose of LPS; however, old mice showed a reduction in BT at all doses and exhibited the largest reduction in BT when given the 3.0 mg/kg dose (Figure 2E). There were amplified levels of Il1b, Il6, and Tnf mRNA expression in the vWAT from old mice given the increasing doses of LPS (Figure 2F). In quantifying adipocyte lipase activation from old mice, the 1 mg/kg, but not the 3 mg/kg, dose was able to increase pHSL quantities in vWAT from old mice 4 h post challenge (Figures 2G and S2E). We next wondered whether co-treatment through a second prolipolytic pathway could increase pHSL in vWAT from old mice (Figure 2H). Co-stimulation with CL316,243, a potent β3-adrenergic receptor (AR) agonist, during an 8-h LPS challenge increases pHSL in vWAT from old mice compared to LPS alone (Figures 2I and S2F). It also increases Il6, but not Tnf or Il10, mRNA expression in the vWAT (Figure S2G). These data suggest that non-canonical lipolysis can be enhanced by a higher dose of LPS in old mice or can be elicited by simultaneous stimulation through the canonical β3 AR-mediated pathway.
Endotoxemia-induced activation of vWAT B cell activation during aging
We next addressed the extent to which immune cells from vWAT are altered during LPS endotoxemia. We also examined the spleen and peritoneal cavity, as B cells are recruited from these organs to vWAT.34,35,44,48 We observed the expected age-induced changes in frequency and number of immune cells in vWAT, spleen, and peritoneal cavity (Figures S3A–S3F). LPS did not affect total vWAT B cell, macrophage, or neutrophil populations, but we did observe a significant decrease in T cell frequency and number in vWAT from old mice (Figures S3A and S3B). In the spleen from old mice, LPS induced an increase in the proportion of B cells with a corresponding decline in the T cell population (Figure S3C). We observed a decrease in splenic B cell number in young and old LPS-treated mice (Figure S3D). In the peritoneal cavity of old mice, LPS increases the frequency of B cells and the number of T cells (Figures S3E and S3F). The changes in peritoneal cavity and spleen could reflect migrating immune cell subsets. However, taken as a whole, these data suggest the 4-h LPS challenge does not cause significant proliferation or cell recruitment to vWAT which, would be detected by increases in cell number but which might be seen at longer time points.
Next, we addressed leukocyte activation in young and old mice following LPS challenge (Figures S3G and S3H). As vWAT B cells from old mice failed to become activated in the CS challenge, we examined CD69 expression on B cells. While the frequency of CD69+ CD19+ B cells was not statistically reduced (Figure 3A), B cells from old vWAT had reduced CD69 MFI (Figure 3B), supporting age-associated dysfunction in activation. We also detected a significant increase in the number of CD69+ B cells/g vWAT from old mice (Figure 3C). There were no age-related reductions in CD69 expression on splenic B cells (Figures 3D and 3E), but an increase in cellularity, not proportion, of CD69+ B cells was detected in the peritoneal cavity from young and old mice (Figures 3F and 3G). There was also no difference in the ability of B cells from young and old vWAT or spleen to upregulate CD86, a second marker of activation, after LPS challenge (Figures 3H and S3I). CD69 expression could not be further enhanced by the dose of the LPS challenge (Figure 3I), indicating that additional stimuli do not elevate the activation status of B cells. Moreover, vWAT neutrophils from young and old mice upregulated CD11b to comparable levels during LPS endotoxemia (Figure S3J). We also detected an equal proportion of T cells in the vWAT that upregulated CD69 in response to LPS (Figure S3K) and significantly more CD69-expressing T cells in spleens of old mice (Figure S3L). These data indicate that immune cells from vWAT of young and old mice have comparable ability to increase activation markers post LPS challenge. However, the increased cellularity of old vWAT results in an amplified number of activated CD69+ B cells.
Figure 3. Aging results in dysfunctional vWAT B cell activation during LPS-induced endotoxemia.
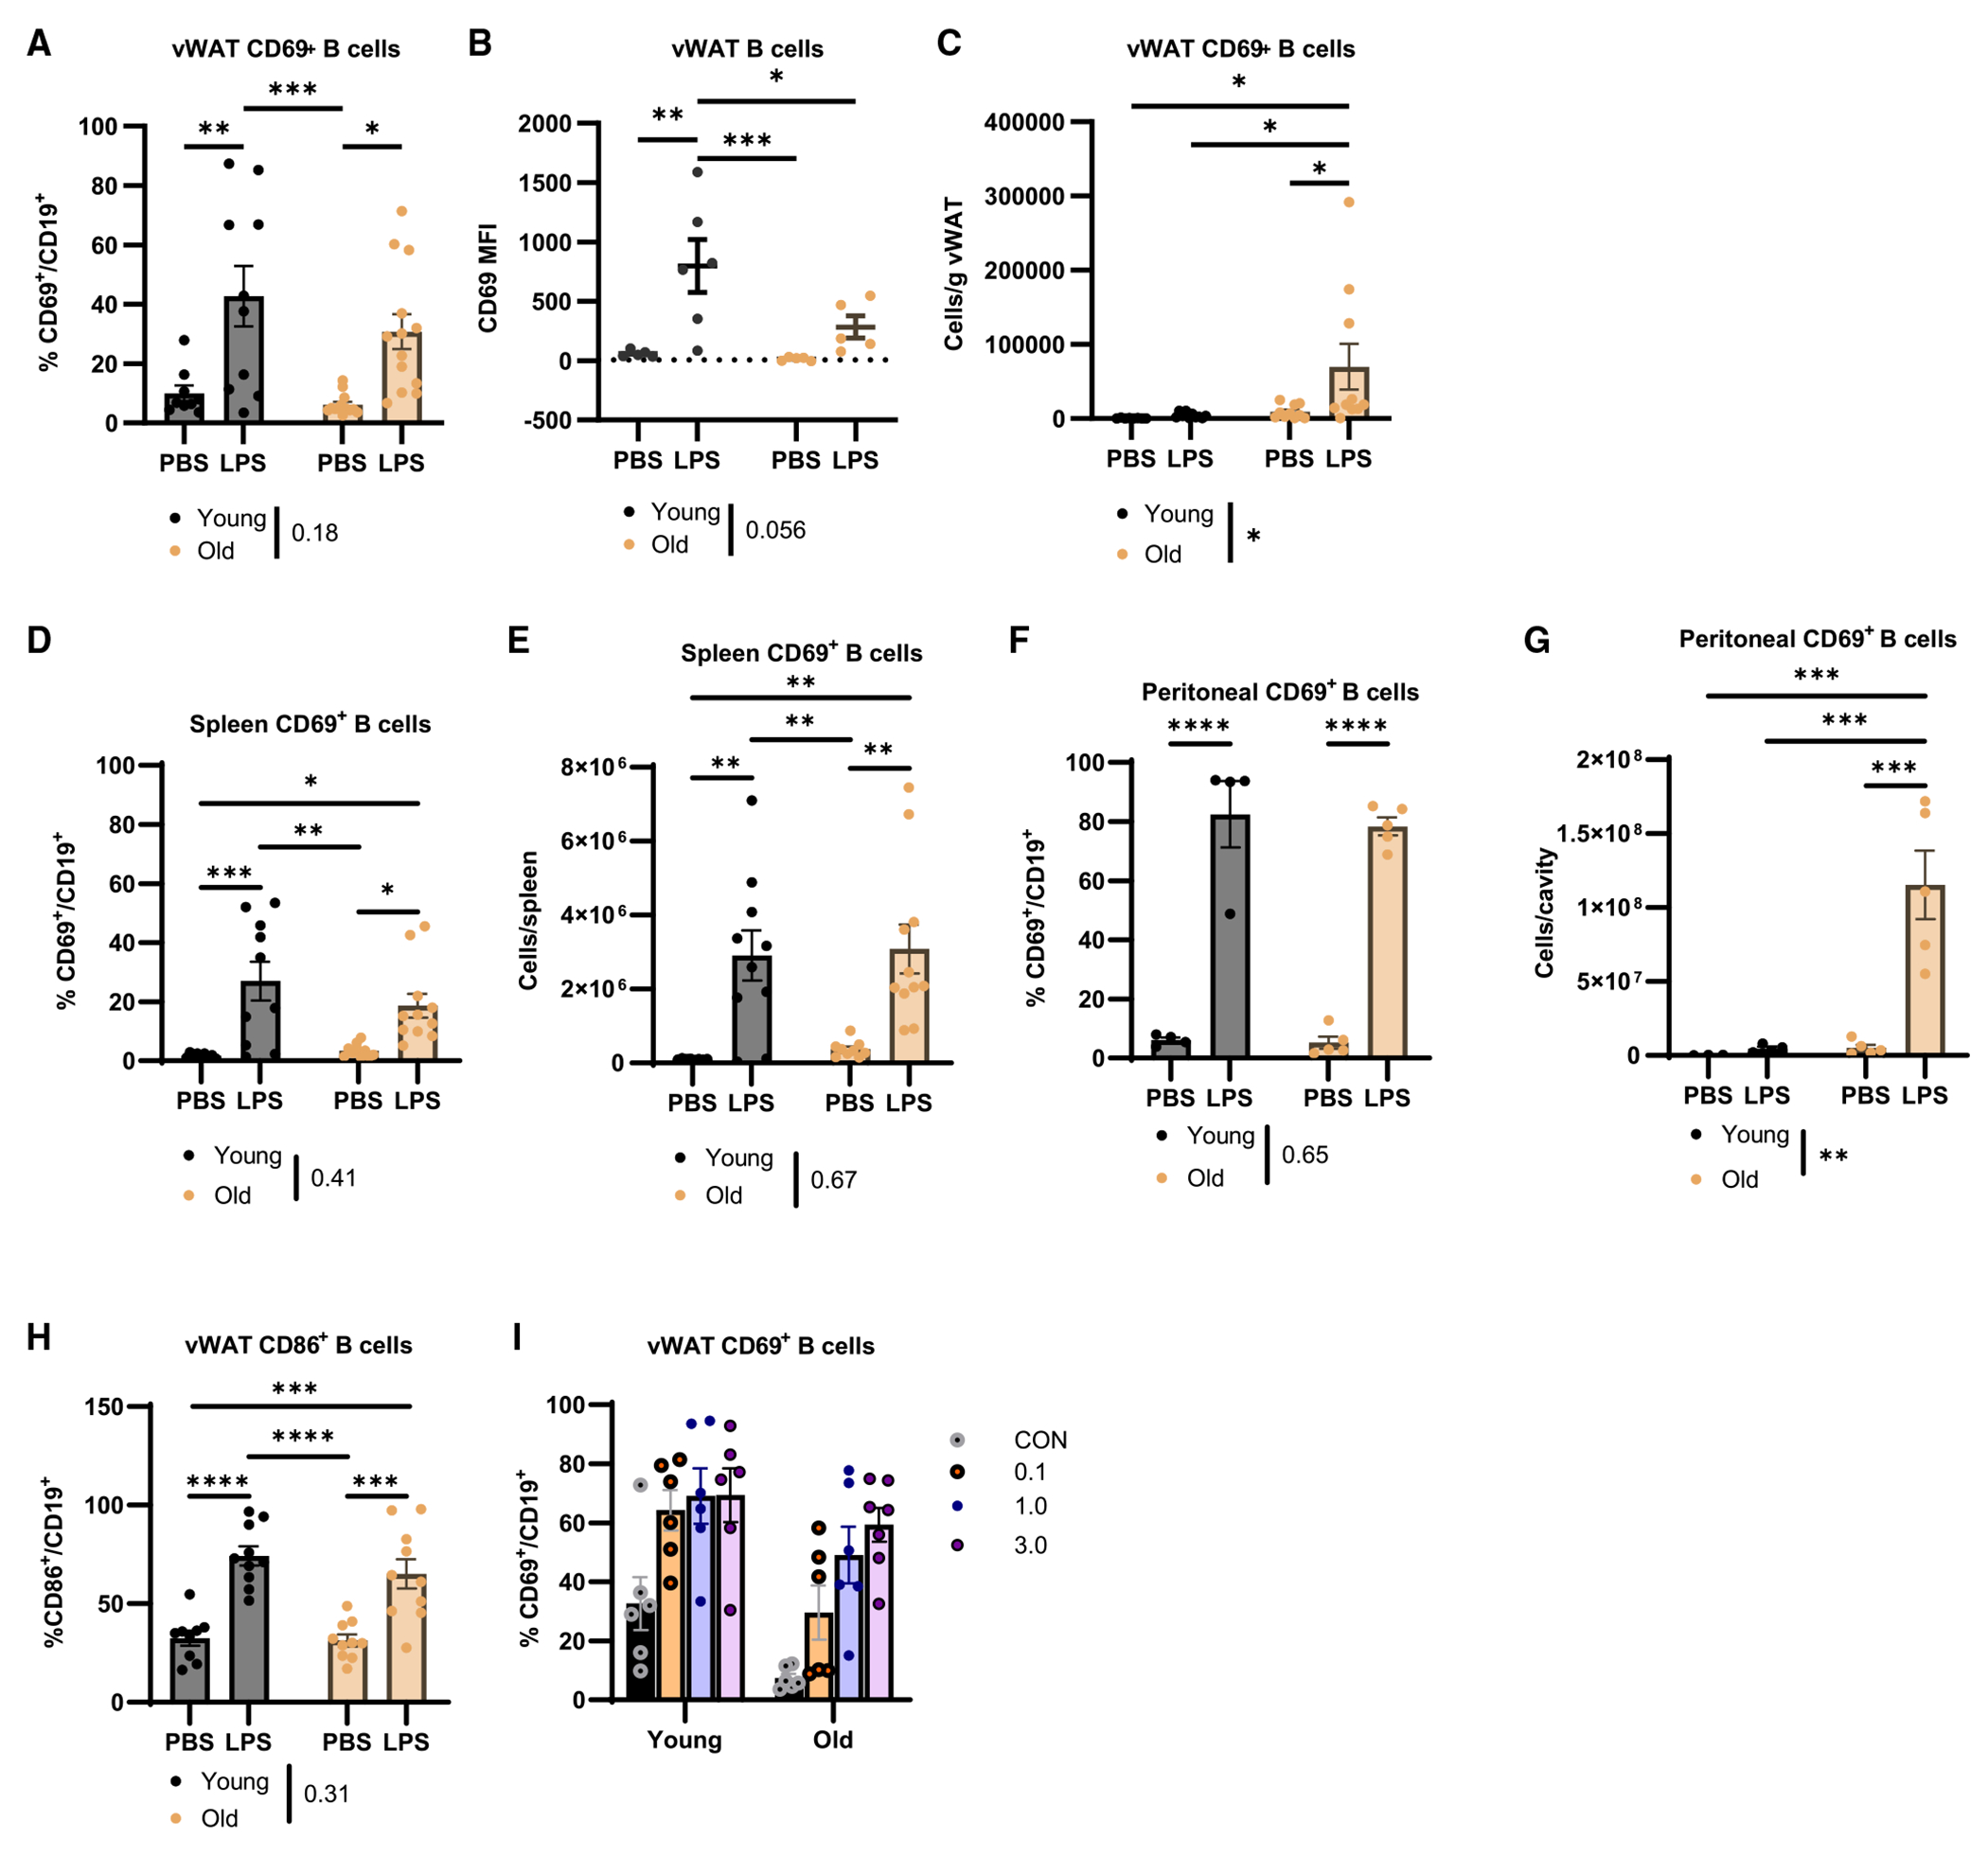
Young (black) and old (yellow) mice were challenged with 0.1 mg/kg LPS for 4 h.
(A) CD69+ B cells as a proportion of total B cells (n = 9–10/group).
(B) CD69 MFI on total B cells (n = 5–6/group).
(C) CD69+ B cell cellularity in vWAT (n = 12–13/group).
(D and E) (D) Proportion and (E) cellularity of CD69+ B cells in spleen (n = 9–10/group).
(F and G) (F) Proportion and (G) cellularity of CD69+ B cells in peritoneal cavity (n = 4–5/group).
(H) Quantification of CD86 expression as a proportion of CD19+ B cells in the vWAT (n = 9–10/group).
(I) Quantification of CD69+ as a proportion of CD19+ B cells in the vWAT of young and old mice that were given increasing doses of LPS (n = 6/group).
Data are expressed as mean ± SEM. Statistical significance was determined by ANOVA with Tukey to adjust for multiple corrections. *p < 0.05, **p < 0.01, ***p < 0.001, ****p < 0.0001. See also Figure S3.
B cell subset activation is equally impaired by aging
CD11b+ B1 B cells can be further differentiated into CD5+ (B1a) and CD5− (B1b) subsets. As the CD19+ cells from vWAT of young and old mice had highly variable upregulation of CD69 that tended to be reduced in the old mice (Figure 3A), we wondered whether differential activation of B cell subsets could explain that variability. We first quantified the B1a, B1b, and B2 cell subsets in vWAT. Very few B1a cells could be detected (Figures S4A and S4B). vWAT B cells in total from young or old mice were composed of 1.7% (±1.2%) B1a, 30.4% (±13.4%) B1b, and 67.6% (±13.8%) B2 B cell subsets (Figure S4C). There were no significant differences when comparing the frequency of B cell subsets in vWAT from young and old mice (Figure S4C), consistent with previous work.14 These results indicate that B1a cells make up a negligible proportion of B cells in vWAT, with B1b and B2 B cells making up the largest proportion.
We examined the ability of B1 and B2 subsets to become activated by measuring CD69 expression. While there was no significant age-associated decline in the proportion of CD69+ cells in either B cell subset (Figure S4D), both B1 and B2 B cells from vWAT from old mice expressed CD69 at a lower fluorescence intensity after LPS challenge (Figure 4A). However, there were 4.2-fold more CD69+ B1 B cells per gram of vWAT from old mice as compared to young mice (Figure 4B). In contrast, the number of CD69+ B2 B cells was comparable to that seen in young mice (Figure 4C). Moreover, there were greater numbers of CD69+ B1 B cells as compared to B2 B cells (note the differences in y axes in Figures 4B and 4C). These data suggest that the number of B1 B cells in old vWAT may be compensating for the reduced intensity of CD69 expression.
Figure 4. vWAT accumulates dysfunctional B1 B cells with reduced sepsis-induced activation during aging.
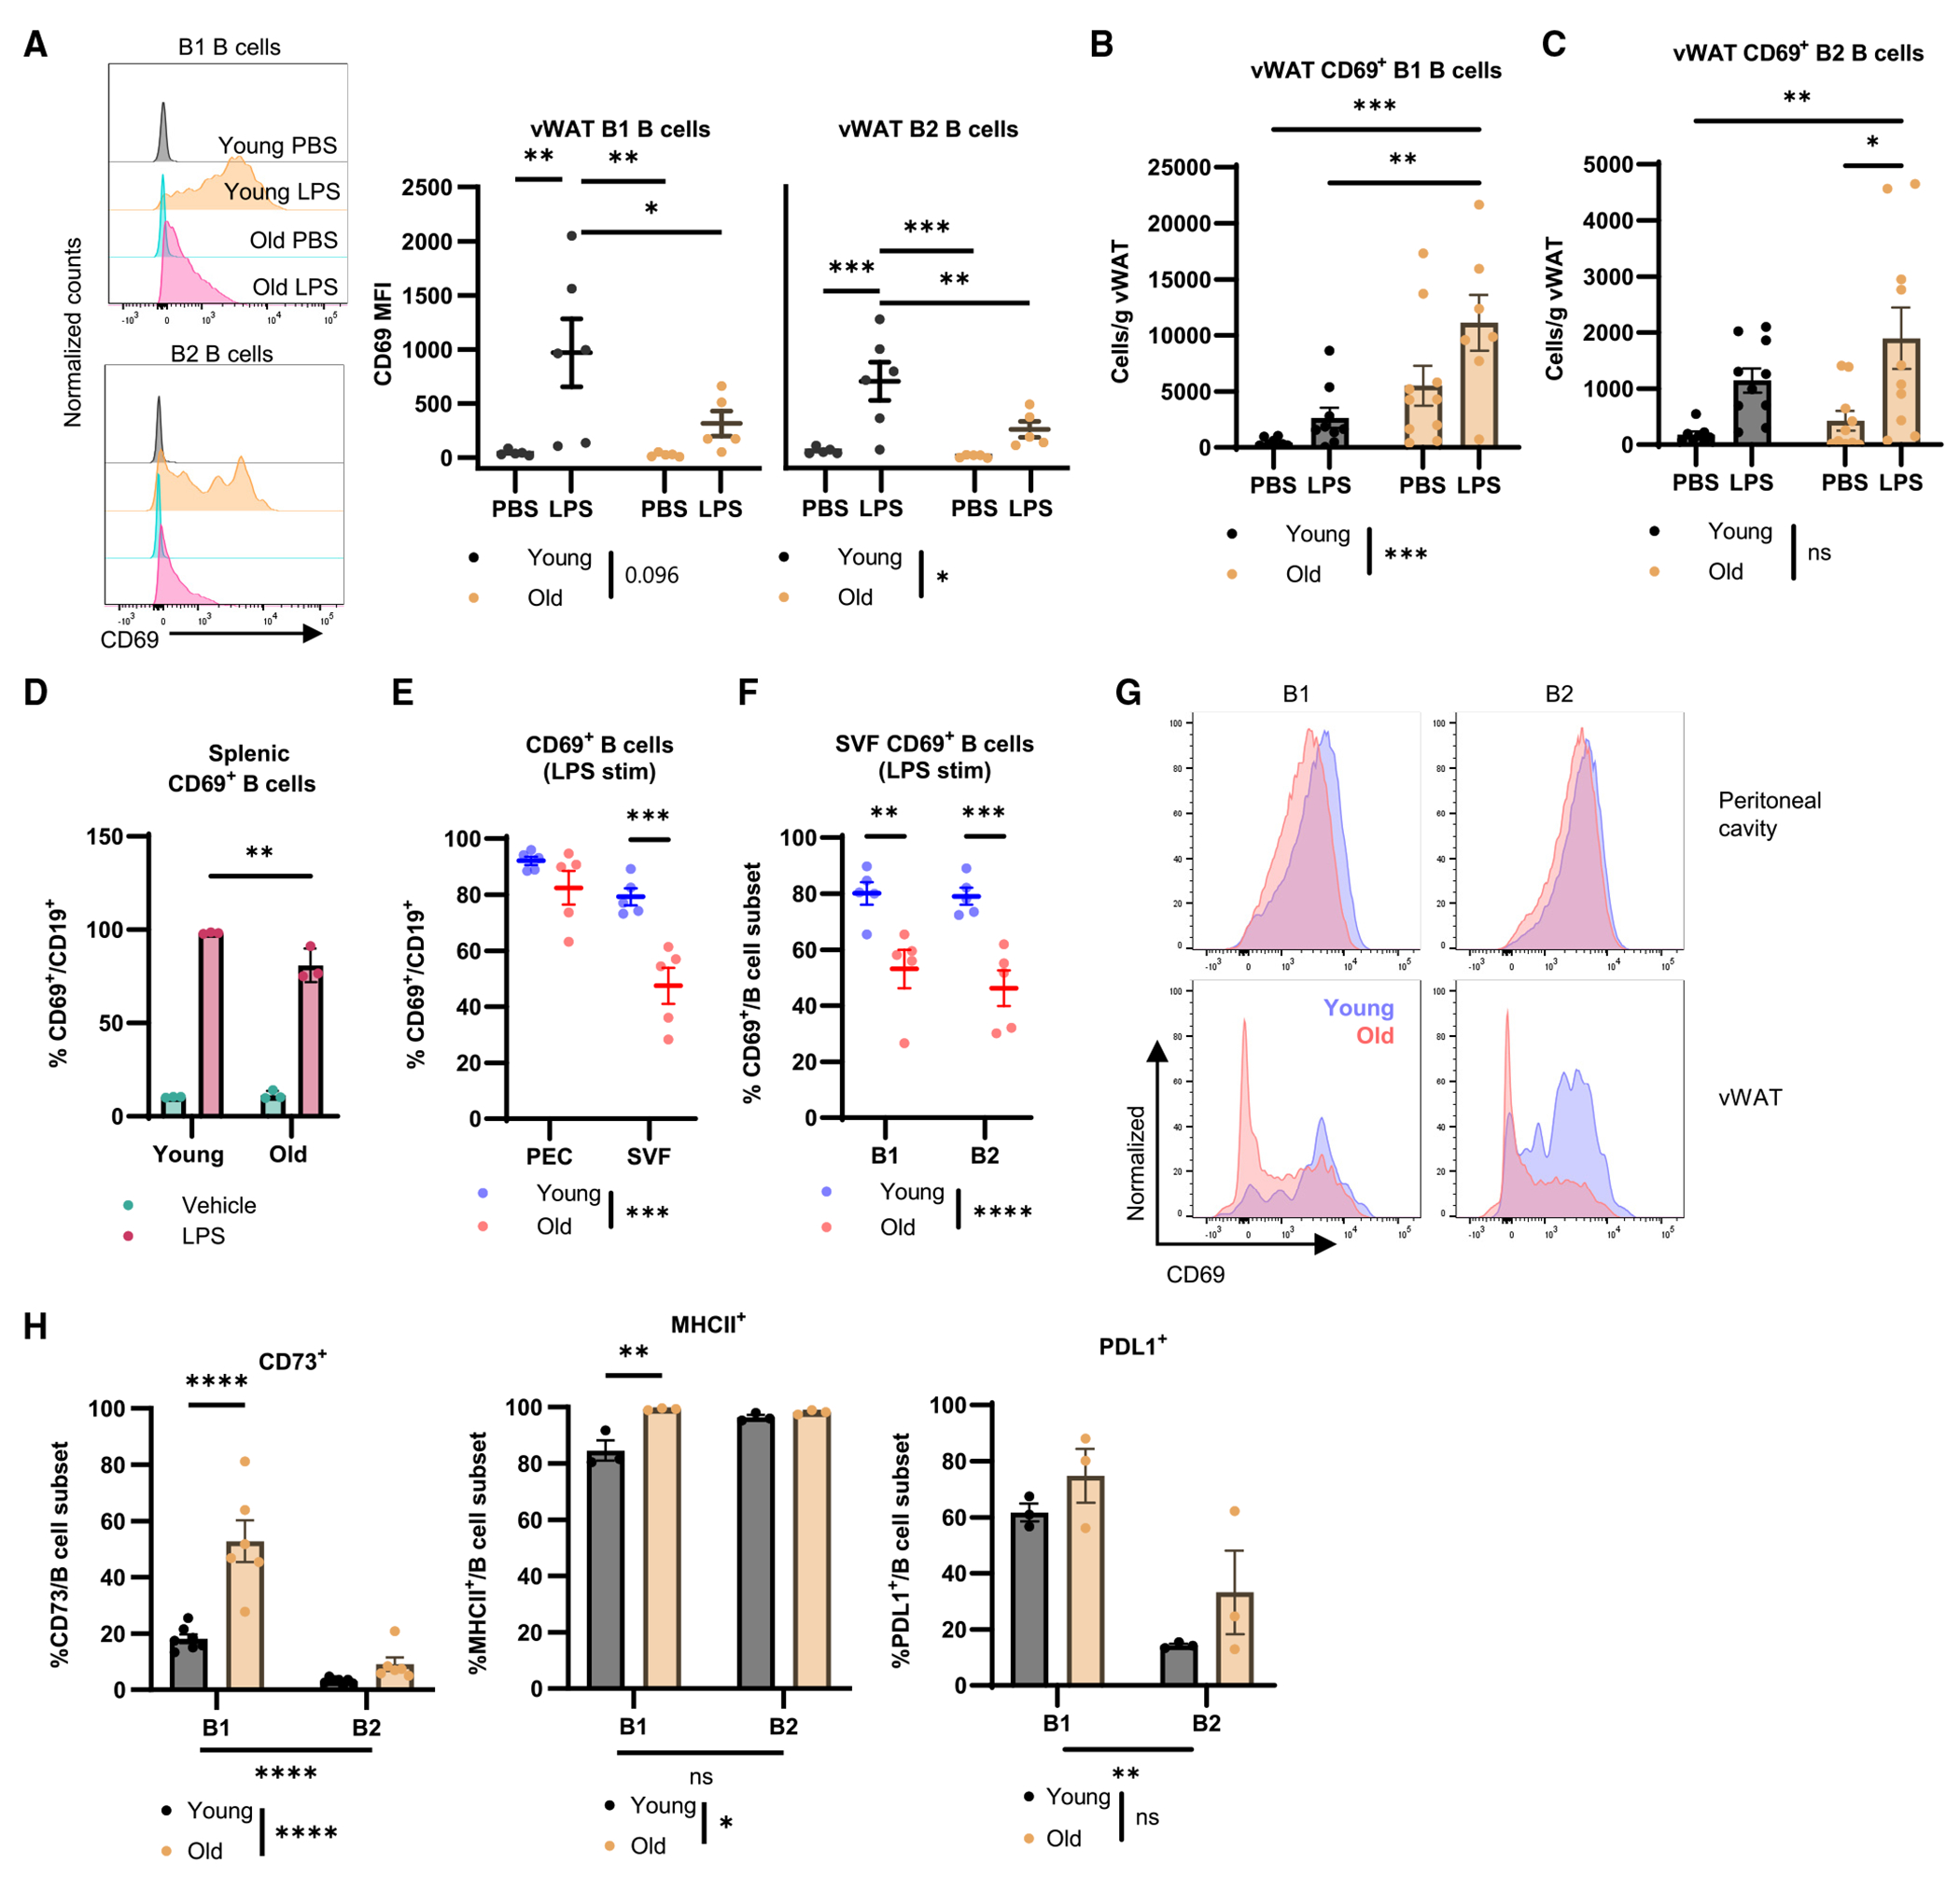
(A–C) Young (black) and old (yellow) mice were challenged with PBS or 0.1 mg/kg LPS for 4 h. (A) Representative histograms of CD69 MFI on vWAT B1 and B2 B cells with quantification (n = 5–6/group). (B) Quantification of cellularity of CD69+ B1 B cells as cells/g vWAT (n = 9–10/group). (C) Quantification of cellularity of CD69+ B2 B cells as cells/g vWAT (n = 9–10/group).
(D) Frequency of CD69+ young (n = 3) or old (n = 3) splenic B cells following in vitro stimulation with vehicle (green) or LPS (red).
(E–G) Young and old mice (n = 5/group) were challenged with 0.1 mg/kg LPS for 2 h before the stromovascular fraction (SVF) of vWAT, and peritoneal exudate was isolated and stimulated with PMA and ionomycin in culture for 4 h. (E) frequency of CD69+ B cells. (F) frequency of CD69+ B cell subsets from the SVF. (G) Representative histograms of B cell subset CD69 MFI.
(H) Quantification of CD73+ (n = 7 young, n = 6 old), MHCII+ (n = 3/group), and PD-L1+ (n = 3/group) B1 and B2 B cell subsets from the vWAT of young and old unchallenged mice.
Data are expressed as mean ± SEM. Statistical significance was determined by ANOVA with Tukey (A–F, H) to adjust for multiple corrections. *p < 0.05, **p < 0.01, ***p < 0.001, ****p < 0.0001; ns, not significant. See also Figures S4 and S5.
Immunosuppressive pathways on B1 B cells from vWAT are upregulated during aging
We turned to in vitro systems and analysis of surface markers to better characterize the impact of aging on the B1 and B2 B cell subsets. Splenocytes from young and old mice were stimulated in vitro with LPS, revealing a small, but significant, age-related reduction in the proportion of B cells that become activated (Figure 4D). We next isolated the peritoneal exudate (PEC) or stromovascular fraction (SVF) from young and old mice challenged with LPS for 2 h and stimulated the cells with phorbol myristate acetate (PMA) and ionomycin. B cells from PEC of young and old mice showed comparable CD69 expression, whereas B cells from SVF of old mice exhibited significantly reduced CD69 expression (Figure 4E). We also detected a significant reduction in CD69 expression in both B1 and B2 B cells from vWAT of old mice as compared to young mice (Figures 4F and 4G). CD73 (an immunosuppressive/memory marker) and major histocompatibility complex class II (MHCII) (antigen presentation) were significantly increased on B1 B cells, but not B2 B cells, from vWAT of old mice (Figures 4H and S4E). There were no changes identified in programmed cell death ligand 1 (PD-L1) expression (Figures 4H and S4E). These data collectively support the notion that the accumulation of B cells during aging includes a population of B1 B cells that exhibit dysfunctional activation and express higher levels of CD73 and MHCII.
B2 B cell depletion is insufficient to restore LPS-stimulated lipolysis in old vWAT
The relationship between vWAT B cells and adipocyte lipolysis is particularly intriguing given the role of B cells in the suppression of canonical lipolysis and insulin signaling in old mice that we previously described.14 To investigate the role of B cells in impaired non-canonical lipolysis, we treated old mice with either anti-CD20 or immunoglobulin G(IgG) isotype control monoclonal antibody (mAb) (100 μg intraperitoneally [i.p.]) before LPS challenge. The total number of B cells was significantly reduced in vWAT (Figure S5A), but we detected a selective depletion of B2 B cells but not B1 B cells in vWAT (Figures S5B and S5C). Treatment with anti-CD20 mAb had no effect on body weight (Figure S5D) or frequency of neutrophils, macrophages, or T cells in vWAT. At 4 h post LPS challenge, there were no differences in HSL phosphorylation (Figure S5E) or serum NEFAs (Figure S5F) between the anti-CD20 and control IgG-treated old mice. These data indicate that short-term depletion of B2 B cells is insufficient to influence lipolysis or inflammation in vWAT from old mice during LPS endotoxemia.
Short-term adoptive transfer of old peritoneal B cells is insufficient to reduce LPS-stimulated lipolysis in young vWAT
We next wanted to test whether B1 cells were necessary for the lipolytic and immune responses during sepsis. As there are no reliable methods for targeted B1 B cell depletion, we utilized short-term adoptive transfer of B cells from young or old mice that has previously been used.14,40,49,50 We transferred B cells isolated from the peritoneal cavity for several reasons: the comparable composition of B1:B2 B cells51; ability of peritoneal B cells to migrate to vWAT35; and insufficient numbers of cells from vWAT for adoptive transfer. We isolated B cells from the peritoneal cavity of young and old mice and transferred a PBS vehicle, 106 young cells, or 106 old cells via i.p. injection into young mice 3 days prior to LPS challenge. We observed no differences in immune cell composition (Figure S5G), body weight (Figure S5H), or B1 or B2 B cell CD69 expression (Figures S5I and S5J) in vWAT from young hosts receiving young or old peritoneal B cells or vehicle. Furthermore, there were no differences in HSL phosphorylation in vWAT (Figure S5K). These results indicate that short-term adoptive transfer of old peritoneal B cells into young hosts does not impact non-canonical lipolysis or B cell activation.
Bulk RNA sequencing of B1 and B2 B cells from old mice reveals differential gene signatures affected by LPS
The differences in phenotypes and LPS-induced activation between B cell subsets in the vWAT led us to wonder which transcriptional signatures varied between B1 (CD19+ CD11b+) and B2 (CD19+ CD11b−) B cells from old vWAT. We challenged old mice with LPS or PBS prior to cell sorting on B1 and B2 B cell populations for bulk RNA sequencing (Figures 5A and S6A). While genes common to all B cell subsets (Ighm, Igkc, CD79a, Ms4a1, CD19, and CD79b) were not different between B1 and B2 B cells, the B1 subset exhibited significantly increased expression of Itgam, the gene that encodes for CD11b (Figures 5B and S6A). Principal component analysis revealed distinct clustering of the B cell subsets (Figure 5C) and unique transcriptional signatures (Figure 5D) under both PBS- and LPS-challenged conditions. Genes associated with inflammation (e.g., Il1b, Slc11a1, Tnf, Il6, and Tnfrsf1a) create a core signature for the B1 B cells as compared to B2 B cells (Figure 5E).
Figure 5. Bulk RNA sequencing of vWAT B1 and B2 B cells from old mice challenged with PBS or LPS.
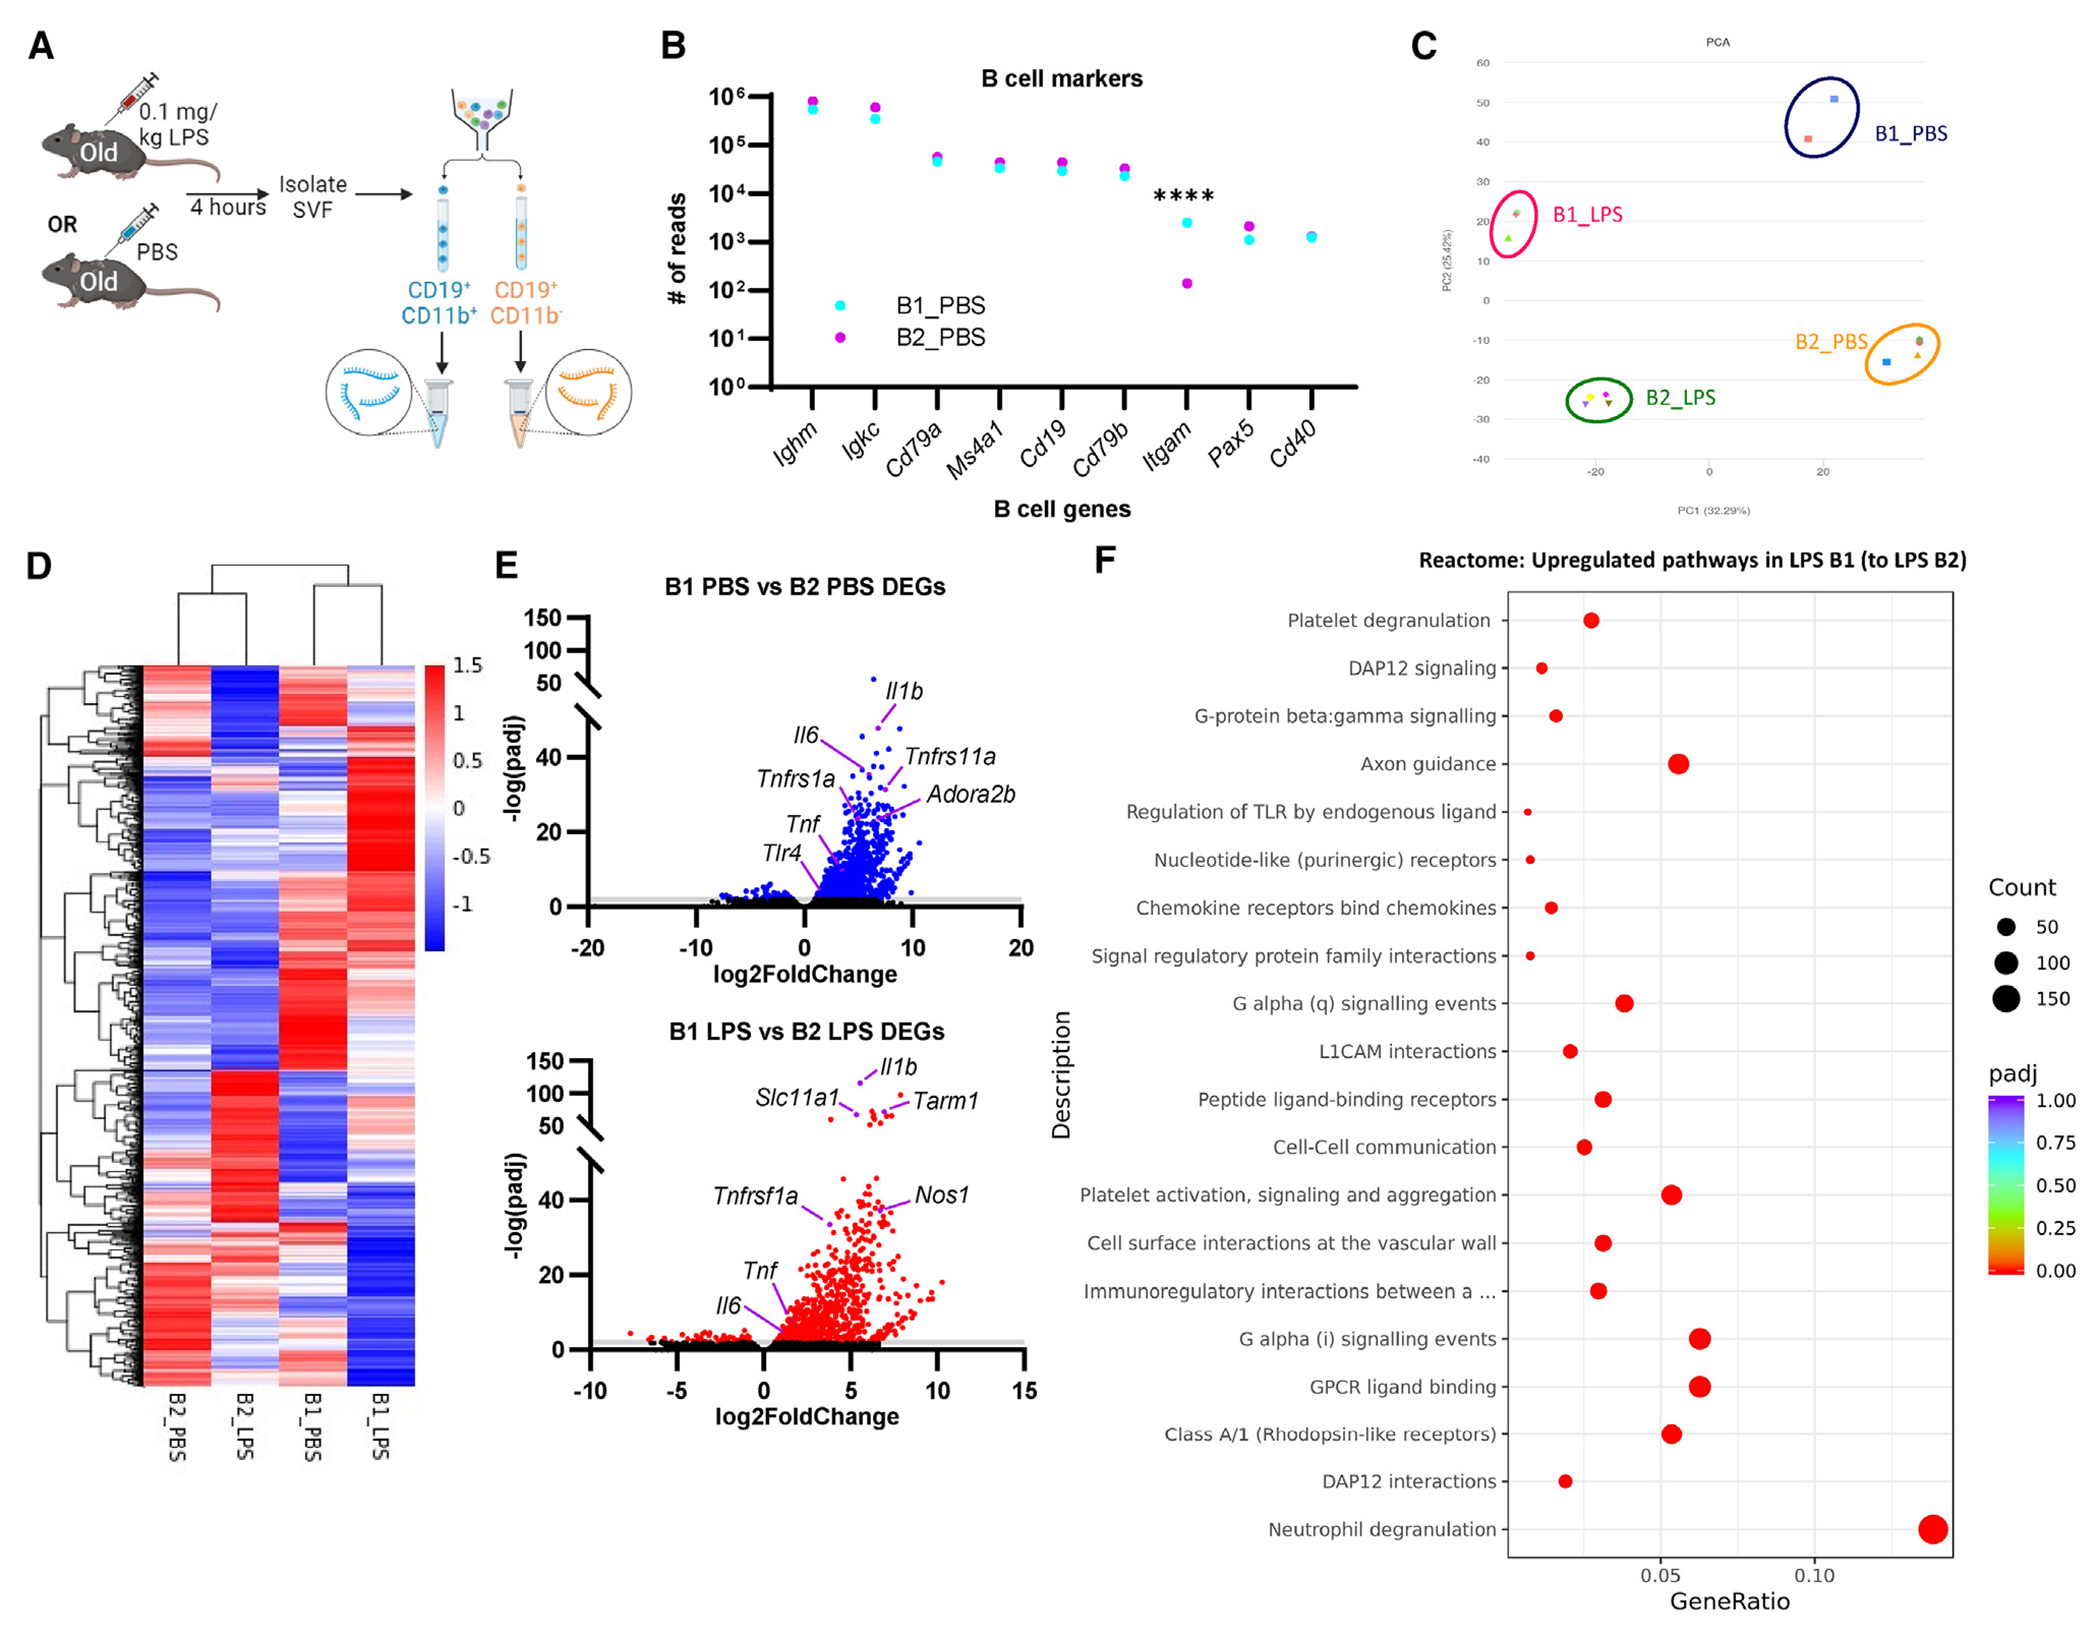
(A) Old mice were challenged with 0.1 mg/kg LPS or PBS for 4 h prior to cell sorting on B1 and B2 B cell populations, RNA isolation, and bulk RNA sequencing (n = 2 B1_PBS, n = 3 B1_LPS, n = 4 B2_PBS, n = 4 B2_LPS).
(B) Gene expression by bulk sequencing of vWAT B1 and B2 B cells from PBS-treated mice. Data are presented as the mean of gene read numbers. Statistical significance was determined by ANOVA with Bonferroni post hoc test to adjust for multiple corrections. ****p < 0.0001.
(C) Principal component (PC) analysis of submitted samples.
(D) Heatmap showing differential gene signatures.
(E) Volcano plot showing differentially expressed genes in B1 B cells compared to B2 B cells under basal (top; blue) and LPS (bottom; red) conditions.
(F) Reactome gene set enrichment analysis showing upregulated pathways in B1 B cells compared to B2 B cells from LPS-treated mice.
See also Figure S6.
Pathway analysis by KEGG (Kyoto Encyclopedia of Genes and Genomes) and gene ontology reveals significant upregulation of inflammatory signaling pathways in B1 B cells compared to B2 B cells after LPS challenge, including cytokine and chemokine binding, NOD-like receptor (NLR), tumor necrosis factor (TNF), and TLR signaling (Figures S6B and S6C). Similarly, pathway analysis by Reactome revealed that B1 B cells from LPS-challenged mice were enriched for multiple pathways including cell-cell signaling, immunoregulatory interactions between immune and non-immune cells, and regulation of TLR by endogenous ligands (Figure 5F). These results suggest the B1 B cells are more likely to interact with non-immune cells, including adipocytes, within the vWAT during bacterial challenge. Reactome analysis also revealed that B1 and B2 B cells both exhibit upregulation of translation and transcription events during LPS challenge (Figures S6C and S6D), consistent with cell activation.30,52 However, B1 B cells also show upregulation of pathways involved in cell division (Figure S6D), suggesting that this population of cells may proliferate at later time points. Overall, these analyses suggest that B1 B cells are enriched for a transcriptional profile exhibiting signs of inflammation and cell-cell communication in vWAT from old mice during sepsis or endotoxemia.
Lifelong deficiency of B cells promotes metabolic function and alters LPS-induced hyperinflammation in old vWAT
B cells promote obesity-related metabolic dysfunction and inflammation.50,53,54 Moreover, aged μMT mice have increased glucose tolerance, reduced frailty, and reduced inflammation in their liver.55 In contrast, young μMT mice have reduced survival during sepsis compared to wild-type (WT) mice, indicating a protective role for young B cells during sepsis.56 To test for an effect of long-term depletion of B cells on lipolysis and immune activation during LPS endotoxemia, we utilized μMT mice.57 These mice do not express membrane-bound IgM (PCR genotyping available in Figure S7A), resulting in the absence of mature B cells in all tissues (Figure 6A).
Figure 6. Lifelong B cell deletion ameliorates inflammation and metabolic dysfunction in old vWAT during endotoxemia.
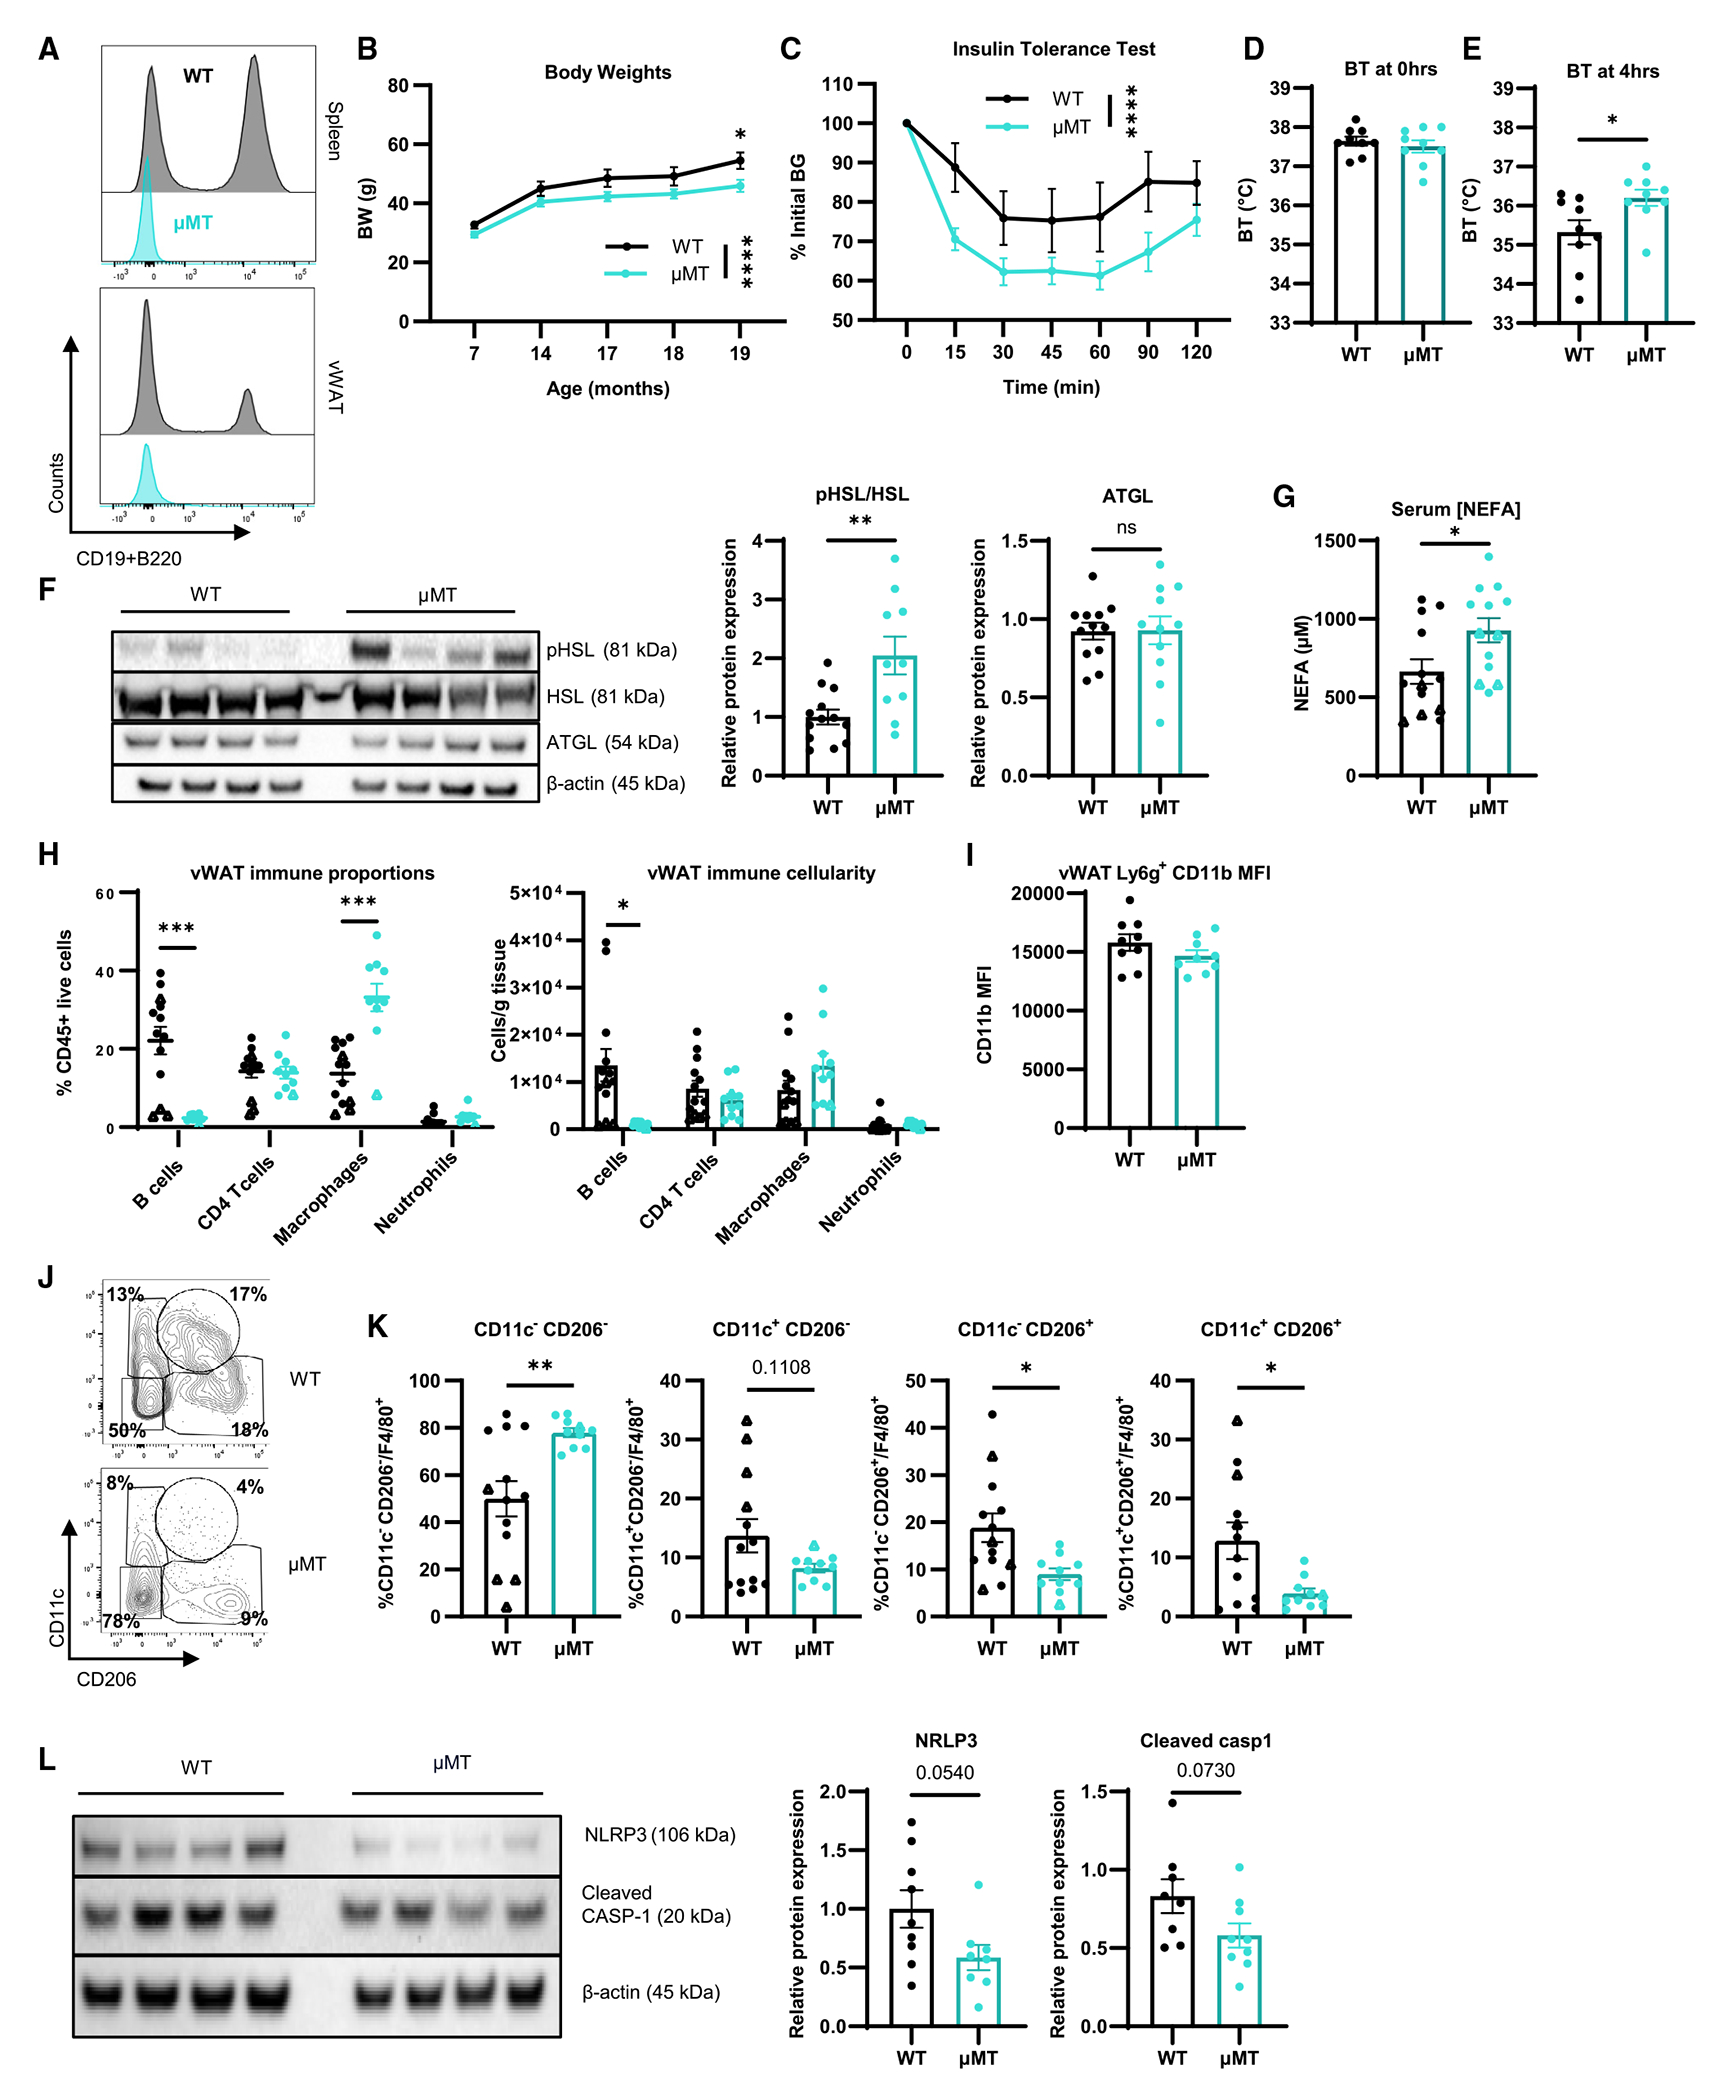
(A) Representative histogram of CD45+ live cells from spleen (top) and vWAT (bottom) from 20-month-old WT and μMT mice.
(B) Body weights of WT (n = 9–10; black) and μMT (n = 9–10; yellow) mice measured throughout lifetime.
(C) Insulin tolerance test of WT (n = 10) and μMT (n = 10) at 20 months old.
(D–L) WT mice (n = 9 females, circles; n = 4 males, triangles) and μMT mice (n = 9 females, circles; n = 1 male, triangles) were treated with 0.1 mg/kg LPS. Core BT measured at hours (D) 0 and (E) 4 of LPS challenge. (F) Western blot of pHSL, HSL, ATGL, and β-actin from vWAT with quantification. (G) Serum NEFAs. (H) Proportion (top) and cellularity as cells/g vWAT (bottom) of immune cells in vWAT. (I) MFI of CD11b on neutrophils from vWAT. (J) Representative gating of CD11c−CD206−, CD11c+CD206−, CD11c−CD206+, and CD11c+CD206+ macrophages. (K) Quantification of CD11c−CD206−, CD11c+CD206−, CD11c−CD206+, and CD11c+CD206+ cells (left to right) as a proportion of F4/80+ macrophages. (L) Western blot of NLRP3, cleaved caspase-1, and β-actin from vWAT with quantification.
Data are expressed as mean ± SEM. Statistical significance was determined by unpaired t test (D–G, I–L), multiple t test with Holm-Sidak correction (H), or ANOVA with Sidak test (B and C) to adjust for multiple corrections. *p < 0.05, **p < 0.01, ***p < 0.001, ****p < 0.0001; ns, not significant. See also Figure S7.
We aged WT and μMT mice and detected a significant reduction in body weight in μMT mice at 19 months of age (Figure 6B). When female old WT and μMT were challenged with intraperitoneal insulin, we detected a significant reduction in blood glucose (Figure 6C) and reduction in the area under the curve (Figure S7B) in μMT mice. These results are consistent with the notion that B cell deficiency seen in the μMT mice results in healthier metabolic aging. At 20 months of age, we challenged WT and μMT mice with LPS. While there were no differences in core BT prior to challenge (Figure 6D), μMT mice exhibited significantly increased BT after 4 h compared to WT controls (Figure 6E), although they still displayed a reduction in BT over the course of the LPS challenge (Figure S7C). We also detected a significant increase in HSL phosphorylation in vWAT (Figure 6F) and serum NEFAs (Figure 6G) from old μMT. These results indicate that lifelong deficiency of B cells results in improved adipocyte metabolism that supports an induction of non-canonical lipolysis and higher BT following LPS challenge.
We next evaluated the immune composition of the vWAT from μMT and WT mice. In addition to the absence of B cells in μMT mice, we also detected an increase in the proportion, but not number, of macrophages (Figure 6H). There were no differences in CD11b expression on neutrophils from vWAT of WT and μMT mice (Figure 6I). There was no significant difference in ll1b, but Il10 and Tnf mRNA were reduced in the vWAT of μMT mice (Figure S7D).
Macrophages from vWAT regulate multiple aspects of tissue growth, metabolism, and dampening inflammation.3,58–62 As there was increased frequency of macrophages, we characterized the phenotype of macrophages using CD11c and CD206, markers commonly used to characterize macrophages (Figure 6J). We detected reductions in the CD206+CD11c+ and CD11c−CD206+ subpopulations and an increase in the CD11c−CD206− subpopulation in μMT mice (Figures 6J and 6K). CD206+ and CD206+CD11c+ adipose tissue macrophages are reported to promote tissue homeostasis or have a pro-inflammatory phenotype under pathophysiological conditions.60,61,63 To further investigate macrophage-derived inflammation, we examined NLRP3 and caspase-1 (protein), which are required for the processing of pro-interleukin-1β (IL-1β) into active IL-1β. We detected a reduction in the NLRP3 protein and a slight decrease in cleaved caspase-1 in the vWAT of μMT mice (Figure 6L). Combined, these data suggest that the vWAT of old μMT mice has a reduction in the NLRP3 inflammasome expressing pro-inflammatory macrophages, thus reducing the production of IL-1β. Overall, these results are consistent with a model in which vWAT B cells promote an inflammatory macrophage phenotype, and disruption of the B cell-macrophage signaling axis contributes to improved adipocyte function.
DISCUSSION
The complex relationship between immune cells and metabolism in vWAT is disturbed during aging, resulting in chronic inflammation, lymphocyte infiltration, and metabolic dysfunction.3,14,62,64,65 In this study, we investigated the effect of age on adipocyte metabolism and immune cell activation during systemic bacterial infection. We report that inflammation-stimulated non-canonical lipolysis declines with age. We identified an accumulation of immunosenescent B1 B cells in vWAT that have dysfunctional activation. Old μMT mice have increased LPS-stimulated lipolysis and a reduction in the pro-inflammatory macrophage population in their vWAT. These data indicate that age-related accumulation of B cells promotes a pro-inflammatory macrophage phenotype including the upregulation of NLRP3 inflammasome activation, supporting a model in which B cells indirectly suppress non-canonical lipolysis by promoting macrophage inflammation.
Age- or obesity-related inflammation, including activation of the NLRP3 inflammasome, can suppress catecholamine-stimulated lipolysis via the upregulation of catecholamine transport and degradation enzymes.3,58 Catecholamines activate lipolysis through β3AR receptors; therefore, this specific mechanism is unlikely to contribute to the regulation of inflammation-stimulated lipolysis that occurs via TLRs or cytokine receptor ligation.9 We found that simultaneous treatment with a potent β3AR agonist could overcome the defects in the non-canonical lipolysis signaling pathway in old vWAT. Of note, CL316243 treatment resulted in further elevation of Il6 mRNA expression in white and brown adipose depots (not shown), consistent with prior work66 and in line with current clinical recommendations regarding β3AR agonists.67 We speculate that the immunosenescent phenotype of vWAT immune cells, including B cells, results in the suppression of phosphorylated HSL following LPS endotoxemia or septic challenge in old hosts.
ATGL, a critical adipocyte lipase,68 is required for the regulation of inflammation during bacterial challenge in young mice, and this effect can be overcome by treatment with fenofibrate, a peroxisome proliferator-activated receptor α (PPARα) agonist.18 Consistently, an in vitro model of aged adipocytes reveals decreased ATGL expression, and reduced NEFA release is associated with increased cytokines.69 This suggests an environment where impaired non-canonical lipolysis reduces the bioavailability of fatty acids that may act as ligands for PPARα activity or are directly oxidized to support cellular metabolism,19,70 thus potentially contributing the amplified inflammation and failure to resolve the immune response. We found that pHSL was increased only at early time points, correlating with the increase in inflammatory cytokine gene expression in young mice and suggesting that this could be a tightly regulated pathway. We showed that LPS-stimulated cytokine gene expression in old vWAT increased in a dose-dependent manner but failed to induce lipolytic responses at any dose, suggesting that the dose of pathogen is not relevant to the induction of lipolysis. Our results do not fully exclude lipolytic action from other tissues or fat depots, although we did not detect changes to pHSL in sWAT or liver from young and old mice challenged with LPS for 4 h, suggesting that lipolysis is primarily occurring in vWAT during endotoxemia.
Lipid metabolism is a critical component of the septic response.18 Thus, suppression of acutely stimulated lipolysis in old mice during sepsis may support the amplified inflammatory responses seen here. Alterations to systemic lipid profiles are a characteristic of sepsis at longer time points. These alterations include hypocholesterolemia, which is predictive of non-survival and alterations in circulating fatty acid composition.71–74 Moreover, normalization of the lipid profile by insulin therapy leads to reductions in serum triglycerides and increases in high- and low-density lipoprotein cholesterol, which reduce mortality in septic patients.75 Delineating the acute and chronic pathways involved in supporting patient outcome, and in the context of patient age, may support the identification of new therapeutics.
In adipose tissue from obese or aged individuals, B2 B cells promote inflammation and insulin resistance by secreting IgG and TNF-α,40,50,76–78 whereas B1 B cells secrete anti-inflammatory factors including IL-10 and natural antibodies to promote insulin sensitivity.79 IL-10-producing B1a B cells protect against mortality during sepsis,49 and B1b B cells support vaccination-induced antibody production and generate memory to bacterial polysaccharides.80–82 This literature suggests that B1 B cells are critical to immune surveillance during metabolic and pathogenic challenge. We find impaired upregulation of CD69 on B1 and B2 B cells from vWAT of old mice but higher numbers of CD69+ B1 B cells. B cells in gut-derived intestinal lymphoid follicles of old mice have increased markers of senescence, including p16 and γH2AX, but an elevated proliferative response to LPS.83 Our data reveal increased expression of MHCII and CD73 on B1, but not B2, vWAT B cells, and distinct inflammatory transcriptional signatures under PBS and LPS conditions. These results provide additional insight into the heterogeneity of the B cell subsets that have not been previously described. Given the increased cellularity of B cells in vWAT, these B1 B cells likely contribute to pro-inflammatory cytokine production during LPS endotoxemia and sepsis.
Acute depletion of B cells with anti-CD20 mAb increases fasting-stimulated lipolysis.14 Moreover, adoptive transfer of age-associated B cells into a young host reduced fasting-stimulated lipolysis.14 In our studies, the anti-CD20 mAb selectively depleted B2 B cells without impacting inflammation-induced lipolysis. In obese male mice, B2 B cells express more cytokines and pathogenic antibodies as compared to lean male mice.76–78 Our data build on this finding, whereby we show that B1 B cells, but not B2 B cells, from vWAT of old female mice exhibit a transcriptional profile composed of inflammatory pathways and genes. Adoptive transfer of old peritoneal B cells failed to alter the LPS-induced increase of pHSL, indicating that tissue specificity of these cells is important. In addition to the macrophage-mediated mechanism described here, immunosenescent vWAT B1 B cells may have the potential to directly suppress LPS-stimulated lipolysis through their production of suppressive factors. For example, IL-10, which is upregulated in the vWAT of old mice during LPS challenge and can be produced by B1 B cells,51,84 suppresses adipose thermogenesis in mice,85 suggesting that it could also be involved in the lipolysis pathway. It is possible that immunosuppressive pathways are upregulated to compensate for the hyperinflammatory environment present in the microenvironment of old vWAT and inadvertently suppress adipocyte lipolysis.
Lifelong or chronic deficiency of B cells results in increased naive T cell populations, reduced PD-1 expression, and a reduction in inte4rferon-γ production in both CD4+ and CD8+ T cells, indicating that B cells promote T cell aging.55 Our data point toward lifelong deficiency of B cells as a necessary factor to improve metabolic phenotype, including reduced body weight, improved insulin sensitivity, reduced inflammation, and increased vWAT lipolysis post LPS endotoxemia. There was a reduction in CD11c+CD206+ macrophages and the NLRP3 protein that is consistent with a reduction in pro-inflammatory macrophages in vWAT from old μMT mice. How B cells regulate macrophage phenotype and function in vWAT requires further investigation. We expect increased survival during sepsis in old μMT mice compared to old WT mice. This finding would be in contrast to results from young mice56 but supports a pro-inflammatory and immunosenescent role of B cells during aging. Taken together, B cells support the development of inflammaging, whereby deletion of B cells results in improved metabolic parameters and responses to endotoxemia that are seen in old mice.
Limitations of the study
A limitation to the interpretations of the bulk sequencing data presented is the absence of young vWAT B1 and B2 B cell subsets, which could not be analyzed because of technical limitations. We also have a lack of available methods to test for a specific role of interacting cell types in vWAT–B1 B cells, macrophages, and adipocytes–and an inability to test for sex-specific differences in the septic response in the vWAT of μMT mice. Furthermore, all adoptive transfer, depletion, and genetic ablation models are systemic, and any effect on non-canonical lipolysis may be the result of systemic B cell alterations.
STAR★METHODS
RESOURCE AVAILABILITY
Lead contact
Further information and requests for resources and reagents should be directed to and will be fulfilled by the lead contact, Christina Camell (ccamell@umn.edu).
Materials availability
This study did not generate new unique reagents.
Data and code availability
Bulk RNA-seq data have been deposited at GEO and are publicly available as of the date of publication. Accession numbers are listed in the key resources table. Raw western blot images from figures were deposited on Mendeley at https://doi.org/10.17632/nvv9bc7x7k.1.
This paper does not report original code.
Any additional information required to reanalyze the data reported in this paper is available from the lead contact upon request.
KEY RESOURCES TABLE
| REAGENT or RESOURCE | SOURCE | IDENTIFIER |
|---|---|---|
| Antibodies | ||
| ATGL (30A4) Rabbit mAb | Cell Signaling | Cat#2439S; RRID:AB_2167953 |
| Cleaved Caspase-1 (Asp296) (E2G2I) Rabbit mAb | Cell Signaling | Cat#89332S; RRID:AB_2923067 |
| Phospho-HSL (Ser660) Polyclonal Antibody | Invitrogen | Cat#PA5-110131; RRID:AB_2855542 |
| NLRP3 (D4D8T) Rabbit mAb | Cell Signaling | Cat#15101S; RRID:AB_2722591 |
| β-Actin Antibody | Cell Signaling | Cat#4967L; RRID:AB_330288 |
| aCD20 Mouse mAb clone 5D2 | Genentech | MTA agreement OR-217814 |
| InViVoPlus mouse IgG2a isotype control clone C1.18.4 | BioXCell | Cat#BP0085; RRID:AB_1107771 |
| See Table S1 for a list of antibodies and fluorophores used for flow cytometry and FACS. | N/A | |
| Bacterial and virus strains | ||
| Lipopolysaccharides from Escherichia coli O111:B4 | Millipore Sigma | Cat#L3024 |
| Critical commercial assays | ||
| Fujifilm Healthcare Americas Corp Hr Series Nefa-Hr (2) Color Reagent A | Fisher Scientific | NC9517308 |
| Fujifilm Healthcare Americas Corp Hr Series Nefa-Hr (2) Solvent A | Fisher Scientific | NC9517309 |
| Fujifilm Healthcare Americas Corp Hr Series Nefa-Hr (2) Color Reagent B | Fisher Scientific | NC9517310 |
| Fujifilm Healthcare Americas Corp Hr Series Nefa-Hr (2) Solvent B | Fisher Scientific | NC9517311 |
| Deposited data | ||
| Raw western blots | Mendeley Data | https://doi.org/10.17632/nvv9bc7x7k.1 |
| Bulk RNA sequencing of PBS and LPS treated vWAT B1 and B2 B cells | GEO DataSets | GSE250371 |
| Experimental models: Organisms/strains | ||
| Mouse: WT; C57BL/6J | National Institute on Aging or Jackson Labs or bred in UMN colony | RRID:IMSR_JAX:000664 |
| Mouse: CD45.1; B6.SJL-Ptprca Pepcb/BoyJ | Jackson Labs or bred in UMN colony | RRID:IMSR_JAX:002014 |
| Mouse: B6.129S2-Ighmtm1Cgn/J | Dr. Xavier Revelo, University of Minnesota | RRID:IMSR_JAX:002288 |
| Oligonucleotides | ||
| Il6 | Thermofisher | Forward:CACAGAGGATACCACATCCCAACA Reverse:TCCACGATTTCCCAGAGAACA |
| Il10 | Thermofisher | Forward:GGTTGCCAAGCCTTATCGGA Reverse:ACCTGCTCCACTGCCTTGCT |
| Tnf | Thermofisher | Forward:CAACCAACAAGTGATATTCTCCATG Reverse:GATCCACACTCTCCAGCTGCA |
| Il1b | Thermofisher | Forward:GGTGCCTATGTCTCAGCCTCTT Reverse:CGATCACCCCGAAGTTCAGTA |
| Software and algorithms | ||
| Prism v10.1.2 | Graphpad | N/A |
| FlowJo v10.9.0 | TreeStar | N/A |
| featureCounts v1.5.0-p3 | Liao et al.86 | N/A |
| Hisat2 v2.0.5 | Zhang et al.87 | N/A |
| clusterProfiler | Wu et al.88 | N/A |
EXPERIMENTAL MODEL AND STUDY PARTICIPANT DETAILS
Animal care
All mice were housed in specific pathogen-free facilities in ventilated cage racks that deliver HEPA-filtered air to each cage with free access to sterile water at the University of Minnesota. Sentinel mice in our animal rooms were negative for currently tested standard murine pathogens at various times while the studies were performed. Female C57Bl6/J (wild-type), female CD45.1 C57Bl6/J, and male and female μMT mice on a C57Bl6/J background were bred from our colony, purchased from Jackson Laboratories or received from the National Institute of Aging Rodent colony. Young mice are defined as 3-6 months old and old mice are defined as 18-22 months old in all experiments. All experiments and animal use were conducted in compliance with the National Institute of Health Guide for the Care and Use of Laboratory Animals and were approved by the Institutional Animal Care and Use Committee at the University of Minnesota. Animals were fed with chow diet.
Experimental design
Blinding of investigators was not possible during experiments, due to obvious differences in phenotype by age or LPS treatment. Littermate controls were used for transgenic mouse experiments while young controls for old WT mice obtained from the NIA were bred or purchased from Jackson Laboratories. Aged mice with extreme frailty, tumor, or other age-related pathology were excluded from the study. This amounted to less than 5% of all aged mice.
METHOD DETAILS
Mouse models
Cecal slurry-induced polymicrobial sepsis: Cecal material was isolated from the ceca of either old or young donor mice. Slurry was prepared by suspending the cecal material in PBS 15% v/v glycerol at 100 mg/mL. For young to old comparisons, an equal mixture of young and old slurry was prepared. The slurry was then filtered through a series of sterile mesh strainers (810 μm, 210 μm, 100 μm) and stored at −80°C. Mice were injected with either PBS 15% v/v glycerol (control), 1.3 mg/g, 0.975 mg/g, or 0.65 mg/g of the cecal slurry via ip injection using a 23-guage needle. Mice were treated for 4 hours, with body temperature monitoring, before euthanasia by exsanguination and cervical dislocation under isoflurane anesthesia.
Lipopolysaccharide (LPS)-induced endotoxemic challenge: Young (3-6 mo) and old (18-22 mo) mice were given IP injection of sterile phosphate buffered solution (PBS; Corning) or LPS (E. coli O111-B4; Sigma, L3024) diluted in sterile PBS for 2, 4, or 16 hours. Body temperature was taken via rectal thermometer prior to IP injection and again prior to sacrifice. Mice were euthanized by exsanguination and cervical dislocation under isoflurane anesthesia.
CL316,243: Old mice received boluses of 0.5 mg/kg of CL316,243 or PBS (vehicle) at −0.5 and 4 hours by i.p. injection during 8-hour LPS challenge.
For insulin tolerance test (ITT): Mice were fasted for 4 hours prior to ITT. Insulin was given by i.p. injection (0.8U/kg) and blood glucose levels were measured by glucometer.
B cell depletion: Anti-CD20 depleting mAb (Genetech, clone 5D2) or isotype control (BioXCell, BP0085, clone C1.18.4) was administered in doses of 100μg per mouse 3 and 1 weeks before sacrifice and harvest.
Sterile cell isolation and adoptive transfer: Peritoneal cells from young or old mice were isolated using sterile techniques. Isolated cells from the same groups were combined and red blood cells were lysed using ACK lysis buffer for 2 mins before quenching with RPMI with 10% FBS. B cells were isolated using the EasySep Mouse Pan-B Cell Isolation Kit (StemCell Cat# 19844) according to recommended protocols. 106 cells were injected into host mice using a 23-gauge needle.
Adipose digestion
Visceral adipose tissue from the perigonadal depot was harvested at sacrifice and weighed. Tissue was mechanically digested using the gentleMACS octo-dissociator and then enzymatically digested in 0.1% collagenase I (Worthington Biochemicals) in Hanks Buffered Salt Solution (Life Technologies, Inc.) for 30 min at 37°, vortexing every 10 min. Tissue from control and experimental groups was digested and stained on the same day to eliminate minor procedure differences. The stromovascular fraction (SVF) was pelleted by centrifugation at 1500rpm for 5min, then washed and filtered. Red blood cells are lysed using ACK lysis buffer for 2 min before quenching with RPMI with 10% FBS.
Staining for flow cytometry
Isolated cells were incubated with Ghost Dye Red 780 Viability Dye (TONBO biosciences) for 30 minutes on ice, in the dark, then washed and stained with FcBlock and surface antibodies for 45 minutes to 12 hours at 4°C in the dark. Antibodies used are documented in Table S1. For intracellular staining of cytokines, cells were treated with GolgiStop (containing monensin) for 4 hours and fixed for 20 minutes using fixation/permeabilization solution (BD, 554715) prior to intracellular staining for 45 minutes. Analysis was performed on a BD Fortessa X-30 and BD FACSSymphony A3 cytometers and using FlowJo v10; gating schemes are shown in relevant supplementary figures. Antibodies used can be found in Table S1. For fluorescence associated cell sorting: 15,000 live CD45+ CD19+ CD11b+ and live CD45+ CD19+ CD11b− were sorted on a BD FACS Aria II into RPMI with 40% FBS. Cells were pelleted and resuspended in RNA lysis buffer (Invitrogen; 46-6001) for RNA isolation. Adipose B cells were pooled from 2 mice per sample to account for biological variability.
Cell culture
Splenocytes, peritoneal cells, or stromovascular fraction cells were isolated and processed as previously described using sterile techniques. 106 cells were plated in 12-well plates in sterile RPMI supplemented with 10% FBS, 1% antibiotic-antimycotic, 2mM L-glutamate, and 10 ng/mL IL-4. Cells were stimulated with 25 ng/mL PMA and 1 μg/mL ionomycin or 1 μg/mL LPS for 4 hours before harvest and staining.
Western blotting
Whole vWAT tissue lysates were prepared from flash frozen tissues by homogenization in RIPA with phosphatase and protease inhibitors (Sigma-Aldrich; P0044, P5726, P8340). Lysates were left on ice for one hour, vortexing every 15 min. Lysates were then spun twice at 14,000 rpm for 10 minutes at 4°C, and the pellet and lipids were discarded after each spin. Total protein concentration was measured using a Bradford Assay (Fisher Sci; 23246) and protein amounts are standardized (15μg) for gel loading. Loading Buffer and Reducing Agent (Thermo Fisher; B0008, B0004) was added to samples, and protein was separated across a 4-12% Bis-Tris SDS Gel. After separation, protein was blotted onto a PVDF membrane (Invitrogen; PB5210) via semi-dry transfer, and blots were blocked with 5% non-fat milk in 0.5% TBST solution for 1 hour. Blots were incubated in primary antibody solution in 50 mL conical tubes on a rotator overnight at 4°C in either 2.5% BSA or nonfat milk in 0.5% TBST according to the antibody datasheets. Blots were then washed three times in a 0.5% TBST solution for 5 min each and incubated in goat anti-rabbit secondary antibody (Invitrogen; 31460) solution for 45 min at room temperature on a benchtop rocking table. Following three final washes in 0.5% TBST before, blots were imaged with ECL substrate (Thermo Fisher; PI32106) on a chemiluminescent imaging camera. Quantification of bands were performed with Thermo Fisher’s iBright Analysis software.
RNA extraction and gene expression analysis
Whole tissues were homogenized in Trizol (Invitrogen; cat# 15596026) using the Next Advantage Bullet Blender Storm 24. Following homogenization, chloroform is added to the Trizol slurry and incubated prior to centrifugation at 12,000RPM for 15 min at 4°C. RNA extraction on the aqueous phase of the centrifuged homogenate was performed using Invitrogen PureLink RNA Mini Kits according to the manufacturer’s instructions. Reverse transcription and qPCR were performed as previously described.89 Primer sequences used for qPCR are shown in the key resources table.
Bulk RNA sequencing
Isolated RNA was sent to Novogene Corporation Inc. (Sacramento, CA) for bulk RNA sequencing and downstream analysis.
Library preparation
RNA quality was assessed using Agilent 5400 and samples with RNA integrity numbers above 5.0 were used for sequencing. Messenger RNA was purified from total RNA using poly-T oligo-attached magnetic beads. After fragmentation, the first strand cDNA was synthesized using random hexamer primers, followed by the second strand cDNA synthesis using either dUTP for directional library or dTTP for non-directional library. For the non-directional library, it was ready after end repair, A-tailing, adapter ligation, size selection, amplification, and purification. For the directional library, it was ready after end repair, A-tailing, adapter ligation, size selection, USER enzyme digestion, amplification, and purification.
Data processing
Raw reads of fastq format were first processed through in-house perl scripts. In this step, clean data (clean reads) were obtained by removing reads containing adapter, reads containing ploy-N and low-quality reads from raw data.90 All the downstream analyses were based on the clean data with high quality. Reference genome (grcM39) and gene model annotation files were downloaded from genome website directly. Index of the reference genome was built usingHisat2 v2.0.5 and paired-end clean 1 reads were aligned to the reference genome using Hisat2 v2.0.5. featureCounts v1.5.0-p3 was used to count the reads numbers mapped to each gene. Differentially expressed gene analysis was performed using the DESeq2 R package (1.20.0).91 The resulting P-values were adjusted using the Benjamini and Hochberg’s approach for controlling the false discovery rate. Genes with an adjusted P-value ≤0.05 found by DESeq2 were assigned as differentially expressed. Gene Ontology (GO),92 KEGG,93 and Reactome enrichment analyses using the clusterProfiler R package were run and corrected P value less than 0.05 were considered significantly enriched by differential expressed genes.
QUANTIFICATION AND STATISTICAL ANALYSIS
Statistical analysis
Statistical significance was calculated by a multiple t-test, unpaired Student’s t-test, or ANOVA using a post-hoc test to for multiple comparisons. *P < 0.05; **P < 0.005; ***P < 0.001; ****P < 0.0001. Specific tests and post-hoc corrections are reported in figure legends. One-way ANOVA was used when there was one experimental condition but multiple groups (i.e. CS dose) and two-way ANOVA was used when there were two experimental conditions (i.e. age and CS). To determine exclusion criteria, GraphPad Prism was used to define statistical outliers, which were then excluded from data analysis. A confidence interval of 95% was used for all statistical tests. All data were assumed to be normally distributed, unless the standard deviation was identified as significantly different between groups. Sample size for experiments were based upon previously published experiments. All statistical tests were performed using GraphPad Prism v7 for Windows (GraphPad Software). Data are expressed as mean ± S.E.M. Biological replicates and the number of independent experiment repetition are described in the figure legends.
Supplementary Material
Highlights.
Non-canonical lipolysis induced by sepsis and LPS is impaired in vWAT from old mice
vWAT accumulates B1 B cells with reduced sepsis-induced activation during aging
Old vWAT B1 and B2 B cells have inflammatory transcriptional responses to LPS
Lifelong B cell KO increases non-canonical lipolysis and reduces macrophage inflammation
ACKNOWLEDGMENTS
Biorender Agreement nos. BF25VC8CFJ, KI25VC8CHQ, DY25VC8CJR, and KN25VC8CLS. We acknowledge and thank the University of Minnesota Flow Cytometry Resource, specifically Paul Champoux and Rashi Arora, for their expertise. We thank Dr. Xavier Revelo for providing μMT breeders and Genentech for providing the mouse-specific CD20mAb (MTA OR-217814). This work was supported by National Institutes of Health grants R00AG058800 (C.D.C.), R01AG069819 (C.D.C.), R01AG079913 (C.D.C.), GM134880 (V.P.B.), and GM140881 (T.S.G.); Department of Veterans Affairs Merit Review award I01BX001324 (T.S.G.); the McKnight Land-Grant Professorship (C.D.C.); the Glenn Foundation for Medical Research/AFAR grants for junior faculty (C.D.C.); and the Medical Discovery Team on the Biology of Aging (C.D.C.). V.P.B. is a University of Iowa Distinguished Scholar. T.S.G. is the recipient of a Research Career Scientist award (IK6BX006192) from the Department of Veterans Affairs.
Footnotes
SUPPLEMENTAL INFORMATION
Supplemental information can be found online at https://doi.org/10.1016/j.celrep.2024.113967.
DECLARATION OF INTERESTS
The authors declare no competing interests.
REFERENCES
- 1.Duncan RE, Ahmadian M, Jaworski K, Sarkadi-Nagy E, and Sul HS (2007). Regulation of lipolysis in adipocytes. Annu. Rev. Nutr 27, 79–101. 10.1146/annurev.nutr.27.061406.093734. [DOI] [PMC free article] [PubMed] [Google Scholar]
- 2.Reyes-Farias M, Fos-Domenech J, Serra D, Herrero L, and Sánchez-Infantes D (2021). White adipose tissue dysfunction in obesity and aging. Biochem. Pharmacol 192, 114723. 10.1016/j.bcp.2021.114723. [DOI] [PubMed] [Google Scholar]
- 3.Camell CD, Sander J, Spadaro O, Lee A, Nguyen KY, Wing A, Goldberg EL, Youm YH, Brown CW, Elsworth J, et al. (2017). Inflammasome-driven catecholamine catabolism in macrophages blunts lipolysis during ageing. Nature 550, 119–123. 10.1038/nature24022. [DOI] [PMC free article] [PubMed] [Google Scholar]
- 4.Tchkonia T, Morbeck DE, Von Zglinicki T, Van Deursen J, Lustgarten J, Scrable H, Khosla S, Jensen MD, and Kirkland JL (2010). Fat tissue, aging, and cellular senescence. Aging Cell 9, 667–684. 10.1111/j.1474-9726.2010.00608.x. [DOI] [PMC free article] [PubMed] [Google Scholar]
- 5.Schaum N, Lehallier B, Hahn O, Pálovics R, Hosseinzadeh S, Lee SE, Sit R, Lee DP, Losada PM, Zardeneta ME, et al. (2020). Ageing hallmarks exhibit organ-specific temporal signatures. Nature 583, 596–602. 10.1038/s41586-020-2499-y. [DOI] [PMC free article] [PubMed] [Google Scholar]
- 6.Camell CD (2022). Adipose tissue microenvironments during aging: Effects on stimulated lipolysis. Biochim. Biophys. Acta. Mol. Cell Biol. Lipids 1867, 159118. 10.1016/j.bbalip.2022.159118. [DOI] [PMC free article] [PubMed] [Google Scholar]
- 7.Mau T, and Yung R (2018). Adipose tissue inflammation in aging. Exp. Gerontol 105, 27–31. 10.1016/j.exger.2017.10.014. [DOI] [PMC free article] [PubMed] [Google Scholar]
- 8.Grabner GF, Xie H, Schweiger M, and Zechner R (2021). Lipolysis: cellular mechanisms for lipid mobilization from fat stores. Nat. Metab 3, 1445–1465. 10.1038/s42255-021-00493-6. [DOI] [PubMed] [Google Scholar]
- 9.Zu L, He J, Jiang H, Xu C, Pu S, and Xu G (2009). Bacterial endotoxin stimulates adipose lipolysis via toll-like receptor 4 and extracellular signal-regulated kinase pathway. J. Biol. Chem 284, 5915–5926. 10.1074/jbc.M807852200. [DOI] [PubMed] [Google Scholar]
- 10.Chi W, Dao D, Lau TC, Henriksbo BD, Cavallari JF, Foley KP, and Schertzer JD (2014). Bacterial peptidoglycan stimulates adipocyte lipolysis via NOD1. PLoS One 9, e97675. 10.1371/journal.pone.0097675. [DOI] [PMC free article] [PubMed] [Google Scholar]
- 11.Foley KP, Chen Y, Barra NG, Heal M, Kwok K, Tamrakar AK, Chi W, Duggan BM, Henriksbo BD, Liu Y, and Schertzer JD (2021). Inflammation promotes adipocyte lipolysis via IRE1 kinase. J. Biol. Chem 296, 100440. 10.1016/j.jbc.2021.100440. [DOI] [PMC free article] [PubMed] [Google Scholar]
- 12.Rittig N, Bach E, Thomsen HH, Pedersen SB, Nielsen TS, Jørgensen JO, Jessen N, and Møller N (2016). Regulation of Lipolysis and Adipose Tissue Signaling during Acute Endotoxin-Induced Inflammation: A Human Randomized Crossover Trial. PLoS One 11, e0162167. 10.1371/journal.pone.0162167. [DOI] [PMC free article] [PubMed] [Google Scholar]
- 13.Grisouard J, Bouillet E, Timper K, Radimerski T, Dembinski K, Frey DM, Peterli R, Zulewski H, Keller U, Müller B, and Christ-Crain M. (2012). Both inflammatory and classical lipolytic pathways are involved in lipopolysaccharide-induced lipolysis in human adipocytes. Innate Immun. 18, 25–34. 10.1177/1753425910386632. [DOI] [PubMed] [Google Scholar]
- 14.Camell CD, Günther P, Lee A, Goldberg EL, Spadaro O, Youm YH, Bartke A, Hubbard GB, Ikeno Y, Ruddle NH, et al. (2019). Aging Induces an Nlrp3 Inflammasome-Dependent Expansion of Adipose B Cells That Impairs Metabolic Homeostasis. Cell Metab. 30,1024–1039.e6. 10.1016/j.cmet.2019.10.006. [DOI] [PMC free article] [PubMed] [Google Scholar]
- 15.Greenberg AS, Shen WJ, Muliro K, Patel S, Souza SC, Roth RA, and Kraemer FB (2001). Stimulation of lipolysis and hormone-sensitive lipase via the extracellular signal-regulated kinase pathway. J. Biol. Chem 276, 45456–45461. 10.1074/jbc.M104436200. [DOI] [PubMed] [Google Scholar]
- 16.Zhang HH, Halbleib M, Ahmad F, Manganiello VC, and Greenberg AS (2002). Tumor necrosis factor-alpha stimulates lipolysis in differentiated human adipocytes through activation of extracellular signal-related kinase and elevation of intracellular cAMP. Diabetes 51, 2929–2935. 10.2337/diabetes.51.10.2929. [DOI] [PubMed] [Google Scholar]
- 17.Engin AB (2017). What Is Lipotoxicity? Adv. Exp. Med. Biol 960, 197–220. 10.1007/978-3-319-48382-5_8. [DOI] [PubMed] [Google Scholar]
- 18.Jha P, Claudel T, Baghdasaryan A, Mueller M, Halilbasic E, Das SK, Lass A, Zimmermann R, Zechner R, Hoefler G, and Trauner M (2014). Role of adipose triglyceride lipase (PNPLA2) in protection from hepatic inflammation in mouse models of steatohepatitis and endotoxemia. Hepatology 59, 858–869. 10.1002/hep.26732. [DOI] [PubMed] [Google Scholar]
- 19.Bougarne N, Weyers B, Desmet SJ, Deckers J, Ray DW, Staels B, and De Bosscher K (2018). Molecular Actions of PPARa in Lipid Metabolism and Inflammation. Endocr. Rev 39, 760–802. 10.1210/er.2018-00064. [DOI] [PubMed] [Google Scholar]
- 20.Machado H, Hofer P, Zechner R, Smith TK, and Figueiredo LM (2023). Adipocyte lipolysis protects mice against Trypanosoma brucei infection. Nat. Microbiol 8, 2020–2032. 10.1038/s41564-023-01496-7. [DOI] [PMC free article] [PubMed] [Google Scholar]
- 21.Lu YC, Yeh WC, and Ohashi PS (2008). LPS/TLR4 signal transduction pathway. Cytokine 42, 145–151. 10.1016/j.cyto.2008.01.006. [DOI] [PubMed] [Google Scholar]
- 22.Schweighoffer E, Nys J, Vanes L, Smithers N, and Tybulewicz VLJ (2017). TLR4 signals in B lymphocytes are transduced via the B cell antigen receptor and SYK. J. Exp. Med 214, 1269–1280. 10.1084/jem.20161117. [DOI] [PMC free article] [PubMed] [Google Scholar]
- 23.Martín S, Pérez A, and Aldecoa C (2017). Sepsis and Immunosenescence in the Elderly Patient: A Review. Front. Med 4, 20. 10.3389/fmed.2017.00020. [DOI] [PMC free article] [PubMed] [Google Scholar]
- 24.Pawelec G. (2018). Age and immunity: What is “immunosenescence”? Exp. Gerontol 105, 4–9. 10.1016/j.exger.2017.10.024. [DOI] [PubMed] [Google Scholar]
- 25.Starr ME, and Saito H (2014). Sepsis in old age: review of human and animal studies. Aging Dis. 5, 126–136. 10.14336/ad.2014.0500126. [DOI] [PMC free article] [PubMed] [Google Scholar]
- 26.Starr ME, Ueda J, Takahashi H, Weiler H, Esmon CT, Evers BM, and Saito H (2010). Age-dependent vulnerability to endotoxemia is associated with reduction of anticoagulant factors activated protein C and thrombomodulin. Blood 115, 4886–4893. 10.1182/blood-2009-10-246678. [DOI] [PMC free article] [PubMed] [Google Scholar]
- 27.Alliance Sepsis (2022). Sepsis and Aging. https://www.sepsis.org/sepsisand/aging/. [Google Scholar]
- 28.Starr ME, Evers BM, and Saito H (2009). Age-associated increase in cytokine production during systemic inflammation: adipose tissue as a major source of IL-6. J. Gerontol. A Biol. Sci. Med. Sci 64, 723–730. 10.1093/gerona/glp046. [DOI] [PMC free article] [PubMed] [Google Scholar]
- 29.Starr ME, Saito M, Evers BM, and Saito H (2015). Age-Associated Increase in Cytokine Production During Systemic Inflammation-II: The Role of IL-1β in Age-Dependent IL-6 Upregulation in Adipose Tissue. J. Gerontol. A Biol. Sci. Med. Sci 70, 1508–1515. 10.1093/gerona/glu197. [DOI] [PMC free article] [PubMed] [Google Scholar]
- 30.Xu H, Liew LN, Kuo IC, Huang CH, Goh DLM, and Chua KY (2008). The modulatory effects of lipopolysaccharide-stimulated B cells on differential T-cell polarization. Immunology 125, 218–228. 10.1111/j.1365-2567.2008.02832.x. [DOI] [PMC free article] [PubMed] [Google Scholar]
- 31.Ziegler SF, Ramsdell F, and Alderson MR (1994). The activation antigen CD69. Stem Cell. 12, 456–465. 10.1002/stem.5530120502. [DOI] [PubMed] [Google Scholar]
- 32.Minguet S, Dopfer EP, Pollmer C, Freudenberg MA, Galanos C, Reth M, Huber M, and Schamel WW (2008). Enhanced B-cell activation mediated by TLR4 and BCR crosstalk. Eur. J. Immunol 38, 2475–2487. 10.1002/eji.200738094. [DOI] [PubMed] [Google Scholar]
- 33.Kishimoto TK, Larson RS, Corbi AL, Dustin ML, Staunton DE, and Springer TA (1989). The leukocyte integrins. Adv. Immunol 46, 149–182. 10.1016/s0065-2776(08)60653-7. [DOI] [PubMed] [Google Scholar]
- 34.Cruz-Migoni S, and Caamarño J (2016). Fat-Associated Lymphoid Clusters in Inflammation and Immunity. Front. Immunol 7,612. 10.3389/fimmu.2016.00612. [DOI] [PMC free article] [PubMed] [Google Scholar]
- 35.Béndzéch C, Luu NT, Walker JA, Kruglov AA, Loo Y, Nakamura K , Zhang Y, Nayar S, Jones LH, Flores-Langarica A, et al. (2015). Inflammation-induced formation of fat-associated lymphoid clusters. Nat. Immunol 16, 819–828. 10.1038/ni.3215. [DOI] [PMC free article] [PubMed] [Google Scholar]
- 36.Lumeng CN, Liu J, Geletka L, Delaney C, Delproposto J, Desai A, Oatmen K, Martinez-Santibanez G, Julius A, Garg S, and Yung RL (2011). Aging is associated with an increase in T cells and inflammatory macrophages in visceral adipose tissue. J. Immunol 187, 6208–6216. 10.4049/jimmunol.1102188. [DOI] [PMC free article] [PubMed] [Google Scholar]
- 37.Mortaz E, Alipoor SD, Adcock IM, Mumby S, and Koenderman L (2018). Update on Neutrophil Function in Severe Inflammation. Front. Immunol 9, 2171. 10.3389/flmmu.2018.02171. [DOI] [PMC free article] [PubMed] [Google Scholar]
- 38.Prieto JMB, and Felippe MJB (2017). Development, phenotype, and function of non-conventional B cells. Comp. Immunol. Microbiol. Infect. Dis 54, 38–44. 10.1016/j.cimid.2017.08.002. [DOI] [PubMed] [Google Scholar]
- 39.Wang Y, Liu J, Burrows PD, and Wang JY (2020). B Cell Development and Maturation. Adv. Exp. Med. Biol 1254, 1–22. 10.1007/978-981-15-3532-1_1. [DOI] [PubMed] [Google Scholar]
- 40.Carter S, Miard S, Caron A, Sallé-Lefort S, St-Pierre P, Anhê FF, Lavoie-Charland E, Blais-Lecours P, Drolet MC, Lefebvre JS, et al. (2018). Loss of OcaB Prevents Age-Induced Fat Accretion and Insulin Resistance by Altering B-Lymphocyte Transition and Promoting Energy Expenditure. Diabetes 67, 1285–1296. 10.2337/db17-0558. [DOI] [PubMed] [Google Scholar]
- 41.Hillion S, Arleevskaya MI, Blanco P, Bordron A, Brooks WH, Cesbron JY, Kaveri S, Vivier E, and Renaudineau Y (2020). The Innate Part of the Adaptive Immune System. Clin. Rev. Allergy Immunol 58, 151–154. 10.1007/s12016-019-08740-1. [DOI] [PubMed] [Google Scholar]
- 42.Fagarasan S, Watanabe N, and Honjo T (2000). Generation, expansion, migration and activation of mouse B1 cells. Immunol. Rev 176, 205–215. 10.1034/j1600-065x.2000.00604.x. [DOI] [PubMed] [Google Scholar]
- 43.Cunningham AF, Flores-Langarica A, Bobat S, Dominguez Medina CC, Cook CNL, Ross EA, Lopez-Macias C, and Henderson IR (2014). B1b cells recognize protective antigens after natural infection and vaccination. Front. Immunol 5, 535. 10.3389/fimmu.2014.00535. [DOI] [PMC free article] [PubMed] [Google Scholar]
- 44.Bodogai M, O’Connell J, Kim K, Kim Y, Moritoh K, Chen C, Gusev F, Vaughan K, Shulzhenko N, Mattison JA, et al. (2018). Commensal bacteria contribute to insulin resistance in aging by activating innate B1a cells. Sci. Transl. Med 10. 10.1126/scitranslmed.aat4271. [DOI] [PMC free article] [PubMed] [Google Scholar]
- 45.Seemann S, Zohles F, and Lupp A (2017). Comprehensive comparison of three different animal models for systemic inflammation. J. Biomed. Sci 24, 60. 10.1186/s12929-017-0370-8. [DOI] [PMC free article] [PubMed] [Google Scholar]
- 46.Cavaillon JM (2018). Exotoxins and endotoxins: Inducers of inflammatory cytokines. Toxicon 149, 45–53. 10.1016/j.toxicon.2017.10.016. [DOI] [PubMed] [Google Scholar]
- 47.Saito H, Sherwood ER, Varma TK, and Evers BM (2003). Effects of aging on mortality, hypothermia, and cytokine induction in mice with endotoxemia or sepsis. Mech. Ageing Dev 124,1047–1058. 10.1016/j.mad.2003.08.002. [DOI] [PubMed] [Google Scholar]
- 48.Wu L, Parekh VV, Hsiao J, Kitamura D, and Van Kaer L (2014). Spleen supports a pool of innate-like B cells in white adipose tissue that protects against obesity-associated insulin resistance. Proc. Natl. Acad. Sci. USA 111, E4638–E4647. 10.1073/pnas.1324052111. [DOI] [PMC free article] [PubMed] [Google Scholar]
- 49.Aziz M, Holodick NE, Rothstein TL, and Wang P (2017). B-1a Cells Protect Mice from Sepsis: Critical Role of CREB. J. Immunol 199, 750–760. 10.4049/jimmunol.1602056. [DOI] [PMC free article] [PubMed] [Google Scholar]
- 50.Winer DA, Winer S, Shen L, Wadia PP, Yantha J, Paltser G, Tsui H, Wu P, Davidson MG, Alonso MN, et al. (2011). B cells promote insulin resistance through modulation of T cells and production of pathogenic IgG antibodies. Nat. Med 17, 610–617. 10.1038/nm.2353. [DOI] [PMC free article] [PubMed] [Google Scholar]
- 51.Maseda D, Candando KM, Smith SH, Kalampokis I, Weaver CT, Plevy SE, Poe JC, and Tedder TF (2013). Peritoneal cavity regulatory B cells (B10 cells) modulate IFN-γ+CD4+ T cell numbers during colitis development in mice. J. Immunol 191, 2780–2795. 10.4049/jimmunol.1300649. [DOI] [PMC free article] [PubMed] [Google Scholar]
- 52.Venkataraman C, Shankar G, Sen G, and Bondada S (1999). Bacterial lipopolysaccharide induced B cell activation is mediated via a phosphati-dylinositol 3-kinase dependent signaling pathway. Immunol. Lett 69, 233–238. 10.1016/s0165-2478(99)00068-1. [DOI] [PubMed] [Google Scholar]
- 53.Wu Z, Xu J, Tan J, Song Y, Liu L, Zhang F, Zhang Y, Li X, Chi Y, and Liu Y (2019). Mesenteric adipose tissue B lymphocytes promote local and hepatic inflammation in non-alcoholic fatty liver disease mice. J. Cell Mol. Med 23, 3375–3385. 10.1111/jcmm.14232. [DOI] [PMC free article] [PubMed] [Google Scholar]
- 54.Nishimura S, Manabe I, Takaki S, Nagasaki M, Otsu M, Yamashita H, Sugita J, Yoshimura K, Eto K, Komuro I, et al. (2013). Adipose Natural Regulatory B Cells Negatively Control Adipose Tissue Inflammation. Cell Metab. 18, 759–766. 10.1016/j.cmet.2013.09.017. [DOI] [PubMed] [Google Scholar]
- 55.Khan S, Chakraborty M, Wu F, Chen N, Wang T, Chan YT, Sayad A, Vasquez J-DS, Kotlyar M, Nguyen K, et al. (2023). B Cells Promote T Cell Immunosenescence and Mammalian Aging Parameters. Preprint at bioRxiv. 10.1101/2023.09.12.556363. [DOI] [Google Scholar]
- 56.Kelly-Scumpia KM, Scumpia PO, Weinstein JS, Delano MJ, Cuenca AG, Nacionales DC, Wynn JL, Lee PY, Kumagai Y, Efron PA, et al. (2011). B cells enhance early innate immune responses during bacterial sepsis. J. Exp. Med 208, 1673–1682. 10.1084/jem.20101715. [DOI] [PMC free article] [PubMed] [Google Scholar]
- 57.Kitamura D, Roes J, Kühn R, and Rajewsky K (1991). A B cell-deficient mouse by targeted disruption of the membrane exon of the immunoglobulin mu chain gene. Nature 350, 423–426. 10.1038/350423a0. [DOI] [PubMed] [Google Scholar]
- 58.Pirzgalska RM, Seixas E, Seidman JS, Link VM, Sánchez NM, Mahú I, Mendes R, Gres V, Kubasova N, Morris I, et al. (2017). Sympathetic neuron-associated macrophages contribute to obesity by importing and metabolizing norepinephrine. Nat. Med 23, 1309–1318. 10.1038/nm.4422. [DOI] [PMC free article] [PubMed] [Google Scholar]
- 59.Fujisaka S, Usui I, Bukhari A, Ikutani M, Oya T, Kanatani Y, Tsuneyama K, Nagai Y, Takatsu K, Urakaze M, et al. (2009). Regulatory mechanisms for adipose tissue M1 and M2 macrophages in diet-induced obesemice. Diabetes 58, 2574–2582. 10.2337/db08-1475. [DOI] [PMC free article] [PubMed] [Google Scholar]
- 60.Wentworth JM, Naselli G, Brown WA, Doyle L, Phipson B, Smyth GK, Wabitsch M, O’Brien PE, and Harrison LC (2010). Pro-inflammatory CD11c+CD206+ adipose tissue macrophages are associated with insulin resistance in human obesity. Diabetes 59, 1648–1656. 10.2337/db09-0287. [DOI] [PMC free article] [PubMed] [Google Scholar]
- 61.Nawaz A, Aminuddin A, Kado T, Takikawa A, Yamamoto S, Tsuneyama K, Igarashi Y, Ikutani M, Nishida Y, Nagai Y, et al. (2017). CD206(+) M2-like macrophages regulate systemic glucose metabolism by inhibiting proliferation of adipocyte progenitors. Nat. Commun 8, 286. 10.1038/s41467-017-00231-1. [DOI] [PMC free article] [PubMed] [Google Scholar]
- 62.Lu B, Huang L, Cao J, Li L, Wu W, Chen X, and Ding C (2021). Adipose tissue macrophages in aging-associated adipose tissue function. J. Physiol. Sci 71, 38. 10.1186/s12576-021-00820-2. [DOI] [PMC free article] [PubMed] [Google Scholar]
- 63.Muir LA, Cho KW, Geletka LM, Baker NA, Flesher CG, Ehlers AP, Kaciroti N, Lindsly S, Ronquist S, Rajapakse I, et al. (2022). Human CD206+ macrophages associate with diabetes and adipose tissue lymphoid clusters. JCI Insight 7, e146563. 10.1172/jci.insight.146563. [DOI] [PMC free article] [PubMed] [Google Scholar]
- 64.Lönnqvist F, Nyberg B, Wahrenberg H, and Arner P (1990). Catecholamine-induced lipolysis in adipose tissue of the elderly. J. Clin. Invest 85, 1614–1621. 10.1172/jci114612. [DOI] [PMC free article] [PubMed] [Google Scholar]
- 65.Goldberg EL, and Dixit VD (2015). Drivers of age-related inflammation and strategies for healthspan extension. Immunol. Rev 265, 63–74. 10.1111/imr.12295. [DOI] [PMC free article] [PubMed] [Google Scholar]
- 66.Buzelle SL, MacPherson REK, Peppler WT, Castellani L, and Wright DC (2015). The contribution of IL-6 to beta 3 adrenergic receptor mediated adipose tissue remodeling. Physiol. Rep 3, e12312. 10.14814/phy2.12312. [DOI] [PMC free article] [PubMed] [Google Scholar]
- 67.Rudiger A, and Singer M (2016). Decatecholaminisation during sepsis. Crit. Care 20, 309. 10.1186/s13054-016-1488-x. [DOI] [PMC free article] [PubMed] [Google Scholar]
- 68.Schweiger M, Schreiber R, Haemmerle G, Lass A, Fledelius C, Jacobsen P, Tornqvist H, Zechner R, and Zimmermann R (2006). Adipose triglyceride lipase and hormone-sensitive lipase are the major enzymes in adipose tissue triacylglycerol catabolism. J. Biol. Chem 281, 40236–40241. 10.1074/jbc.M608048200. [DOI] [PubMed] [Google Scholar]
- 69.Lettieri Barbato D, Tatulli G, Aquilano K, and Ciriolo MR (2014). Inhibition of age-related cytokines production by ATGL: a mechanism linked to the anti-inflammatory effect of resveratrol. Mediators Inflamm. 2014, 917698. 10.1155/2014/917698. [DOI] [PMC free article] [PubMed] [Google Scholar]
- 70.Pham L, Komalavilas P, Eddie AM, Thayer TE, Greenwood DL, Liu KH, Weinberg J, Patterson A, Fessel JP, Boyd KL, et al. (2022). Neutrophil trafficking to the site of infection requires Cpt1a-dependent fatty acid β-oxidation. Commun. Biol 5, 1366. 10.1038/s42003-022-04339-z. [DOI] [PMC free article] [PubMed] [Google Scholar]
- 71.Barker G, Leeuwenburgh C, Brusko T, Moldawer L, Reddy ST, and Guirgis FW (2021). Lipid and Lipoprotein Dysregulation in Sepsis: Clinical and Mechanistic Insights into Chronic Critical Illness. J. Clin. Med 10, 1693. 10.3390/jcm10081693. [DOI] [PMC free article] [PubMed] [Google Scholar]
- 72.Cirstea M, Walley KR, Russell JA, Brunham LR, Genga KR, and Boyd JH (2017). Decreased high-density lipoprotein cholesterol level is an early prognostic marker for organ dysfunction and death in patients with suspected sepsis. J. Crit. Care 38, 289–294. 10.1016/j.jcrc.2016.11.041. [DOI] [PubMed] [Google Scholar]
- 73.Lekkou A, Mouzaki A, Siagris D, Ravani I, and Gogos CA (2014). Serum lipid profile, cytokine production, and clinical outcome in patients with severe sepsis. J. Crit. Care 29, 723–727. 10.1016/j.jcrc.2014.04.018. [DOI] [PubMed] [Google Scholar]
- 74.Rival T, Cinq-Frais C, Silva-Sifontes S, Garcia J, Riu B, Salvayre R, Genestal M, and Caspar-Bauguil S (2013). Alteration of plasma phospholipid fatty acid profile in patients with septic shock. Biochimie 95, 2177–2181. 10.1016/j.biochi.2013.08.006. [DOI] [PubMed] [Google Scholar]
- 75.Mesotten D, Swinnen JV, Vanderhoydonc F, Wouters PJ, and Van den Berghe G (2004). Contribution of Circulating Lipids to the Improved Outcome of Critical Illness by Glycemic Control with Intensive Insulin Therapy. J. Clin. Endocrinol. Metab 89, 219–226. 10.1210/jc.2003-030760. [DOI] [PubMed] [Google Scholar]
- 76.Hägglöf T, Vanz C, Kumagai A, Dudley E, Ortega V, Siller M, Parthasarathy R, Keegan J, Koenigs A, Shute T, and Leadbetter EA (2022). T-bet(+) B cells accumulate in adipose tissue and exacerbate metabolic disorder during obesity. Cell Metab. 34, 1121–1136.e6. 10.1016/j.cmet.2022.07.002. [DOI] [PMC free article] [PubMed] [Google Scholar]
- 77.Frasca D, Diaz A, Romero M, Vazquez T, and Blomberg BB (2017). Obesity induces pro-inflammatory B cells and impairs B cell function in old mice. Mech. Ageing Dev 162,91–99. 10.1016/j.mad.2017.01.004. [DOI] [PMC free article] [PubMed] [Google Scholar]
- 78.Ying W, Wollam J, Ofrecio JM, Bandyopadhyay G, El Ouarrat D, Lee YS, Oh DY, Li P, Osborn O, and Olefsky JM (2017). Adipose tissue B2 cells promote insulin resistance through leukotriene LTB4/LTB4R1 signaling. J. Clin. Invest 127, 1019–1030. 10.1172/jci90350. [DOI] [PMC free article] [PubMed] [Google Scholar]
- 79.Harmon DB, Srikakulapu P, Kaplan JL, Oldham SN, McSkimming C, Garmey JC, Perry HM, Kirby JL, Prohaska TA, Gonen A, et al. (2016). Protective Role for B-1b B Cells and IgM in Obesity-Associated Inflammation, Glucose Intolerance, and Insulin Resistance. Arterioscler. Thromb. Vasc. Biol 36, 682–691. 10.1161/atvbaha.116.307166. [DOI] [PMC free article] [PubMed] [Google Scholar]
- 80.Haas KM, Blevins MW, High KP, Pang B, Swords WE, and Yammani RD (2014). Aging promotes B-1b cell responses to native, but not protein-conjugated, pneumococcal polysaccharides: implications for vaccine protection in older adults. J. Infect. Dis 209, 87–97. 10.1093/infdis/jit442. [DOI] [PMC free article] [PubMed] [Google Scholar]
- 81.Colombo MJ, and Alugupalli KR (2008). Complement factor H-binding protein, a putative virulence determinant of Borrelia hermsii, is an antigenic target for protective B1b lymphocytes. J. Immunol 180, 4858–4864. 10.4049/jimmunol.180.7.4858. [DOI] [PubMed] [Google Scholar]
- 82.Foote JB, and Kearney JF (2009). Generation of B cell memory to the bacterial polysaccharide alpha-1,3 dextran. J. Immunol 183, 6359–6368. 10.4049/jimmunol.0902473. [DOI] [PMC free article] [PubMed] [Google Scholar]
- 83.Kawamoto S, Uemura K, Hori N, Takayasu L, Konishi Y, Katoh K, Matsumoto T, Suzuki M, Sakai Y, Matsudaira T, et al. (2023). Bacterial induction of B cell senescence promotes age-related changes in the gut microbiota. Nat. Cell Biol 25, 865–876. 10.1038/s41556-023-01145-5. [DOI] [PubMed] [Google Scholar]
- 84.Wu L, Dalal R, Cao CD, Postoak JL, Yang G, Zhang Q, Wang Z, Lal H, and Van Kaer L (2019). IL-10-producing B cells are enriched in murine pericardial adipose tissues and ameliorate the outcome of acute myocardial infarction. Proc. Natl. Acad. Sci. USA 116, 21673–21684. 10.1073/pnas.1911464116. [DOI] [PMC free article] [PubMed] [Google Scholar]
- 85.Rajbhandari P, Thomas BJ, Feng AC, Hong C, Wang J, Vergnes L , Sallam T, Wang B, Sandhu J, Seldin MM, et al. (2018). IL-10 Signaling Remodels Adipose Chromatin Architecture to Limit Thermogenesis and Energy Expenditure. Cell 172, 218–233.e17. 10.1016/j.cell.2017.11.019. [DOI] [PMC free article] [PubMed] [Google Scholar]
- 86.Liao Y, Smyth GK, and Shi W (2014). featureCounts: an efficient general purpose program for assigning sequence reads to genomic features. Bioinformatics 30, 923–930. [DOI] [PubMed] [Google Scholar]
- 87.Zhang Y, Park C, Bennett C, Thornton M, and Kim D (2021). Rapid and accurate alignment of nucleotide conversion sequencing reads with HISAT-3N. Genome Res. 31, 1290–1295. [DOI] [PMC free article] [PubMed] [Google Scholar]
- 88.Wu T, Hu E, Xu S, Chen M, Guo P, Dai Z, Feng T, Zhou L, Tang W, Zhan L, et al. (2021). clusterProfiler 4.0: A universal enrichment tool for interpreting omics data. Innovation 2, 100141. 10.1016/j.xinn.2021.100141. [DOI] [PMC free article] [PubMed] [Google Scholar]
- 89.Nolan T, Hands RE, and Bustin SA (2006). Quantification of mRNA using real-time RT-PCR. Nat. Protoc 1, 1559–1582. 10.1038/nprot.2006.236. [DOI] [PubMed] [Google Scholar]
- 90.Bolger AM, Lohse M, and Usadel B (2014). Trimmomatic: a flexible trimmer for Illumina sequence data. Bioinformatics 30, 2114–2120. 10.1093/bioinformatics/btu170. [DOI] [PMC free article] [PubMed] [Google Scholar]
- 91.Love MI, Huber W, and Anders S (2014). Moderated estimation of fold change and dispersion for RNA-seq data with DESeq2. Genome Biol. 15, 550. 10.1186/s13059-014-0550-8. [DOI] [PMC free article] [PubMed] [Google Scholar]
- 92.Young MD, Wakefield MJ, Smyth GK, and Oshlack A (2010). Gene ontology analysis for RNA-seq: accounting for selection bias. Genome Biol. 11, R14. 10.1186/gb-2010-11-2-r14. [DOI] [PMC free article] [PubMed] [Google Scholar]
- 93.Kanehisa M, and Goto S (2000). KEGG: kyoto encyclopedia of genes and genomes. Nucleic Acids Res. 28, 27–30. 10.1093/nar/28.1.27. [DOI] [PMC free article] [PubMed] [Google Scholar]
Associated Data
This section collects any data citations, data availability statements, or supplementary materials included in this article.
Supplementary Materials
Data Availability Statement
Bulk RNA-seq data have been deposited at GEO and are publicly available as of the date of publication. Accession numbers are listed in the key resources table. Raw western blot images from figures were deposited on Mendeley at https://doi.org/10.17632/nvv9bc7x7k.1.
This paper does not report original code.
Any additional information required to reanalyze the data reported in this paper is available from the lead contact upon request.
KEY RESOURCES TABLE
| REAGENT or RESOURCE | SOURCE | IDENTIFIER |
|---|---|---|
| Antibodies | ||
| ATGL (30A4) Rabbit mAb | Cell Signaling | Cat#2439S; RRID:AB_2167953 |
| Cleaved Caspase-1 (Asp296) (E2G2I) Rabbit mAb | Cell Signaling | Cat#89332S; RRID:AB_2923067 |
| Phospho-HSL (Ser660) Polyclonal Antibody | Invitrogen | Cat#PA5-110131; RRID:AB_2855542 |
| NLRP3 (D4D8T) Rabbit mAb | Cell Signaling | Cat#15101S; RRID:AB_2722591 |
| β-Actin Antibody | Cell Signaling | Cat#4967L; RRID:AB_330288 |
| aCD20 Mouse mAb clone 5D2 | Genentech | MTA agreement OR-217814 |
| InViVoPlus mouse IgG2a isotype control clone C1.18.4 | BioXCell | Cat#BP0085; RRID:AB_1107771 |
| See Table S1 for a list of antibodies and fluorophores used for flow cytometry and FACS. | N/A | |
| Bacterial and virus strains | ||
| Lipopolysaccharides from Escherichia coli O111:B4 | Millipore Sigma | Cat#L3024 |
| Critical commercial assays | ||
| Fujifilm Healthcare Americas Corp Hr Series Nefa-Hr (2) Color Reagent A | Fisher Scientific | NC9517308 |
| Fujifilm Healthcare Americas Corp Hr Series Nefa-Hr (2) Solvent A | Fisher Scientific | NC9517309 |
| Fujifilm Healthcare Americas Corp Hr Series Nefa-Hr (2) Color Reagent B | Fisher Scientific | NC9517310 |
| Fujifilm Healthcare Americas Corp Hr Series Nefa-Hr (2) Solvent B | Fisher Scientific | NC9517311 |
| Deposited data | ||
| Raw western blots | Mendeley Data | https://doi.org/10.17632/nvv9bc7x7k.1 |
| Bulk RNA sequencing of PBS and LPS treated vWAT B1 and B2 B cells | GEO DataSets | GSE250371 |
| Experimental models: Organisms/strains | ||
| Mouse: WT; C57BL/6J | National Institute on Aging or Jackson Labs or bred in UMN colony | RRID:IMSR_JAX:000664 |
| Mouse: CD45.1; B6.SJL-Ptprca Pepcb/BoyJ | Jackson Labs or bred in UMN colony | RRID:IMSR_JAX:002014 |
| Mouse: B6.129S2-Ighmtm1Cgn/J | Dr. Xavier Revelo, University of Minnesota | RRID:IMSR_JAX:002288 |
| Oligonucleotides | ||
| Il6 | Thermofisher | Forward:CACAGAGGATACCACATCCCAACA Reverse:TCCACGATTTCCCAGAGAACA |
| Il10 | Thermofisher | Forward:GGTTGCCAAGCCTTATCGGA Reverse:ACCTGCTCCACTGCCTTGCT |
| Tnf | Thermofisher | Forward:CAACCAACAAGTGATATTCTCCATG Reverse:GATCCACACTCTCCAGCTGCA |
| Il1b | Thermofisher | Forward:GGTGCCTATGTCTCAGCCTCTT Reverse:CGATCACCCCGAAGTTCAGTA |
| Software and algorithms | ||
| Prism v10.1.2 | Graphpad | N/A |
| FlowJo v10.9.0 | TreeStar | N/A |
| featureCounts v1.5.0-p3 | Liao et al.86 | N/A |
| Hisat2 v2.0.5 | Zhang et al.87 | N/A |
| clusterProfiler | Wu et al.88 | N/A |