

Abstract
The role of cerebral microvasculature in cognitive dysfunction can be investigated by identifying the impact of blood flow on cortical tissue oxygenation. In this paper, the impact of capillary stalls on microcirculatory characteristics such as flow and hematocrit (Ht) in the cortical angioarchitecture is studied. Using a deterministic mathematical model to simulate blood flow in a realistic mouse cortex, hemodynamics parameters, including pressure, flow, vessel diameter-adjustable hematocrit, and transit time are calculated as a function of stalling events. Using a non-linear plasma skimming model, it is observed that Ht increases in the penetrating arteries from the pial vessels as a function of cortical depth. The incidence of stalling on Ht distribution along the blood network vessels shows reduction of RBCs around the tissue near occlusion sites and decreased Ht concentration downstream from the blockage points. Moreover, upstream of the occlusion, there is a noticeable increase of the Ht, leading to larger flow resistance due to higher blood viscosity. We predicted marked changes in transit time behavior due to stalls which match trends observed in mice in vivo. These changes to blood cell quantity and quality may be implicated in the development of Alzheimer’s disease and contribute to the course of the illness [1–2].
Keywords: Mathematical modelling, Microcirculation, Cerebral hemodynamics, Capillary stalling, Cerebral blood flow
1. Introduction:
The cerebral vascular network plays an important role in ensuring oxygen exchange and blood perfusion to the brain. Modulation of hemodynamic aspects of this vascular space is necessary to respond to metabolic need to maintain homeostasis and is achieved by an interaction between neurons, blood vessels and other extracellular factors, collectively named the neurovascular unit (NVU). Disruption to this coupling may significantly impact cognitive capacity; it is thought that significant disruption to these mechanisms may occur in aging and be more pronounced in both chronic and acute late-life neurological disease [4–6]. One of the top ten leading causes of mortality globally, notably in the United States, is cognitive illnesses such as dementia, including Alzheimer’s disease [7]. By 2060, the number of persons in the United States with Alzheimer’s disease is anticipated to triple [8]. These statistics demonstrate the importance of research studies in developing more efficient, affordable, and accessible treatment methods [9]. Current clinical neuroimaging approaches lack the resolution to measure all pertinent aspects of the NVU, and available diagnostic methods often do not have the sensitivity for signs in prodromal stages of disease when therapy is most effective. A model-based simulation approach that allows for inference of pathological changes at a scale unavailable to in vivo examination in the clinic would provide detection and diagnosis of age-related diseases at earlier stages [10]. A mechanistic model capable of accurately simulating complex dynamic relationships in the NVU may also elucidate the role of cerebral microvasculature in healthy aging and cognitive decline by identifying factors with the potential to produce significant disruption to perfusion in vascular networks at multiple scales [10].
A recent comprehensive study used deterministic hemodynamic modeling to predict the effect of stalling on microcirculatory blood flow and investigated the correlation between the stall ratios and cerebral blood flow [29]. Here, we posit that in addition to flow changes, changes in hematocrit distribution especially in microvessels may impair cognitive function. Even with intact plasma perfusion, oxygen transfer may still be poor owing to an uneven distribution of the hematocrit. Lower hematocrit fluxes may impair oxygen transfer to the target tissues either upstream or downstream of the occluded vessels.
Most prior research focused on the obstruction of primary penetrating arteries often referred to as the “perfusion bottleneck” [26–27]. Other studies considered the flow changes after single capillary vessel occlusion and evaluated its local effect on blood flow [28]. In recent studies, the presence of capillary stalls was implicated as a substantial contributor to insufficient post-stroke reperfusion [30,31]. This led to several studies investigating the incidence of capillary occlusion in different tissues under different conditions. For example, one study using intravital microscopy found that capillary occlusion occurred in around 5% of capillaries in the cremaster muscle of mice during ischemia-reperfusion injury [32]. Another study found that the incidence of capillary occlusion in the retina of rats increased from around 1% under normal conditions to around 10% during hyperoxia [33]. Recent computational efforts to address the relationship between the NVU and vascular hemodynamics [34–38] have suffered from vascular network simplifications, including using small synthetic networks, and arbitrary vessel diameter, though these simplifications are an inevitable part of models at the mercy of the boundaries of computing power, modern neurovascular images which suffer from the capturing the high-quality image resolution and limited line-of-vision an essential division of the cortical microstructures.
Here we hypothesize that capillary stalls that diminish blood flow may leave a fingerprint in the transit time behavior of the entire blood flow network. The exploration of this idea is significant because it would inform in vivo imaging methods about avenues towards detecting the presence and perhaps even the extent of capillary occlusions that cannot be directly observed; an important step towards biomarkers of capillary dysfunction. We propose to use mechanistic hemodynamic simulation in realistic microvascular network graphs to systematically quantify the effect of stalling on perfusion and distribution of red blood cells (hematocrit). We perform mechanistic simulations for microcirculatory blood vessel networks extracted from the mouse somatosensory cortex including all ranges of vessels from large branches on the cortical surface to penetrating arteries, capillaries, and ascending veins [26].
Since there is a direct relationship between blood flow and the oxygenation of microvascular networks [39], one of the essential factors in estimating oxygen levels is to calculate the hematocrit (Ht) distribution in the vascular network, particularly in the capillary bed. To assess the impact of microstrokes on oxygenation, we apply a mechanistic hemodynamic model that can predict the red blood cell (RBC) distribution and hematocrit (Ht) split at each bifurcation, where hematocrit indicates the fraction of red blood cells to total blood volume (plasma and RBCs) [40,50]. Blood flow properties such as flow, pressure, Ht, and transit time in the mouse brain cortex with and without capillary obstructions for healthy and capillary obstruction situations are computed locally and globally. We hypothesize that in cases of occlusion, a change in Ht is an additional factor for reduced oxygen reduction in corresponding vessels in addition to decreases in local blood flow.
2. Mathematical Method
2.1. Governing equations
The blood in the network is considered as a suspension of blood plasma and red blood cells (RBCs). The Hagen–Poiseuille law is used in the network for flow continuity, estimating the bulk flow by connecting the volumetric flow to the pressure gradient at each vessel as a function of the diameter and hematocrit-dependent resistance. are hydraulic resistance, length of a vessel, blood viscosity, vessel diameter, hematocrit, and modified in-vitro viscosity [3], respectively.
Since blood viscosity in micro vessels is shear (diameter) and hematocrit dependent, a hematocrit-dependent viscosity law and a procedure for predicting uneven red blood cell splitting (plasma skimming) law is needed.
| (1) |
| (2) |
| (3) |
| (4) |
Non-linear viscosity.
Lipowsky et al. [41] proposed a model for the apparent viscosity as a function of vessel diameter and hematocrit. Pries offered an alternative parametric description of blood viscosity termed the “in-vitro modified” formula [42,43]. His model predicts that the apparent viscosity decreases with decreasing diameters until d=40μm, below this level viscosity rises again with decreasing diameter. The viscosity model, given in appendix A, is a function of the hematocrit and diameter (A-1), The relative apparent blood viscosity for a fixed discharge hematocrit of 0.45 (or 45%), is given by (A-2), where D is the lumen diameter of the tube. The viscosity dependence shape on hematocrit is applied by the parameter C given by (A-3), is plasma viscosity equal to 0.001 cP.
The complete blood pressure and flow in matrix form [46] is given in Eq.4., where is the resistance matrix dependent on the hematocrit and the vessel diameters, is the connectivity matrix that shows the point’s connections relations in the network, p is the pressure, is the Dirichlet boundary condition for pressure, and A is the diagonal matrix of hydraulic resistances. The binary matrix D encodes the boundary conditions at the outlet nodes: it is an np-by-np diagonal matrix whose value in the (i, i) position is nonzero if i is an outflow node and whose value is , where is the volumetric flow in the adjacent face [46]. The system needs to be solved iteratively, because the hematocrit distribution, h, is initially not known.
2.2. Prediction of the hematocrit field as a convection problem
We showed previously [3] that several prior formulations of plasma skimming predictions do not converge. As a remedy, we proposed a kinematic plasma skimming model (KPSM) that always converges. Moreover, we will show that by assigning an adjusted hematocrit potential H* at each node, the hematocrit fields can be computed as a stationary convection problem, which is guaranteed to have a solution in acyclic network graphs [4].
We model plasma skimming leading to a downstream hematocrit change, by rewriting the red blood cell balance in terms of an adjusted discharge hematocrit, H*, and a kinematic plasma-skimming coefficient, , as indicated in Eq.5. The discharge hematocrit into the side branches is calculated by enforcing the RBC split balance in Eq.6 [51]. These terms indicate hematocrit depletion, and this solution process is illustrated in Fig.1.
Fig 1.

Recovery of the face hematocrit from nodal .
| (5) |
| (6) |
| (7) |
The full Hematocrit (Ht) matrix equation for the steady RBC transport through a blood network is given in Eq. 9 and introduced in [5]. The system can be interpreted as a convection problem in which the desired hematocrit values for each face are calculated by transporting nodal H* values through the network using flow rates that are adjusted by the kinematic plasma skimming coefficient. The effect is that thicker branches with more flow tend to have higher hematocrit compared to the side branches.
| (8) |
| (9) |
| (10) |
| (11) |
In the system defined by equations (7)-(10), the vector , represents the adjusted flow rates, calculated as the product of blood flows at each segment and the skimming coefficient . The coefficient vector is associated with the kinematic plasma-skimming at bifurcations. It is determined by the diameter ratio and is treated as a scalar with m=5.25 [4], representing a drift parameter. The convection matrix given by Here is a vector of positive flows, and is the connectivity matrix. The outlet flow matrix is defined as where is the decision matrix. takes the value 1 for the outlet flow nodes and 0 for the other nodes. Similarly, the inlet flow matrix is given by , with being the decision matrix, where is 1 for the inlet flow nodes and 0 for the other nodes. The vector represents the node Hematocrit. Additionally, is the vector of inlet boundary conditions at time It is non-zero only at inlet nodes, where .
The non-linear system of equations is solved iteratively by a fixed-point scheme [4] to obtain the flow, pressure, and hematocrit field h. First flow and the pressure are calculated using Eq.10. then the obtained flow values are used for calculating hematocrit in Eq.8. Fig.2. summarizes the iterative approaches for all models in a flowchart to show the relationship between flow and hematocrit.
Fig 2.

The flow chart describes the applied model’s implementation to solve for the bulk blood flow, Q, and discharge Hematocrit, . The solution algorithm starts with the flow calculation, updating the diameter-hematocrit dependent resistance with updated hematocrit, and iteration of the process until the difference between new and old reaches a tolerance threshold of .
2.3. Dynamic tracer-convection
The convection of a tracer obeys Eq.12. This species conservation balance states that accumulation equals net flux through the boundary of the balance envelope.
| (12) |
Tracer concentrations is given by the vector concentration for each balance envelope (point) at a time t. Let the components of the vector denote the volume of the finite volume elements and set . The left-hand side tracer accumulation (Eq.12) in each volume can be discretized using implicit Euler methods as in Eq.13. Tracer flux at the inlet and outlet nodes are governed by the volumetric flows in their adjacent faces. The flux into an inlet node adjacent to the face is defined to be where is the time dependent vector of prescribed concentrations at the inlets (arterial input function). In other words, the components of the vector are nonzero only at the inlet nodes, at which points they take on prescribed time dependent boundary values. The flux out of an outlet node adjacent to the face is defined to be . In both cases we stay in accordance with the upwinding scheme by having the concentration at the boundary of a control volume equal that of the upwind node.
| (13) |
Discretization of the convective flux. The convection matrix is given in (14)
| (14) |
where is the diagonal matrix whose diagonal entries are the elements of the flow vector , and the operator applies the operator to each element of the input matrix. Here, denote the vector of flows through the network faces in units of volume per unit time.
Boundary conditions.
The in- and outflow boundary conditions are already included in the discretized formulation of (13). Thus its implementation is declarative without the need for logical statements. Then the flux matrices and be the inlet and outlet convection matrices defined by
| (15) |
| (16) |
Time Integration.
Time discretization can be done by the implicit Euler method as in (17). denote the time step. The superscripts n and o denote the new and the old-time step respectively.
| (17) |
Rearranging Eq.17 we obtain the recipe for computing at the new time-step as the solution to linear system.
| (18) |
2.4. Numerical Verification
The mathematical model is validated against the flow parameters data in several blood networks for flow, pressure, and hematocrit. It is seen that the numerical solution is converged, and the residual value is small enough (less than ), and the mass and Hematocrit continuity at the inlets and the network outlets are conserved. Blood perfusion and simulation of stalling events verifications are compared with the previous studies in the following sections.
Cerebral blood perfusion is measured as the rate of arterial blood supply to the volume of a tissue sample. Cerebral blood flow (CBF) is measured in milliliters of blood per one hundred grams of tissue per minute [5]. According to the definition, the CBF perfusion is the sum of flow rates of all arterial inlets over the voxel volume. Using the variable Ht viscosity model, the CBF was determined to be between 66 and 1.08 (ml/100g/ml). In Table1 and Table2, the cerebral blood perfusion and capillary RBC’s velocity range of the current work, as well as the other reference, are compared; this demonstrates that the current work is within the range of past research studies and can be used as a validation criterion for the remaining simulations.
Table2.
Capillary RBC velocity range.

|
Table 3.
| Symbol | Definition | Units | Value |
|---|---|---|---|
| Apparent viscosity Modified | cP | F(dia, ) | |
| Apparent viscosity Original | cP | F(dia, ) | |
| D | Vessel diameter | Known scalar | |
| Discharge hematocrit | Vol% | Unknown scalar | |
| Viscosity at =0.45 | cP | F(dia, ) | |
| Plasma viscosity | cP | 1.0 |
3. Results
3.1. Structural properties
The modeling and analysis of blood flow in a complex network, including tortuous and random veins, is carried out using the two-photon microscopy mouse cortical microvascular blood network, which is a complex blood network [58]. A network statistics analysis first obtained the morphological information about the mouse cortex, then used in the simulation. In Fig.3, several samples from the mouse cortex are extracted and visualized, in which arteries and veins are shown in red and blue, respectively. Extracted mouse brain sample is categorized into 18 layers to analyze the physiological properties of the network, including the number of vessels, resistance, and the length density, at each volume section of the network with 0.1 mm thickness from the surface to the depth of the blood network.
Fig 3.

The mouse cortex microcirculatory sample networks (a–d). The colors correspond to pressure distribution in the blood network to distinguish the arteries and veins, where arteries are shown in red and veins are in blue. (a1). The visualization of the network (A1) in graph view consists of 39547 vessels and 28015 nodes, (A2) The number of vessels at each layer volume, (A3) The value of the resistance per layer volume, (A4) The value of the length density per volume, along with the network depth for 18 layers.
3.2. Blood simulation
In the extracted sample cube network from the mouse cortex, blood enters the network from the thick pial arterial branches at the pial surface, traverses penetrating arteries and distributes into network of capillaries and is the collected in ascending veins which discharge into the pial veins. We performed path analysis to illustrate changes in blood flow patterns in the mouse cortical vasculature due to stalls. The CBF distribution in the mouse brain is studied along a sample path from the cortex in which blood enters the sample through the penetrating arteries from the pial surface of the mouse cortex and distribution through five capillaries in different depths of the network and collecting via the ascending veins and exit the blood network from the pial veins.
In Fig.4-e, the Hematocrit field is depicted for selected paths; the three longest penetrating arteries from the pial surface to the depth of the blood network, including the one that is shown with a dashed circle in Fig.4-e, are chosen and indicated in Fig.4b-c-d, five pathways are shown in Fig4-a with their respective pressure field distributions. In order to emphasize the selected directed flow pathways, they were picked from the network following a simulation of blood flow and pressure. The entrance pressure is 120 mmHg, while the output pressure is 5 mmHg [52, 4, 47]. Flow analysis reflected that a perfusion pressure drop in the microcirculatory networks from 120 to 5 mmHg (15,999-667 Pa) resulted in a mean tissue perfusion of 68.9 ml/100g/min ( m3/kg/s) which is within experimentally observed ranges [48, 49].
Fig 4.

The simulation result for the flow-directed paths from the mouse brain cortex. (a). Pressure (mmHg) distribution on five selected paths, including all bifurcations along penetrating arteries, capillaries, and ascending veins (b-d). Ht distribution along the main penetrating arteries 1-3, (e) Entire paths Ht with indicating the location of the penetrating artery1. Ht is split in bifurcations along the three longest penetrating arteries; The side branch is shown in the blue circle, the main branch (main) is in the red circle, and the dashed line represents the Ht ideal distribution at (f). Penetrating artery1, (g). Penetrating artery 2, and (h). Penetrating artery 3, where the vertical and horizontal axis shows the sides and main Ht, respectively.
As seen in Fig.4.f-h, at each bifurcation, the Ht from a main branch separates into two side branches, with the main branch (which has a bigger diameter) having a higher Ht concentration than its smaller-diameter counterpart (side branch). Throughout the path analysis procedure, information on the hematocrit distribution at the bifurcations of the penetrating arteries is gathered in detail. This graphic depicts the uneven distribution of the Ht at bifurcations.
Hematocrit is distributed unevenly from the main branch to the side branches of each bifurcation (Ht splitting rule), with the side branch with the larger diameter receiving more Ht than the other side branch. In Fig.4 f-g-h, the dashed line represents the Hematocrit splitting rule at bifurcations, exhibiting the ideal Ht split where Ht is divided evenly at each bifurcation. This shows that the bigger branches (“major branches”) receive a greater proportion of the Ht split, as indicated by the red circles, while the thinnest branches receive a less proportion, as indicated by the blue circles.
In Fig.5, Ht distribution is displayed for all penetrating arteries demonstrating that the value of Ht increases from the pial surface to the depth of penetrating arteries. A 3D display (inlay) illustrates the variation in Ht along the penetrating arteries. The Ht distribution along all penetrating arteries originates from the pial surface downwards into the blood network using the cuboid sample from the mouse brain cortex. the Ht along the penetrating arteries increases in accordance with the Ht splitting rule. This phenomenon could be captured using the kinematic plasma skimming model (KPSM) applied in this study [5].
3.3. Occlusion simulation
Capillaries play an important role in the oxygen delivery and nutrients to the tissues. Capillaries have diameters around 5-10 micrometers which makes them vulnerable to occlusion. Capillary occlusion can lead to reduced blood flow to the surrounding tissues, which can result in ischemia and consequently to tissue damage [32]. Microstrokes are thought to occur primarily at the capillary level [28]. Capillaries have a high surface area-to-volume ratio, which makes them susceptible to occlusion induced changes in blood flow and pressure, Capillaries also lack the smooth muscle cells found in larger vessels, which limits their ability to regulate blood flow and respond to changes in vascular tone [45]. In our simulation study, mouse brain sample cortex blood network (NWK1) was used for studying the effect of capillary stalls.
We performed blood flow, pressure, and Ht simulations on the healthy network (considered a zero-stalled scenario) and on the occluded network with various degrees of occlusions to determine the effect of capillary stalls on hemodynamic parameters. For this study, occlusions were implemented by selecting up to 20% segments at random from the capillary ensemble. The relatively high range of 20% stalls was chosen as in a previous study [29]. To model capillary stalls, the flow resistance in the stalled segments was increased by a factor of 1000 compared to base line resistance.
Fig.6. summarizes simulation results visualizing the occlusion effects on Ht distribution, cerebral blood flow, and rerouted flows in the blood network in 3D view. Fig.6-a. presents the blood pressure field in the healthy blood network tracing blood from the pial surface through the penetrating arteries, the capillary bed and finally leaving the network through the pial veins. As expected, blood flow is reduced with increasing degree of stalls as shown in Fig.6-c which summarizes the change in blood flow caused by stalling of capillaries, the color map from blue to red shows the percentage of the flow change in comparison to the healthy network.
Fig 6.

The 3D images of a portion of the mouse cerebral vasculature, comprising pial arteries, penetrating arteries, capillaries, and ascending and pial veins based on numerical simulations. (a). Pressure field in the healthy blood network (mmHg) (b). Flow reversal in the blood network, shown in red, vessels with no flow reversal are depicted in gray for a 20 percent occlusion; (rerouting occurs at red vessels) (c). Flow changes percentage in all network vessels following a 20 percent network occlusion compared to a healthy network (d). Ht change in percentage following the occlusion of 20 percent of capillary vessels.
In addition to increases in resistance, substantial network effects were observed. Fig6-b. shows flow reversal in large portions of the network in red. The large number of segments with changes in flow direction are indicative of blood flow redistribution and rerouting in the capillary bed, in effect following alternative paths that by-pass the occluded vessels to convey blood past the obstruction.
The Ht simulation presented in Fig.6-d shows that Ht change occurs mainly in vessels located in deeper in the cortical mantle.
We also tracked the effect of stalls on flow paths in the network and hematocrit variation in neighboring paths. Five typical paths from the inlet to outlet, each with a different depth from the pial surface, are selected for illustrating typical trends. Each path has numerous side branches and only the routes that include the vessels that direct blood from the inlet to the outlet of the network are selected and visualized. After the occlusion of each path, the effect of the Ht change on the other paths in the network is visualized in Fig 7. The red and gray vessels show Ht reduction or increase after the occlusion, respectively. The Ht variation with increasing and decreasing RBC flux densities in each path result from vessel occlusion as depicted in Fig.7.a-e.
Fig 7.

Variations in hematocrit (Ht) correspond to the occluded vessels shown by the small black square at each path. (a-e). Variation of Ht at each occluded vessel neighbors, Ht increase (+) and decrease (−) shown in red, and gray, respectively. (f). The statistical variation of the Ht along each path after occlusion and the percentage amount of the Ht vessels increase and decrease after occlusion, where the paths are shown in Fig6.a.
The variation of the Ht at each path is depicted in Fig.7.f (paths are also shown in Fig.6.a). The bar plot shows the proportion of vessels that encountered the increase and decrease in Ht along each path, shown in blue and red, respectively.
3.4. Effect of stalls on micro circular network integrity and tracer transit
We compared flow changes due to stalls to connected component analysis (CCA) presented previously [59]. Connectivity component analysis allows to ascertain the extent to which occlusion impairs network connectivity and cortical blood perfusion. Two experiments were undertaken: the first involved randomly stalling all vessels up to 20%, while the second specifically focused on capillary stall. Our results reproduce findings by Kleinfeld [59], according to which occlusion in fraction of 0.425 led to a complete disconnection of the network.
Flow reduction due to stalls was more severely affected than that suggested by the CCA. Total flow changes (=total fluxes from inlets to outlets) for different occlusion levels are depicted in Fig.8. Moreover, the trends in flow decrease were found to become gradually more nonlinear probably due to the nonlinearity in the viscosity law. The blood flow decreases steadily beyond 2 percent occlusion. Insufficient perfusion leading to eventual circulation failure in the network seems to occur beyond 10 percent occlusion; this phenomenon can also be seen in the tracer convection simulation by the increase of the tracer concentration in the network.
Fig 8.

Simulation of stalling effect on cerebral blood flow and analysis of connected components. (a). Inlet blood flow reduction for different levels of occlusions. (b). The blood network’s largest component connection for varying occlusion ratios [occlusion limited to the capillary bed (orange profile); stalls for all vessels (blue profile)].
Tracer transit simulations.
Tracer convection simulations were carried out using the relations in Eq. (12) of section 2.3 to capture the effect of stalling on transport phenomena. With increasing occlusion levels, flow decreased as expected because stalls augment overall resistance to flow. Further results listed in Appendix B further suggest that mean transit times for the whole voxel signal shifted, but a clear trend could not be established in the preliminary analysis. This subtle response might be due to the combined effect of lower flow with concomitant reduction in the intravascular volume accessible to flow. Thus, two competing influences of blood volume (CBV) and blood flow (CBF) have their effect on transit time. We also observed a slight increase in mean hematocrit distribution.
3.4. In-vivo validation of transit time shifts after microvascular stall
To support our predictions, a preliminary experimental validation of micro stalls is reported here comparing mice (control) with specimen treated with LPS challenge (LPS mice) which causes systemic inflammation group [60]. In brief, the impact of intraperitoneal lipopolysaccharide (LPS) injection-induced systemic inflammation on cerebral vasculature and microcirculation in mice was examined by investigating shifts in the transit time from pial arteries to pial veins. Experimental measurements of transit times in both pial arteries and pial veins are graphically represented in Fig. 9. The data show an increase in arteriovenous transit time in arteries and veins in the stall group compared to the control group.
Fig 9.

Quantification of the duration required for blood to traverse the arteriovenous network. The arteriovenous transit time in the current work before (control) and after stall simulation up to 10% stall and, experimental study up to 8% stall, the stall group shows a notably longer average arteriovenous transit time in comparison to the control group [61].
In our simulations for control mice, the in vivo measured transit time differences were determined to be 0.45 ± 0.1 s. Notably, in the stall mouse cohort, this value exhibited an increase to 0.69 ± 0.12 s, as quantified and illustrated in Fig.9, which presents the arteriovenous transit time for both the simulations and the experiment. Our simulation results show that stalls increased arterial to venous transit time, a trend that was matched in stall mouse experiments which experiences a significant increment when compared to the control group [60].
4. Discussion
This paper investigates the impact of capillary stalls on hemodynamics properties including the flow, pressure, hematocrit, transit time, and tracer convection for the mouse cortex samples.
Single vessel stalls induce no significant perfusion deficits owing to redundancy in the capillary network and its capacity to redirect blood flow in response to minor obstructions. However, mechanistic simulations indicate that elevated stall levels (more than 2% stalled capillaries) may impair perfusion of the entire network, when no compensatory mechanisms are in place, which were not accounted for in our simulations. Stalling vessels well below a fraction of 0.425 of the whole capillaries led to the collapse of the blood flow in all network simulations blood flow in the network stopped completely at much lower levels than suggested by percolation limit (approximately 0.425 stalled vessel fraction).
We reported that stalling also induces substantial network effects of rerouted capillary flow directions. Capillary stalls cause flow reversals in a significant portion of the capillary network. The ability to reroute flows to alternative paths around occluded vessels available in a healthy brain may decrease with age. Consequently, it is essential to further analyze the redirected channels to determine the probability of blood flow path replacement due to blockage is.
In addition to rerouted flows, stalling altered Ht distribution. Normally, Ht is higher in the main branch of the penetrating arterioles with smaller Ht levels inside branches. We further quantified the Ht distribution changes with path analysis by tracking flow from the penetrating artery (PA) along different capillary depths leading to ascending vein (AV). We found that Ht levels increased in penetrating arteries downwards into the depth of the blood network [4]. The redirection of the blood flow also induces Ht shifts (increase and decrease) at the upstream and downstream of the occluded vessels. Simulations showed a higher mean in Ht levels and higher heterogeneity of RBC distribution. The results indicate that Ht changes occur at the small vessels at the capillary level.
To test whether stall can be detected by in vivo fluorescence imaging we performed simulated transit time of tracer perfusion experiments. In virtual tracer infusion simulations, we recorded difference in time-to-peak in pial arteries and in pial veins. We detected an increase of 0.24 s from 0.45 ± 0.1 s in the control group to 0.69 ± 0.12 s in the stalled mouse cohort. The predictions matched our preliminary experimental evaluation of transit time shifts in both pial arteries and pial veins (control: 0.62 ± 0.11, stall: 0.84 ± 0.09). The agreement of results from both simulation and experimentation underscores the possibility of detecting stalls with in vivo transit time measurements. Such metric would be an important biomarker for the presence of capillary stalls.
Fig 5.

The hematocrit (Ht) increases along the penetrating arteries from the pial surface toward the depth of the network using four different mouse brain cortex samples. The plotted Ht for all penetrating arteries. Alongside the 3D visualization of the penetrating arteries and their position in the blood network.
Table 4.
The Mean and the standard deviation of Hematocrit (Ht), Mean Transit Time (MTT), and Blood Flow.
| No-Occlusion | 1% | 2% | 5% | 10% | 20% | ||
|---|---|---|---|---|---|---|---|
| Ht | 0.356 | 0.356 | 0.356 | 0.358 | 0.359 | 0.364 | |
| 0.052 | 0.049 | 0.048 | 0.054 | 0.051 | 0.057 | ||
| 1.74 | 1.77 | 1.75 | 1.72 | 1.68 | 1.44 | ||
| 8.84 | 10.60 | 9.18 | 9.94 | 9.43 | 4.33 | ||
| Flow [] | 37644.8 | 37462.9 | 37272.0 | 36511.9 | 35658.2 | 32891.3 | |
| 263448.7 | 262465.9 | 261483.7 | 257252.6 | 251694.9 | 233991.4 | ||
Acknowledgement:
This work was supported in part by the NIH National Institute of Health, Neurological Disorders and Stroke (https://www.ninds.nih.gov) under Grant number NIH NINDS 1R21NS099896. And the National Institute of Health, National Institute of Aging (https://www.nia.nih.gov) under grant NIH NIA1R56AG066634-01 and NIH NINDS U19NS123717.
Appendices:
Appendix-A.
| (A-1) |
| (A-2) |
| (A-3) |
Appendix-B. Transit time shifts in tracer convection simulation.
Tracer convection simulations were carried out using the relations in Eq. (20) of section 2.3 to capture the effect of stalling on the transport phenomena; the tracer is injected into the blood network from the inlet pial arteries by using an arterial input function (AIF) equal to a Dirac delta function. The outlet concentration curve then approximates the impulse response function of the entire network. The mean transit time (MTT) and transit time heterogeneity (TTH) in Table 4 are thus computed as the first and second moments of .
Table1.
CBF perfusion range.

|
| (B-1) |
| (B-2) |
In Fig. 10 a-b, a statistical analysis was conducted for the flow and Ht, associated with the occluded network. Flows through vessels tend to decrease with severity of occlusions as in Fig.10-a. There is also an increase in the mean of Ht distribution shown in Fig.10-b. Moreover, Fig.10-c. shows the impulse response function, for different levels of stalling. The means and variances of flow and Ht are collected in Table 4.
Fig 10.
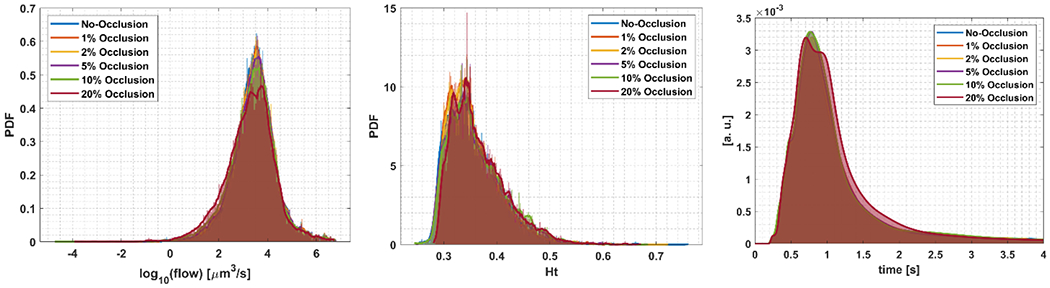
(a) A semilog plot of the probability density functions of the flow in the network for different occlusion percentages, (b) the probability density functions of Ht, (c) the impulse response functions which form the basis of the transit time analysis in Table 4.
Footnotes
Ethical statement with approval date:
There were no human or animal subjects.
Data Availability Statement:
The collaborative laboratories (co-authors) supplied the experimental source data for this study. Access to the experimental source data is available through the references provided in the Methods section and open-source public repositories. Samples of synthetic network data are available at https://github.com/LPPDAdmin
References:
- [1].Yang R, Wang A, Ma L, Su Z, Chen S, Wang Y, Wu S, Wang C. Hematocrit and the incidence of stroke: a prospective, population-based cohort study. The Clin Risk Manag, 14:2081–2088, (2018). [DOI] [PMC free article] [PubMed] [Google Scholar]
- [2].Chen SH, Bu XL, Jin WS, Shen LL, Wang J, Zhuang ZQ, Zhang T, Zeng F, Yao XQ, Zhou HD, Wang YJ. Altered peripheral profile of blood cells in Alzheimer disease: A hospital-based case-control study. Medicine (Baltimore), 96(21), (2017). [DOI] [PMC free article] [PubMed] [Google Scholar]
- [3].Gould Ian G., and Linninger Andreas A.. “Hematocrit distribution and tissue oxygenation in large microcirculatory networks.” Microcirculation 22, no. 1, 1–18, (2015). [DOI] [PubMed] [Google Scholar]
- [4].Hartung Grant, Vesel Claudia, Morley Ryan, Alaraj Ali, Sled John, Kleinfeld David, and Linninger Andreas. “Simulations of blood as a suspension predict a depth-dependent hematocrit in the circulation throughout the cerebral cortex.” PLoS computational biology 14, no. 11 (2018). [DOI] [PMC free article] [PubMed] [Google Scholar]
- [5].Gould Ian Gopal, Tsai Philbert, Kleinfeld David, and Linninger Andreas. “The capillary bed offers the largest hemodynamic resistance to the cortical blood supply.” Journal of Cerebral Blood Flow & Metabolism 37, no. 1,52–68, (2017). [DOI] [PMC free article] [PubMed] [Google Scholar]
- [6].Damseh Rafat, Lu Yuankang, Lu Xuecong, Zhang Cong, Marchand Paul J., Corbin Denis, Pouliot Philippe, Cheriet Farida, and Lesage Frederic. “A simulation study investigating potential diffusion-based MRI signatures of microstrokes.” Scientific Reports 11, no.1, 1–15. (2021). [DOI] [PMC free article] [PubMed] [Google Scholar]
- [7].1. Kochanek Kenneth D et al. “Deaths: Final Data for 2014.” National vital statistics reports: from the Centers for Disease Control and Prevention, National Center for Health Statistics, National Vital Statistics System; vol. 65,4, 1–122 (2016). [PubMed] [Google Scholar]
- [8].Matthews Kevin A et al. “Racial and ethnic estimates of Alzheimer’s disease and related dementias in the United States (2015-2060) in adults aged ≥65 years.” Alzheimer’s & dementia: the journal of the Alzheimer’s Association vol. 15,1, 17–24. (2019). [DOI] [PMC free article] [PubMed] [Google Scholar]
- [9].Tejada-Vera Betzaida. “Mortality from Alzheimer’s disease in the United States: data for 2000 and 2010.” NCHS data brief ,116, ): 1–8 (2013). [PubMed] [Google Scholar]
- [10].Hartung Grant, Badr Shoale, Moeini Mohammad, Lesage Frédéric, Kleinfeld David, Alaraj Ali, and Linninger Andreas. “Voxelized simulation of cerebral oxygen perfusion elucidates hypoxia in aged mouse cortex.” PLoS computational biology 17, no. 1 (2021). [DOI] [PMC free article] [PubMed] [Google Scholar]
- [11].Hasher L & Zacks RT Working Memory, Comprehension, and Aging: A Review and a New View. In Psychology of Learning and motivation (ed. Bower Gordon H.) Volume 22, 193–225 (Academic Press, 1988). [Google Scholar]
- [12].Salthouse T The processing-speed theory of adult age differences in cognition. Psychol. Rev. 103, 403–28 (1996). [DOI] [PubMed] [Google Scholar]
- [13].Bertsch K et al. Resting cerebral blood flow, attention, and aging. Brain Res. 1267, 77–88 (2009). [DOI] [PubMed] [Google Scholar]
- [14].Eustache F et al. Healthy aging, memory subsystems, and regional cerebral oxygen consumption. Neuropsychologia 33, 867 887 (1995). [DOI] [PubMed] [Google Scholar]
- [15].Kalaria RN Cerebral vessels in aging and Alzheimer’s disease. Pharmacol. Ther 72, 193–214 (1996). [DOI] [PubMed] [Google Scholar]
- [16].Shih AY, Blinder P, Tsai PS, Friedman B, Stanley G, Lyden PD, Kleinfeld D. The smallest stroke: occlusion of one penetrating vessel leads to infarction and a cognitive deficit. Nature Neuroscience 16:55–63 (2013). [DOI] [PMC free article] [PubMed] [Google Scholar]
- [17].Zhang Q, Lan Y, He XF, Luo CM, Wang QM, Liang FY, Xu GQ, Pei Z. 2015. Allopurinol protects against ischemic insults in a mouse model of cortical microinfarction. Brain Research 1622:361–367 (2015). [DOI] [PubMed] [Google Scholar]
- [18].Taylor ZJ, Hui ES, Watson AN, Nie X, Deardorff RL, Jensen JH, Helpern JA, Shih AY. Microvascular basis for growth of small infarcts following occlusion of single penetrating arterioles in mouse cortex. Journal of Cerebral Blood Flow & Metabolism 36:1357–1373 (2016). [DOI] [PMC free article] [PubMed] [Google Scholar]
- [19].Summers PM, Hartmann DA, Hui ES, Nie X, Deardorff RL, McKinnon ET, Helpern JA, Jensen JH, Shih AY. Functional deficits induced by cortical microinfarcts. Journal of Cerebral Blood Flow & Metabolism 37:3599–3614 (2017). [DOI] [PMC free article] [PubMed] [Google Scholar]
- [20].Underly RG, Levy M, Hartmann DA, Grant RI, Watson AN, Shih AY. 2017. Pericytes as inducers of rapid, matrix Metalloproteinase-9-Dependent capillary damage during ischemia. The Journal of Neuroscience 37:129–140. (2017). [DOI] [PMC free article] [PubMed] [Google Scholar]
- [21].Nishimura N, Schaffer CB, Friedman B, Tsai PS, Lyden PD, Kleinfeld D. Targeted insult to subsurface cortical blood vessels using ultrashort laser pulses: three models of stroke. Nature Methods 3:99–108, (2006). [DOI] [PubMed] [Google Scholar]
- [22].Wang M, Ding F, Deng S, Guo X, Wang W, Iliff JJ, Nedergaard M. 2017. Focal solute trapping and global glymphatic pathway impairment in a murine model of multiple microinfarcts. The Journal of Neuroscience 37: 2870–2877, (2017). [DOI] [PMC free article] [PubMed] [Google Scholar]
- [23].Wang M, Iliff JJ, Liao Y, Chen MJ, Shinseki MS, Venkataraman A, Cheung J, Wang W, Nedergaard M. 2012. Cognitive deficits and delayed neuronal loss in a mouse model of multiple microinfarcts. Journal of Neuroscience 32:17948–17960, (2012). [DOI] [PMC free article] [PubMed] [Google Scholar]
- [24].Nozari A, Dilekoz E, Sukhotinsky I, Stein T, Eikermann-Haerter K, Liu C, Wang Y, Frosch MP, Waeber C, Ayata C, Moskowitz MA. Microemboli may link spreading depression, migraine aura, and patent foramen ovale. Annals of Neurology 67:221–229, (2010). [DOI] [PMC free article] [PubMed] [Google Scholar]
- [25].Silasi G, She J, Boyd JD, Xue S, Murphy TH. A Mouse Model of Small-Vessel Disease that Produces Brain- Wide-Identified Microocclusions and Regionally Selective Neuronal Injury. Journal of Cerebral Blood Flow & Metabolism 35:734–738, (2015). [DOI] [PMC free article] [PubMed] [Google Scholar]
- [26].Blinder P, Tsai PS, Kaufhold JP, Knutsen PM, Suhl H, Kleinfeld D. 2013. The cortical angiome: an interconnected vascular network with noncolumnar patterns of blood flow. Nature Neuroscience 16:889–897, (2013). [DOI] [PMC free article] [PubMed] [Google Scholar]
- [27].Nishimura N, Schaffer CB, Friedman B, Lyden PD, Kleinfeld D. Penetrating arterioles are a bottleneck in the perfusion of neocortex. PNAS 104:365–370, (2007). [DOI] [PMC free article] [PubMed] [Google Scholar]
- [28].Schmid F, Conti G, P. Jenny B. Weber The severity of microstrokes depends on local vascular topology and baseline perfusion. ELife, 10 (2021). [DOI] [PMC free article] [PubMed] [Google Scholar]
- [29].Cruz Hernández JC, Bracko O, Kersbergen CJ et al. Neutrophil adhesion in brain capillaries reduces cortical blood flow and impairs memory function in Alzheimer’s disease mouse models. Nat Neurosci 22, 413–420 (2019). [DOI] [PMC free article] [PubMed] [Google Scholar]
- [30].El Amki M, Glück C, Binder N, Middleham W, Wyss MT, Weiss T, Meister H, Luft A, Weller M, Weber B, Wegener S. Neutrophils obstructing brain capillaries are a major cause of No-Reflow in ischemic stroke. Cell Reports 33:108260, (2020). [DOI] [PubMed] [Google Scholar]
- [31].Erdener SE, Tang J, Kılıc K, Postnov D, Giblin JT, Kura S, Chen IA, Vayisoğlu T, Sakadžic S, Schaffer CB, Boas DA. Dynamic capillary stalls in reperfused ischemic penumbra contribute to injury: a hyperacute role for neutrophils in persistent traffic jams. Journal of Cerebral Blood Flow and Metabolism 41:236–252, (2021). [DOI] [PMC free article] [PubMed] [Google Scholar]
- [32].Menger MD, Jaeger S, Walter P, & Hammersen F Microvascular ischemia-reperfusion injury in striated muscle: significance of “no-reflow” phenomenon. Journal of Surgical Research, 52(4), 387–393. doi: 10.1016/0022-4804(92)90169-p, (1992). [DOI] [Google Scholar]
- [33].Metea MR, & Newman EA Glial cells dilate and constrict blood vessels: a mechanism of neurovascular coupling. Journal of Neuroscience, 26(11), 2862–2870. doi: 10.1523/JNEUROSCI,(2006). [DOI] [PMC free article] [PubMed] [Google Scholar]
- [34].Iadecola C The neurovascular unit coming of age: a journey through neurovascular coupling in health and disease. Neuron;96(1):17–42. doi: 10.1016/j.neuron.2017.07.030, (2017). [DOI] [PMC free article] [PubMed] [Google Scholar]
- [35].Liu X, Wang S, Yi M, et al. Neurovascular coupling: structure and function in health and disease. Front Physiol. 10:1082. doi: 10.3389/fphys. (2019).31507446 [DOI] [Google Scholar]
- [36].Tarantini S, Tran CHT, Gordon GR. Ungaro Global Neurovascular Unit: Basic and Clinical Studies. Springer;. doi: 10.1007/978-3-030-29211-9 (2020). [DOI] [Google Scholar]
- [37].Leisman G, Braun-Benjamin O, Melillo R, et al. Multimodal noninvasive brainstem neuromodulation reverses disease in a mouse model of Parkinson’s disease. Sci Adv;7(10):eabe9407. doi: 10.1126/sciadv.abe9407, (2021). [DOI] [Google Scholar]
- [38].Cheng JY, Shih YI, Chen YT, et al. A computational model of cerebral oxygen transport and metabolism under hypoxia and hyperoxia. Med Eng Phys,;72:36–44. doi: 10.1016/j.medengphy (2019). [DOI] [Google Scholar]
- [39].Kiani MF, & Cutaia MV Modeling and simulation of blood flow and oxygen transport in the microcirculation. Critical Reviews in Biomedical Engineering, 39(3), 235–261, (2011). [Google Scholar]
- [40].Mantegazza A, Clavica F, & Obrist D. In vitro investigations of red blood cell phase separation in a complex microchannel network. Biomicrofluidics, 14(1), 014101 (2020). [DOI] [PMC free article] [PubMed] [Google Scholar]
- [41].Lipowsky HH, Usami S, Chien S. In vivo measurements of “apparent viscosity” and microvessel hematocrit in the mesentery of the cat. Microvasc Res. 19(3):297–319 (1980). [DOI] [PubMed] [Google Scholar]
- [42].Pries AR, Secomb TW, Gessner T, Sperandio MB, Gross JF, Gaehtgens P. Resistance to blood flow in microvessels in vivo. Circ Res, 75(5):904–15, (1994). [DOI] [PubMed] [Google Scholar]
- [43].Pries AR, Secomb TW, Gaehtgens P. Biophysical aspects of blood flow in the microvasculature. Cardiovasc Res. Oct 1;32(4):654–67 (1996). [PubMed] [Google Scholar]
- [44].Cruz Hernández Jean C., Bracko Oliver, Kersbergen Calvin J., Muse Victorine, Mohammad Haft-Javaherian Maxime Berg, Park Laibaik et al. “Neutrophil adhesion in brain capillaries reduces cortical blood flow and impairs memory function in Alzheimer’s disease mouse models.” Nature neuroscience 22, no. 3: 413–420, (2019). [DOI] [PMC free article] [PubMed] [Google Scholar]
- [45].Mchedlishvili G. Microcirculation of the brain. In Handbook of Physiology, The Cardiovascular System, Vol. IV, Microcirculation (pp. 773–800). American Physiological Society. (1982) [Google Scholar]
- [46].Park Chang S., Hartung Grant, Alaraj Ali, Du Xinjian, Charbel Fady T., and Linninger Andreas A.. “Quantification of blood flow patterns in the cerebral arterial circulation of individual (human) subjects.” International journal for numerical methods in biomedical engineering 36, no. 1, e3288 (2020). [DOI] [PubMed] [Google Scholar]
- [47].Hartung G, Alaraj A, Linninger A. Chapter 21 - Walk-In Brain: Virtual Reality Environment for Immersive Exploration and Simulation of Brain Metabolism and Function. In: Martín M, Eden MR, Chemmangattuvalappil NG, editors. Computer Aided Chemical Engineering. Elsevier; p. 649–58. (Tools For Chemical Product Design; vol. 39), (2016). [Google Scholar]
- [48].Peyrounette M, Davit Y, Quintard M, Lorthois S. Multiscale modelling of blood flow in cerebral microcirculation: Details at capillary scale control accuracy at the level of the cortex. PLOS ONE;13(1):e0189474, (2018). [DOI] [PMC free article] [PubMed] [Google Scholar]
- [49].El-Bouri WK, Payne SJ. Multi-scale homogenization of blood flow in 3-dimensional human cerebral microvascular networks. J Theor Biol. ;380:40–7, (2015). [DOI] [PubMed] [Google Scholar]
- [50].Billett HH. Hemoglobin and Hematocrit. In: Walker HK, Hall WD, Hurst JW, editors. Clinical Methods: The History, Physical, and Laboratory Examinations. 3rd edition. Boston: Butterworths; Chapter 151. Available from: https://www.ncbi.nlm.nih.gov/books/NBK259/, (1990). [PubMed] [Google Scholar]
- [51].Gould IG, and Linninger AA. “Hematocrit distribution and tissue oxygenation in large microcirculatory networks.” Microcirculation vol. 22: 1–18, (2015). [DOI] [PubMed] [Google Scholar]
- [52].Xu K, Radhakrishnan K, Serhal A, et al. In: LaManna JC (ed.) Oxygen transport to tissue XXXII, Springer ScienceþBusiness Media, (2011). [Google Scholar]
- [53].Maeda K, Mies G, Olah L, et al. Quantitative measurement of local cerebral blood flow in the anesthetized mouse using intraperitoneal [C-14] iodoantipyrine injection and final arterial heart blood sampling. J CerebBlood Flow Metab; 20: 10–14, (2000). [DOI] [PubMed] [Google Scholar]
- [54].Gertz K, Priller J, Kronenberg G, et al. Physical activity improves long-term stroke outcome via endothelial nitric oxide synthase-dependent augmentation of neovascularization and cerebral blood flow. Circ Res 99:1132–1140 (2006). [DOI] [PubMed] [Google Scholar]
- [55].Unekawa M, Tomita M, Tomita Y, et al. RBC velocities in single capillaries of mouse and rat brains are the same, despite a 10-fold difference in body size. Brain Res; 1320: 69–73, (2010). [DOI] [PubMed] [Google Scholar]
- [56].Hudetz AG, Feher G and Kampine JP. Heterogeneous autoregulation of cerebrocortical capillary flow: evidence for functional thoroughfare channels? Microvasc Res; 51: 131–136, (1996). [DOI] [PubMed] [Google Scholar]
- [57].Kleinfeld D, Mitra PP, Helmchen F, et al. Fluctuations and stimulus-induced changes in blood flow observed in individual capillaries in layers 2 through 4 of rat neocortex. Proc Natl Acad Sci USA; 95: 15741–15746, (1998). [DOI] [PMC free article] [PubMed] [Google Scholar]
- [58].Blinder Pablo, Tsai Philbert S., Kaufhold John P., Knutsen Per M., Suhl Harry, and Kleinfeld David. “The cortical angioma: an interconnected vascular network with noncolumnar patterns of blood flow.” Nature Neuroscience 16, no. 7, 889–897, (2013). [DOI] [PMC free article] [PubMed] [Google Scholar]
- [59].Ji Xiang, Ferreira Tiago, Friedman Beth, Liu Rui, Liechty Hannah, Bas Erhan, Chandrashekar Jayaram, and Kleinfeld David. “Brain microvasculature has a common topology with local differences in geometry that match metabolic load.” Neuron 109, no. 7, 1168–1187, (2021). [DOI] [PMC free article] [PubMed] [Google Scholar]
- [60].Zhang Cong, Delafontaine-Martel Patrick, Jamshidi Mohammad, Linninger Andreas A, Lesage Frédéric , Evaluation of cerebral microcirculation in a mouse model of systemic inflammation, to be submitted (2023). [DOI] [PMC free article] [PubMed]
Associated Data
This section collects any data citations, data availability statements, or supplementary materials included in this article.
Data Availability Statement
The collaborative laboratories (co-authors) supplied the experimental source data for this study. Access to the experimental source data is available through the references provided in the Methods section and open-source public repositories. Samples of synthetic network data are available at https://github.com/LPPDAdmin