

Abstract
The present study aimed to elucidate the short term biodistribution of nano sized graphene oxide (GO) along with the toxicological assessment under in-vivo condition with an intent to analyse the toxic effects of sudden accidental exposure of GO The synthesised GO was characterized using UV-Visible spectroscopy, XRD, FTIR, Raman spectroscopy, TGA and DLS. The morphological imaging was performed using SEM, TEM and AFM. With a lateral size of less than 300 nm, these nanoparticles exhibit significant organ barrier permeability of up to 20%. Upon acute exposure to 10 mg/kg dose of ICG-tagged GO nanoflakes through intravenous route, various organs such as kidney, spleen and liver were observed, and the nanoparticles predominantly accumulated in the liver upon 24 h of exposure. Upon confirming the accumulation of these particles in liver through IVIS imaging, our next attempt was to analyse various biochemical and serum parameters. An elevation in various serum parameters such as ALT, AST, Creatinine and Bilirubin was observed. Similarly, in the case of biochemical parameters tested in liver homogenates, an increase in NO, Catalase, GSH, SOD, ROS, LPO, GR, GPx, and GST was observed. This study highlights the potential toxicological risk associated with GO exposure which must be taken into account for any risk analysis associated with GO based consumer products and the occupational hazards.
Keywords: graphene oxide, liver, kidney, biodistribution, serum, biochemical parameters
Graphical Abstract
Graphical Abstract.

Introduction
The advent of the new era of nanotechnology is expected to bring technological advancements and benefits to mankind. With the advancement of the nanotechnology, there is an immense increase in the fabrication and uses of various nanomaterials (NMs) in a wide range of applications in science, technology and medicine. Amongst all these NMs, Graphene oxide (GO) has attracted the most extensive interest of scientists across the globe because of its phenomenal physical and chemical properties. GO is a layered NM having single to few atomic layers and can be produced by oxidising the natural graphite crystals which are abundantly available at low cost.1 Material scientists are extensively exploring its applications in various technologies due to GO being analogous to and cheaper than Graphene. Presently, GO is being immensely fabricated and used in various industries for synthesizing new composite materials and also used in various consumer products such as mobile display screens, smart textiles, water filters, solar cells etc. Reports indicate that the global market share of Graphene based consumer products might increase to USD 609 by 2030.2
Apart from material scientists, biologists are also equally interested in this wonder material due to the presence of different functional groups like -H, -OH and –O that makes GO capable of functionalizing a variety of biomolecules and drugs. Its high surface area is an added quality making it a potential candidate as a drug carrier.3 GO, both pristine and functionalized, has been reported to have diverse advantages as drug carrier due to its efficient drug loading capacity and control over drug release.1,4,5
Despite of having tremendous possibilities in various fields of technology and medicine, concerns relating to its biosafety are paramount as the indiscriminate usage of such NMs can potentially deteriorate the living conditions for humans through exposures whether incidental (in work places/through consumer products) or deliberate (through biomedical applications). A number of studies have been conducted to explore the toxicity of GO of varied sizes using different cell lines such as HeLa,6 human neuroblastoma SH-SY5Y cells,7 human lung fibroblasts,8 human dermal fibroblasts,9 Macrophages, Lung cells10 and many more, but a common consensus on the safety and biocompatibility of GO is still lacking.
Chang et al, in their in vitro study on A549 cells, showed that GO does not internalize into cells at doses as high as 200 μg/mL and claimed it to be biocompatible, however they reported increased oxidative stress and cell mortality at higher doses.11 In contrast to Chang et al, Lammel et al reported internalization of GO into HepG2 cells causing damages to the plasma membrane and resulting in apoptosis at doses as high as 16 μg/mL.12
Similarly, a number of in vivo studies have also been conducted for the GO toxicity assessments. However here too exists the lack of conclusive insight regarding safety of GO. For example, Patlolla et al., reported the toxicity of GO in Sprague-Dawley (SD) rats in kidneys. GO significantly increased the activities of SOD, Catalase and GPx.13 In another study, Li et al., treated SD male rats with 2.5, 5 and 10 mg/kg GO for seven days and the behavioural patterns along with tissue biochemistry was analysed. Though no change in behavioural aspect was noted, but GO caused inflammation of the lung, liver and spleen.14 In case of studies with mice, Patlolla et al,15 and Wang et al,8 in different toxicological settings, have reported GO induced toxicities in form of inflammation, apoptosis and granuloma formations. Contrary to these, Ali-Boucetta et al reported GO to be safe as no inflammation or granuloma formation was found in C57BL/6 mice after a 50 mg/kg dose of GO injected intraperitoneally.16
Considering the inconclusive and mixed reports regarding its biosafety in biological systems, this study has been carried out to assess the short term biodistribution of intravenously injected nano-sized GO in SD rats followed by the toxicity assessments by testing various serum and biochemical parameters. The basic aim of this study was to investigate the short-term toxicity of GO at a high concentration in order to better understand the pathophysiology of GO exposure in case of accidental spillage scenarios.
Materials and methods
Chemicals and reagents
Graphite, sulphuric acid, orthophosphoric acid, potassium permanganate and Griess Reagent was procured from SRL Laboratories, Mumbai, India. Indocyanine Green (ICG) was procured from Sigma, India. DCFDA probe was procured from Cayman Chemicals, USA. Alanine amino transaminase (ALT), aspartate aminotransferase (AST), Blood Urea Nitrogen (BUN), Creatinine, Nitric oxide (NO), Lipid peroxidation (LPO), Lactate Dehydrogenase (LDH), Reactive Oxygen Species (ROS), Glutathione Peroxidase (GPx), Glutathione Reductase (GR), Glutathione-S-Transferase (GST), Glutathione (GSH) and Catalase were estimated using Reckon diagnostics kits, Vadodara, India. All other chemicals and reagents used in this study were procured from the local vendors.
Synthesis of graphene oxide
Graphene oxide (GO) was synthesized from natural graphite using improved Hummers’ method.17 In brief, 1 g graphite powder was stirred in a mixture of sulphuric acid and orthophosphoric acid (9:1 ratio) for 30 min. Then potassium permanganate was added while keeping the temperature below 20 °C, thereafter the mixture was stirred for 8–12 h at 55 °C. The reaction was stopped by adding ice cold distilled water (DW) and hydrogen peroxide. The product was washed in a sequential order by hydrochloric acid, ethanol and DW. The final product was neutralized (pH 6.5-7.0) through continuous washing with DW followed by dialysis to remove all ionic impurities.
Characterization of graphene oxide
The synthesized GO was further characterized in order to determine its aromaticity, chemical structure (including defect and interlaying spacing), presence of requisite functional groups, flake height and lateral size, morphology, distribution and thermal stability. These parameters were studied through the characterization techniques described below.
The optical properties of GO was assessed by UV-Visible spectroscopy as described by Emiru and Ayele.18 Briefly, the absorbance of 0.4 mg/mL of GO was acquired from 200–800 nm using Shimadzu UV-2700 UV-Visible Spectrophotometer. The interplanar distance between the sheets of graphene oxide was calculated using X-Ray Diffraction (XRD- BRUKER, ecoD8 ADVANCE) by running a scan between 2θ (10–50),as described19 Fourier transform infrared (FTIR) (Thermo Scientific Nicolet S5) spectroscopy confirmed the oxidation state of GO by showing characteristic peaks of oxygenated groups, as described by Ciplak et al.20 Formation of GO was further evaluated by detecting the molecular vibration present in the material through Raman Spectroscopy (Alpha300 R, Oxford Instruments), as described by Kudin et al.21 Atomic Force Microscopy (Bruker multimode 8) measured the thickness and lateral dimensions of GO flakes, as described by Ming et al.22 The size distribution profile of GO in aqueous suspension was determined by Particle size analyser (Nano ZSP, ZEN5600, Malvern Instrument). Scanning Electron Microscopy (SEM) (JEOL IT 300; Tokyo, Japan) and Transmission Electron Microscopy (TEM) (JEOL JEM-2100) confirmed the morphology of GO flakes, as described by Stobinski et al.19 Thermal stability of GO was determined through Thermogravimetric Analysis (TGA) (TA Instruments TGA Q500), as described by.23
Parallel artificial membrane permeability assay (PAMPA)
The transcellular passive permeability of GO was estimated in vitro, using a piON™ PAMPA assay to mimic blood–brain barrier. 10 mM stock solution of the permeable drug, propranolol was prepared in DMSO. Further, Prisma buffer was also used for diluting the stock solutions of control and GO (100 μg/mL) to prepare secondary stock solutions. PAMPA sandwich was separated and sample solutions, 200 μL each sample (concentrations) was added to the donor wells. 5 μL aliquots of Pion artificial membrane forming lipid solution was dispensed on the sandwich membrane of the acceptor plate and then the acceptor plate was very carefully placed above the donor plate to form PAMPA “sandwich”. 200 μL of Brain Sink Buffer was added into all wells of the acceptor plate. Tests compounds diffused from the donor compartment through the lipid membrane and into the acceptor compartment. PAMPA “sandwich” was left untouched for 4 h for the proper permeation. Concentration of GO in the acceptor, donor, and the reference compartments was determined using the UV plate reader and percentage permeability was quantified as per the formula given below.
 |
All samples were analysed in triplicates and the average of the three is reported.
Tagging of GO with ICG
GO was tagged with Indocyanine green (ICG) by mixing GO (1 mg/mL) and ICG (4 mg/mL) in water and allowing it to stirred overnight at 4 °C.24 To remove the unbound ICG, the final product was centrifuged at 16,000 g for 10 min. Supernatant was discarded and equal amount of distilled water (DW) was added followed by centrifugation at 16,000 g for 6 min. This washing step was repeated two times. Tagging of GO with ICG was optimized and confirmed through fluorescence techniques using IVIS.
Animal handling and experimental conditions
Adult female SD rats, 6–8 weeks old (190 ± 10 g), bred in Central Animal facility of **** were used in the present study. The animals were maintained in a controlled atmosphere of 12 h light/dark cycle, a temperature of 20 ± 2 °C and with a free access to standard pelleted diet and water ad libitum. The experimental protocols were approved by the Institutional Animal Ethics Committee of CSIR-CDRI, Lucknow, India and Biosafety committee of INST, Mohali. The rats were acclimatized for a period of 1 week before initiating the experiments.
Dose selection, grouping and dosing
As the previous studies, done by Zhang et al.,25 and Li et al.,14 have explored toxic effects of 10 mg/kg exposures of GO for 7–30 days, we therefore have chosen the same dose for exploring the toxic effects of GO in acute exposure setting to mimic the situations of accidental spillages and exposures. For further experiments, Rats were culled into three groups (n = 3/group) that served as ICG control (intravenously injected with ICG only), GO treated (intravenously injected with 10 mg/kg dose of untagged GO), ICG-GO Treated (intravenously injected with 10 mg/kg dose of ICG tagged GO) and. Rats of GO treated Group were intravenously injected with 10 mg/kg dose of untagged GO whereas those of ICG-GO treated group were intravenously injected with 10 mg/kg dose of ICG tagged GO. ICG Control group received the equivalent concentration of ICG only. The exposure time was 24 h.
Short term biodistribution studies in IVIS
For the assessment of biodistribution of GO, exposed rats of all three groups were anesthetised by injecting 0.2 mL Ketamine/Xylazine combination intraperitoneally (ip). After anesthetisation, these rats were placed inside in-vivo imaging system (IVIS) (Caliper life science), and fluorescence images were acquired at 1 h, 8 h and 24 h post injection using software “living image 4.5” at the excitation and emission wavelength of 745 nm and 820 nm respectively. After 24 h of exposures, all the animals were sacrificed and their kidneys, spleens and livers were extracted to image them again to have a better assessment of bio-accumulation of GO.
Preparation of serum and analysis of serum parameters
Blood of control and GO-treated rats was collected at the time of their sacrifice at 24 h time point. Serum was prepared by allowing blood samples to coagulate for 4–5 h at 37 °C followed by their centrifugation at 1,500 rpm for 30 min at 4 °C. All the serum parameters like ALT, AST, BUN and Creatinine were estimated by using Reckon kits as per the manufacturer’s protocol.
Preparation of liver homogenates
Electrically driven Teflon fitted homogenizer was used to prepare liver homogenate from 20 mg of liver tissue in 2 mL of PBS (pH 7.4). The post mitochondrial fraction (PMF) was prepared by centrifugation of tissue homogenates at 10,000 rpm for 30 min at 4 °C for the analysis of biochemical parameters like NO, LPO, LDH, ROS, GPx, GR, GST and Catalase.
Total protein estimation
Total protein level in homogenates and PMF was calculated according to the method of Lowry et al.26 using Bovine serum albumin as standard. Briefly, protein lysate from each homogenate and PMF was prepared and 5 μL of lysate was used for protein concentration estimation. Also 5 μL each of protein standards were added in each well. Then 200 μL of Biuret reagent was added followed by addition of 10 μL of 1 N Folin’s reagent. The absorbance was recorded at 650 nm after incubation for 30 min. This assay showed a linear regression with the increasing concentrations of the BSA standards.
Biochemical parameters
Reactive oxygen species (ROS)
ROS content in the PMF was estimated as described by Freitas et al.27 Briefly, to 100 μL of the sample, 1.5 mL of PBS was added. Subsequently, oxidation sensitive fluorescent probe 2, 7-dichloro fluorescein diacetate (DCFDA) was added to a final concentration of 10 μM and incubated at 37 °C for 30 min in the dark. The fluorescence intensity (λex/λem = 488/525 nm) was recorded using multimode plate reader. The results were expressed as ROS/mg protein.
Total nitrite estimation
Nitrite content in the PMF was determined using Griess reagent as described by Green et al.28 Griess reagent detects the nitrite (NO2−), one of the degraded products of NO. Briefly, 100 μL each of sample and Griess reagent was added in each well of a 96 well plate and incubated at 37 °C for 10 min. After incubation, the absorbance was taken at 540 nm using a multimode plate reader. The NO level was estimated from the NO solution standard and expressed as nanomoles of NO/mg protein.
Lipid peroxidation (LPO)
Lipid peroxidation causes the generation of malondialdehyde (MDA) with reacts with thiobarbituric acid (TBA) to form MDA-TBA adduct which is easily quantifiable colorimetrically.29 Briefly, 50 μL of PMF and 1 mL of tris HCl was incubated for 2 h at 37 °C. Thereafter 1 mL of chilled trichloroacetic acid (TCA) was added, mixed well and centrifuged at 3,000 rpm for 10 min. The supernatant was collected and an equal volume of Thiobarbituric Acid (TBA) was added and boiled at 100 °C for 15 min till it turns pink. The absorbance was recorded at 532 nm using multimode plate reader.
Lactate dehydrogenase (LDH)
The LDH assay for the PMF was carried out as described by Kornberg et al.30 In this assay, the decrease in the absorbance for NADH is directly correlated with the activity of LDH. LDH catalyzes the conversion of pyruvate and NADH into lactate and NAD+. In the present study, 20 μL of PMF was incubated with 0.5 mM sodium pyruvate and 0.1 mM NADH and the absorbance was recorded for 3 min at 340 nm using a multimode plate reader. The rate of oxidation of NADH to NAD was measured as a decrease in absorbance at 340 nm which is proportional to the LDH activity in sample. LDH activity was expressed as nanomoles of NADH consumed/min/mg of protein.
Superoxide dismutase (SOD)
The SOD activity in the PMF was carried out as described by Flohe et al.31 Briefly 20 μL of PMF and 25 μL of 0.2 mM riboflavin was added to 955 μL of solution A (50 mM sodium phosphate buffer pH 7.8, 0.1 mM EDTA, 14.3 mM methionine and 82.5 μM Nitro Blue Tetrazolium) and mixed well. The samples were incubated for 30 min and the absorbance was recorded at 560 nm using a multimode plate reader. SOD activity is defined as the amount of protein required to inhibit reduction of Nitroblue tetrazolium (NBT) by 50%. The results were expressed as IU/mg protein.
Catalase
The catalase activity was carried out as described by Luck et al.32 Briefly, 10 μL of the sample was added to 2.9 mL of 0.75 M H2O2 prepared in phosphate buffer and mixed immediately. The decrease in absorbance for H2O2 was monitored at 240 nm spectrophotometrically for up to 3 min. One unit of Catalase activity was expressed as IU/mg protein.
Reduced glutathione (GSH)
The reduced GSH was estimated in PMF as described by Moron et al.33 This method relies on the oxidation of GSH by the reagent 5, 5-dithiobis-(2-nitrobenzoic acid) (DTNB) to a yellow-colored product 5′-thio-2-nitrobenzoic acid (TNB) which can be measured at 412 nm. Briefly, 50 μL of 25% TCA was mixed with 200 μL of PMF sample and centrifuged at 5,000 rpm for 15 min. 120 μL of supernatant and 120 μL of sodium phosphate buffer was added to 240 μL of 0.6 mM DTNB in sodium phosphate buffer and the absorbance was recorded at 412 nm. The results were expressed as nanomoles of GSH/mg protein using a molar extinction coefficient of 14.15 mM/cm−1.
Glutathione reductase (GR)
GR activity in the PMF sample was estimated as described by Carlberg et al.34 GR catalyzes the NADPH-dependent reduction of glutathione disulphide (GSSG) to reduced glutathione (GSH). Briefly, 500 μL of potassium phosphate buffer, 250 μL of H2O, 50 μL of EDTA, 50 μL of BSA, 50 μL of NADPH, 50 μL GSSG and 50 μL of PMF sample was added and mixed and the decrease in absorbance was monitored at 340 nm for 180 s. One unit of enzyme activity was expressed as nanomoles of NADPH consumed/min/mg protein using an extinction coefficient of 6.22 mM−1 cm−1.
Glutathione peroxidase (GPx) activity
The GPx activity in the PMF was estimated as described by Flohé and Gunzler.35 In this assay GSH is oxidised to GSSG upon reduction of H2O2 by GPx. Briefly, 37 μL of 0.15 M GSH, 1 mL of 0.05 M potassium phosphate buffer, 40 μL of 2 mM NADPH, 20 μL of 10 units of GR, 20 μL of 0.002 M H2O2 and 20 μL of PMF sample was added and mixed. The decrease in the absorbance at 340 nm was monitored for 3 min. The specific activity of GPx was expressed as nanomoles of NADPH consumed/min/mg protein using an extinction coefficient of 6.22 mM−1 cm−1.
Glutathione S-transferase (GST) activity
The GST activity in the PMF was estimated as per the method described by Habig et al.36 Briefly, 2 mL of 0.1 M potassium phosphate buffer, 0.1 ml of 1-Chloro-2,4-dinitrobenzene (CDNB), 0.1 mL of PMF sample and 0.1 mL of GSH was added and the absorbance was read at 340 nm for 3 min. The specific activity of GST was expressed as micromole of GSH-CDNB conjugates formed/min/mg protein using an extinction coefficient of 9.6 mM−1 cm−1.
Statistical analysis
All data are presented as means with standard deviations (mean ± SD). The significant differences between groups were compared using One-way analysis of variance (ANOVA) followed by Tuckey’s multiple comparison test for post hoc evaluation of the data. ANOVA with P-values less than 0.05 were considered as statistically significant. Graphs were made using Graph Pad prism 5.0.
Results
Characterisation of GO
The UV-VIS Spectrum of GO (Fig. 1(A)) showed characteristic peak at 230 nm due to π-π* transition in the C=C bond and C-C bond in sp2 hybrid regions. A shoulder peak at 300 nm is found due to n-π* transition in the C=O bond in sp3 hybrid regions. In the XRD pattern of graphite powder shows basal reflection (002) peak at 2Ɵ = 26.6o (d002 = 0.335 nm) shown in Fig. 1(B). A typical broad peak near 2Ɵ = 10o(d ~ 0.845 nm) was observed for the GO due to oxygenated functional groups like hydroxyl, epoxy and carboxyl getting stacked onto graphite layers during formation of GO. There is also a broad peak, with much weaker intensity, appeared in the range of 13–23o, corresponding d-spacing of 0.37–0.52 nm. The FTIR spectrum of GO displays features aromatic C=O, C=C, hydroxyl and epoxy stretching vibrations seen at 1,735, 1629,1096 and 1,255 cm−1. The strong peaks around 3,438 and 1,400 cm−1 are ascribed to absorbed water, Fig. 1(C). Raman spectrum (Fig. 1(D)) showed the presence of two bands in GO viz. G and D Bands. G-Band in graphite is at 1,576 cm−1 while it is shifted to 1,600 cm−1 in GO due to oxygenation which results in formation of sp3. The D band also known as the defect band arises due to the presence of sp3 carbon, which comes from the conversion of sp2 carbon of graphite into the sp3 carbon of GO due to the oxidation of graphite. The G band comes due to the presence of sp2 hybridized carbon of GO. D-Band shows defects and vacancies formed during oxidation of graphite and so it is broadened in GO as compared to graphite due to presence of oxygenated functional groups which create defects and vacancies in graphite. This is visible from increment in the intensity (ID/IG) ratio from graphite to GO. Intensity ratio (ID/IG) of these bands provides a more detailed information regarding the GO, the ratio of ID/IG is 1.03, which is more than that of graphite, indicating the presence of more defect site in the chemical oxidation of graphite into GO. Thermogravimetric Analysis (TGA) showed thermal stability of GO by determining its weight [%] loss over temperature range. Loss in thermal stability confirms the formation of GO as compared to graphite. TGA analysis of GO and graphite as shown in Fig. 1(E), initially shows a sharp decrease in the weight percentage of GO from 99.07% at 50 °C to 86.7% at 140 °C due to the trapping of water molecules between the layers of GO and may be due to the moisture present in the sample. Further, the graph also shows a decrease in the weight percentage of GO from 66.02% at 180 °C and 47.77% at 305 °C due to the presence of the oxidative group in the GO. Finally, a decrease in weight percentage of GO reached 41.95% at 524 °C, that is, a total of 63.48% decomposition of GO was observed. DLS measurements analysis demonstrated the average particle size of approximately 300 nm, Fig. 1(F) along with a surface charge of −29 mV as shown in Fig. 1(G).
Fig. 1.

A) UV-VIS Spectrum of GO; B) X-ray diffraction of GO (represented by blue curve) and graphite (represented in black curve); C) FTIR spectroscopy of functional groups present in GO; D) Raman spectrum of GO and graphite; E) Thermogravimetric analysis image of GO and graphite; F) lateral size distribution of GO flakes in water suspension using particle size analyser; G) surface charge on GO analysed through zeta potential.
Using the AFM, we measured the thickness of GO flakes by adopting the tapping mode as shown in the Fig. 2(A and B). Height profile image of GO flakes taken from AFM shows that their average thickness is less than 3 nm within a lateral size distribution of less than 300 nm. SEM and TEM confirmed flake like morphology of GO sheets and size below 300 nm when obtained at a higher magnification of 200 nm in Fig. 2(C and D), respectively.
Fig. 2.

A) AFM image of graphene oxide flakes; B) shows height profile of selected particles in AFM image; C) scanning electron microscopy image of exfoliated GO sheets; D) GO flakes of average size less than 300 nm in diameter.
Transcellular passive permeability of GO
Here, in this study, passive brain permeability of the GO was estimated using an in vitro BBB PAMPA model. BBB PAMPA is a high throughput screening method for assessing the ability of small molecular compounds to navigate across the BBB via transcellular passive permeation. As shown in the Fig. 3. The percentage GO that crossed across the BBB PAMPA model was determined in comparison to BBB positive control, propranolol. The percentage of GO which could cross across the BBB PAMPA model was found to be around 20.285 ± 0.79% as compared to control, propranolol which showed a percentage permeability of around 59.57 ± 0.74%. Based on the percentage values obtained in BBB PAMPA model, GO showed sufficiently high passive permeability across the BBB. According to the literature more than 95% of drugs cannot cross the BBB, hence a permeability percentage of 20.285 ± 0.79% demonstrated by GO here can be considered as a significant value and suggests that GO can successfully reach the brain tissues by traversing the BBB.
Fig. 3.
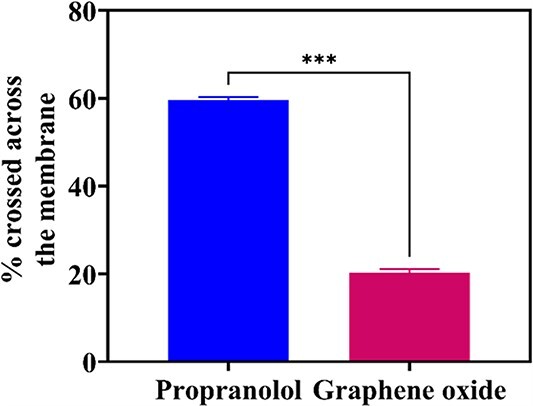
Assessment of passive permeability of graphene oxide by parallel artificial membrane permeability assay (PAMPA), the data are represented as mean ± SEM, n = 3. ***indicates the level of significance (P < 0.001).
Short term In vivo biodistribution studies
The images of the treated rats, captured by IVIS, at 1 h, 4 h and 24 h time points show the biodistribution of ICG tagged GO and pristine ICG inside the rat body. Images of the GO control rat showed no fluorescence signals at any time point. At 1 h and 4 h time points, pristine ICG was non-specifically diffused to various parts of the rat body, whereas the ICG Tagged GO was mostly localized in the abdominal area of the rat body (Fig. 4). Later with increase in time, pristine ICG quenched down and excreted out via bile and was not visible at 24 h time point, while the ICG tagged GO was still visible in the abdominal area. This proves the strong and stable tagging of GO with ICG, and also indicates the accumulation of GO in abdominal organs of the rat body. For further assessment, kidneys, livers and spleens of the rats were extracted and imaged again in IVIS. Images showed fluorescence only in the liver of ICG-GO injected rat whereas no signals were found in kidneys and spleens of all three rats (including the ICG-GO exposed rat) indicating the accumulation of GO mainly in the liver.
Fig. 4.

A) IVIS images of control rats (1), rats exposed to ICG tagged GO (2), and only ICG (ICG-control) (3) for 1 h, 4 h and 24 h. B) IVIS imaging of kidney, spleen and liver extracted from the rats after 24 h.
Estimation of various serum parameters in graphene oxide treated rats
The toxicity of nano-sized GO was assessed by testing serum parameters like ALT, AST, Direct Bilirubin, Total Albumin, BUN and Creatinine, as shown in Fig. 5. Results show statistically significantly increase in the levels of ALT by 91.65% and 91.14% [F(2,6) = 68.4, P < 0.001], AST by 107.19% and 107.77% [F(2,6) = 37.2, P < 0.001], Bilirubin by 96.29% and 103.7% [F(2,6) = 10.3, P < 0.02] and Creatinine by 57.03% and 64.53% [F(2,6) = 6.8, P < 0.05], respectively in the serum of ICG-GO and GO injected rats in comparison to those of ICG control. Level of Serum Albumin was nonsignificantly altered [F(2,6) = 0.1, P > 0.05]. It was decreased by 1.22% in ICG-GO group whereas increased by 2.43% in GO group, whereas BUN was decreased non significantly by 17.08% and 19.79% [F(2,6) = 3.7, P > 0.05] respectively in the serum of ICG-GO and GO injected rats as compared to those of ICG control.
Fig. 5.

Estimation of various serum parameters such as (A) alanine transaminase (ALT), (B) aspartate aminotransferase (AST), (C) creatinine, (D) albumin, (E) blood urea nitrogen (BUN) and (F) bilirubin level in ICG-control, ICG-GO exposed and only GO exposed rats (n = 3/group). The data are represented as mean ± SEM, n = 3. * indicates the level of significance (P < 0.05) and ***indicates the level of significance (P < 0.001). All the comparisons are made against ICG-control.
Estimation of various biochemical parameters from liver tissue homogenate in graphene oxide treated rats
ICG-GO and GO exposed rats were also evaluated for their changes in various biochemical parameters such as NO, Catalase, GSH, SOD, ROS, LPO, GR, GPx and GST as shown in Fig. 6. The protein concentration in the homogenate was estimated to be 100.1 ± 6.4 mg/g. A significant increase has been observed in the activity of GR (aP < 0.001), GPx (cP < 0.05), SOD (cP < 0.05), LDH (aP < 0.001) and in the level of LPO (cP < 0.05) as compared to control. Rest of the parameters remained in their normal range.
Fig. 6.

Estimation of various biochemical parameters such as (A) nitric oxide (NO), (B) catalase, (C) glutathione (GSH), (D) superoxide dismutase (SOD), (E) reactive oxygen species (ROS), (F) lipid peroxidation (LPO), (G) glutathione reductase (GR), (H) glutathione peroxidase (GPx) and (I) glutathione S-transferase (GST) in ICG-control, ICG-GO exposed and only GO exposed rats (n = 3/group). The data are represented as mean ± SEM, n = 3. *indicates the level of significance (P < 0.05) and **indicates the level of significance (P < 0.01) all the comparisons are made against ICG-control.
Discussion
In this study, we chose high exposure concentration of 10 mg/kg BW and a short exposure time of 24 h so that the toxicity of GO can be investigated in case of sudden accidental spillage scenarios. Here, we successfully synthesized and characterised 2 to 3 nm thick GO nano flakes of less than 300 nm lateral size. These flakes were then tagged with ICG and intravenously injected in rats to observe their biodistribution and acute toxicity in short term exposure of 24 h time. In-vivo images of ICG tagged GO injected SD rats revealed that the nano sized GO flakes accumulated mainly in the liver. Our results are in accordance with those of Wen et al37 who have also reported the accumulation of 300 to 700 nm GO particles in the liver of mice. For further assessment of toxicity caused by exposure of GO flakes, parameters like AST, ALT, Bilirubin, Albumin, BUN and Creatinine were tested in serum. Aminotransferases (AST and ALT) have been reported to be the most important markers of liver damage and hepatocellular necrosis.38 These enzymes are abundantly present in liver and their serum concentration is maintained up to normal limits. In cases of significant hepatic injuries, these enzymes are released into serum, resulting in the elevation beyond the normal levels.39 The extent of elevation is directly proportional to the hepatic injury and hepatocellular necrosis.40 Our results show the significant elevation in the level of aminotransferases, both AST and ALT, as a result of the GO exposure, indicating the GO exposure induced hepatic injury. Serum bilirubin is another important indicator of liver damage and jaundice. It is an orange-yellow pigment which is mainly produced due to haemoglobin breakdown in reticuloendothelial system of the body. This potentially toxic pigment is transferred from plasma to the liver which excretes it out of the body in bile and stool.41 Elevated concentration of Bilirubin in blood has been reported to be a potent indicator of liver damage and/or haemolysis.40 Our results show that the serum concentration of bilirubin was increased by 103.7% in GO injected rats as compared to the control. A similar elevation in total bilirubin level by 176% in Graphene oxide nanoplatelets (GON) injected rats at the highest dose of 500 mg/kg was reported by Amrollahi et al.42 This is also a clear indication of acute hepatotoxicity caused by GO exposure. Albumin is a plasma protein synthesized by liver. Its low level is indicative of poor liver function. However, in our study its serum levels are not significantly altered. BUN level in serum is indicator of the renal function. Its elevated levels indicate damages to the kidneys; however, it has also been reported to be indicative of liver function and its decreased serum concentration has been found to be associated with liver failure.43,44 We have found 19.79% decreased level of BUN in serum of GO injected rats which might be an indicative of GO induced damage to the liver. Creatinine is considered the most reliable marker of renal function. It is produced in muscles as an end product of Creatine breakdown. It is present in serum and urine, and excreted by glomerular filtration in kidney. Increased level of serum creatinine indicates deterioration in renal health resulting in deficient glomerular filtration.40,45 Our results showed 64.53% increased creatinine values in serum of GO exposed rats indicating the acute renal toxicity of GO exposure.
Considering the results of IVIS showing the accumulation of GO mainly in liver and the serum parameters indicating the probable hepatocellular damages, we further explored the ROS and other oxidative stress related biochemical parameters in liver homogenates. Many chemicals, drugs and NMs have been reported to induce oxidative and nitrosative stress by generating excessive free radicals which in turn cause cellular damages and toxicity.46,47 Free radicals are generally of two types, oxygen based i.e. ROS and nitrogen based i.e. RNS. Being highly reactive, they are capable of causing oxidative damages to the important biomolecules of the cells resulting in cellular injuries. Basically, GO upon internalization by cells, triggers the generation of intracellular ROS, as shown in Fig. 7. ROS react with NO to generate the RNS like peroxynitrate (ONOO−) which is a powerful pro-oxidant and known for its toxic implications on cells and tissues.48,49 Also, upon induction of oxidative stress, lipid peroxidation occurs which generates 4-Hydroxy-2-nonenal (HNE) and MDA. MDA gets neutralized by GST and GSH. Also, the superoxide radical generated due to oxidative stress is catalysed towards conversion to H2O2 by SOD. H2O2 is rapidly converted by Fenton reaction into ∙OH radical which is very reactive. GPx neutralises H2O2 to two GSH molecules resulting in two H2O and one GSSG. GR then regenerate GSH from GSSG. Catalase plays an important role in neutralising H2O2 into H2O.
Fig. 7.

Mechanism of GO toxicity and the role of various biochemical parameters in mediating the toxicity. The uptake of GO by cells induces oxidative stress leading to generation of ROS and superoxide radicals. SOD catalyses the conversion of superoxide radicals to H2O2. GPx neutralises H2O2 from two GSH molecules resulting in one GSSG. GR then regenerates GSH from GSSG. Catalase plays an important role of neutralizing H2O2 into H2O. Elevated intracellular ROS may also activate NOS thereby leading to the production of Peroxynitrite. Lipid peroxidation is another consequence of increased intracellular ROS levels. It leads to the generation of malondialdehyde (MDA) which can be reduced to GSH-conjugate by GST enzyme.
In case of our results, they are in close accordance with the above cited reports as we found a significant increase of 39.21% in the level of ROS and 119.85% in level of NO in liver homogenates of GO exposed rats as compared to that of control. Apart from being a source of RNS, NO also performs an important function in both physiology and pathophysiology of liver. It has been reported to be involved in pathogenesis and progression of liver diseases as well.49 So, the increased levels of NO found in this study might again be an indication of acute toxicity caused by GO exposure. We further tested the extent of lipid peroxidation, as the increased levels of ROS and RNS [specially the hydroxyl (HO∙), hydroperoxyl (HO∙2), and peroxynitrite (ONOO−)] are known to cause oxidative damage to membrane lipids. HO∙ reacts with carbon–carbon double bond(s) containing lipids, especially the polyunsaturated fatty acids (PUFAs), and generates lipid radicals which further react to initiate a chain oxidation of lipids and forming the toxic aldehydes like malondialdehyde (MDA) as end products which further cause damage to the DNA, resulting in cytotoxicity and impairment of cell functions.50 Hydroperoxyl radical (HO∙2) also has a key role in the chemistry of lipid peroxidation as it yields H2O2 which interacts with iron and/or copper to further generate HO∙ through Fenton or Haber-Weiss reactions.51,52 Our results are in agreement with these reports as we found 32.97% increased level of LPO which signifies the GO induced degradation of lipids by ROS/RNS in GO injected rats.
In normal conditions, ROS helps in cell signalling to maintain the usual metabolism of cells but under the exposure of certain xenobiotics, overproduction of ROS/RNS occurs. To deal with this stress, cells start their survival mechanism, by activating antioxidants and other defence systems or choose to undergo cell death or necrosis, depending upon the physiological condition and the extent of stress. However, both the conditions are damaging and promote ailments and/or aging.53 Results so far showed increased ROS driven disruption of lipids indicating the imbalance in the production and the elimination of ROS, and/or insufficiency of defence mechanisms. So, we further estimated the levels of other important antioxidant enzymes such as LDH, GST, SOD, Catalase, GSH, GPx and GR to analyse the strength of the defence mechanism under the acute exposure of GO nanoflakes.
Lactate dehydrogenase (LDH) plays a crucial role in cells by catalysing anaerobic conversion of pyruvate to lactate and vice versa. Though it is present in small amount in the cells of most of the active organs, but usually it is secreted out in extracellular spaces when the organs encounter damage. High level of LDH in liver homogenates has been reported as an indicator of damage to hepatocytes in consideration with other markers of hepatotoxicity.54,55 Our results showing significant increase of 76.5% are in corroboration with them.
GST is a biotransformation enzyme that catalyses conjugation of toxic and harmful compounds with glutathione (GSH) and renders them suitable for excretion in bile and urine. It has also been reported to be an important marker in early detection of hepatotoxicity similar to ALT and AST.56,57 In present study, level of GST has been found to be increased by 16.15%. However, this increase is not statistically significant, yet it signifies the acute hepatotoxicity induced by GO.
SOD performs a pivotal role in the antioxidant defence of the cells by catalysing the dismutation of superoxide into molecular oxygen and hydrogen peroxide. Its importance has been shown in studies reporting the fatal pathophysiological outcomes in SOD knockout mice.58,59 We found a statistically significant increase of 38.11% in GO injected rats as compared to ICG-Control.
Catalase, a tetrameric antioxidant, catalyses the decomposition of hydrogen peroxide to water and oxygen. It is a very important antioxidant as it possesses the highest turnover number. We found 25.37% increased activity of catalase enzyme; however, it was not significant statistically. Level of GSH, a tripeptide antioxidant, is increased under low rate of lipid peroxidation to prevent cellular damage caused by reactive oxygen species such as free radicals, peroxides, and heavy metals.52 73.65% increased level of GSH indicates the significantly increased lipid peroxidation induced by exposure of GO. Glutathione peroxidase (GPx) is glutathione-dependent seleno peroxidase that catalyses the reduction of hydrogen peroxides and lipid peroxides to water and the respective lipid alcohols. Significant increase of 59.84% in the GPx activity can be attributed to the neutralization of GO exposure induced toxicity for compensating the loss in defence mechanism against ROS. Our results are in agreement with those of Ismail et al (2012)60 who reported a significantly increased GPx activity in liver biopsy of children having chronic liver ailments. Activity of Glutathione reductase (GR), an antioxidant enzyme catalysing the reduction of Glutathione disulfide (GSSG) to the sulfhydryl form of glutathione (GSH), was also found increased by 74.52% in a similar pattern as GSH itself. Among the modes of action assessed, the authors concluded that plasma membrane damage and oxidative stress play crucial roles in GO-induced cytotoxicity [62].
Conclusion
The aim of the present study was to assess the toxicity of nano sized GO on SD rats. The GO used in the present study was synthesised using a modified Hummer’s method and characterized for its’ size, shape and physicals properties. The synthesised nanoparticles had a lateral size of less than 300 nm along with a sheet like morphology. GO exhibited a significant permeation potential across various organ barriers as assessed using in vitro PAMPA assay. After establishing the organ barriers permeation potential of GO, its’ short term in vivo biodistribution was investigated. GO mainly accumulated in the liver of the treated rats, thus suggesting a potential organ specific stress and toxicity. In an attempt to understand the potential physiological changes arising due to the accumulation in liver, various serum and biochemical parameters were screened. Among the serum parameters, an increase in ALT, AST, Creatinine and Bilirubin was observed. In case of biochemical parameters, an increase in NO, Catalase, GSH, SOD, ROS, LPO, GR, GPx and GST was observed. This short duration exposure study gave an important insight into the onset of physiological stress which might get aggravated upon chronic exposure of GO, which further warrants a controlled usage and exposure awareness for GO based nanotechnological applications as well as the consumer products.
Author contributions
Indranil De, Rashmika Singh: Experimentation, Methodology, Validation, Formal analysis, Investigation, Data curation for biological experiments, Writing—original draft, review & editing; Sushil Kumar, Srishti Singh and Kaushik Ghosh: Methodology, Investigation and Data curation for Material synthesis and characterization, Formal analysis, Writing—review & editing; Jiban Jyoti Panda: Methodology, Investigation and Data curation for PAMPA Assay, Manohar Singh Rathore and Durga Prasad Mishra: Animal studies and IVIS; Manish Singh: Conception of idea, design of the study, overall supervision, Methodology, Validation, Formal analysis, Investigation, Data curation, Writing—original draft, review & editing.
Funding
MS is thankful for DST-SERB grant (YSS/2015/001735) for the financial support. All the authors are thankful to the Institute of Nano Science and Technology, Mohali, India, for providing basic infra-structures and the research facilities. ID is thankful to the Department of Science and Technology (DST), India for providing INSPIRE fellowship [IF 190139].
Conflict of interest statement. The authors declare that they have no known competing financial interests or personal relationships that could have appeared to influence the work reported in this paper.
Data availability
The data that support the findings of this study are available from the corresponding author upon reasonable request.
Contributor Information
Indranil De, Institute of Nano Science and Technology (INST), Knowledge City, Sector-81, SAS Nagar, 140306, Mohali, Punjab, India.
Rashmika Singh, Institute of Nano Science and Technology (INST), Knowledge City, Sector-81, SAS Nagar, 140306, Mohali, Punjab, India.
Sushil Kumar, Institute of Nano Science and Technology (INST), Knowledge City, Sector-81, SAS Nagar, 140306, Mohali, Punjab, India.
Srishti Singh, Institute of Nano Science and Technology (INST), Knowledge City, Sector-81, SAS Nagar, 140306, Mohali, Punjab, India.
Manohar Singh, CSIR-Central Drug Research Institute, Lucknow, 226031, India.
Jiban Jyoti Panda, Institute of Nano Science and Technology (INST), Knowledge City, Sector-81, SAS Nagar, 140306, Mohali, Punjab, India.
Kaushik Ghosh, Institute of Nano Science and Technology (INST), Knowledge City, Sector-81, SAS Nagar, 140306, Mohali, Punjab, India.
Durga Prasad Mishra, CSIR-Central Drug Research Institute, Lucknow, 226031, India.
Manish Singh, Institute of Nano Science and Technology (INST), Knowledge City, Sector-81, SAS Nagar, 140306, Mohali, Punjab, India.
References
- 1. Seabra AB, Paula AJ, Lima R, Alves OL, Durán N. Nanotoxicity of graphene and graphene oxide. Chem Res Toxicol. 2014:27(2):159–168. [DOI] [PubMed] [Google Scholar]
- 2. Farmani A. Graphene-based devices for smart cities. In: Huaihe Song, Rajendran Venkatachalam, Hao Bin Wu, Phuong Nguyen Tri, Tuan Anh Nguyen, editors. Nanobatteries and Nanogenerators. Elsevier; 2021. pp. 491–514. [Google Scholar]
- 3. Yang K, Zhang S, Zhang G, Sun X, Lee S-T, Liu Z. Graphene in mice: ultrahigh in vivo tumor uptake and efficient photothermal therapy. Nano Lett. 2010:10(9):3318–3323. [DOI] [PubMed] [Google Scholar]
- 4. Liu Y, Luo Y, Wu J, Wang Y, Yang X, Yang R, Wang B, Yang J, Zhang N. Graphene oxide can induce in vitro and in vivo mutagenesis. Sci Rep. 2013:3(1):1–8. [DOI] [PMC free article] [PubMed] [Google Scholar]
- 5. Sun X, Liu Z, Welsher K, Robinson JT, Goodwin A, Zaric S, Dai H. Nano-graphene oxide for cellular imaging and drug delivery. Nano Res. 2008:1(3):203–212. [DOI] [PMC free article] [PubMed] [Google Scholar]
- 6. Zhang X, Hu W, Li J, Tao L, Wei Y. A comparative study of cellular uptake and cytotoxicity of multi-walled carbon nanotubes, graphene oxide, and nanodiamond. Toxicol Res. 2012:1(1):62–68. [Google Scholar]
- 7. Lv M, Zhang Y, Liang L, Wei M, Hu W, Li X, Huang Q. Effect of graphene oxide on undifferentiated and retinoic acid-differentiated SH-SY5Y cells line. Nanoscale. 2012:4(13):3861–3866. [DOI] [PubMed] [Google Scholar]
- 8. Wang A, Pu K, Dong B, Liu Y, Zhang L, Zhang Z, Duan W, Zhu Y. Role of surface charge and oxidative stress in cytotoxicity and genotoxicity of graphene oxide towards human lung fibroblast cells. J Appl Toxicol. 2013:33(10):1156–1164. [DOI] [PubMed] [Google Scholar]
- 9. Wang K, Ruan J, Song H, Zhang J, Wo Y, Guo S, Cui D. Biocompatibility of graphene oxide. Nanoscale Res Lett. 2011:6(1):1–8. [DOI] [PMC free article] [PubMed] [Google Scholar]
- 10. Guo X, Mei N. Assessment of the toxic potential of graphene family nanomaterials. J Food Drug Anal. 2014:22(1):105–115. [DOI] [PMC free article] [PubMed] [Google Scholar]
- 11. Chang Y, Yang S-T, Liu J-H, Dong E, Wang Y, Cao A, Liu Y, Wang H. In vitro toxicity evaluation of graphene oxide on A549 cells. Toxicol Lett. 2011:200(3):201–210. [DOI] [PubMed] [Google Scholar]
- 12. Lammel T, Boisseaux P, Fernández-Cruz M-L, Navas JM. Internalization and cytotoxicity of graphene oxide and carboxyl graphene nanoplatelets in the human hepatocellular carcinoma cell line hep G2. Part Fibre Toxicol. 2013:10(1):27. [DOI] [PMC free article] [PubMed] [Google Scholar]
- 13. Patlolla AK, Randolph J, Kumari SA, Tchounwou PB. Toxicity evaluation of graphene oxide in kidneys of Sprague-Dawley rats. Int J Environ Res Public Health. 2016:13(4):380. [DOI] [PMC free article] [PubMed] [Google Scholar]
- 14. Li Y, Wang Y, Tu L, Chen D, Luo Z, Liu D, Miao Z, Feng G, Qing L, Wang S. Sub-acute toxicity study of graphene oxide in the Sprague-Dawley rat. Int J Environ Res Public Health. 2016:13(11):1149. [DOI] [PMC free article] [PubMed] [Google Scholar]
- 15. Patlolla A, Rondalph J, Tchounwou P. Biochemical and histopathological evaluation of graphene oxide in Sprague-Dawley rats. Austin J Environ Toxicol. 2017:3(1):1–7. [PMC free article] [PubMed] [Google Scholar]
- 16. Ali-Boucetta H, Bitounis D, Raveendran-Nair R, Servant A, Van den Bossche J, Kostarelos K. Purified graphene oxide dispersions lack in vitro cytotoxicity and in vivo pathogenicity. Adv Healthc Mater. 2013:2(3):433–441. [DOI] [PubMed] [Google Scholar]
- 17. Marcano DC, Kosynkin DV, Berlin JM, Sinitskii A, Sun Z, Slesarev A, Alemany LB, Lu W, Tour JM. Improved synthesis of graphene oxide. ACS Nano. 2010:4(8):4806–4814. [DOI] [PubMed] [Google Scholar]
- 18. Emiru TF, Ayele DW. Controlled synthesis, characterization and reduction of graphene oxide: a convenient method for large scale production. Egypt J Basic Appl Sci. 2017:4(1):74–79. [Google Scholar]
- 19. Stobinski L, Lesiak B, Malolepszy A, Mazurkiewicz M, Mierzwa B, Zemek J, Jiricek P, Bieloshapka I. Graphene oxide and reduced graphene oxide studied by the XRD, TEM and electron spectroscopy methods. J Electron Spectrosc Relat Phenom. 2014:195:145–154. [Google Scholar]
- 20. Çiplak Z, Yildiz N, Çalimli A. Investigation of graphene/Ag nanocomposites synthesis parameters for two different synthesis methods. Fullerenes, Nanotubes and Carbon Nanostruct. 2015:23(4):361–370. [Google Scholar]
- 21. Kudin KN, Ozbas B, Schniepp HC, Prud'Homme RK, Aksay IA, Car R. Raman spectra of graphite oxide and functionalized graphene sheets. Nano Lett. 2008:8(1):36–41. [DOI] [PubMed] [Google Scholar]
- 22. Huang NM, Lim H, Chia CH, Yarmo MA, Muhamad M. Simple room-temperature preparation of high-yield large-area graphene oxide. Int J Nanomedicine. 2011:6:3443–3448. [DOI] [PMC free article] [PubMed] [Google Scholar]
- 23. Cho JY, Kim JH, Han JT. Extraordinary thermal behavior of graphene oxide in air for electrode applications. Nanoscale Adv. 2021:3(6):1597–1602. [DOI] [PMC free article] [PubMed] [Google Scholar]
- 24. Wang Y-W, Fu Y-Y, Peng Q, Guo S-S, Liu G, Li J, Yang HH, Chen GN. Dye-enhanced graphene oxide for photothermal therapy and photoacoustic imaging. J Mater Chem B. 2013:1(42):5762–5767. [DOI] [PubMed] [Google Scholar]
- 25. Zhang X, Yin J, Peng C, Hu W, Zhu Z, Li W, Fan C, Huang Q. Distribution and biocompatibility studies of graphene oxide in mice after intravenous administration. Carbon. 2011:49(3):986–995. [Google Scholar]
- 26. Lowry OH, Rosebrough NJ, Farr AL, Randall RJ. Protein measurement with the Folin phenol reagent. J Biol Chem. 1951:193(1):265–275. [PubMed] [Google Scholar]
- 27. Freitas I, Boncompagni E, Tarantola E, Gruppi C, Bertone V, Ferrigno A, Milanesi G, Vaccarone R, Tira ME, Vairetti M. In situ evaluation of oxidative stress in rat fatty liver induced by a methionine-and choline-deficient diet. Oxidative Med Cell Longev. 2016:2016:1–14. [DOI] [PMC free article] [PubMed] [Google Scholar]
- 28. Green LC, Wagner DA, Glogowski J, Skipper PL, Wishnok JS, Tannenbaum SR. Analysis of nitrate, nitrite, and [15N] nitrate in biological fluids. Anal Biochem. 1982:126(1):131–138. [DOI] [PubMed] [Google Scholar]
- 29. Wang K, Zhang Z, Tsai H-i, Liu Y, Gao J, Wang M, Song L, Cao X, Xu Z, Chen H, et al. Branched-chain amino acid aminotransferase 2 regulates ferroptotic cell death in cancer cells. Cell Death Differ. 2021:28(4):1222–1236. [DOI] [PMC free article] [PubMed] [Google Scholar]
- 30. Kornberg A. Lactic dehydrogenase of muscle: pyruvate+ DPNH⇄ lactate+ DPN. 1955:1:441–443. [Google Scholar]
- 31. Flohe L. [10] Superoxide dismutase assays. Methods Enzymol. 1984:105:93–104. [DOI] [PubMed] [Google Scholar]
- 32. Lück H. Catalase. In: Hans-Ulrich Bergmeyer, editor. Methods of enzymatic analysis. Elsevier; 1965. pp. 885–894. [Google Scholar]
- 33. Moron MS, Depierre JW, Mannervik B. Levels of glutathione, glutathione reductase and glutathione S-transferase activities in rat lung and liver. Biochim Biophys Acta. 1979:582(1):67–78. [DOI] [PubMed] [Google Scholar]
- 34. Carlberg I, Mannervik B. [59] Glutathione reductase. Methods Enzymol. 1985:113:484–490. [DOI] [PubMed] [Google Scholar]
- 35. Flohé L, Günzler WA. [12] Assays of glutathione peroxidase. Methods Enzymol. 1984:105:114–120. [DOI] [PubMed] [Google Scholar]
- 36. Habig WH, Pabst MJ, Jakoby WB. Glutathione S-transferases: the first enzymatic step in mercapturic acid formation. J Biol Chem. 1974:249(22):7130–7139. [PubMed] [Google Scholar]
- 37. Wen KP, Chen YC, Chuang CH, Chang HY, Lee CY, Tai NH. Accumulation and toxicity of intravenously-injected functionalized graphene oxide in mice. J Appl Toxicol. 2015:35(10):1211–1218. [DOI] [PubMed] [Google Scholar]
- 38. Thapa BR, Walia A. Liver function tests and their interpretation. Indian J Pediatr. 2007:74(7):663–671. [DOI] [PubMed] [Google Scholar]
- 39. LaDue JS, Wróblewski F, Karmen A. Serum glutamic oxaloacetic transaminase activity in human acute transmural myocardial infarction. Science. 1954:120(3117):497–499. [DOI] [PubMed] [Google Scholar]
- 40. Washington IM, Van Hoosier G. Clinical biochemistry and hematology. In: Mark A. Suckow, Karla A. Stevens and Ronald P. Wilson, editors. The laboratory rabbit, Guinea pig, hamster, and other rodents. Elsevier; 2012. pp. 57–116. [Google Scholar]
- 41. Sticova E, Jirsa M. New insights in bilirubin metabolism and their clinical implications. World J Gastroenterol. 2013:19(38):6398–6407. [DOI] [PMC free article] [PubMed] [Google Scholar]
- 42. Amrollahi-Sharifabadi M, Koohi MK, Zayerzadeh E, Hablolvarid MH, Hassan J, Seifalian AM. In vivo toxicological evaluation of graphene oxide nanoplatelets for clinical application. Int J Nanomedicine. 2018:13:4757–4769. [DOI] [PMC free article] [PubMed] [Google Scholar]
- 43. Melillo A. Rabbit clinical pathology. J Exot Pet Med. 2007:16(3):135–145. [DOI] [PMC free article] [PubMed] [Google Scholar]
- 44. McLaughlin RM, Fish RE. Clinical biochemistry and hematology. In: Manning PJ, Ringler DH, Newcomer CE, editors. The biology of the laboratory rabbit. San Diego (CA): Academic Press; 1994. p. 119–24. [Google Scholar]
- 45. Gowda S, Desai PB, Kulkarni SS, Hull VV, Math AA, Vernekar SN. Markers of renal function tests. N Am J Med Sci. 2010:2(4):170–173. [PMC free article] [PubMed] [Google Scholar]
- 46. Singh M, Singh K, Shukla S, Dikshit M. Assessment of in-utero venlafaxine induced, ROS-mediated, apoptotic neurodegeneration in fetal neocortex and neurobehavioral sequelae in rat offspring. Int J Dev Neurosci. 2015:40(1):60–69. [DOI] [PubMed] [Google Scholar]
- 47. Fu PP, Xia Q, Hwang H-M, Ray PC, Yu H. Mechanisms of nanotoxicity: generation of reactive oxygen species. J Food Drug Anal. 2014:22(1):64–75. [DOI] [PMC free article] [PubMed] [Google Scholar]
- 48. Birben E, Sahiner UM, Sackesen C, Erzurum S, Kalayci O. Oxidative stress and antioxidant defense. World Allergy Organ J. 2012:5(1):9–19. [DOI] [PMC free article] [PubMed] [Google Scholar]
- 49. Iwakiri Y, Kim MY. Nitric oxide in liver diseases. Trends Pharmacol Sci. 2015:36(8):524–536. [DOI] [PMC free article] [PubMed] [Google Scholar]
- 50. Marnett LJ. Lipid peroxidation-DNA damage by malondialdehyde. Mutat Res. 1999:424(1–2):83–95. [DOI] [PubMed] [Google Scholar]
- 51. Schneider C, Boeglin WE, Yin H, Porter NA, Brash AR. Intermolecular peroxyl radical reactions during autoxidation of hydroxy and hydroperoxy arachidonic acids generate a novel series of epoxidized products. Chem Res Toxicol. 2008:21(4):895–903. [DOI] [PubMed] [Google Scholar]
- 52. Ayala A, Muñoz MF, Argüelles S. Lipid peroxidation: production, metabolism, and signaling mechanisms of malondialdehyde and 4-hydroxy-2-nonenal. Oxidative Med Cell Longev. 2014:2014:1–31. [DOI] [PMC free article] [PubMed] [Google Scholar]
- 53. Iskusnykh IY, Popova TN, Agarkov AA, Pinheiro de Carvalho MÂ, Rjevskiy SG. Expression of glutathione peroxidase and glutathione reductase and level of free radical processes under toxic hepatitis in rats. J Toxicol. 2013:2013:1–9. [DOI] [PMC free article] [PubMed] [Google Scholar]
- 54. Chaudhary A, Chauhan V. Lactate dehydrogenase as an indicator of liver diseases. J Adv Med Dent Sci Res. 2015:3(5):S20. [Google Scholar]
- 55. Al-Johany AM, Al-Sadoon MK, Abdel Moneim A, Bauomy AA, Diab MS. Effects of pyramid viper, echis pyramidum crude venom on hepatic redox status and BAX expression in rats. J Pure Appl Microbio. 2014:8:429–436. [Google Scholar]
- 56. Giffen PS, Pick CR, Price MA, Williams A, York MJ. Alpha-glutathione S-transferase in the assessment of hepatotoxicity—its diagnostic utility in comparison with other recognized markers in the Wistar Han rat. Toxicol Pathol. 2002:30(3):365–372. [DOI] [PubMed] [Google Scholar]
- 57. Abdel-Moneim SM, Sliem H. Significance of serum alpha-glutathione S-transferase assessment in hepatitis C patients with different alanine aminotransferase patterns. Gastroenterology Res. 2011:4(1):13–19. [DOI] [PMC free article] [PubMed] [Google Scholar]
- 58. Li Y, Huang T-T, Carlson EJ, Melov S, Ursell PC, Olson JL, Noble LJ, Yoshimura MP, Berger C, Chan PH, et al. Dilated cardiomyopathy and neonatal lethality in mutant mice lacking manganese superoxide dismutase. Nat Genet. 1995:11(4):376–381. [DOI] [PubMed] [Google Scholar]
- 59. Elchuri S, Oberley TD, Qi W, Eisenstein RS, Jackson Roberts L, van Remmen H, Epstein CJ, Huang TT. CuZnSOD deficiency leads to persistent and widespread oxidative damage and hepatocarcinogenesis later in life. Oncogene. 2005:24(3):367–380. [DOI] [PubMed] [Google Scholar]
- 60. Ismail N, Okasha S, Dhawan A, Abdel-Rahman A, Shaker O, Sadik N. Antioxidant enzyme activities in hepatic tissue from children with chronic cholestatic liver disease. Saudi Journal of Gastroenterology. 2010:16(2):90. 10.4103/1319-3767.61234. [DOI] [PMC free article] [PubMed] [Google Scholar]
Associated Data
This section collects any data citations, data availability statements, or supplementary materials included in this article.
Data Availability Statement
The data that support the findings of this study are available from the corresponding author upon reasonable request.