

Abstract
Understanding the protein structures is invaluable in various biomedical applications, such as vaccine development. Protein structure model building from experimental electron density maps is a time-consuming and labor-intensive task. To address the challenge, machine learning approaches have been proposed to automate this process. Currently, the majority of the experimental maps in the database lack atomic resolution features, making it challenging for machine learning-based methods to precisely determine protein structures from cryogenic electron microscopy density maps. On the other hand, protein structure prediction methods, such as AlphaFold2, leverage evolutionary information from protein sequences and have recently achieved groundbreaking accuracy. However, these methods often require manual refinement, which is labor intensive and time consuming. In this study, we present DeepTracer-Refine, an automated method that refines AlphaFold predicted structures by aligning them to DeepTracers modeled structure. Our method was evaluated on 39 multi-domain proteins and we improved the average residue coverage from 78.2 to 90.0% and average local Distance Difference Test score from 0.67 to 0.71. We also compared DeepTracer-Refine with Phenixs AlphaFold refinement and demonstrated that our method not only performs better when the initial AlphaFold model is less precise but also surpasses Phenix in run-time performance.
Keywords: cryo-EM, protein structure, refinement, DeepTracer, protein docking, AlphaFold
INTRODUCTION
Cryogenic electron microscopy (cryo-EM), a macromolecular imaging technology, has revolutionized the study of proteins [1]. Proteins play crucial roles in the human body and we study their three-dimensional composition to gain knowledge about their functions [2]. Over the past few years, many de novo and template-based machine learning methods have been proposed to automate the process of protein structure modeling from cryo-EM density maps [3–9]. However, these methods have challenges in accurately producing protein structures. De novo methods, which do not rely on using previously solved structures as templates, are limited by the resolution and quality of the density maps. For template-based methods, they are constrained by the availability of solved structures. These limitations could be overcome with advancements in electron microscopes and the growth in the availability of solved structures, however, we need to explore alternative approaches from a computer algorithm perspective to overcome the current limitations of automated methods.
There are two general approaches when it comes to determining protein structures in silico. The first approach, known as map-to-model, places atoms in experimentally obtained cryo-EM electron density maps (Figure 1A); the second approach is sequence-to-model, which utilizes information from the protein sequence to predict the three-dimensional structure (Figure 1B). In our study, we propose a method called DeepTracer-Refine to address the limitations of our map-to-model method, DeepTracer, by combining it with a sequence-to-model method, AlphaFold2. In short, AlphaFold structures provide perfect sequence coverage because it uses the actual protein sequence as input. However, compared with de novo map-to-model methods like DeepTracer, the predicted structures from AlphaFold are not always precise. A common strategy to address this problem is by splitting AlphaFolds structure into compact domains, i.e. well-folded parts, and manually docking them into experimental maps to fix the residue locations. In contrast, DeepTracer-Refine is an automated method that splits AlphaFolds prediction into compact domains and aligns them to DeepTracers prediction instead of an experimental map.
Figure 1.

An illustration of the two approaches in protein structure prediction. (A) Map-to-model detects the residues from a cryo-EM electron density map and connects them into a 3D structure through backbone tracing. (B) Sequence-to-model uses a protein sequence as input to fold the 1D sequence into a 3D structure.
Table 1.
Peak detection algorithm filtering parameter comparison
| Algorithm | Minimum peak height | Minimum peak-to-peak distance | Threshold | Prominence | Peak width | Plateau size | Sliding window |
|---|---|---|---|---|---|---|---|
| scipy.singal. find_peaks | x | x | x (vertical distance to neighboring samples) | x | x | x | |
| Marco Duarte detect_peaks | x | x | x (peak height in relation to neighboring peaks) | ||||
| peakutil.peak. indexes | x | x | |||||
| sixtenbe peakdetect | x | ||||||
| Octave-Forge findpeaks | x | x | x (fitted parabola) | x | |||
| Jankoslavic findpeaks | x | x | |||||
| Tony Beltrameli detect_peaks | x (peak to average ratio) | ||||||
| David Albanese mlpy.findpeaks_ dist | x | ||||||
| David Albanese mlpy.findpeaks_ win | x |
Table 2.
RCSB advance search results
| PDB ID | EMDB ID | Resolution (Å) | Sequence length | Multimeric protein? |
|---|---|---|---|---|
| 3JBS | EMD-6478 | 2.9 | 176 | Unsure |
| 3JCI | EMD-6555 | 2.9 | 190 | Yes |
| 6FU8 | EMD-4319 | 3.2 | 82 | Unsure |
| 6I5A | EMD-4413 | 2.3 | 159 | Yes |
| 6JJA | EMD-9705 | 2.91 | 174 | Yes |
| 6R7M | EMD-4628 | 1.92 | 153 | Yes |
| 6S44 | EMD-10097 | 3.19 | 172 | Yes |
| 6TGY | EMD-10501 | 122 | 122 | Yes |
| 7EFC | EMD-31083 | 1.7 | 183 | Yes |
| 7OHF | EMD-12901 | 3.0 | 176 | Yes |
| 7R1C | EMD-14238 | 3.2 | 88 | Yes |
| 7RX5 | EMD-24725 | 3.4 | 29 | Yes |
| 7TPK | EMD-26058 | 3.4 | 194 | Unsure |
| 7UII | EMD-26546 | 2.6 | 183 | Yes |
| 7ZQE | EMD-14872 | 2.55 | 145 | Unsure |
| 8CH5 | EMD-16657 | 3.2 | 50 | Yes |
| 8GI2 | EMD-40060 | 3.0 | 165 | Yes |
| 8J5A | EMD-35984 | 1.19 | 172 | Yes |
| 8JNG | EMD-33597 | 3.2 | 197 | Unsure |
| 8JNL | EMD-33597 | 3.2 | 96 | Yes |
| 8JNM | EMD-33597 | 3.2 | 109 | Yes |
| 8P34 | EMD-17383 | 2.61 | 94 | Unsure |
| 8PV9 | EMD-17958 | 2.7 | 166 | Yes |
| 8PVJ | EMD-17968 | 3 | 162 | Yes |
| 8QN7 | EMD-18509 | 2.7 | 40 | Unsure |
PROTEIN STRUCTURE
Briefly, a protein structure consists of one or multiple chains of amino acids. When two amino acids are bonded together through a peptide bond, a water molecule is released and the remaining components are called residues. Thus, we can consider a residue as the basic unit of a protein structure. A polypeptide chain is a sequence of many amino acids bonded together in a linear fashion to form the three-dimensional shape of a protein structure. There are 20 types of amino acids observed in natural protein sequences and each comprising a backbone and a side-chain portion. The backbone of every amino acid is composed of the same atoms that link together to form the ‘skeleton’ of the structure. However, it is the side chain that differentiates an amino acid’s type.
Challenges of map-to-model approaches
The main objective of map-to-model methods is to determine the type and location of residues and subsequently connect them into a three-dimensional structure. Map-to-model methods often utilize machine learning-based computer vision algorithms to detect the residues from experimental maps, however, they employ various strategies to connect the identified residues. In order to predict an accurate structure, the type of residues must be correctly identified and then connected in the correct sequential order. De novo methods commonly employ heuristic path-walking and tree-graph algorithms to connect the residues without requiring a database of template structures [3–6]. However, it is a challenge to accurately identify amino acid types due to the limited resolution of cryo-EM, which makes it difficult for machine learning algorithms to precisely classify the side chains and predict amino acid type. As a consequence, de novo methods, such as DeepTracer, typically have to post-process the initial result to improve the sequence prediction.
DeepTracer utilizes a 3D convolutional neural network called the U-Net to identify residues from cryo-EM density maps. However, like other non-template-based de novo methods, DeepTracer can only identify residues within the region of experimental maps that cover the protein. Consequently, experimental maps often do not cover the entire structure of the imaged protein, therefore, DeepTracers predicted structural coverage is often incomplete (thereafter called ‘residue coverage’). This is also the reason why many manually solved structures exhibit missing residues. In addition, experimental maps are noisy in nature and can vary in sizes and qualities. Although DeepTracer has attempted to address these problems by pre-processing the density maps into consistent input, it is impossible to train a machine learning model that works on every input without overfitting. On high-resolution and high-quality density maps like EMD-20621 [10], DeepTracer can achieve above 90% residue coverage, however, it is the remaining 10% that poses challenges for DeepTracer.
The first challenge is false connections during the process of connecting residues, also known as backbone tracing. The order of connecting the residues determines the predicted protein sequence. If the residues are connected in the wrong order, then the sequence would also be out-of-order and thus incorrect. DeepTracer employs a traveling salesman algorithm to trace the backbone, which connects the closest residues based on Euclidean coordinates. However, the issue arises when residues are missing and it causes a faulty connection in the backbone. In such cases, the nearest residue in space is often not the next closest sequential residue, as highlighted in the example of EMD-20621 (Figure 2B).
Figure 2.

Current challenges of map-to-model methods. (A) Cryo-EM maps lack the resolution to provide atomic-level details for accurate side-chain identification even at high resolution. Two residues, phenylalanine and tyrosine, are placed in cryo-EM density map EMD-20621 and the side-chains are indistinguishable from the map. The balls represent atoms and the circled atoms in the top half of the residues are the side-chain atoms. (B) Missing residues causing false connections. In the close-up section from DeepTracer's prediction, the balls represent residues and DeepTracer missed four residues (enclosed by the oval) causing the backbone to be connected incorrectly.
Table 3.
DeepTracer Refine’s results on 3.6–5 Å cryo-EM maps
| EMDB ID | PDB ID | Resolution | % ColabFold Residue Coverage | ColabFold lDDT | % DeepTracer Refine Residue Coverage | DeepTracer Refine lDDT |
|---|---|---|---|---|---|---|
| 4053 | 5LII | 3.8 | 12.9 | 0.416 | 47.1 | 0.272 |
| 8642 | 5V7V | 3.9 | 91.0 | 0.591 | 94.6 | 0.659 |
| 10 387 | 6T6V | 4.5 | 37.6 | 0.655 | 54.6 | 0.402 |
| 13 545 | 7PN1 | 3.9 | 35.3 | 0.458 | 70.6 | 0.587 |
| 14 728 | 7ZHA | 3.55 | 75.4 | 0.598 | 92.6 | 0.691 |
| 16 354 | 8C03 | 3.89 | 63.2 | 0.518 | 96.5 | 0.771 |
| 21 901 | 6WU0 | 3.59 | 10.9 | 0.658 | 60.2 | 0.416 |
| 21 986 | 6X12 | 3.52 | 86.5 | 0.653 | 92.6 | 0.677 |
| 22 630 | 7K1V | 4.6 | 16.9 | 0.401 | 24.1 | 0.219 |
| 23 970 | 7MSW | 3.76 | 21.4 | 0.137 | 42.2 | 0.149 |
| 24 324 | 7R9E | 4 | 55.6 | 0.345 | 55.6 | 0.345 |
| 24 677 | 7RSQ | 3.8 | 23.2 | 0.403 | 64.2 | 0.272 |
| 24 690 | 7RTV | 3.96 | 0.0 | 0.762 | 52.5 | 0.621 |
| 24 794 | 7S15 | 3.8 | 64.7 | 0.548 | 85.1 | 0.647 |
| 24 922 | 7S8U | 3.7 | 76.3 | 0.586 | 79.6 | 0.592 |
| 24 941 | 7S9Y | 3.56 | 88.5 | 0.667 | 95.3 | 0.723 |
| 25 170 | 7SK2 | 3.82 | 18.2 | 0.595 | 29.9 | 0.357 |
| 26 729 | 7US9 | 3.8 | 60.0 | 0.745 | 79.3 | 0.636 |
| 26 815 | 7UVP | 3.7 | 73.4 | 0.708 | 90.3 | 0.725 |
| 26 992 | 8CTJ | 4.74 | 5.2 | 0.701 | 33.2 | 0.434 |
| 27 062 | 8CXO | 3.7 | 61.0 | 0.435 | 78.6 | 0.528 |
| 27 394 | 8DEP | 3.6 | 95.5 | 0.748 | 97.2 | 0.741 |
| 27 655 | 8DQK | 4 | 20.1 | 0.627 | 33.7 | 0.243 |
| 27 681 | 8DRQ | 4.16 | 5.2 | 0.615 | 15.0 | 0.28 |
| 27 899 | 8E50 | 3.67 | 94.0 | 0.778 | 94.0 | 0.778 |
| 28 586 | 8ET6 | 3.57 | 71.1 | 0.559 | 77.4 | 0.581 |
| 28 589 | 8ET9 | 3.61 | 75.8 | 0.632 | 84.1 | 0.677 |
| 28 653 | 8EX7 | 3.53 | 62.6 | 0.625 | 98.1 | 0.811 |
| 28 817 | 8F2I | 5 | 3.1 | 0.22 | 17.3 | 0.226 |
| 29 002 | 8FD5 | 4.57 | 12.9 | 0.148 | 19.8 | 0.114 |
| 31 383 | 7EYF | 5.3 | 7.0 | 0.324 | 15.2 | 0.163 |
| 31 599 | 7FIJ | 3.8 | 11.1 | 0.453 | 19.1 | 0.328 |
| 32 293 | 7W3T | 3.59 | 0.0 | 0.785 | 33.5 | 0.628 |
| 33 604 | 7Y49 | 3.67 | 3.5 | 0.368 | 4.2 | 0.273 |
| 33 756 | 7YDQ | 4.04 | 9.7 | 0.392 | 37.8 | 0.187 |
| 34 098 | 7YU4 | 3.7 | 92.9 | 0.772 | 93.6 | 0.772 |
| Avg. | 3.93 | 43.9 | 0.545 | 60.4 | 0.487 |
The second challenge involves the accuracy of the predicted sequence. Although DeepTracer can effectively identify residues from near-atomic cryo-EM density maps, it cannot accurately classify the residue types due to resolution limits. Current high resolution maps have a resolution ~2 to 4 Å, however, the diameter of an atom is ~1 Å so it is insufficient to distinguish individual atoms (Figure 2A). DeepTracer classifies residue types based on the shape of their side-chain atom groups. However, even at high resolution, the level of density details is insufficient to clearly differentiate the side-chain shapes. Since the sequence is determined by the amino acid types and their sequential order, false connections and incorrect type predictions result in an inaccurately predicted sequence. To address this issue, DeepTracer solves this problem by performing a sequence alignment between the predicted sequence and true sequence. It uses dynamic programming to find the best alignment between the two sequences and then replaces the predicted sequence with the true sequence. While the sequence alignment is effective, its accuracy depends on the quality of the backbone trace, in which the false connections can influence its effectiveness.
Challenges of sequence-to-model approaches
The main objective of sequence-to-model is to fold protein sequences into a three-dimensional conformation using evolutionary information and energy functions. A protein sequence is a linear arrangement of amino acids like words in a sentence. Every type of amino acid possesses different side-chain charges and they exert forces on each other when bonded together. The 1D sequence is inclined to fold into a stable 3D conformation with the lowest energy landscape based on Anfinsen’s thermodynamic hypothesis [11]. As such, proteins fold into distinctive shapes depending on the combination of amino acids and thus the sequences embed rich information regarding their structure. Methods have been proposed to utilize natural language processing techniques to extract useful information from protein sequences [12–15]. However, deriving the 3D structure through an energy-guided approach presents a large search space [16], which limits prior sequence-to-model methods to fold only small to medium proteins (<800 residues) [17, 18].
AlphaFold2, which we will refer to as AlphaFold, is the second version of AlphaFold and it achieved groundbreaking accuracy in the 14th Critical Assessment of Structure Prediction (CASP14) conference [19]. It and other similar sequence-to-model methods [20] have recently adopted a novel machine-learning architecture termed the transformer [21]. The transformer has a unique attention mechanism capable of learning contextualization, and therefore, significantly reducing the search space for an energy-based approach [22]. AlphaFold also combined evolutionary information by using multiple sequence alignment to further achieve state-of-the-art accuracy. Since AlphaFold uses true sequence as the input, it does not suffer from the same residue coverage and sequence prediction issues that map-to-model methods have. The main challenge of AlphaFold is accurately folding the regions between protein domains. In structural biology, a protein domain is a spatially distinct unit that is folded in a compact conformation [23]. AlphaFold models are often less confident at the inter-domain regions due to the flexible and intrinsically disordered nature of these regions [18, 24].
DeepTracer-Refine pipeline
Map-to-model and sequence-to-model approaches have their own advantages which can potentially address each other’s challenges. To leverage the strengths of both methods, we developed DeepTracer-Refine to utilize the accurate sequence information from AlphaFold structures and improve their less accurate backbone geometries using DeepTracers prediction. DeepTracer-Refine is an automated pipeline that detects optimal locations to split the AlphaFold structure into compact domains and performs iteratively alignments to improve the predicted structure (Figure 3). AlphaFold generates a per-residue metric called the predicted Local Distance Difference Test (pLDDT) to estimate the confidence level for each residue in its prediction [19]. Research has shown a strong correlation between pLDDT and the accuracy of AlphaFolds predicted structure [22]. Therefore, we utilize pLDDT to determine the optimal splitting points in the structure. In a pLDDT graph, low-confidence regions are shaped like valleys, and we observed that steeper and deeper valleys often indicate better splitting spots compared with relying solely on the raw pLDDT score.
Figure 3.

The design of DeepTracer-Refine pipeline. We utilized AlphaFolds pLDDT score to detect and rank locations to split the structure into compact domains. We process the pLDDT scores first and calculate an empirical score for each possible low-confidence location. We rank the locations based on the empirical scores and a higher score suggests a poorer AlphaFold prediction. In this example of a rotavirus VP6 [28], we split the AlphaFold model at residue 148 and aligned each domain separately to DeepTracers prediction. The merged structure is improved as we can see the conformation of the right-side structure resembles more closely to the solved structure.
Since geometry is modified when we align the compact domains, the order in which we perform the alignments can affect the final result. We developed an empirical score based on pLDDT to quantify the poorness of the predicted geometry so we can rank them for splitting and alignment. We treat the pLDDT as a signal and process it in three steps: (1) smoothing the signal, (2) finding the prominent peaks and valleys, and (3) obtaining a score for each valley. We first process the signal by averaging nearby pLDDT values to remove noise so the peak detection is more reliable. Second, we apply Scipys find_peaks function to detect the peaks (local maximas) and valleys (local minimas). We use a prominence setting of six to ensure we only get the significant local maximas and minimas. A wider peak-to-peak distance indicates a valley is less steep, so we penalize it by subtracting the valley width from 200 (Equation 2). We use the average depth (Equation 1) and the valley width to calculate the final empirical score (Equation 3). A higher score suggests a less accurate fold.
 |
(1) |
 |
(2) |
 |
(3) |
We adopted an iterative alignment strategy so we are not limited to a fixed amount of alignments. For each detected valley, we attempt one iteration of a split-align-and-merge procedure and we stop once the alignment procedure has been attempted at every location. We start from the valley with the highest empirical score and we split the model into two compact domains then align them separately to DeepTracers prediction. We align the larger domain first so the smaller one will have a better chance to align to the correct position. If the aligned domains are not too distant to be connected, then we merge them together and calculate the residue coverage. If the residue coverage is increased by more than a threshold of 1%, then we consider it an improvement and we keep the refined structure; otherwise, we keep the previous structure. We also avoid splitting if the segment length of a domain is <40 residues. The segments cannot be too short because false alignments are more likely to occur. The result from the last round of the iterative split-align-merge process is the final DeepTracer-Refine output.
We employ two strategies to prevent false alignments. The first issue is overlapping alignments to which the compact domains are aligned to the same location on DeepTracers structure. Once we align the first domain, we remove the matching residues from DeepTracers structure to prevent the second domain from aligning to the same location. The second issue is distant alignment in which two domains are aligned so far apart that they cannot be physically connected. The intrinsically disordered regions are often loop sections so we check if there are enough residues to span the distance in-between the last non-loop residues from the ends of the compact domains. We count the number of residues of the loop section, multiply it by 3 Å, which is slightly less than the average distance between residues, and compare it with the distance between the last non-loop residues. According to our tests, both strategies decreased the number of false alignments when using heuristic alignment algorithms.
A flexible structure alignment algorithm seems like an appropriate solution for fixing the inaccurately folded regions. FATCAT [25] is a flexible alignment method but we discovered that DeepTracers false connection and imperfect sequence prediction often led to many incorrectly transformed fragments. Since we are already splitting the AlphaFold model into shorter segments, we decided to use rigid body alignment methods, which includes PyMOL cealign [26], PyMOL align and Chimera MatchMaker [27]. We run all three algorithms on each compact domain and select the one with the highest residues coverage after merging. The AlphaFolds residue locations are updated when each domain is aligned to DeepTracers prediction.
Figure 4.

DeepTracer-Refine improvements in residue coverage (left y-axis, 0–100%) and lDDT score (right y-axis, 0.00–1.00). For each entry, the two left bars are residue coverage and the right two right bars are lDDT. The lighter shades represent initial AlphaFold results and the darker shades are DeepTracer-Refine results, respectively.
Experiment details
We used a local version of ColabFold [29, 30] to generate AlphaFold predictions. ColabFold with the default settings produces five models and we used the rank one model for our testing. We ran DeepTracer-Refine and the PHENIX software suite (version 1.20.1-4487) on a Windows machine with an Intel Core i7-4790 8-core CPU, 16 GB of RAM and an Nvidia GeForce GTX 780 Ti graphics card. All of the protein structures and cryo-EM density maps are visualized through UCSF Chimera [31].
Data set
We retrieved the cryo-EM density maps, solved structures and protein sequences from the RCSB protein data bank using PDB-IDs [32]. Since we are aligning AlphaFold models to DeepTracer structures, the target must first contain a corresponding cryo-EM density map. DeepTracer is optimized to work on near-atomic resolution maps so we filtered the search to cryo-EM with a resolution of 3.5 Å or higher. We then limited the number of residues per target from 200 to 1000 to ensure the protein is not too small and the ColabFold run-time is within a reasonable range. We only tested on monomeric proteins, i.e., single-chain proteins, otherwise compact domains can be aligned to more than one location in a symmetrical multimer with duplicate copies of chain(s). We conducted a query based on these parameters via RCSB advanced search and it returned 59 targets. After manually removing the multimers and duplicates, we were left with a total of 39 targets. Please refer to the Supplemental Material section Table S1 for the full list of proteins as well as Tables S2-S7 for the experiment results.
Evaluation metric
In order to evaluate DeepTracer-Refine, we used the solved structure as ground truth for our comparisons and utilized two metrics to evaluate the results. The first is overall structural coverage in the form of residue matching percentage (Equation 4). We consider a predicted residue and a solved residue matching if they are within a 3 Å distance. Since residue matching relies on superpositioning, we used Chimera MatchMaker to align the AlphaFold prediction to the solved structure to calculate the initial residue coverage. We assume that if the matching percentage increased after DeepTracer-Refine, then we have improved the initial AlphaFold structure. However, residue coverage does not convey structural similarity so we use the local Distance Difference Test (lDDT) score as the second metric.
 |
(4) |
Since we are only comparing the backbone geometry, we use Cα-lDDT, which only considers the Cα atom for each residue. The structural similarity between a solved and predicted residue is quantified by the fraction of preserved distances with regards to their respective neighboring residues [33]. The size of the neighborhood is determined by the inclusion radius. The default is 15 Å because it allows lDDT to ignore movements of compact domains, meaning that two structure can be viewed as similar even if the corresponding domains are not in the same relative location. However, we are attempting to address the imprecisely folded flexible regions so we need to set a large inclusion radius to ignore domain movements. We chose an inclusion radius of 200 Å to include all pairs of residues in our evaluation. A distance is considered preserved if the difference between the same pair of residues from the predicted and solved structure is within a threshold. The final lDDT score is an average of the results from four thresholds, 0.5, 1, 2 and 4 Å.
 |
(5) |
RESULTS
We first compared the results of DeepTracer-Refine with AlphaFolds initial predictions to evaluate the effectiveness of our method. DeepTracer-Refine increased the overall average residue coverage from 77.8 to 90.0% and average lDDT from 0.667 to 0.707. Out of the 39 targets, it improved 27 of the structures according to the increase in both residue coverage and lDDT. There were also eight unimproved and four worsened structures. The average residue coverage and average lDDT for the unaltered and unimproved structures were 95.84% and 0.799. We argue that they were already adequate for manual refinement and thus do not require DeepTracer-Refine. Although the residue coverage increased for all but five models, there were a total of seven that decreased in lDDT scores and four out of the seven with visible negative structural changes. For the full list of the result, please refer to the supplementary section.
One of the most improved structures was a human norovirus GII.2 Snow Mountain Virus strain VLP asymmetric unit (Figure 5A) [10]. We saw improvements in both the residue coverage and lDDT score, with an increase of 32.7% in residue coverage and 0.321 in lDDT. Initially, the top-left domain of the AlphaFold model from residues 1 to 218 was incorrectly folded. DeepTracer-Refine split the AlphaFold model at residue 218 and aligned each half correctly. The original DeepTracer prediction was very accurate in this case and it achieved 97.5% residue coverage. The DeepTracer backbone did not contain any false connections so it effectively aligned the sequence and improved the predicted sequence accuracy to 93.5%. In another case, a human OCT3 in lipid nanodisc [34], the sequence prediction of DeepTracer was not as accurate as the previous example. DeepTracer achieved 88.4% residue coverage but only attained 59.8% sequence accuracy even after sequence alignment. This was mainly due to false connections that reduced the effectiveness of the sequence alignment post-processing step. In Figure 5B, the red encircled region represents residues 330 to 554, and there is a noticeable difference in the conformation when compared with the solved structure 7ZH0. DeepTracer-Refine improved the conformation of this region and increased the residue coverage from 67.5 to 90.7% and the lDDT from 0.579 to 0.679.
Figure 5.

Examples of structural improvements after DeepTracer-Refine. In both examples, the solved and DeepTracer structures do not have complete residue coverage. On the other hand, AlphaFold and DeepTracer-Refine structures contain the entire sequence but the backbones are not accurate enough for the residues to be matched so the residue coverage is incomplete as well. (A) The original DeepTracer prediction is accurate in residue coverage and predicted sequence. DeepTracer-Refine split the AlphaFold model at residue 218 and aligned each half correctly. (B) An example when the original DeepTracer is not as accurate in sequence prediction. DeepTracer-Refine improved the encircled region to be more similar with the solved structure.
Comparison against Phenix-Refine
Next, we compared DeepTracer-Refine with a similar method from the PHENIX software suite, which we will refer to as Phenix-Refine [35]. It consists of two main parts, which includes docking-and-rebuilding AlphaFolds prediction from a cryo-EM density map, and utilizing AlphaFold to refold the rebuilt structure. Since Terwilliger et al. have already shown that iterative refolding using the rebuilt structures as AlphaFold templates can further improve the predicted structure, we only compared DeepTracer-Refine with the docking-and-rebuilding portion of their method. The first step is the Process Predicted Model method that removes any residues with a pLDDT score of 0.700 or less and groups the remaining residues into three compact domains. The second step is using Dock Predicted Model to fit the three compact domains into the cryo-EM density map. Lastly, Rebuild Predicted Model traces the trimmed backbone from the density map.
On average, DeepTracer-Refine achieved a residue coverage of 90.0%, which slightly exceeded Phenix-Refine’s 88.4%. On the other hand, Phenix-Refine improved the average lDDT to 0.728 as opposed to DeepTracer-Refine’s 0.707. We attribute the lesser lDDT score to the four structures that worsened after DeepTracer-Refine. This indicates that Phenix-Refine is overall marginally better at improving AlphaFold structures. However, we observe that DeepTracer-Refine is more effective at improving structures with poorer initial results. In Figure 6, we compare the results of both refinement methods with the original AlphaFold predictions and observe that DeepTracer-Refine generally outperforms Phenix-Refine when the initial residue coverage is <80% and the initial lDDT is <0.65. Furthermore, Phenix-Refine takes magnitudes longer for the docking and rebuilding methods to complete. DeepTracer-Refine outperformed Phenix-Refine in run-time on all testing targets and this is mainly due to DeepTracer utilizing the graphics card to accelerate the backbone tracing process.
Figure 6.

Top right and top left graphs compare the results of DeepTracer-Refine and Phenix-Refine with AlphaFolds initial predicted structures. DeepTracer-Refine is more effective when the initial AlphaFold prediction is less accurate (residue coverage <80% and lDDT <0.65). Bottom graph compares the run-time performance and it is displayed in logarithmic scale. The average run-time of DeepTracer-Refine is ~8 min while Phenix-Refine is 3 h and 35 min.
DISCUSSION
There were four targets that improved in residue coverage after DeepTracer-Refine but decreased in lDDT score, which indicates worsened structures. There are two main reasons why DeepTracer-Refine was unable to improve the initial AlphaFold structure. The first was caused by missing residues in DeepTracers prediction, such as 7USB [36] and 7WQX. The corresponding density map EMD-26731 contained weak-density regions so DeepTracer did not trace the backbone properly (Figure 7). This is evident when comparing the solved structure to the AlphaFold prediction. The sequence length is 337 but only 213 residues were modeled in the solved structure. In this instance, DeepTracer-Refine could not correctly align the compact domains due to the absence of backbone geometry. The second type of worsened result occurs when AlphaFolds initial prediction is not accurate enough. DeepTracer-Refine was designed to address incorrect movements between domains but not designed to fix imprecise folds within a protein domain.
Figure 7.
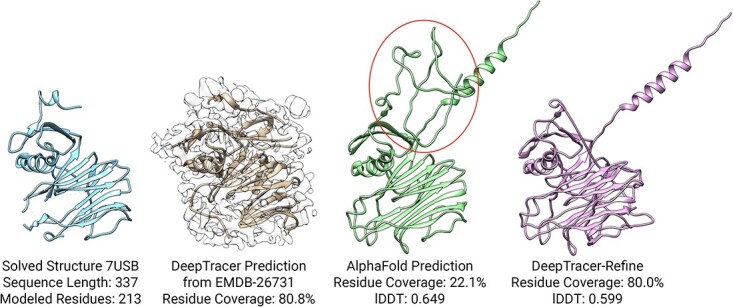
An example of a worsened AlphaFold structure after DeepTracer-Refine. This is caused by the missing backbone in the DeepTracer prediction (highlighted in the circle) so the compact domains were unable to be properly aligned.
We employed two strategies to prevent compact domains from aligning to false locations. Without the distance checking strategy, the average improvement dropped slightly from 90.0 to 89.9% for residue coverage and 0.707 to 0.705 for lDDT. Although very few targets benefitted from this strategy and the improvement seems negligible, it prevented false alignments. In Figure 8, solved structure 7XGR [37] contained 671 resides but only 546 were modeled, the region with missing residues is encircled in red. However, the density was present in the cryo-EM density map EMDB-33187 so DeepTracer predicted the geometry in that region. Since it contained many similar helical structures, DeepTracer-Refine incorrectly aligned one of the compact domain as highlighted by the blue circle. Therefore, we check the distance between the compact domains to avoid distant alignments in cases like these.
Figure 8.
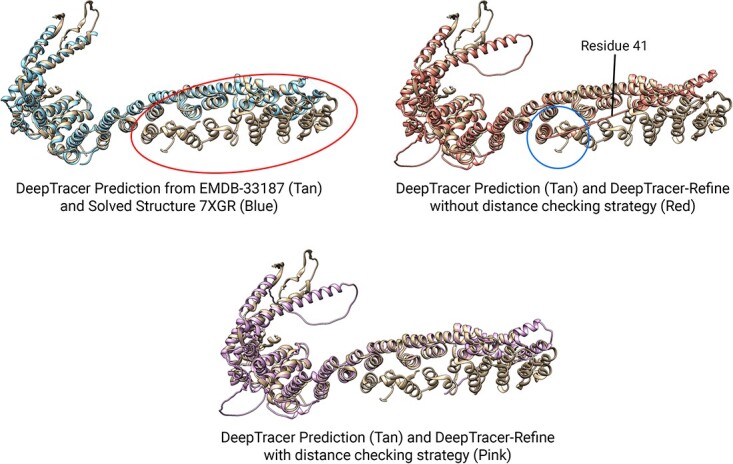
An example of DeepTracer-Refine’s result with and without the distance checking strategy. DeepTracer-Refine aligned the compact domain of residue 1–41 (top-right, highlighted by the circle) to a helical structure that is similar to it, however it is too far away to be considered as a possible alignment.
We have shown that the prediction of DeepTracer can be employed to improve the imprecise movements of AlphaFolds compact domains. However, we did not refine the backbone on an individual residue level due to the challenge in mapping residues between AlphaFold and DeepTracer structures. Both our method and Phenix-Refine only utilize cryo-EM density maps for compact domain docking, and therefore, we are indirectly supplementing structural information to AlphaFolds predictions. If we are able to accurately match residues from a map-to-model structure onto a sequence, then we could supplement the structural information directly from a cryo-EM density map to AlphaFold. As such, AlphaFold would be able to reference spatial information from experimental density maps to improve the low-confidence folds. In early 2023, Model Angelo has not only addressed the issue of structure-to-sequence residue matching but also provided a method to refine the backbone geometry of a predicted structure [9]. We are inspired by its backbone refinement module and we are working on a method to refine the backbone of a sequence-to-model structure on an individual residue level.
CONCLUSION
Recently, AlphaFold2 has dramatically increased its prediction accuracy, while map-to-model methods such as DeepTracer have slowly reached their limits. Although, AlphaFold2 does not require an experimental map to produce highly plausible structures, its results only represent a hypothetical prediction based on the knowledge learned from solved structures, which are derived from experimental maps and protein sequences. Meanwhile, map-to-model methods like DeepTracer determine protein structures from experimental maps, which are ground truth representations of proteins, but they do not take full advantage of the true sequence. Therefore, there is a practical application to use the ground truth backbone conformation from the experimental maps to validate and improve AlphaFolds hypothesis when the resolution is better than 4 Å. We utilized DeepTracers fast and automated pipeline to produce a reference structure to refine AlphaFolds prediction and demonstrated it is possible to automate such a process. The next step would be including experimental maps as inputs into AlphaFold so it could make use of the experimental density information when making a prediction of the backbone structure.
In this paper, we presented and tested an automated method that improved the overall conformation of AlphaFolds initial prediction by utilizing DeepTracer. Our main contribution is proposing a method to quantify the poorness of low-confidence locations from an AlphaFold prediction and employ it to reliably detect and rank optimal splitting locations. Our second contribution is demonstrating that even though DeepTracers predictions contain faults, they are still very effective for aligning the compact domains using various alignment algorithms. We have shown that it is not necessary to use cryo-EM electron density maps to dock the compact domains and we can speed up the run-time as a result. We tested our method on 39 multi-domain protein structures and compared it with AlphaFold. We increased the average residue coverage from 78.2 to 90.0% and average lDDT score from 0.67 to 0.71, which indicates a significant improvement in structural similarity to the solved structures.
Key Points
Protein structures predicted from cryo-EM electron density maps can be utilized to improve the backbone geometry of AlphaFolds predictions.
We can utilize AlphaFolds pLDDT scores to estimate optimal locations to split AlphaFold structures for alignment.
Using cryo-EM structure predictions for compact domain docking can be faster than cryo-EM density maps.
FUNDING
This material is based upon work supported by the Graduate Research Award of Computing and Software Systems Division and the SRCP Seed Grant at University of Washington Bothell to D.S.
DATA AVAILABILITY
Software, documentation and datasets are available at the DeepTracer website: https://deeptracer.uw.edu/.
Supplementary Material
Author Biographies
Jason Chen received Master’s degree from the Division of Computing and Software Systems at University of Washington Bothell. He is interested in protein folding and bioinformatics.
Ayisha Zia is a researcher at the Department of Biochemistry and Molecular Genetics at University of Alabama Birmingham. She is interested in structural and computational biology.
Albert Luo attends The Overlake School and is interested in developing and testing web servers for the DeepTracer project.
Hanze Meng received Bachelor’s degree from the Department of Mathematics at University of Washington Seattle and is now pursuing Computer Science Master’s degree at Duke University. He is interested in system development for the DeepTracer project.
Fengbin Wang is a faculty at the Department of Biochemistry and Molecular Genetics at University of Alabama Birmingham.
Jie Hou is a faculty at the Department of Computer Science at Saint Louis University.
Renzhi Cao is a faculty at the Department of Computer Science at Pacific Lutheran University.
Dong Si is a faculty at the Division of Computing and Software Systems and an eScience affiliated professor at the University of Washington. He is the Director of the Data Analysis & Intelligent Systems (DAIS) group and Principal Investigator of the DeepTracer project.
Contributor Information
Jason Chen, Division of Computing and Software Systems, University of Washington Bothell, Bothell, WA 98011, USA.
Ayisha Zia, Department of Biochemistry and Molecular Genetics, University of Alabama at Birmingham, Birmingham, AL 35233, USA.
Albert Luo, Division of Computing and Software Systems, University of Washington Bothell, Bothell, WA 98011, USA.
Hanze Meng, Department of Computer Science, Duke University, Durham, NC 27708, USA.
Fengbin Wang, Department of Biochemistry and Molecular Genetics, University of Alabama at Birmingham, Birmingham, AL 35233, USA.
Jie Hou, Department of Computer Science, Saint Louis University, Saint Louis, MO 63103, USA.
Renzhi Cao, Department of Computer Science, Pacific Lutheran University, Tacoma, WA 98447, USA.
Dong Si, Division of Computing and Software Systems, University of Washington Bothell, Bothell, WA 98011, USA.
References
- 1. Assaiya A, Burada AP, Dhingra S, Kumar J. An overview of the recent advances in cryo-electron microscopy for life sciences. Bose K, editor.Emerg Top Life Sci 2021;5(1):151–68. [DOI] [PubMed] [Google Scholar]
- 2. Alberts B, Johnson A, Lewis J. Molecular Biology of the Cell, 4th edn. New York: Garland Science, 2002. [Google Scholar]
- 3. Terashi G, Kihara D. De novo main-chain modeling for EM maps using MAINMAST. Nat Commun 2018;9(1):1618. [DOI] [PMC free article] [PubMed] [Google Scholar]
- 4. Liebschner D, Afonine PV, Baker ML, et al. Macromolecular structure determination using X-rays, neutrons and electrons: recent developments in Phenix. Acta Cryst D 2019;75(10):861–77. [DOI] [PMC free article] [PubMed] [Google Scholar]
- 5. Li PN, Oliveira SHP, Wakatsuki S, Bedem H.Sequence-guided protein structure determination using graph convolutional and recurrent networks. 2020 IEEE 20th International Conference on Bioinformatics and Bioengineering 2020:122–127.
- 6. Pfab J, Phan NM, Si D. DeepTracer for fast de novo cryo-EM protein structure modeling and special studies on CoV-related complexes. Proc Natl Acad Sci U S A 2021;118(2): e2017525118, 1–12. [DOI] [PMC free article] [PubMed] [Google Scholar]
- 7. Zhang X, Zhang B, Freddolino PL, Zhang Y. CR-I-TASSER: assemble protein structures from cryo-EM density maps using deep convolutional neural networks. Nat Methods 2022;19(2):195–204. [DOI] [PMC free article] [PubMed] [Google Scholar]
- 8. He J, Lin P, Chen J, et al. Model building of protein complexes from intermediate-resolution cryo-EM maps with deep learning-guided automatic assembly. Nat Commun 2022;13(1):4066. [DOI] [PMC free article] [PubMed] [Google Scholar]
- 9. Jamali K, Kimanius D, SHW Scheres. A graph neural network approach to automated model building in cryo-EM maps. The Eleventh International Conference on Learning Representations 2022. http://arxiv.org/abs/2210.00006.
- 10. Pang SS, Bayly-Jones C, Radjainia M, et al. The cryo-EM structure of the acid activatable pore-forming immune effector Macrophage-expressed gene 1. Nat Commun 2019;10(1):4288. [DOI] [PMC free article] [PubMed] [Google Scholar]
- 11. Anfinsen CB. Principles that govern the folding of protein chains. Science, New Series1973;181(4096):223–30. [DOI] [PubMed] [Google Scholar]
- 12. Bepler T, Berger B. Learning protein sequence embeddings using information from structure. Proceedings of ICLR 2019.
- 13. Alley EC, Khimulya G, Biswas S, et al. Unified rational protein engineering with sequence-based deep representation learning. Nat Methods 2019;16(12):1315–22. [DOI] [PMC free article] [PubMed] [Google Scholar]
- 14.ElAbd H, Bromberg Y, Hoarfrost A, et al. Amino acid encoding for deep learning applications. BMC Bioinformatics2020;21(235):1–14. [DOI] [PMC free article] [PubMed] [Google Scholar]
- 15. Rives A, Meier J, Sercu T, et al. Biological structure and function emerge from scaling unsupervised learning to 250 million protein sequences. Proc Natl Acad Sci U S A 2021;118(15):e2016239118. [DOI] [PMC free article] [PubMed] [Google Scholar]
- 16. Kuhlman B, Bradley P. Advances in protein structure prediction and design. Nat Rev Mol Cell Biol 2019;20(11):681–97. [DOI] [PMC free article] [PubMed] [Google Scholar]
- 17. Wang S, Sun S, Li Z, Zhang R, Xu J. Accurate de novo prediction of protein contact map by ultra-deep learning model. Schlessinger A, editor. PLoS Comput Biol 2017;13(1):e1005324. [DOI] [PMC free article] [PubMed] [Google Scholar]
- 18. Tunyasuvunakool K, Adler J, Wu Z, et al. Highly accurate protein structure prediction for the human proteome. Nature 2021;596(7873):590–6. [DOI] [PMC free article] [PubMed] [Google Scholar]
- 19. Jumper J, Evans R, Pritzel A, et al. Highly accurate protein structure prediction with AlphaFold. Nature 2021;596(7873):583–9. [DOI] [PMC free article] [PubMed] [Google Scholar]
- 20. Baek M, DiMaio F, Anishchenko I, et al. Accurate prediction of protein structures and interactions using a three-track neural network. Science 2021;373(6557):871–6. [DOI] [PMC free article] [PubMed] [Google Scholar]
- 21. Vaswani A, Shazeer N, Parmar N, et al. Attention is all you need. In: Proceedings of the 31st International Conference on Neural Information Processing Systems. 2017;30. [Google Scholar]
- 22.Roney JP, Ovchinnikov S. State-of-the-Art Estimation of Protein Model Accuracy Using AlphaFold. Phys Rev Lett. 2022;129(23):238101. [DOI] [PMC free article] [PubMed] [Google Scholar]
- 23. Ponting CP, Russell RR. The natural history of protein domains. Annu Rev Biophys Biomol Struct 2002;31(1):45–71. [DOI] [PubMed] [Google Scholar]
- 24. Ruff KM, Pappu RV. AlphaFold and implications for intrinsically disordered proteins. J Mol Biol 2021;433(20):167208. [DOI] [PubMed] [Google Scholar]
- 25. Ye Y, Godzik A. Flexible structure alignment by chaining aligned fragment pairs allowing twists. Bioinformatics 2003;19:ii246–55. [DOI] [PubMed] [Google Scholar]
- 26. Shindyalov IN, Bourne PE. Protein structure alignment by incremental combinatorial extension (CE) of the optimal path. Protein Eng 1998;11(9):739–47. [DOI] [PubMed] [Google Scholar]
- 27. Meng EC, Pettersen EF, Couch GS, et al. Tools for integrated sequence-structure analysis with UCSF chimera. BMC Bioinformatics 2006;7:1–10. [DOI] [PMC free article] [PubMed] [Google Scholar]
- 28. Grant T, Grigorieff N. Measuring the optimal exposure for single particle cryo-EM using a 2.6 Å reconstruction of rotavirus VP6. Elife 2015;4:e06980. [DOI] [PMC free article] [PubMed] [Google Scholar]
- 29. Mirdita M, Schütze K, Moriwaki Y, et al. Colabfold: making protein folding accessible to all. Nat Methods 2022;19(6):679–82. [DOI] [PMC free article] [PubMed] [Google Scholar]
- 30. Pettersen EF, Goddard TD, Huang CC, et al. UCSF chimera—a visualization system for exploratory research and analysis. J Comput Chem 2004;25(13):1605–12. [DOI] [PubMed] [Google Scholar]
- 31. Berman HM, Westbrook J, Feng Z, et al. The protein data bank. Nucleic Acids Res 2000;28(1):235–42. [DOI] [PMC free article] [PubMed] [Google Scholar]
- 32. Mariani V, Biasini M, Barbato A, Schwede T. lDDT: a local superposition-free score for comparing protein structures and models using distance difference tests. Bioinformatics 2013;29(21):2722–8. [DOI] [PMC free article] [PubMed] [Google Scholar]
- 33. Khanppnavar B, Maier J, Herborg F, et al. Structural basis of organic cation transporter-3 inhibition. Nat Commun 2022;13(1):6714. [DOI] [PMC free article] [PubMed] [Google Scholar]
- 34. Terwilliger TC, Poon BK, Afonine PV, et al. Improved AlphaFold modeling with implicit experimental information. Nat Methods 2022;19(11):1376–82. [DOI] [PMC free article] [PubMed] [Google Scholar]
- 35. Tortorici MA, Walls AC, Joshi A, et al. Structure, receptor recognition, and antigenicity of the human coronavirus CCoV-HuPn-2018 spike glycoprotein. Cell 2022;185(13):2279–2291.e17. [DOI] [PMC free article] [PubMed] [Google Scholar]
- 36. Guo Q, Zhao S, Francisco-Velilla R, et al. Structural basis for Gemin5 decamer-mediated mRNA binding. Nat Commun 2022;13(1):5166. [DOI] [PMC free article] [PubMed] [Google Scholar]
- 37. Cretin G, Galochkina T, Vander Meersche Y, et al. SWORD2: hierarchical analysis of protein 3D structures. Nucleic Acids Res 2022;50(W1):W732–8. [DOI] [PMC free article] [PubMed] [Google Scholar]
Associated Data
This section collects any data citations, data availability statements, or supplementary materials included in this article.
Supplementary Materials
Data Availability Statement
Software, documentation and datasets are available at the DeepTracer website: https://deeptracer.uw.edu/.