

Abstract
Background:
Per- and polyfluoroalkyl substances (PFAS) are drinking water contaminants. Tools to assess the potential body burden associated with drinking PFAS-contaminated water may be helpful for public health assessment of exposed communities.
Methods:
We implemented a suite of one-compartment toxicokinetic models using extensively calibrated toxicokinetic parameters (half-life and volume of distribution). We implemented the models both in the R programming language for research purposes, and as a web estimator for the general public (built in typescript.js). These models simulate exposure to PFAS water concentrations for individuals with varying characteristics such as age, sex, weight, and breastfeeding history. The models account for variability and uncertainty in parameter inputs to produce Monte Carlo-based estimates of serum concentration. For children, the models additionally account for gestational exposure, lactational exposure, and potential exposure through formula feeding. For adults who have borne children, the models account for clearance through birth and breastfeeding. We ran simulations of individuals with known PFAS water and serum concentrations to evaluate the model. We then compared the predicted serum PFAS concentrations to measured data.
Results:
The models accurately estimate individual-level serum levels for each PFAS for most adults (within ½ order of magnitude, Table 7). We found that the models somewhat overestimated serum concentrations for children in the tested locations, and that these overestimates are generally within an order of magnitude (Table 8).
Discussion:
This paper presents scientifically robust models that allow users to estimate serum PFAS concentrations based on known PFAS water concentrations and physiologic information. However, accuracy in historical water concentration inputs, exposure from non-drinking water sources, and life-history characteristics of individuals present a complex problem for individual estimation. Additional refinements to the model suite to improve the prediction of individual results may consist of including duration of exposure and additional life-history characteristics.
Keywords: PFAS, toxicokinetic model, serum estimates, drinking water
1. Introduction
Per- and polyfluoroalkyl substances (PFAS) are a large family of chemicals with broad applications in industrial and consumer products. The manufacture and use of PFAS have exposed human populations to the contaminants through multiple pathways, including water (Cordner et al., 2019; Environmental Working Group [EWG], 2020; Hu et al., 2016). PFAS contamination is of particular concern because many of these chemicals, including perfluorooctanesulfonic acid (PFOS), perfluorooctanoic acid (PFOA), perfluorononanoic acid (PFNA), and perfluorohexanesulfonate (PFHxS), are persistent in the environment. Contamination of drinking water supplies has led to chronic exposures in communities near places where PFAS were made or used. While most individuals have a detectable concentration of serum PFAS, individuals in communities with contaminated water may have significantly higher body burdens (e.g., Vestergren & Cousins, 2009; Post et al., 2017). In addition, some PFAS, including PFOA, PFOS, PFNA and PFHxS, have long half-lives in humans (Chiu et al., 2022). For adults who have borne children and who have current or past exposure to PFAS, the four compounds modeled are passed during gestation to the fetus and through breast milk to the nursing infant. This transfer results in higher levels in infants as well (Goeden et al., 2018, Kingsley et al., 2018, van Beijsterveldt et al., 2022).
Community members with known exposure to PFAS from drinking water have expressed a strong desire to know their PFAS serum concentrations (Gardner, 2019; Johnson, 2020; NPR, 2019) and those of their children (ATSDR, 2020a). While limited blood testing is available to some communities participating in scientific studies, blood testing for PFAS is not a routine test offered by most doctors or health departments. Therefore, toxicokinetic models may help community members estimate potential PFAS levels in their blood based on known PFAS concentrations in drinking water.
Three categories of existing models may be used to estimate human serum concentrations from drinking water inputs for PFOA and other PFAS. The first is simple water-to-serum ratios, built based on empirical data with paired water and serum concentrations in individuals (e.g., Bartell et al., 2010). The second category is one-compartment models that use parameters such as volume of distribution and half-life to estimate serum concentrations, in some cases pairing mother and infant compartments (e.g., Balk et al., 2019; Goeden et al., 2018; Minnesota Department of Public Health [MDH], 2017; Verner et al., 2016). The third category is multi-compartment models that take a more nuanced approach to the absorption, distribution, and excretion of PFAS (e.g., Loccisano et al., 2011, 2013; Worley et al., 2017; Chou & Lin, 2021; Brochot et al., 2019).
Our goal was to develop and evaluate toxicokinetic models for PFOS, PFOA, PFNA, and PFHxS that enable the general public to estimate their own levels of PFAS and that allow public health professionals and researchers to estimate serum concentrations of these PFAS. These models are designed to predict the current serum concentrations in an individual, given PFAS water concentrations and biographical and physiological information (e.g., birthdate, weight). The model parameters of half-life and volume of distribution for adults were calibrated in a previous study (Chiu et al., 2022). We evaluated the models with these calibrated parameters using human subjects from four sites with known historical PFAS water contamination. In addition to water concentrations, the exposure assessment dataset included consideration of exposure through employment, household products, and local produce as well as fish and game. Details of these studies are available for all four sites (ATSDR, 2021; ATSDR, 2022a; ATSDR, 2022b; ATSDR, 2022c). One serum measurement for each subject was collected in 2019, and water treatment and mitigation in these communities occurred between 2014 and 2016. Water concentrations were obtained from multiple sources, which may not capture a full range of historical PFAS concentrations in drinking water.
We developed the models in two implementations. For research use, we implemented the models in R code (we provide a link in the Supplemental Information). To help communities use the toxicokinetic models and understand their outputs, we also developed a user-friendly, in-browser estimator, which does not transfer data to any server, using the suite of models. These toxicokinetic models and the associated web estimator will estimate serum levels for community members. In some situations, these estimates may inform the user’s actions to reduce their exposure to PFAS. Users may also use these estimates to inform discussions with their health care providers about PFAS exposure. A public health agency may use either of these tools to identify where further investigation and potential action may be needed, thereby helping ATSDR fulfill its mission of protecting public health. This paper describes these toxicokinetic models and their evaluation. It also describes their implementation in a public-facing web estimator and describes the scientific methods, assumptions, and messaging.
2. Methods
In this section, we first give an overview of the toxicokinetic models that underlie both our R model and our web estimator (collectively referred to as estimators). We describe the data sources used in the estimators, then describe the implementation of the estimators and model evaluation process. Finally, we discuss the user output of the associated web estimator.
2.1. Toxicokinetic Models
We implement a suite of one-compartment toxicokinetic models (Figure 1) with Monte Carlo simulation (described in Section 2.3) to estimate individual serum concentration based on both user-defined inputs and model defaults. We then produce a suite of formulations of these models to describe different ages of individuals. All inputs were modeled as distributions and incorporated into the Monte Carlo simulation (Tables 1-5). The following sections describe the formulation of the models for older children and adults as well as for infants and children under age 6. Throughout this discussion and in calculations, water, breast milk, and serum concentrations are in units of micrograms per liter (). All body weight parameters are in kilograms (kg) of body weight. Timesteps are in days, and parameters with a time component are converted from years to days for all calculations.
Figure 1.
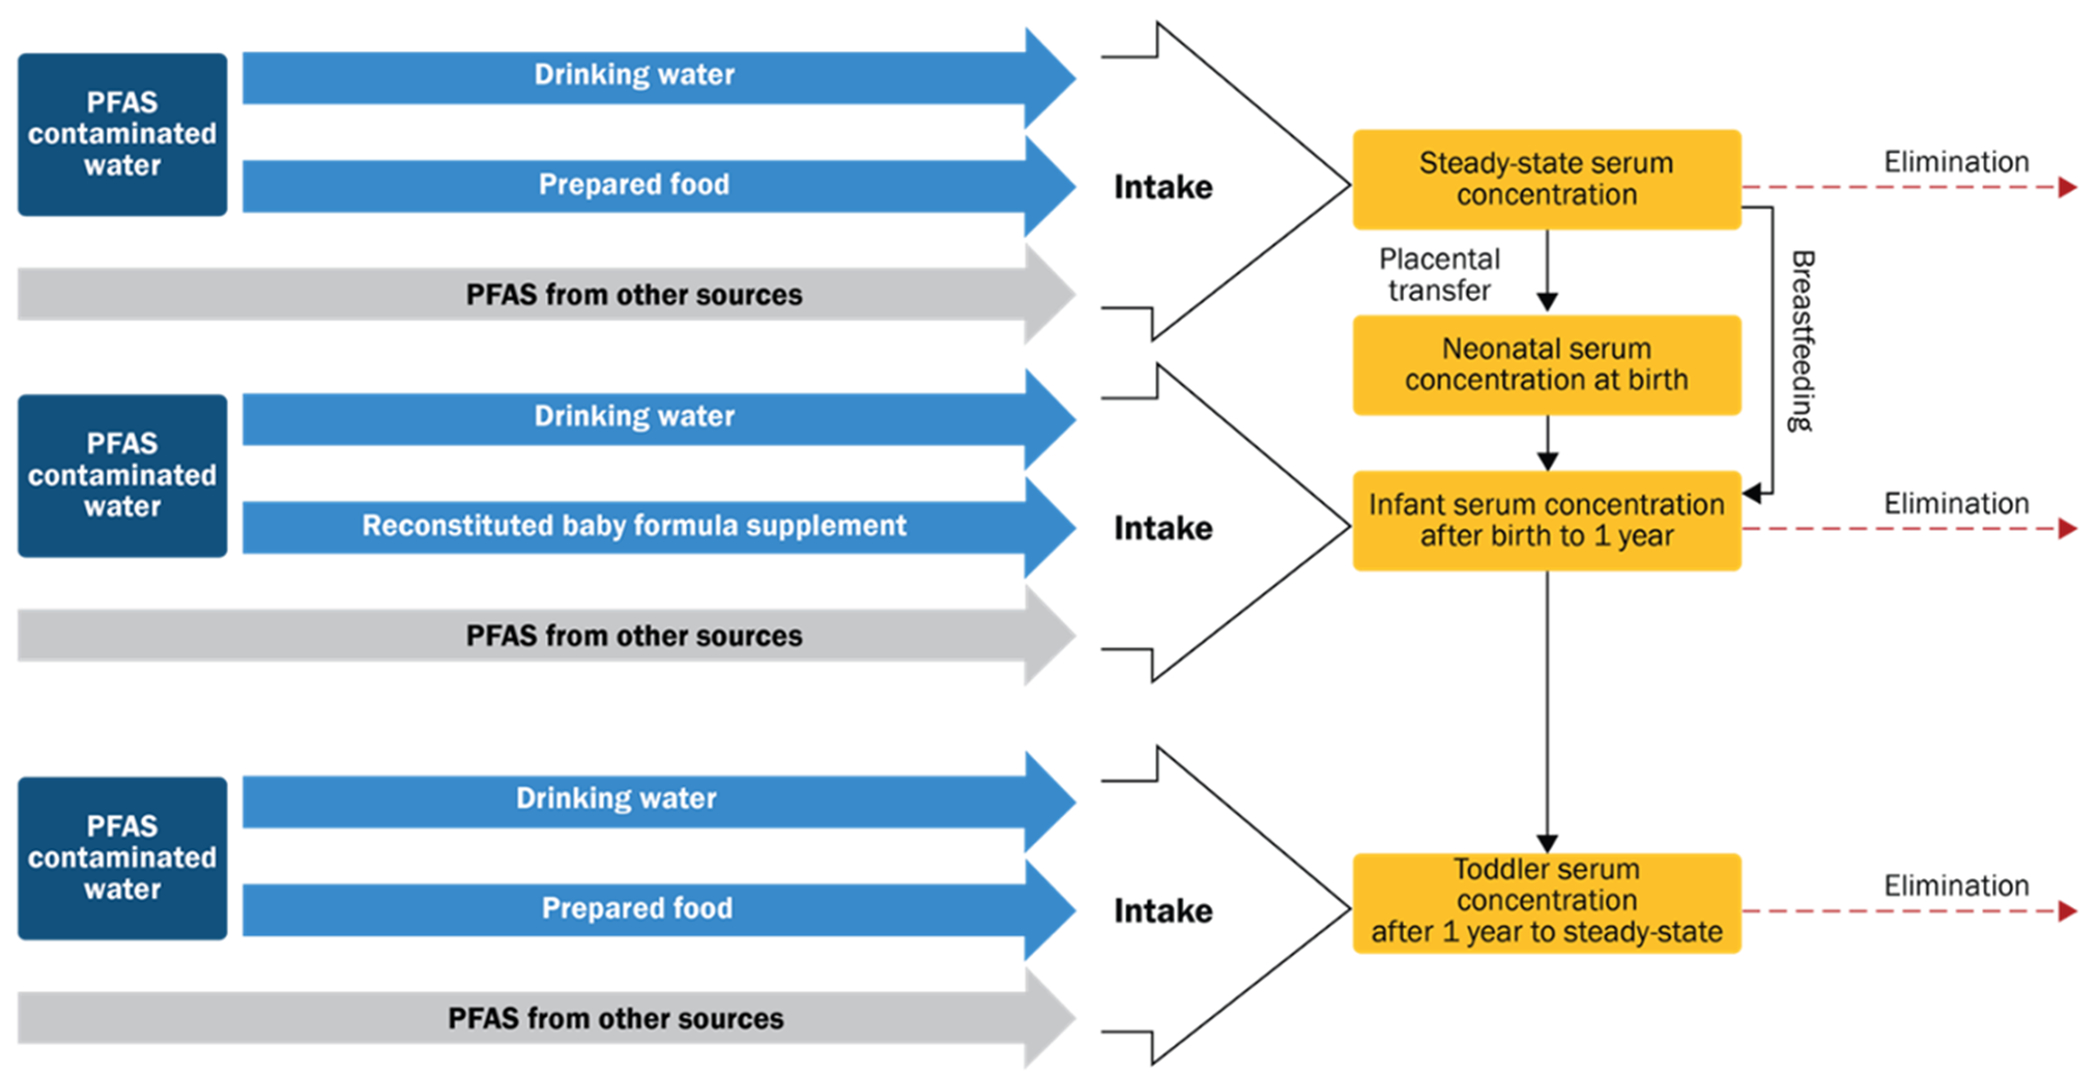
Basic schematic of model used for estimation. PFAS from non-drinking water sources is modeled using background serum values.
The calibration and evaluation of the key toxicokinetic parameters for volume of distribution (liters per kilogram, L/kg) and half-life (in years) (Table 1) in our models is described in Chiu et al. (2022). Toxicokinetic parameters, exposure parameters, and individual parameters for body weight and drinking water intake are described in the following sections. We convert time values to days for use in calculations over time defined by daily intake and number of days in a timestep.
Table 1.
Half-life and volume of distribution inputs.
| PFAS a | Half Life (GSD) years b | Volume of Distribution (GSD) L/kg |
|---|---|---|
| PFOA | 3.14 (1.57) | 0.43 (1.12) |
| PFOS | 3.36 (1.57) | 0.32 (1.1) |
| PFNA | 2.35 (1.53) | 0.19 (1.12) |
| PFHxS | 8.3 (1.57) | 0.29 (1.11) |
PFAS = per- and polyfluoroalkyl substances; PFOA = perfluorooctanoic acid. PFOS = perfluorooctanesulfonic acid; PFNA = perfluorononanoic acid; PFHxS = perfluorohexane sulfonate.
Values in this table are geometric means, and the values in parentheses are geometric standard deviations (GSD). See Chiu et al. (2022) for a description of how these parameters were calibrated.
Half-life is converted to days for timestep calculations.
For all ages, represents the daily PFAS dose through drinking water during a timestep:
| [1] |
Where
= body weight (kg) during the timestep as described in the Supplemental Information
= drinking water intake in liters per day (L/d) during the timestep as described in the Supplemental Information
= drinking water concentration () during the timestep as described in Section 2.2.3
2.1.1. Older Children and Adults
For simulations of individuals over age 6, the user is not asked about formula-feeding or breastfeeding history. We made this decision to reduce the data entry burden on the user during pilot testing. This assumption may underpredict serum levels for younger children exclusively breastfed as infants for the four PFAS included in the model (Mogensen et al., 2015). Simulations for older children and adults simply have their starting serum concentration at birth set to background (see Section 2.2.2).
For adults and older children, serum concentration at the end of the first timestep (t = 1) before accounting for clearance is calculated as
| [2] |
Where
= serum concentration () before accounting for clearance at the first timestep
= days in the timestep; default is 30 days
background serum concentration () as described in Section 2.2.2
volume of distribution (L/kg) as described in Section 2.2.1.
Clearance, or elimination, is then accounted for in each timestep (t ≥1):
| [3] |
Where
serum concentration () after accounting for clearance
k = the PFAS-specific decay constant (1/days)
= chemical half-life (days)
For all timesteps after the first (t > 1) calculations add the post-elimination serum concentration value for the last timestep (
| [4] |
adds the background serum concentration for exposure during the current timestep, as some background concentration is removed during the elimination step in Equation 3 and is further defined in Section 2.2.2.
2.1.2. Infants and Children Under Age 6
Infants and children under 6 are modeled using maternal serum concentrations as a starting point. In the case of both formula-fed and breastfed infants, we first model the mother’s serum concentration using a steady-state equation, with a simplified form of the equations above. This estimates maternal steady-state serum concentration ( due to drinking water alone, and without background :
| [5] |
Background PFAS concentration for a female adult over age 18 is then added in to produce the estimate of the mother’s serum level at time of delivery (
| [6] |
The infant’s serum level at birth is then estimated from the mother’s serum level using a unitless placental transfer factor (PTF), described in Model Inputs (Section 2.2.1.2).
For children aged 0 to 6 months the serum concentration at birth is calculated as:
| [7] |
For formula-fed infants, the pre-elimination serum concentration for all days after birth is estimated using the same method as for older children and adults (Equations 2-4). This assumes all formula is prepared with tap water. For breastfed infants, PFAS exposure through breast milk entirely replaces drinking water exposure for the first 6 months:
| [8] |
Where the daily dose through breast milk is calculated as:
| [9] |
and
= breast milk intake (L/d), see Supplemental Table 1
= breast milk concentration () at month (m) post-partum, see Supplemental Table 2
BW = median body weight (kg) by month of age
All breastfed infants are assumed to be breastfed exclusively for 6 months. After the first 6 months, the serum concentrations are calculated as they are for infants fed formula prepared with tap water (Equation 4).
The daily post-elimination serum concentration is calculated in the same way as for older children and adults (Equations 2-4). In addition, from birth through age 5, is adjusted using an age adjustment factor (see Section 2.2.1.1).
The initial breast milk concentration is estimated as the mother’s initial serum concentration at the infant’s birth, multiplied by the lactational transfer factor (LTF) for each PFAS.
| [10] |
Where:
= initial breast milk concentration ()
= mother’s serum level at time of delivery () (Equation 6)
= unitless lactational transfer factor as described in Section 2.2.1.3.
Rather than model the mother’s serum concentrations in concert with the infant’s over time, we used literature values for the decline in breast milk concentration over the course of breastfeeding. This reduces model complexity for use in the web-based estimator. Over 6 months, this decrease ranges from 40% to 52% in the Minnesota Department of Public Health’s (MDH’s) modeled results for PFOA (Goeden et al., 2018), consistent with data indicating a 47% reduction over 6 months for PFOA in other studies (Thomsen et al., 2010). Therefore, we reduce the initial estimated concentration in breast milk in each of months 2-6 by 10% from the previous month’s concentration. Due to the timestep of 30 days used in the model implementation, the breastmilk concentration remains constant for each 30-day timestep, and the 10% is applied at the end of the 30-days to the concentration in the previous timestep. The percent reductions for PFOS, PFHxS, and PFNA are scaled by their respective lactational transfer ratios (Table 2) to estimate reductions at the end of the 6-month period based on the observations for PFOA. These reductions are applied to infants’ breast milk intake during the 6 months of breastfeeding assumed in the model.
Table 2.
Placental transfer factors, lactational transfer factors, and resulting percent reduction of PFAS levels in mother’s blood.
| PFAS | Placental Transfer (unitless ratio) a | Breast Milk: Maternal Serum Transfer (unitless ratio) a | Percent Reduction at the End of 6 Months b | Reduction Assumed Each Month from Previous Month’s Level (Months 1-6) |
|---|---|---|---|---|
| PFOA | 0.87 | 0.052 | 47% | 10% |
| PFOS | 0.42 | 0.013 | 11.75% | 2.11% |
| PFNA | 0.53 | 0.01 | 12.65% | 2.29% |
| PFHxS | 0.7 | 0.014 | 9.04% | 1.56% |
For PFOA, PFOS, PFHxS: MDH, 2017; Goeden et al., 2018; and MDH, 2019. For PFNA sources, see Supplemental Table 2.
For PFOA: Goeden et al., 2018. For PFOS, PFNA, and PFHxS, values are derived from lactational transfer.
2.2. Model Inputs
In this section, we describe estimates of toxicokinetic parameters and each of the data sources used in the models. Descriptions of body weight and drinking water intake can be found in the supplemental materials.
2.2.1. Toxicokinetic Parameters
This section summarizes each of the toxicokinetic parameters incorporated into the models.
2.2.1.1. Half-life and Volume of Distribution
Extensive calibration and evaluation of the toxicokinetic parameters for volume of distribution and half-life in our models were conducted using Bayesian methods and described elsewhere (Chiu et al., 2022). We used the volume of distribution and half-life posteriors from this Bayesian analysis to inform the distributions incorporated into the model. Chiu et al. (2022) tested the posterior distributions for these parameters for correlation and found no correlation, and therefore we treat them as two independent parameter distributions in our model. These are summarized in Table 1. Briefly, we conducted a literature search and reviewed the literature for half-life and volume of distribution data for PFOA, PFOS, PFNA, and PFHxS to inform our prior distributions. Next, we reviewed the literature for paired data on water and serum PFAS in exposed populations. We prioritized individual-level data when available, in order to best understand the population variability in PFAS serum levels resulting from drinking water exposures. We separated data into training and testing datasets. We fit the training datasets to a one-compartment toxicokinetic model that includes both a background term and continued drinking water exposure based on measured contamination levels.
We used a hierarchical Bayesian statistical approach that accounts for inter-individual variability as well as uncertainty, simultaneously fitting studies with individual-level data and studies with summary-level data. Posterior predictions were compared to testing datasets to evaluate “out of sample” performance of the model. In addition to estimates for the population geometric mean and population geometric standard deviation, a prediction was made for a “random individual,” which combines uncertainty and variability. A lognormal distribution based on the geometric mean and geometric standard deviation for the “random individual” was used to inform the half-life and volume of distribution in the web-based estimator (Table 3). Goeden and colleagues (MDH, 2017; Goeden et al., 2018), in a similar application for PFAS toxicokinetic modeling, proposed a unitless adjustment factor (AF) to the volume of distribution (Vd) for young children. We have incorporated this adjustment by setting in all equations, with AF = 1 for ages 5 and over (Table 4). This adjustment factor accounts for the differences in extracellular water volume in early childhood, based on a study by Friis-Hansen (1961).
Table 3.
Description of variables in models showing distribution type values used for the mean and standard deviation of the distribution for each variable.
| Variable | Distribution | Mean | Standard Deviation |
|---|---|---|---|
| Half-Life (years) | Lognormal | See Table 1 | |
| Volume of Distribution (L/kg) | Lognormal | See Table 1 | |
| Placental Transfer (unitless ratio) | Normal | See Table 2 | 2% of the mean |
| Breast Milk: Maternal Serum Transfer (unitless ratio) | Normal | See Table 2 | 2% of the mean |
| Drinking Water Concentrations () | Lognormal | user-entered value | 15% of the mean |
| Background Serum Level () | Lognormal | See Table 5 | |
| Body Weight (kg) | Normal | user-entered value | 15% of the mean |
| Drinking Water Intake Adjustment Factor a | Normal | 1 | 0.15 |
| Percent Daily Drinking Water Intake from Tap Water | Normal | user-entered value | 2% of the mean |
The unitless adjustment factor is multiplied by the Average Daily Water Intake at each time period.
Table 4.
Age adjustment factor for volume of distribution.
| Age Group | Age Adjustment Factor (unitless)a |
|---|---|
| Birth | 2.4 |
| Birth to < 1 month | 2.1 |
| 1 to < 3 months | 1.7 |
| 3 to < 6 months | 1.6 |
| 6 months to < 1 year | 1.5 |
| 1 – 2 years | 1.4 |
| 2 – 3 years | 1.4 |
| 3 – 5 years | 1.1 |
| 5+ years | 1 |
Age adjustment factors from MDH (2017) and Goeden et al., 2018).
2.2.1.2. Placental Transfer
PFAS exposure from placental and lactational transfer was modeled using the approach described in the publications of the Minnesota Department of Public Health (MDH, 2017, 2019; Goeden et al., 2018). The MDH models use a unitless ratio of cord blood to mother’s blood to estimate placental transfer. We reviewed all studies considered by MDH and conducted supplemental searches to identify data published more recently. For each chemical, we conducted searches in PubMed for (1) “placental transfer” AND “[specific PFAS]”; (2) “maternal” AND “cord” AND “[specific PFAS]”; and (3) “breast milk” and “[specific PFAS]”.
We did not identify any studies that would substantially change MDH’s conclusions for PFOA, PFOS, and PFHxS. Therefore, for these PFAS we use the same ratio as MDH. To estimate infant serum concentration at birth, the model assumes the mother’s PFAS serum concentration is at steady state and applies the PTF. PFAS-specific PTFs are summarized in Table 2. MDH has not derived guidance for PFNA and therefore has not estimated placental transfer for PFNA. For PFNA, we identified 10 studies that reported a ratio of cord blood to maternal blood (see Supplemental Table 4). Following MDH (2017), we averaged these values to obtain placental transfer values (Table 2, Table 3).
2.2.1.3. Lactational Transfer
Lactational transfer of PFAS was modeled using the approach described in the publications of the Minnesota Department of Public Health (MDH 2017, 2018; Goeden et al., 2018). MDH has not derived guidance for PFNA and therefore has not modeled PFNA. A literature search was conducted to identify lactational transfer for PFNA. Two studies (Cariou et al., 2015; Karman et al., 2007) contained information on transfer of PFNA through breast milk (Supplemental Table 2). None of the samples in Cariou et al. (2015) contained detectable levels of PFNA. To estimate the mean, the authors accounted for individual values below the limit of detection or the limit of quantitation. Therefore, we incorporate only the values from Karrman et al. (2007) into our models. All unitless lactational transfer values used in our models are summarized in Table 2.
Like the dose of PFAS to the infant from breast milk, the serum reductions resulting from breastfeeding are based on the reductions observed in literature. At the end of 6 months for PFOA, the mother’s serum levels are assumed to be reduced by 47% (Goeden et al., 2018). This reduction applies to calculations for both maternal serum and breast milk concentration for breastfed infants. The percent reduction for PFOS, PFHxS, and PFNA are scaled by their respective lactational transfer ratios to estimate reductions at the end of the 6-month period based on the observations for PFOA. Percent reductions in breastfeeding mothers after 6 months incorporated into the model can be found in Table 2.
In the web-based estimator, women aged 18 and over are asked how many children they have breastfed in the last 5 years. To reduce the information requested of minors, this question is not asked of females under the age of 18. Women who enter a value other than zero are asked to enter the year(s) in which they breastfed. For each child and year selected, it is assumed that breastfeeding occurred for 6 months starting in January of the selected year. This assumption is based on the recommendation of the American Academy of Pediatrics of exclusive breastfeeding for the first six months (Eidelman et. al, 2012). It is assumed that the total months of breastfeeding (for the mother) does not exceed 6 months per child, but that it may have occurred over multiple years. This simplification reduces the data entry burden on the user and avoids implying excess precision by collecting detailed month-by-month information on breastfeeding habits.
Like the dose of PFAS to the infant from breast milk, the serum reductions in the adult woman resulting from breastfeeding are based on the same reductions observed in literature.
2.2.2. Background PFAS Levels
We accounted for background (non-drinking water) exposure in the models using estimates from NHANES, rather than building multiple exposure pathways (e.g., dust, air) into the models, as it is unlikely users will know these concentrations. The geometric mean and population geometric standard deviation of NHANES serum levels for individuals over 12 years old were calculated for the 2017-2018 cycle (CDC, 2020). Children were not included in this cycle; therefore, the geometric mean and standard deviation of the NHANES background serum values for children 3–11 years old were calculated for the 2013–2014 cycle of data (CDC, 2016). These values were used for all children older than 6 months; in infants younger than 6 months, no additional background exposure was added.
Survey-weighted, gender-specific geometric mean and geometric standard deviation measurements, as well as distributional information for all children aged 3 to 11, were calculated using NHANES 2013–2014 data. For all individuals aged 12 and over, these measurements and distributional information were calculated using NHANES 2017–2018 data. Serum concentrations of linear and branched isomers of PFOS and PFOA were combined in order to create summary statistics for total serum PFOS and PFOA, respectively. All estimates were weighted and adjusted for the NHANES complex survey design using the NHANES suggested survey weight, strata, and primary sampling unit variables specific to the collection of PFAS serum samples (Table 5).
Table 5.
NHANES levels of PFOA, PFOS, PFNA, and PFHxS as geometric mean and geometric standard deviation.
| Age Group | PFAS | Male Serum GM (GSD) | Female Serum GM (GSD) |
|---|---|---|---|
| Children aged 3 – 11 years old (NHANES 2013-2014) | PFOA | 1.9 (1.7) | 1.9 (1.7) |
| PFOS | 4.1 (1.9) | 3.7 (1.6) | |
| PFNA | 0.8 (2.1) | 0.8 (1.8) | |
| PFHxS | 0.9 (2.2) | 0.8 (1.9) | |
| Individuals 12 years old and older (NHANES 2017-2018) | PFOA | 1.6 (1.7) | 1.3 (1.9) |
| PFOS | 5.4 (1.6) | 3.4 (1.7) | |
| PFNA | 0.4 (1.6) | 0.4 (1.9) | |
| PFHxS | 1.5 (1.6) | 0.8 (1.8) |
GM = geometric mean; GSD = geometric standard deviation.
These values were then multiplied by 0.8 to incorporate the assumption of 20% relative source contribution from drinking water in background exposures to inform our This assumption is consistent with the assumptions used in Chiu et al. (2022). A default of 20% of exposure to a contaminant from drinking water in the absence of chemical-specific data is also consistent with U.S. EPA drinking water guidance (2018).
Because it is likely that individuals are continuously exposed to PFAS from multiple sources, we added “background exposure” in each timestep to ensure the contribution to serum level from background is always constant after elimination. Therefore, we used the following equation to calculate the amount of PFAS to add back in daily ( in order for background to remain constant over time. This is the amount of eliminated serum concentration () estimated to be from background exposure.
| [11] |
lost during elimination in previous timestep
Individuals ages 6 and over were modeled starting on the first day of their birth month. The initial serum level was set equal to background, as estimated by the NHANES data for the individuals’ age group. For all other modeled individuals, background was added in starting at 6 months of age. In the models it is assumed that prior to this age there is minimal contribution exposure to PFAS from sources other than formula or breast milk, and no background was added to the estimation.
2.2.3. Water Concentrations
The models require PFAS drinking water concentrations to predict serum concentrations. The web estimator’s interface allows the user to conduct a zip-code search of the PFAS water data in EPA’s database of water concentrations from testing performed under the third Unregulated Contaminant Monitoring Rule (UCMR3). In the web estimator’s search function, concentrations are provided as geometric means of measured concentrations (Xue et al., 2010; Supplemental Information: Zip Code Look Up). If water from a system in the user’s zip code was not tested for PFAS as part of the UCMR3 effort, no data are provided, but users may enter measured concentrations from their water. For purposes of estimating adult serum levels, we make the simplifying assumption that individuals’ exposure to PFAS in drinking water began in 1960, or in their birth year for those born after 1960.
2.2.3.1. User-Entered Concentrations
The web-based estimator currently allows users to enter up to two water concentrations for PFOA, PFOS, PFNA, and PFHxS. For the purposes of simplification and to reduce the data entry burden on the user, it is assumed the person has lived in the same community throughout their life. If the user inputs only one concentration, it is assumed that this is the level they were exposed to over their lifetime. The user may also indicate that an intervention took place, implemented either by the user’s public water system (PWS), or through a home-based treatment system. If so, it is assumed that the user drank water at the first concentration from their month of birth, or 1960 if they were born prior to 1960, until the intervention and then consumed water at the second concentration from the date of the intervention until the present time. The user may enter a post-intervention water concentration if available. If the post-intervention field is left blank, a level of half the EPA Minimum Reporting Level under the fifth Unregulated Contaminant Monitoring Rule (UCMR5) for the specific PFAS is assumed (U.S. EPA, 2021). This is 0.002 for PFOA, PFNA, and PFOS, and 0.0015 for PFHxS. Serum levels are calculated for all PFAS which have drinking water information entered. If no water information is entered by the user, no results will be displayed for that PFAS.
When estimating serum PFAS concentrations for individuals older than age 1, users are also asked about the percentage of bottled water vs. tap water they consume. Individuals age 6 and older are also asked if their consumption habits for bottled water have changed and are allowed to enter the date for one change in consumption patterns. The concentration of PFAS in bottled water is assumed to be zero. Drinking water ingestion amounts of tap water are decreased by the percentage of bottled water consumed because of the assumption of zero concentration. For infants fed store-bought, ready-made formula or formula prepared with bottled water, the PFAS concentration is also assumed to be zero.
2.3. Model Implementation
This suite of models is provided in two implementations. For research use, the model suite is implemented in R code. For use by the general public, the PFAS Blood Level Estimator runs as a JavaScript application that can be deployed on a web server without licensing requirements and run in the user’s browser without transmission of data to a server. See the Supplemental Information for additional detail regarding specific implementation.
Both implementations of the model suite run a Monte Carlo simulation using 1,000 iterations. For each iteration, the models allow for variation in parameters described above. The distribution assumptions can be found in Table 3.
At the outset of an iteration, model inputs are selected from a distribution (defined in Table 3). For the first timestep within an iteration, a single value is pulled from the distribution for each model input. Most parameters remain constant over all timesteps within an iteration. . PFAS drinking water concentrations may be based on a single value, or on samples taken at different times. As described in the Supplemental Information, body weight changes over time, but the percentile selected from the distribution at the beginning of an iteration is held constant over all timesteps. Last, drinking water intake is varied using an adjustment factor pulled from a normal distribution with a mean of 1 and standard deviation of 0.15. This is then multiplied by the mean drinking water intake at each timestep. This allows variation from the mean over time and accounts for changes in drinking water intake with age.
2.4. Model Evaluation
Anonymized PFAS serum data and answers to a questionnaire regarding potential PFAS exposure routes were obtained from ATSDR PFAS investigations in various U.S. communities (ATSDR, 2020b; ATSDR, 2021; ATSDR, 2021b; ATSDR, 2022a; ATSDR, 2022b; see Table 6). These data were collected in compliance with all regulatory requirements under an ATSDR exposure assessment protocol (ATSDR, 2020b) and used with permission from ATSDR. We ran evaluation models separately for each PFAS. For each PFAS, we excluded study participants from the evaluation dataset for that PFAS if there was no reported exposure; i.e., they reported drinking mostly bottled or filtered water, or if their drinking water concentration for the PFAS was below the reporting limit.
Table 6.
Summary statistics for individuals at each site included in model evaluation. Where very few individuals are included, values are suppressed or shown as ranges.
| Site | Adult | Sex | PFAS | n | Mean Years of Age (SD) | Mean Weight lbs. (SD) |
|---|---|---|---|---|---|---|
| Site A (Hampden County, MA) | Adult | Female | PFHxS, PFOA, PFOS | 10 | 40.74 (16.45) | 167.1 (60.98) |
| Male | PFHxS, PFOA, PFOS | 44 | 60.73 (14.10) | 203.75 (41.70) | ||
| Child | Female | PFHxS, PFOA, PFOS | 18 | 11.91 (3.55) | 93.06 (37.17) | |
| Male | PFHxS, PFOA, PFOS | 15 | 11.81 (4.60) | 107.73 (53.39) | ||
| Site B (Berkeley County, WV) | Adult | Female | PFHxS, PFOS | <10 | 25-35 | 160-190 |
| Child | Female | PFHxS, PFOS | <10 | 9-12 | 140-170 | |
| Male | PFHxS, PFOS | <10 | 9-12 | 140-170 | ||
| Site C (New Castle County, DE) | Adult | Female | PFHxS | <10 | 52.39 (14.18) | 168 (20.22) |
| Female | PFOA, PFOS | 16 | 62.07 (12.76) | 153.88 (27.64) | ||
| Male | PFHxS | <10 | 64.02 (11.78) | 210.75 (38.75) | ||
| Male | PFOA, PFOS | 22 | 66.38 (12.93) | 193.41 (31.7) | ||
| Child | Female | PFHxS | <10 | NA | NA | |
| Female | PFOA, PFOS | <10 | 15.27 (3.59) | 97.5 (3.53) | ||
| Male | PFHxS | <10 | NA | NA | ||
| Male | PFOA, PFOS | <10 | 11.36 (3.72) | 119.5 (82.48) | ||
| Site D (Spokane County, WA) | Adult | Female | PFOA, PFOS | 13 | 39.12 (12.89) | 226.08 (77.56) |
| Male | PFOA, PFOS | 40 | 52.31 (14.67) | 205.93 (47.04) | ||
| Child | Female | PFOA, PFOS | 13 | 10.09 (3.86) | 106.38 (60.31) | |
| Male | PFOA, PFOS | 27 | 10.73 (4.12) | 93.26 (51.78) |
Sources: ERG, 2018a, 2018b, 2018c, 2018d.
The percentage of tap water intake at home rather than other sources was estimated from survey answers. The associated water exposure reports contained high-level data regarding water exposures but did not contain detailed exposure information with dates for use in the model estimation process. Therefore, we extracted water concentration data for 2013 to 2015 from the UCMR3 database (U.S. EPA, 2016), and supplemented with available information from the water systems where available. As these data were often collected at the entry points to the distribution system (wells and pumping stations), we used a mean of samples. Where no post-intervention concentrations above the UCRM3 Minimum Reporting Level were available in this data source, for evaluation, we assumed that post-intervention concentrations were half the UCMR5 Minimum Reporting Level because the Minimum Reporting Level in UCMR3 was judged too high to represent post-intervention concentrations.
The database was accessed using Microsoft Access and filtered to entries with any PFAS as the contaminant. The data were then queried to pull data where the public water system (PWS) name (variable “PWSName”) loosely matched the name of PWSs reported in the questionnaire for each site. Data were only kept if they matched the state of a given site, and data were manually reviewed to ensure PWSs were similar to what was reported in the questionnaire. For a given public water supply, PFAS data were only included if some samples showed concentrations above the reporting limit. If there was at least one detected sample of a PFAS among a water supply, the relevant data variables were included. Additionally, for all PWSs within each site, water quality reports were reviewed to check if the concentration of any PFAS were reported. For two water systems (New Castle Municipal Services Commission [MSC] 2010, 2011, 2015, 2016, 2017, 2019; Westfield Department of Public Works [DPW] 2015, 2017, 2018, 2019), the reports contained data for several years, which were added to the water concentration dataset. No water concentration measurements were available for PFNA, and not all water systems measured all PFAS. See the Supplemental Information for summary values (Supplemental Table 3).
We tested the typescript.js and R code to ensure that they produced convergent results. Because both use a random distribution for simulations, it was not feasible to produce identical results. The model results from both the typescript.js and R code implementations converged, and we used the R implementation for batch processing and model evaluation of historical site exposure and serum data. Although the web-based estimator only allows water concentrations at two timepoints to be added, UCMR3 data were more comprehensive, with samples available over a range of dates. For evaluation with the R code, we used all available water concentrations above the reporting limit.
We performed sensitivity testing to determine the sensitivity of model outputs to the variation in parameters. We did this first by fixing all but one parameter at a time at their central values (see Tables 1, 2, 3, 4 & 5) using a pre-intervention water concentration of 0.1 ug/l for all PFAS, and allowed post-intervention drinking water concentration to vary over a range based on UCMR reporting limits. The parameter which was not fixed in each sensitivity run was allowed to vary over a range of values. For half-life and Vd, this range was based on priors from Chiu et al. 2022 unless the posterior 95% CI of the parameter estimate produced a wider range. For post-intervention drinking water concentrations, we examined the effect of reducing reporting limits from those found in UCMR3 (0.01 ) to half the average reporting limit in UCMR5 (0.002 ), using 0.005 as a central estimate. For breastfeeding duration, we tested a range of 1 to 12 months of breastfeeding, with 6 months as the central estimate. For most other parameters, we set the central values to those reported in this paper (see Tables 1,2,3,4 & 5), and used the 5th and 95th percentile of the range of simulated data produced for the Monte Carlo analysis.
Finally, we performed a more specific sensitivity analysis to determine whether using a lower background concentration to account for historical decline in children’s serum concentrations since 2014 could improve the fit of predictions to measured serum. For this sensitivity analysis, we projected 2018 children’s serum concentrations using a PFAS-specific decline in NHANES-reported concentrations of ages 12-80 between 2013-2014 and 2017-2018.
2.5. Model Output in the Web Estimator
The models provide estimates of the individual’s serum concentrations for each PFAS for which data are entered. In the web-based estimator, graphics convey the uncertainty around these estimates; 95th percentile bounds are also shown. To contextualize the model output, the web estimator compares the individual’s estimated serum levels to the most current NHANES data. NHANES data are prepared, and percentiles (e.g., 5th, 25th, 50th, 75th, 95th and 99th) are calculated for the four PFAS as described in Section 2.2.2. Infants and children under the age of 3 are compared to the 2013-2014 NHANES data for 3- to 11-year-olds because this is the only nationally representative dataset available for this age group. Links to additional information and resources are provided after the summary of results, including information about PFAS, their health effects, and steps individuals can take to reduce the PFAS levels in their water.
3. Results
3.1. Model Evaluation
Overall, the models performed well. For the most part, estimates were close to measured values (Figures 2 and 3, Tables 7 and 8), with only a few predictions further than an order of magnitude from measured values (Tables 7 and 8). However, we found that the models predicted serum concentrations more accurately for some compounds, and in some locations, than in others (Figures 2 and 3; Tables 7 and 8). In general, the estimates for adults are within ½ order of magnitude with the exception of Site B (10 individuals), and the estimates for children (aged 4-18) tend to be slightly higher than measured serum concentrations (Figures 2 and 3; Tables 7 and 8). This remained true even after we adjusted the input background levels proportionately to declines in adult serum concentrations over the same time period as part of a sensitivity analysis (2013-2018). Sample sizes were much smaller for children than for adults (Tables 7 and 8), which may have contributed to the difference.
Figure 2.
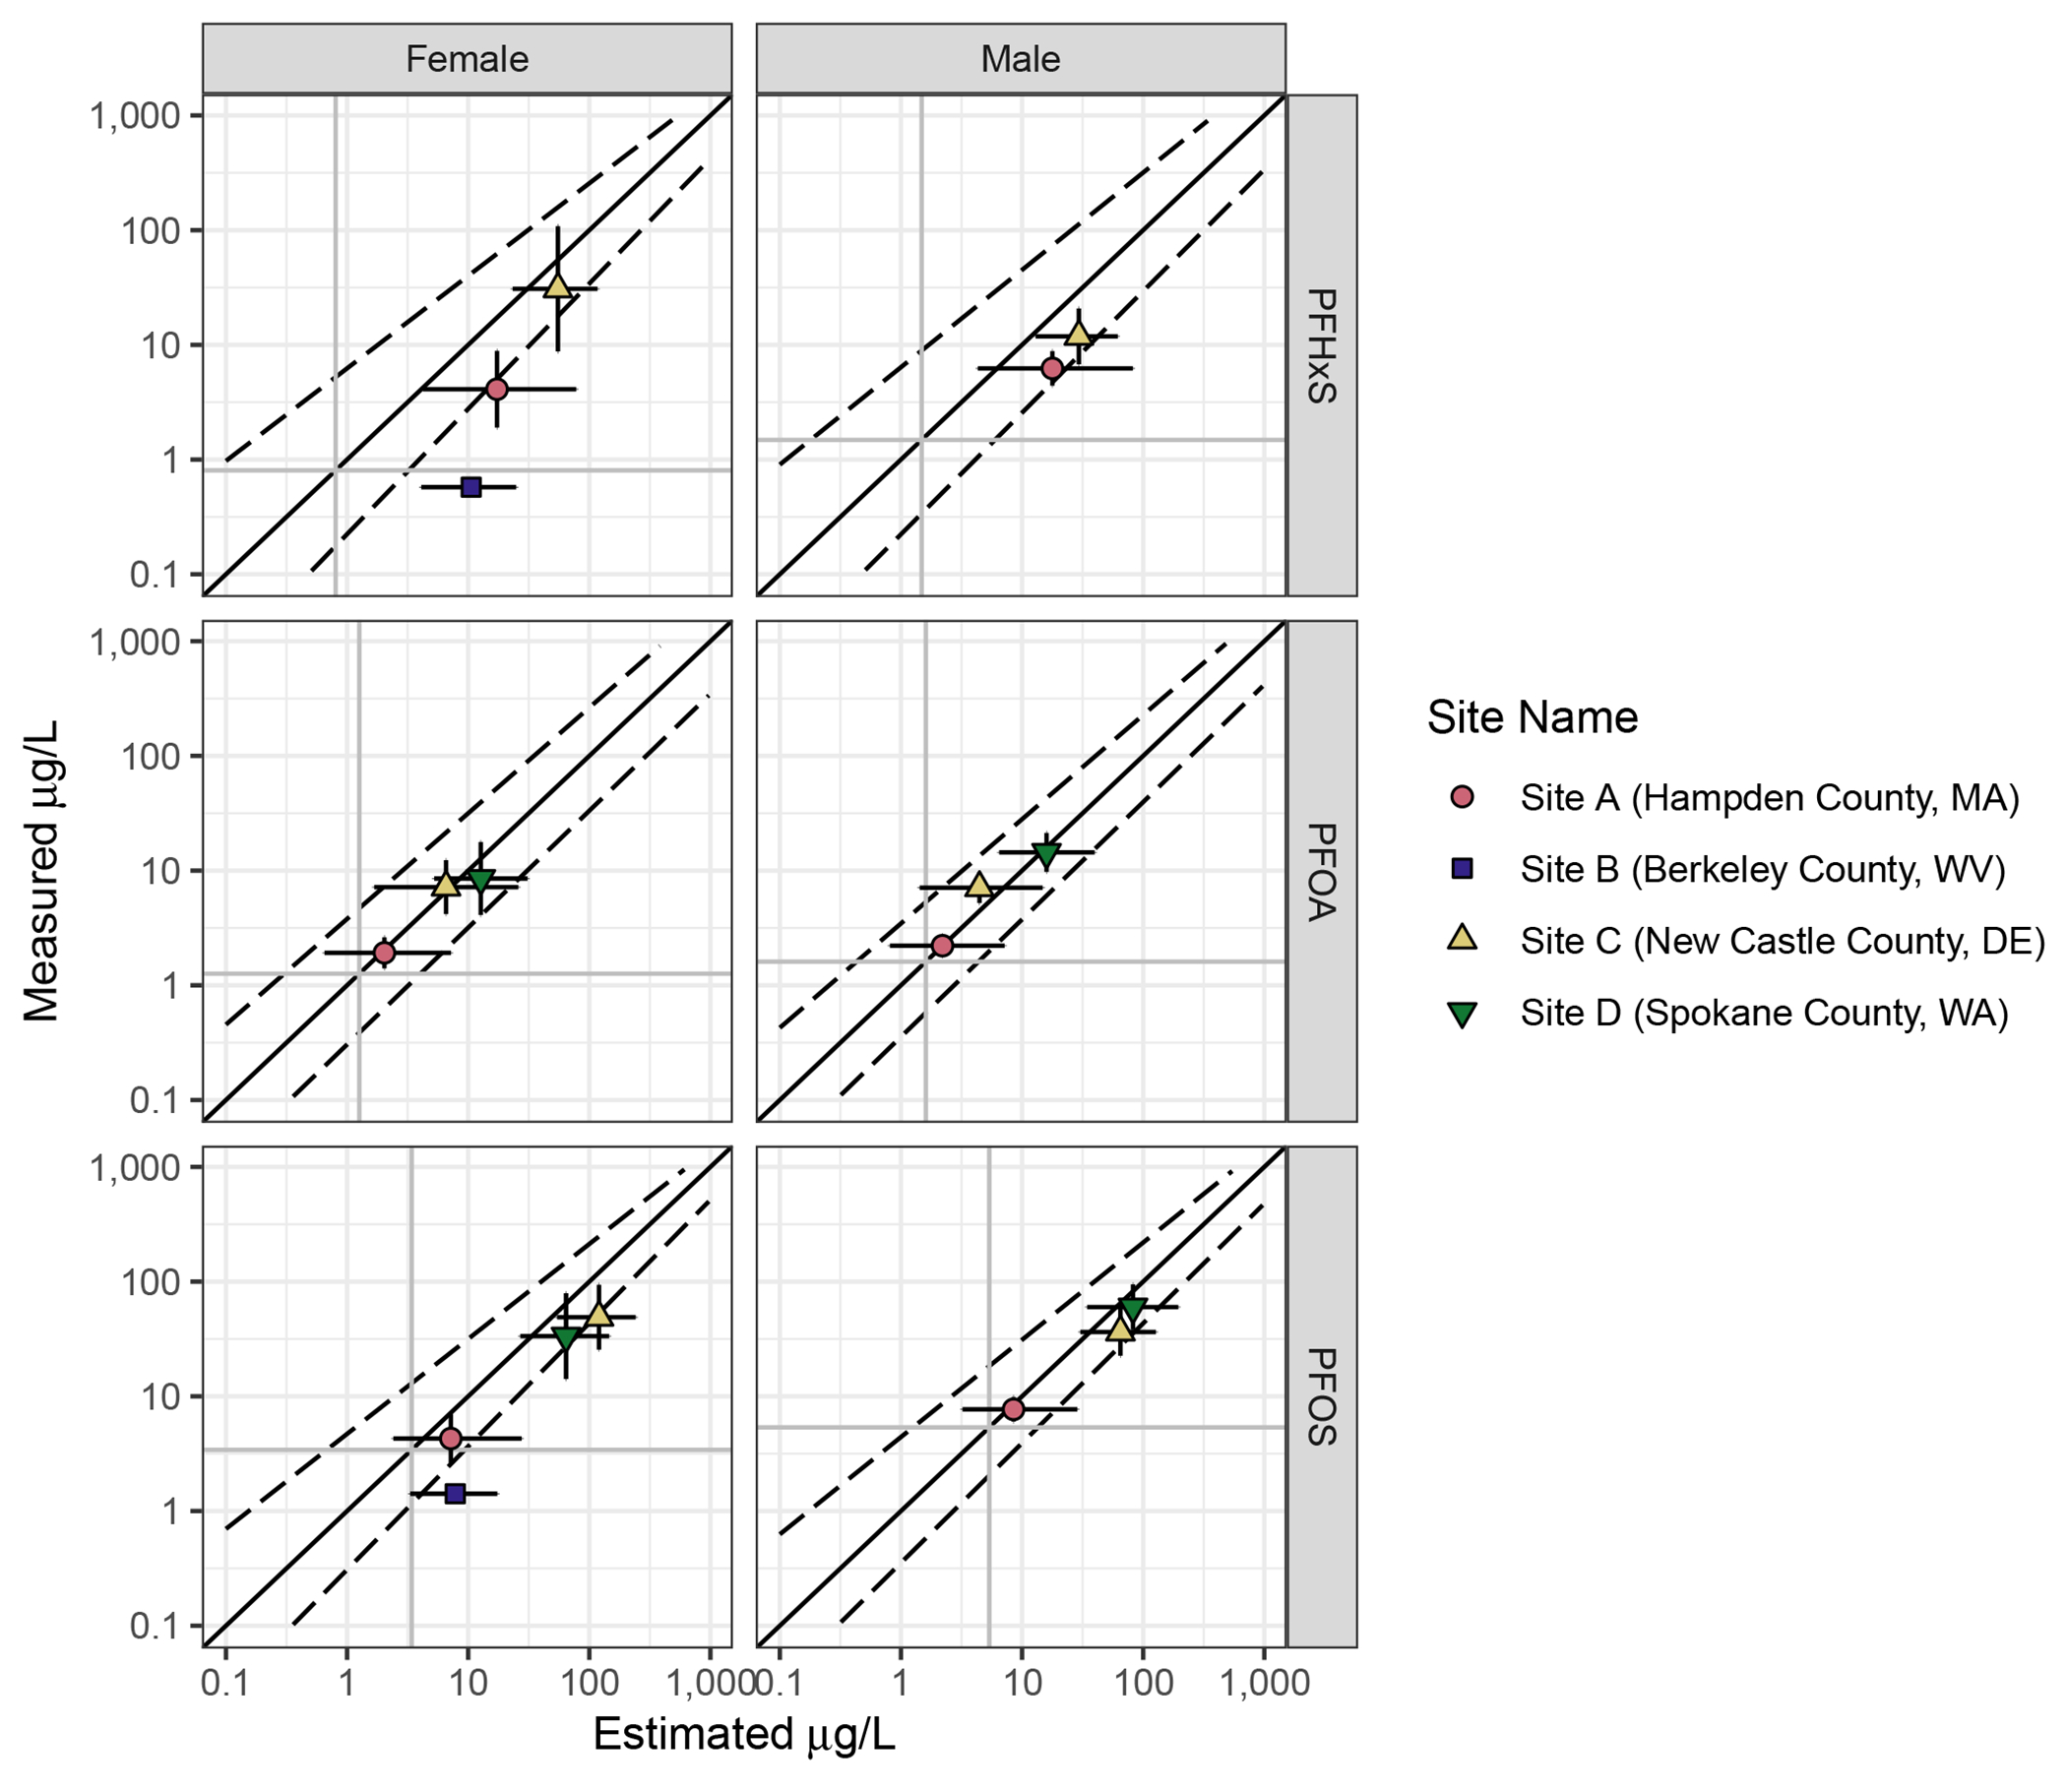
Goodness of fit plots showing overall reliability of model prediction for adults by PFAS. Darker grey vertical and horizontal lines show background serum concentration for 12-80 year-olds. The dotted lines give a smoothed average of the 95% CI around the simulated serum concentrations for individuals; they differ in slope and width because simulated values for individuals are not evenly distributed across the range of the variable. The vertical error bars give the 95% CI of the measured population means. The horizontal error bars show the average 95% CI around the estimated serum concentration. Points above the diagonal show populations where measured serum concentrations were higher than estimated. Points below are populations where measured serum concentrations were lower than estimated.
Figure 3.
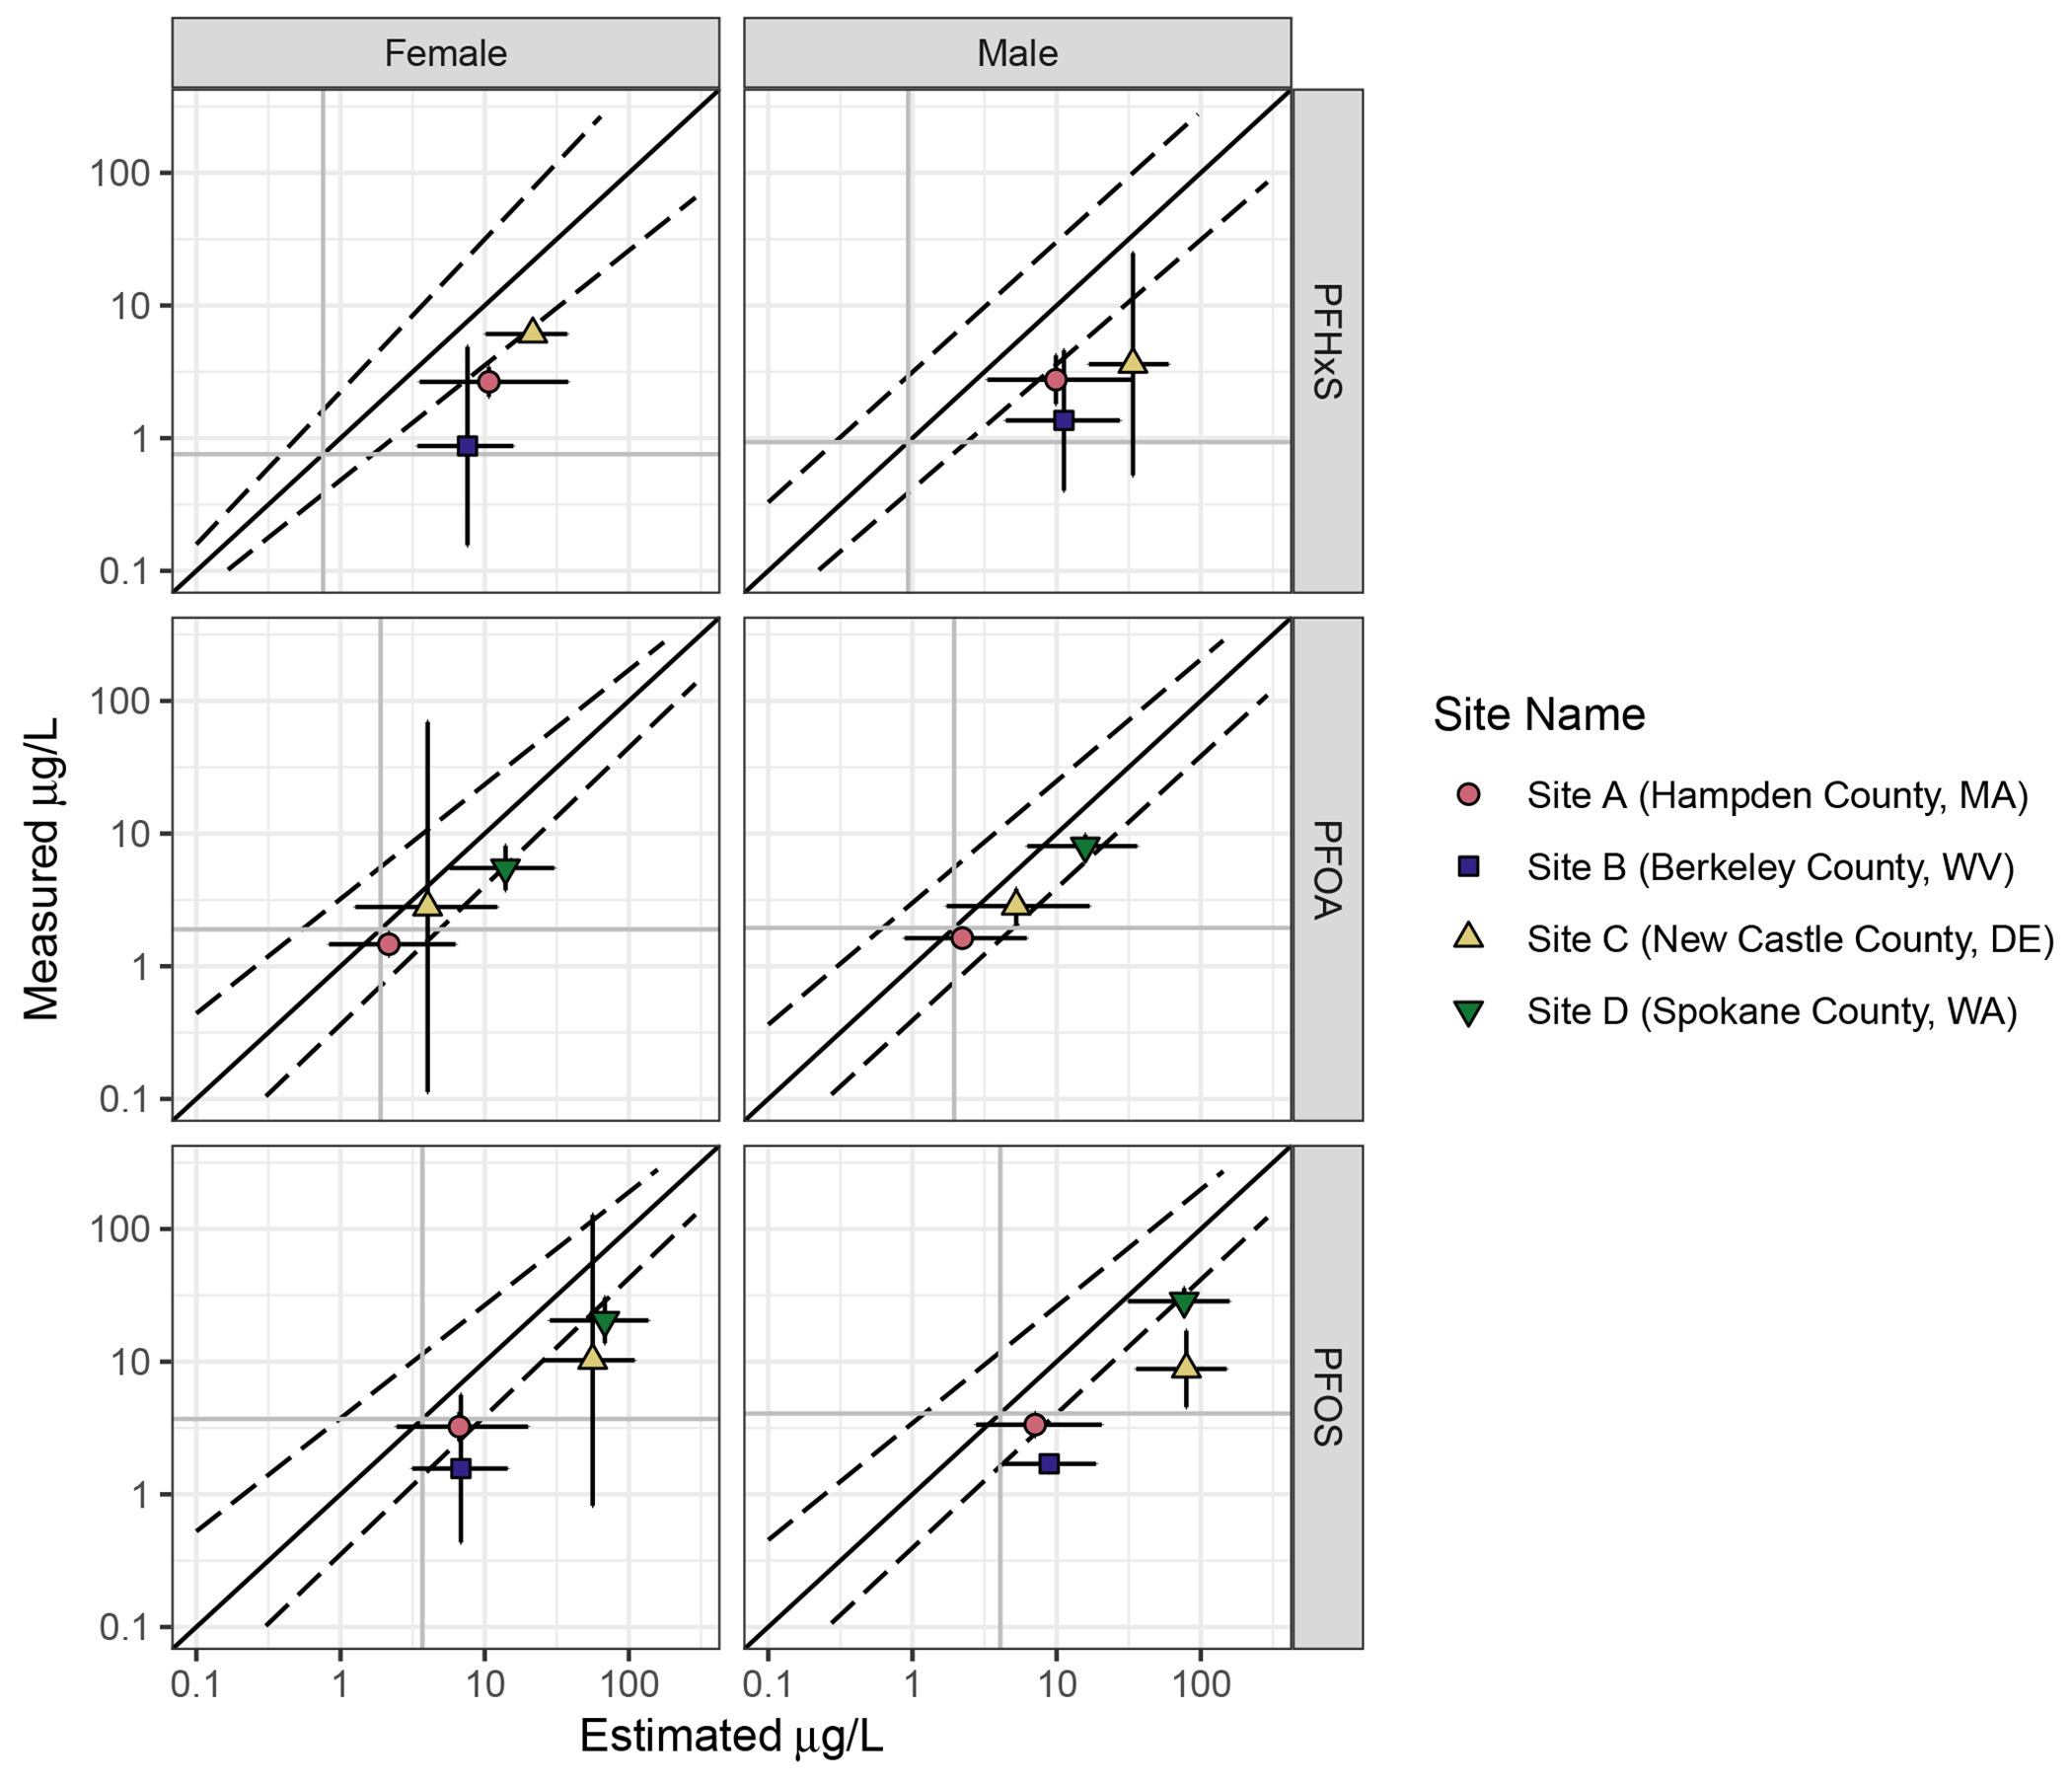
Goodness of fit plots showing overall reliability of model prediction for children under 18 years of age. Darker grey vertical and horizontal lines show background serum concentration for 3-11 year-olds. The dotted lines give a smoothed average of the 95% CI around the simulated serum concentrations for individuals. The vertical error bars give the 95% CI of the measured population means. The horizontal error bars show the average 95% CI around the estimated serum concentration. Points above the diagonal show populations where measured serum concentrations were higher than estimated. Points below are populations where measured serum concentrations were lower than estimated.
Table 7.
Mean change (Δ; log10 of predicted/observed serum concentration in ) for adults. A Δ of 1 represents an order of magnitude difference between the measured serum concentration and the median estimate. Positive Δs represent overprediction, and negative Δs represent underprediction.
| Site | PFAS | Δ | Individuals with Δ >1 or Δ<-1 | Number of individuals |
|---|---|---|---|---|
| Site A (Hampden County, MA) | PFHxS | 0.49 | 5 | 53 |
| PFOA | 0.00 | 1 | 53 | |
| PFOS | 0.08 | 2 | 53 | |
| Site B (Berkeley County, WV) | PFHxS | 1.14 | 1 | <10 |
| PFOS | 0.61 | 0 | <10 | |
| Site C (New Castle County, DE) | PFHxS | 0.07 | 0 | 12 |
| PFOA | −0.13 | 1 | 38 | |
| PFOS | −0.15 | 1 | 38 | |
| Site D (Airway Heights, Spokane County, WA) | PFOA | −0.16 | 2 | 47 |
| PFOS | −0.07 | 4 | 47 |
Δ = delta
Table 8.
Mean Δ (log10 of predicted/observed serum concentration in ) for children under 18. A Δ of 1 represents an order of magnitude difference between the measured serum concentration and the median estimate. Positive Δs represent overprediction, and negative Δs represent underprediction.
| Site | PFAS | Δ | Individuals with Δ >1 | Number of individuals |
|---|---|---|---|---|
| Site A (Hampden County, MA) | PFHxS | 0.58 | 2 | 32 |
| PFOA | 0.15 | 0 | 32 | |
| PFOS | 0.32 | 0 | 32 | |
| Site B (Berkeley County, WV) | PFHxS | 0.83 | 2 | <10 |
| PFOS | 0.58 | 0 | <10 | |
| Site C (New Castle County, DE) | PFHxS | 0.54 | 0 | <10 |
| PFOA | 0.23 | 0 | <10 | |
| PFOS | 0.44 | 0 | <10 | |
| Site D (Airway Heights, Spokane County, WA) | PFOA | 0.12 | 0 | 38 |
| PFOS | 0.23 | 0 | 38 |
Δ = delta
Estimated PFAS concentrations in Site A were generally accurate, though the models tended to overpredict PFHxS concentrations, and two individuals had PFOS or PFOA serum concentrations much lower than estimated (Figure 2, Supplemental Figure 1, Supplemental Figure 2, and Table 7). No specific factors were found to explain the difference between estimated and modeled values for these individuals. Children’s serum values were generally overpredicted at Site A (Figure 3, Supplemental Figure 3, Supplemental Figure 4, and Table 8), though overprediction was relatively small for PFOA and PFOS (Table 8).
Only two adult females have sufficient information to be included in this evaluation analysis from Site B (Supplemental Figure 5). The models overpredicted serum values for both (Table 7). At Site B, the models also overpredicted the serum concentrations of all children (Supplemental Figure 6), and no obvious pattern was related to any responses in the survey questionnaire.
At Site C, the models were generally accurate in predicting adult serum concentrations of all PFAS (Supplemental Figure 7 and Table 7). No obvious factors explained the cases where the models over- or underpredicted for individuals. For the 11 children at Site C, the models somewhat overpredicted PFHxS and PFOS, and were more accurate for PFOA (Supplemental Figure 8 and Table 8). These differences were well within an order of magnitude in all cases.
At Site D, where measured drinking water concentrations for PFOA and PFOS were elevated as recently as 2017, the models tended to predict concentrations well for adults (Figure 3, Supplemental Figure 9, and Table 7). Individuals for whom the models significantly overpredicted PFOS or PFOA serum concentrations reported living at their current addresses for shorter periods of time (Supplemental Figure 9). Although children at Site D had serum concentrations elevated over baseline, the concentrations were somewhat lower than predicted by the models for both PFOA and PFOS (Figure 3, Supplemental Figure 10, and Table 8).
Serum estimates are sensitive to water concentrations and duration of exposure. Of toxicokinetic parameters, half-life had the largest effect on serum outputs when tested over the possible ranges identified in the literature (the priors for Chiu et al., 2022) and using the distribution of values from the Monte Carlo analyses (Figure 4); patterns were similar across all analytes (Figure 4 and Supplemental Figures 11-13). The impact of the background serum was small.
Figure 4.
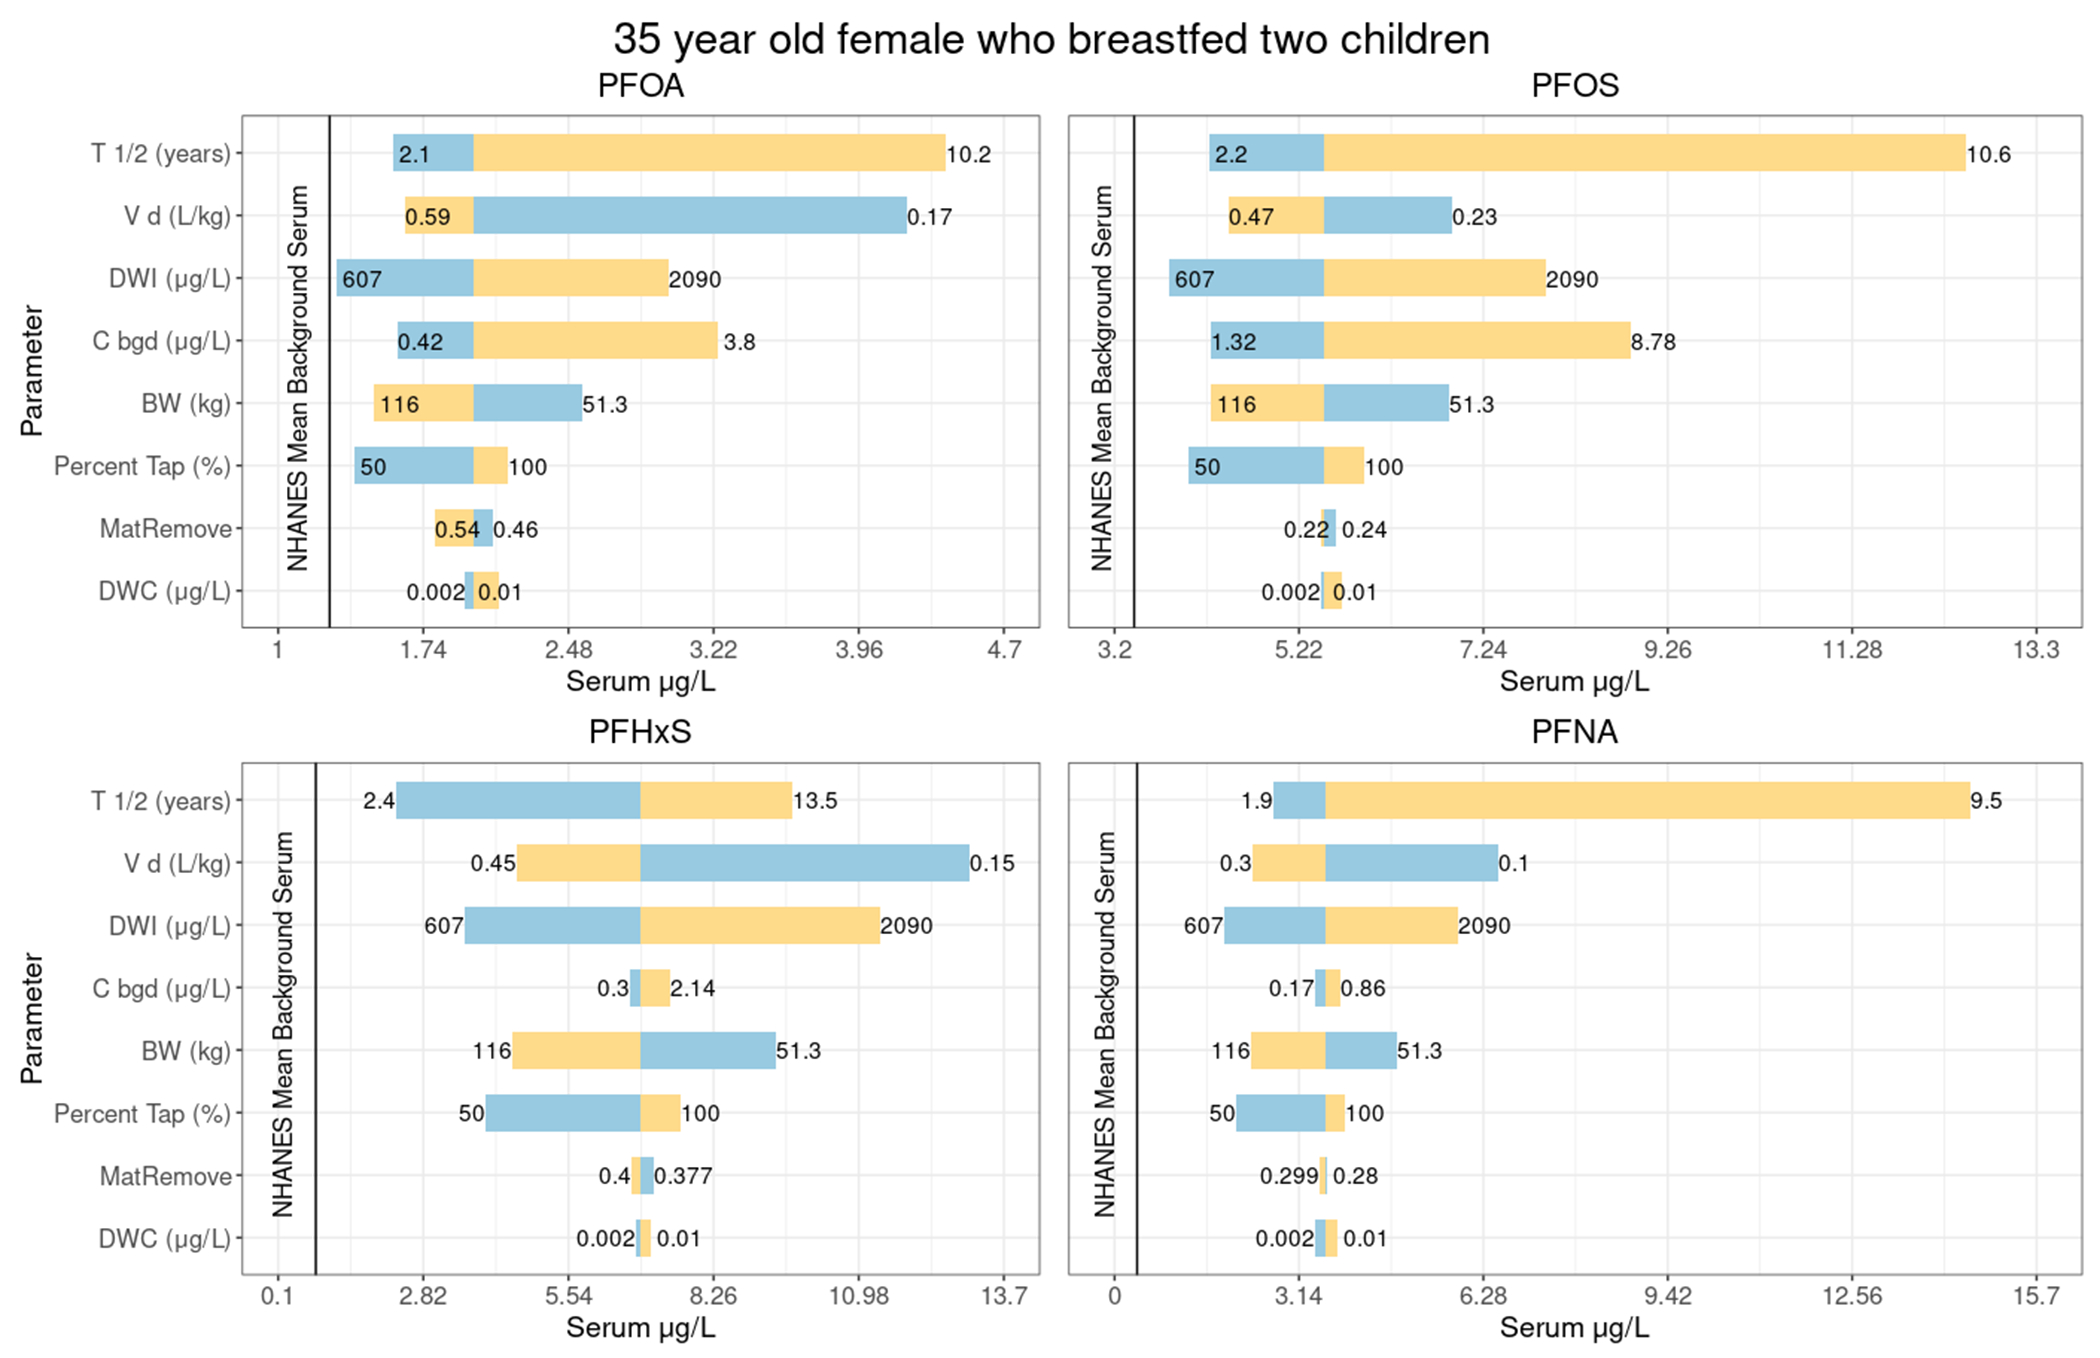
Sensitivity plot showing predicted serum levels related to variation in each of the primary parameters when others are set to the values from Tables 1–5. The figure displays results for a 35-year-old female who breastfed two children, assuming intervention 2 years prior, and using 0.005 for the central estimate of post-intervention water concentrations. Yellow indicates the upper end of the parameter value range, and blue indicates the lower end of the parameter value range. The values at either ends of the lines indicate the minimum and maximum values of the parameters range tested in the sensitivity, the point at which the line changes color is the central estimate (from Tables 1–5) used in the model.
3.2. Example Outputs from the Web Estimator
To illustrate the results generated by the web-based estimator, and the context provided to users for the estimated serum levels, we provide a detailed description of outputs along with sample outputs in the Supplemental Information. The web estimator’s outputs include point estimates of serum concentrations with confidence intervals showing the range of serum concentrations predicted by the models in comparison to the general population.
4. Discussion
The goal of this work was to develop a suite of models capable of simulating PFAS serum concentrations for individuals exposed to contaminated drinking water for four PFAS: PFOA, PFOS, PFHxS, and PFNA. Exposure to PFAS occurs through multiple pathways (e.g., Boronow et al., 2019); however, PFAS contamination in water is widespread and contributes significantly to elevated serum concentrations where present (Cordner et al., 2019; EWG 2020; Hu et al., 2016; Hurley et al., 2016). Therefore, accounting for exposure through water has significance for public health. Unlike other models, the model suite presented here was specifically developed to estimate serum concentrations in absence of biomonitoring data. Accurate models of serum concentrations based on measured water concentrations would aid in providing estimates of serum concentration where biomonitoring is not in place. In areas where serum levels are measured, if our model suite underpredicts the level by primarily considering water exposures, this will help identify areas and populations where PFAS exposure occurs through additional pathways.
We built a suite of one-compartment toxicokinetic models (Figure 1) using published and publicly available datasets. We then evaluated the models using survey data and measured serum data for four communities with known histories of elevated exposure to these PFAS. The available evaluation data did not include areas with historical water measurements of PFNA, so we were unable to evaluate the models for PFNA.
Overall, we found that the models perform well in predicting differences in adult serum concentration differences among sites with elevated drinking water concentrations, as well as sites where serum concentrations may exceed background (Figure 2 and Figure 3). Although we did not incorporate additional parameters to account for menstruation, prediction accuracy was similar for males and females (Figure 2 and Figure 3). We found that the models often estimated higher serum concentrations than were measured in children under 18 years of age (Figure 3). This trend was relatively constant even after age 12, where the calculations for children become identical to those for adults (Supplemental Figures 3, 4, 6, and 8). We also found that predictions were very similar among individuals at the same site (see Supplemental Information).
Overall, on a population level, all estimates were within an order of magnitude of the measured level, with the exception of adults at Site B for PFHxS, where the sample size was quite small (Table 7). The data used for evaluation did not include some of the detail that the web estimator can collect for specific individual differences in tap water intake over time. These data limitations may reduce the specificity of the results to individuals within sites, and user-entered values in the web estimator may result in more customized and accurate results.
For instance, in Site A, serum values for most individuals were within the bounds of model predictions, and typical estimated values for most individuals and PFAS were near background. In other populations and areas, the models also predicted differences among sites well, but provided little specificity to individuals within sites. The following sections discuss some potential explanations for differences between predicted and actual serum concentrations and describe the web estimator’s interface for delivering the models to potential users.
At Site C, the models predicted PFOA in adults well. For children at Site C, the models generally overpredicted PFHxS and PFOS, and were generally accurate for PFOA. No obvious factors relate over- or underprediction of the models to individuals.
The overprediction in children may be a result of several factors. First, there were very few children in the dataset. Additionally, NHANES PFAS data for children are released less frequently than for adults, and the most recent background values are from 2013-2014. Blood levels of PFAS in children are declining, and these values may be less relevant to children measured for PFAS in 2019. However, a sensitivity analysis showed that updating the background values based on anticipated decreases only slightly improved model fit (Supplemental Figure 4). Additionally, the toxicokinetic parameters for half-life and clearance were estimated using data from adult populations. These parameters may be different for children, and the adjustment factor for volume of distribution may not fully account for differences. Additional data with repeated serum measurements may aid in the estimation of half-life and volume of distribution that are more specific to age and sex.
This model suite represents a reasonable estimate based on well-defined parameters. By design, it is also simple to update this model suite and the associated web-based estimator with additional information, for instance, with new background values and updated model parameters. For use in communities with known water contamination, we provide a user interface that allows the general public to easily access the models and estimate their own PFAS serum concentrations. We collaborated with risk communication specialists to ensure the language used in the interface was both understandable to the public and scientifically accurate. This resulted in simplifications to the final models in the web-based estimator. Simplifications struck a balance of reducing the data collection burden on the user, while still producing a reasonable serum estimate and representation of uncertainty. The model suite is robust, with the key toxicokinetic parameters (half-life and volume of distribution) having undergone extensive calibration and evaluation. The “random individual” distributions incorporated into the estimator are relevant to the general public because from an individual’s point of view, there are two sources of uncertainty: the uncertainty in the population distribution (geometric mean and standard deviation) and uncertainty in where one is located on the population variability distribution (e.g., does one have a “higher” or “lower” than typical half-life?).
The use of a suite of one-compartment models based on half-life and volume of distribution is appropriate in the context of the observed serum levels in communities exposed to PFAS contaminated water. These levels are below the serum levels where kidney transporters would be expected to become saturated. For example, the Michaelis constant (Km) for PFOA kidney transporters ranges from 20 to 78 mg/L; Worley et al., 2017; Nakagawa et al., 2008.
Some simplifying assumptions were made on the breastfeeding pathway. While guidelines suggest exclusively breastfeeding infants for at least 6 months, and then continuing beyond that age while introducing foods, we recognize that there is great variation in the length of time infants are breastfed, and many are fed a mix of breast milk and formula, or only formula. Therefore, after review, it was decided to simplify this pathway in the web estimator. To reduce data entry burden on users, particularly those with more than one child, we assumed that all infants, if fed breast milk, are fed breast milk for 6 months. For those children breastfed for less than 6 months or not exclusively breastfed, this may result in an overestimation of serum levels. Although some models suggest that contributions to children’s blood PFAS levels from breast milk during infancy can persist for several years (Goeden et al., 2018), in order to reduce the data burden for the estimator we included the breast milk exposure pathway for children under 6 only. This may result in an underestimation of serum levels, as there is some evidence for PFOA, PFOS, and PFNA that increases in serum levels due to breastfeeding may still persist, though at a lesser extent than younger ages, at age 8 (Kingsley et al., 2018). For evaluation using the R models with previously collected survey data, we used the number of months children were breastfed as recorded on surveys. We did not have serum data for children under 4, and this is a limitation of the analysis.
The survey questions that accompanied the serum levels used for evaluation only asked about duration of current residence and did not account for multiple residences within the water system over time. As a result, it is difficult to use duration of current residence to explain instances of overprediction.
Our models accommodate a change in PFAS water concentration due to interventions such as installation of filtration. They can also accommodate a change to bottled water consumption. This level of detail was not available in the dataset used for evaluation. The questions in the web estimator that gather information on drinking water concentrations are framed as pre- and post-treatment, which usually occurs after contamination has been discovered. Also, the models do allow for adjustments to the dose of PFAS from drinking water based on partial or full consumption of bottled water; however, they do not allow for users to provide detail about concentrations in water at work or in a previous location where they lived. This limits functionality for individuals who have changed locations during their lifetime to areas with differing levels of PFAS. It is possible that users who have changed locations could enter concentrations for two different locations where they lived at different points in time in the window intended for pre- and post- treatment concentrations. However, the questions are not framed in this manner. The underlying models can accommodate more changes in water concentrations over time, but for the web estimator, we made the decision to trade off this functionality in order to reduce the data entry burden of the user.
We also assume that bottled water and ready-to-drink formula contain no PFAS. It is possible that this is not the case (Felton, 2020), and therefore would lead to an underestimation of serum levels. Also, rather than assuming zero if the user does not enter a post-treatment PFAS concentration, we assume a value of half of EPA’s Minimum Reporting Level for that PFAS. In cases where treatment is more effective, this may lead to an overestimation of serum levels. We require users of the web estimator to have a pre-treatment PFAS level, and no assumptions are made in the absence of this information. However, we do assume that the level of PFAS over time remains relatively constant with a small degree of uncertainty, and exposure starts in 1960 or at the year of birth for those born after 1960. Depending on true contamination levels over time, this may lead to either an over- or underestimation of PFAS serum levels.
The UCMR3 zip code search provides data from an accurate EPA source for available zip codes. We incorporated pre-processed data, and a geometric mean for the zip code is provided via the search. The user may enter this value into the calculator or enter other data. This functionality was included to allow users to incorporate additional measurements of PFAS not available through the UCMR3 data. While the UCMR3 sampling was nationally representative, it contains data on only a subset of drinking water systems. Also, many UCMR3 samples were taken at the entry points to the distribution system rather than at the tap, and users may have site-specific data for their homes.
Overall, these models reasonably predict serum levels in communities exposed to PFAS primarily from drinking water. Future modification will involve additional evaluation of the parameters in infants and young children as data become available. Additionally, the web estimator outputs today’s estimated serum level with explanations and graphical presentation suitable for the public. The models are able to model serum concentration over time and could be tailored to allow for changing background over time and with age. This would allow the models to also predict historic serum levels in order to understand exposure over time for participants in epidemiologic studies or for other research purposes.
Supplementary Material
5. Acknowledgments
Abt Associates authors and Dr. Weihsueh Chiu were supported under contracts PO0400247 and GS00F045DA from ATSDR under a subcontract to Guidehouse LLC. Weihsueh Chiu was also supported, in part, by grants from NIH/NIEHS (P42 ES027704, P30 ES029067). Authors from Abt also received internal funding for final manuscript preparation. Ryan Klein provided support on modeling and quality assurance. Rekha Balachandran provided valuable feedback on the methods and description of the models. Eliza Duquette, Melika Rasti, Sara DeLessio, and Katie Long assisted in development of the web-based JavaScript tool. Diane Ferguson edited the manuscript. Meredith Shoemaker, Stephanie Lane, and Fred Sieling of Guidehouse LLC provided valuable feedback on drafts of the web estimator and manuscript.
The findings and conclusions in this report are those of the author(s) and do not necessarily represent the official position of the Centers for Disease Control and Prevention/the Agency for Toxic Substances and Disease Registry.
6. References
- ATSDR. (2020a). Health Consultation. Per- and Polyfluoroalkyl Substances (PFAS) in the PEASE Tradeport Public Water System. March 20, 2020. Available: https://www.atsdr.cdc.gov/HAC/pha/pease/Pease_Air_Force_Base_HC-508.pdf [Google Scholar]
- ATSDR. (2020b). Exposure Assessment Protocol: Biological and Environmental Sampling of Per- and Polyfluoroalkyl Substances (PFAS). V3.0. Available: https://www.atsdr.cdc.gov/pfas/docs/pfas-exposure-assessment-protocol-508.pdf. Last accessed Feb 2022 [Google Scholar]
- [dataset] ATSDR. (2021). Per- and Polyfluoroalkyl Substances (PFAS) Exposure Assessment for Westfield, Hampden County, Massachusetts. Available: https://www.atsdr.cdc.gov/pfas/docs/hampden-county-report-508.pdf. Data Obtained March 17, 2021 from authors [Google Scholar]
- [dataset] ATSDR. (2022a). Per- and Polyfluoroalkyl Substances (PFAS) Exposure Assessment for Martinsburg, Berkely County, West Virginia. Available: https://www.atsdr.cdc.gov/pfas/docs/ATSDR-PFAS-EA-Site-C-NewCastleCounty-Report-508.pdf. Data Obtained March 17, 2021 from authors [Google Scholar]
- [dataset] ATSDR. (2022b). Per- and Polyfluoroalkyl Substances (PFAS) Exposure Assessment for New Castle County, Delaware (near New Castle Air National Guard Base). Available: https://www.atsdr.cdc.gov/pfas/docs/ATSDR-PFAS-BerkeleyCounty-Report-508.pdf. Data Obtained March 17, 2021 from authors [Google Scholar]
- [dataset] ATSDR. (2022c). Per- and Polyfluoroalkyl Substances (PFAS) Exposure Assessment for Airway Heights, Spokane County, Washington. Available: https://www.atsdr.cdc.gov/pfas/docs/ATSDR-PFAS-EA-Site-D-SpokaneCounty-Report-508.pdf. Data Obtained March 17, 2021 from authors [Google Scholar]
- Balk FGP, Winkens Pütz KA, Ribbenstedt A, Gomis MI, Filipovic M, Cousins IT (2019). Children’s exposure to perfluoroalkyl acids-a modelling approach. Environmental Science: Processes and Impacts. 21(11): 1875–1886. 10.1039/c9em00323a [DOI] [PubMed] [Google Scholar]
- Bartell SM, Calafat AM, Lyu C, Kato K, Ryan PB and Steenland K (2010). Rate of decline in serum PFOA concentrations after granular activated carbon filtration at two public water systems in Ohio and West Virginia. Environmental Health Perspectives, 118(2), 222–228. 10.1289/ehp.0901252. [DOI] [PMC free article] [PubMed] [Google Scholar]
- Beesoon S, Webster GM, Shoeib M, Harner T, Benskin JP and Martin JW (2011). Isomer profiles of perfluorochemicals in matched maternal, cord, and house dust samples: manufacturing sources and transplacental transfer. Environmental Health Perspectives, 119(11), 1659–1664. 10.1289/ehp.1003265. [DOI] [PMC free article] [PubMed] [Google Scholar]
- Boronow KE, Green Brody J, Schaider LA, Peaslee GF, Havas L, and Cohn BA. 2019. Serum concentrations of PFASs and exposure-related behaviors in African American and non-Hispanic white women. Journal of Exposure Science & Environmental Epidemiology 2019 29:2: 206–217. 10.1038/s41370-018-0109-y [DOI] [PMC free article] [PubMed] [Google Scholar]
- Brochot C, Casas M, Manzano-Salgado C, Zeman FA, Schettgen T, Vrijheid M, Bois FY. (2019). Prediction of maternal and foetal exposures to perfluoroalkyl compounds in a Spanish birth cohort using toxicokinetic modelling. Toxicological Applied Pharmacology 2019 Sep 15;379:114640. doi: 10.1016/j.taap.2019.114640. Epub 2019 Jun 26. [DOI] [PubMed] [Google Scholar]
- Cai D, Li QQ, Chu C, Wang SZ, Tang YT, Appleton AA, … Zeng XW. (2020). High trans-placental transfer of perfluoroalkyl substances alternatives in the matched maternal-cord blood serum: Evidence from a birth cohort study. Science of the Total Environment, 705, 135885. 10.1016/j.scitotenv.2019.135885. [DOI] [PubMed] [Google Scholar]
- Cariou R, Veyrand B, Yamada A, Berrebi A, Zalko D, Durand S, … Le Bizec B. (2015). Perfluoroalkyl acid (PFAA) levels and profiles in breast milk, maternal and cord serum of French women and their newborns. Environment International, 84, 71–81. 10.1016/j.envint.2015.07.014. [DOI] [PubMed] [Google Scholar]
- Centers for Disease Control and Prevention (CDC). (2001). “Data Table of Infant Weight-for-age Charts.” Retrieved March 3, 2020
- Centers for Disease Control and Prevention (CDC). (2016). National Health and Nutrition Examination Survey Data, 2013–2014 Data Documentation, Codebook, and Frequencies. Perfluoroalkyl and Polyfluoroalkyl Substances (formerly Polyfluoroalkyl Chemicals - PFC) (PFAS_H). Hyattsville, MD: U.S. Department of Health and Human Services. https://wwwn.cdc.gov/Nchs/Nhanes/2013-2014/PFAS_H.htm [Google Scholar]
- Centers for Disease Control and Prevention (CDC). (2018). National Health and Nutrition Examination Survey Data, 2015–2016 Data Documentation, Codebook, and Frequencies. Perfluoroalkyl and Polyfluoroalkyl (PFAS_I). Hyattsville, MD: U.S. Department of Health and Human Services. https://wwwn.cdc.gov/Nchs/Nhanes/2015-2016/PFAS_I.htm [Google Scholar]
- Centers for Disease Control and Prevention (CDC). (2020). National Health and Nutrition Examination Survey Data, 2017–2018 Data Documentation, Codebook, and Frequencies. Perfluoroalkyl and Polyfluoroalkyl Substances (PFAS_J). Hyattsville, MD: U.S. Department of Health and Human Services. https://wwwn.cdc.gov/Nchs/Nhanes/2017-2018/PFAS_J.htm [Google Scholar]
- Chiu WA, Lynch ML, Lay CR, Antezana A, Malek P, Sokolinski S, and Rogers RD. (2022). Bayesian Estimation of Human Population Toxicokinetics of PFOA, PFOS, PFHxS, and PFNA from Studies of Contaminated Drinking Water. Environmental Health Perspectives, 10.1289/EHP10103 [DOI] [PMC free article] [PubMed] [Google Scholar]
- Chou WC, & Lin Z (2021). Development of a Gestational and Lactational Physiologically Based Pharmacokinetic (PBPK) Model for Perfluorooctane Sulfonate (PFOS) in Rats and Humans and Its Implications in the Derivation of Health-Based Toxicity Values. Environmental Health Perspectives 2021 Mar;129(3):37004. doi: 10.1289/EHP7671. Epub 2021 Mar 17. [DOI] [PMC free article] [PubMed] [Google Scholar]
- Cordner A, De La Rosa VY, Schaider LA, Rudel RA, Richter L, and Brown P. (2019). “Guideline levels for PFOA and PFOS in drinking water: The role of scientific uncertainty, risk assessment decisions, and social factors.” Journal of Exposure Science & Environmental Epidemiology 29: 157–171. doi: 10.1038/s41370-018-0099-9 [DOI] [PMC free article] [PubMed] [Google Scholar]
- Felton R 2020, September 24. What’s really in your bottled water? Consumer Reports. https://www.consumerreports.org/bottled-water/whats-really-in-your-bottled-water/ [Google Scholar]
- Eidelman AI, Schanler RJ, Johnston M, Landers S, Noble L, Szucs K, Viehmann L; Breastfeeding and the Use of Human Milk. Pediatrics March 2012; 129 (3): e827–e841. 10.1542/peds.2011-3552 [DOI] [PubMed] [Google Scholar]
- Emmett EA, Shofer FS, Zhang H, Freeman D, Desai C and Shaw LM (2006). Community exposure to perfluorooctanoate: relationships between serum concentrations and exposure sources. Journal of Occupational and Environmental Medicine, 48(8), 759–770. 10.1097/01.jom.0000232486.07658.74. [DOI] [PMC free article] [PubMed] [Google Scholar]
- Environmental Protection Agency (EPA). (2016). “Third Unregulated Contaminant Monitoring Rule.” UCMR3 Database. from https://www.epa.gov/dwucmr/third-unregulated-contaminant-monitoring-rule.
- Environmental Protection Agency (EPA). (2021). “Fifth Unregulated Contaminant Monitoring Rule.” UCMR3 Database from https://www.epa.gov/dwucmr/fifth-unregulated-contaminant-monitoring-rule.
- Environmental Protection Agency (EPA). (2018). 2018 Edition of the Drinking Water Standards and Health Advisories Tables. EPA 822-F-18-00.
- Environmental Protection Agency (EPA). (2011) Exposure Factors Handbook: 2011 Edition. National Center for Environmental Assessment, Washington, DC; EPA/600/R-09/052F. Available from the National Technical Information Service, Springfield, VA, and online at http://www.epa.gov/ncea/efh [Google Scholar]
- Environmental Protection Agency (EPA) (2019). Ingestion of Water and Other Select Liquids. Exposure Factors Handbook Chapter 3 (Update). Washington, DC, U.S. EPA Office of Research and Development: 3-1–3-138. [Google Scholar]
- Environmental Protection Agency (EPA) and Agricultural Research Service (ARS). (2020). What We Eat in America - Food Commodity Intake Database, 2005-2010 (WWEIA-FCID 2005–10). [Google Scholar]
- Eastern Research Group (ERG) (2018a). PFAS Drinking Water Exposure Profile Barnes Air National Guard Base, Hampden County, MA. [Google Scholar]
- Eastern Research Group (ERG) (2018b). PFAS Drinking Water Exposure Profile New Castle Air National Guard Base (ANGB), New Castle County, Delaware [Google Scholar]
- Eastern Research Group (ERG) (2018c). PFOA/PFOS Drinking Water Exposure Profile 167th Airlift Wing Martinsburg Air National Guard Base (Martinsburg ANGB), Berkeley County, West Virginia [Google Scholar]
- Eastern Research Group (ERG) (2018d). PFOA/PFOS Drinking Water Exposure Profile Fairchild Air Force Base (AFB), Spokane County, WA [Google Scholar]
- Environmental Working Group (EWG). (2020). PFAS Contamination of Drinking Water Far More Prevalent Than Previously Reported. Retrieved from https://www.ewg.org/research/national-pfas-testing/. Date accessed: March 10, 2020. [Google Scholar]
- Friis-Hansen B (1961). Body water compartments in children: changes during growth and related changes in body composition. Pediatrics, 28, 169–181. [PubMed] [Google Scholar]
- Fromme H, Mosch C, Morovitz M, Alba-Alejandre I, Boehmer S, Kiranoglu M, … Völkel W. (2010). Pre- and Postnatal Exposure to Perfluorinated Compounds (PFCs). Environmental Science & Technology, 44(18), 7123–7129. 10.1021/es101184f. [DOI] [PubMed] [Google Scholar]
- Gardner P (2019). “Meet Michigan residents affected by PFAS in their drinking water.” Retrieved January 15, 2021, from https://www.mlive.com/news/2019/12/meet-michigan-residents-affected-by-pfas-in-their-drinking-water.html. [Google Scholar]
- Goeden HM, Greene CW, and Jacobus JA (2018). A transgenerational toxicokinetic model and its use in derivation of Minnesota PFOA water guidance. Journal of Exposure Science & Environmental Epidemiology, 29(2), 183–195. 10.1038/s41370-018-0110-5 [DOI] [PMC free article] [PubMed] [Google Scholar]
- Gutzkow KB, Haug LS, Thomsen C, Sabaredzovic A, Becher G and Brunborg G (2012). Placental transfer of perfluorinated compounds is selective--a Norwegian Mother and Child sub-cohort study. International Journal of Hygiene and Environmental Health, 215(2), 216–219. 10.1016/j.ijheh.2011.08.011. [DOI] [PubMed] [Google Scholar]
- Han W, Gao Y, Yao Q, Yuan T, Wang Y, Zhao S, … Tian Y. (2018). Perfluoroalkyl and polyfluoroalkyl substances in matched parental and cord serum in Shandong, China. Environment International, 116, 206–213. 10.1016/j.envint.2018.04.025. [DOI] [PubMed] [Google Scholar]
- Hu XC, Andrews DQ, Lindstrom AB, Bruton TA, Schaider LA, Grandjean P, Lohmann R, Carignan CC, Blum A, Balan SA, Higgins CP, and Sunderland EM (2016). “Detection of poly- and perfluoroalkyl substances (PFASs) in U.S. drinking water linked to industrial sites, military fire training areas, and wastewater treatment plants.” Environmental Science & Technology Letters 3(10): 344–350. doi: 10.1021/acs.estlett.6b00260. [DOI] [PMC free article] [PubMed] [Google Scholar]
- Hurley S, Houtz E, Goldberg D, Wang M, Park JS, Nelson DO, Reynolds P, Bernstein L. Anton-Culver H, Horn-Ross P and Petreas M. 2016. Preliminary associations between the detection of perfluoroalkyl acids (PFAAs) in drinking water and serum concentrations in a sample of California women. Environmental Science and Technology Letters. 7(3): 264–269. doi: 10.1021/acs.estlett.6b00154 [DOI] [Google Scholar]
- Johnson T (2020). “Sen. Dave Hansen urging free blood tests for people affected by contaminated water.” Retrieved January 15, 2021, from https://www.wbay.com/content/news/Sen-Dave-Hansen--566961101.html
- Karrman A, Ericson I, van Bavel B, Darnerud PO, Aune M, Glynn A, … Lindstrom G. (2007). Exposure of perfluorinated chemicals through lactation: levels of matched human milk and serum and a temporal trend, 1996–2004, in Sweden. Environmental Health Perspectives, 115(2), 226–230. 10.1289/ehp.9491. [DOI] [PMC free article] [PubMed] [Google Scholar]
- Kingsley SL, Eliot MN, Kelsey KT, Calafat AM, Ehrlich S, Lanphear BP, Chen A, & Braun JM (2018). Variability and predictors of serum perfluoroalkyl substance concentrations during pregnancy and early childhood. Environmental research, 165, 247–257. 10.1016/j.envres.2018.04.033 [DOI] [PMC free article] [PubMed] [Google Scholar]
- Loccisano AE, Campbell JL Jr., Andersen ME and Clewell HJ 3rd (2011). Evaluation and prediction of pharmacokinetics of PFOA and PFOS in the monkey and human using a PBPK model. Regulatory Toxicological Pharmacology, 59(1), 157–175. 10.1016/j.yrtph.2010.12.004. [DOI] [PubMed] [Google Scholar]
- Loccisano AE, Longnecker MP, Campbell JL Jr., Andersen ME and Clewell HJ 3rd (2013). Development of PBPK models for PFOA and PFOS for human pregnancy and lactation life stages. Journal of Toxicological Environmental Health, 76(1), 25–57. 10.1080/15287394.2012.722523. [DOI] [PMC free article] [PubMed] [Google Scholar]
- Manzano-Salgado CB, Casas M, Lopez-Espinosa MJ, Ballester F, Basterrechea M, Grimalt JO, … Vrijheid M. (2015). Transfer of perfluoroalkyl substances from mother to fetus in a Spanish birth cohort. Environmental Research, 142, 471–478. 10.1016/j.envres.2015.07.020. [DOI] [PubMed] [Google Scholar]
- Minnesota Department of Health (MDH) (2017). Toxicokinetic Model for Perfluorooctane Sulfonate (PFOS) and Perfluorooctanoic Acid (PFOA) and Its Use in the Derivation of Human Health-Based Water Guidance Values. [Google Scholar]
- Minnesota Department of Health (MDH) (2019). Toxicological Summary of PFHxS. [Google Scholar]
- Mogensen UB, Grandjean P, Nielsen F, Weihe P, & Budtz-Jørgensen E (2015). Breastfeeding as an exposure pathway for perfluorinated alkylates. Environmental Science & Technology, 49(17), 10466–10473. 10.1021/acs.est.5b02237 [DOI] [PMC free article] [PubMed] [Google Scholar]
- Monroy R, Morrison K, Teo K, Atkinson S, Kubwabo C, Stewart B and Foster WG (2008). Serum levels of perfluoroalkyl compounds in human maternal and umbilical cord blood samples. Environmental Research, 108(1), 56–62. 10.1016/j.envres.2008.06.001. [DOI] [PubMed] [Google Scholar]
- Nakagawa H, Hirata T, Terada T, Jutabha P, Miura D, Harada KH, Inoue K, Anzai N, Endou H, Inui K, Kanai Y, Koizumi A. (2008). Roles of organic anion transporters in the renal excretion of perfluorooctanoic acid. Basic Clin Pharmacol Toxicol. 2008 Jul;103(1):1–8. doi: 10.1111/j.1742-7843.2007.00155.x. Epub 2008 Jul 1. [DOI] [PubMed] [Google Scholar]
- Needham LL, Grandjean P, Heinzow B, Jorgensen PJ, Nielsen F, Patterson DG Jr., … Weihe P. (2011). Partition of environmental chemicals between maternal and fetal blood and tissues. Environmental Science and Technology, 45(3), 1121–1126. 10.1021/es1019614. [DOI] [PMC free article] [PubMed] [Google Scholar]
- New Castle Municipal Services Commission (MSC) (2010). 2010 Annual Drinking Water Quality Report. New Castle, DE, City of New Castle Municipal Services Commission. [Google Scholar]
- New Castle Municipal Services Commission (MSC) (2011). 2011 Annual Drinking Water Quality Report. New Castle, DE City of New Castle Municipal Services Commission. [Google Scholar]
- New Castle Municipal Services Commission (MSC) (2015). 2015 Annual Drinking Water Quality Report. New Castle, DE, City of New Castle Municipal Services Commission. [Google Scholar]
- New Castle Municipal Services Commission (MSC) (2016). 2016 Annual Drinking Water Quality Report. New Castle, DE, City of New Castle Municipal Services Commission. [Google Scholar]
- New Castle Municipal Services Commission (MSC) (2017). 2017 Annual Drinking Water Quality Report. New Castle, DE, City of New Castle Municipal Services Commission. [Google Scholar]
- New Castle Municipal Services Commission (MSC) (2019). 2019 Annual Drinking Water Quality Report. New Castle, DE, City of New Castle Municipal Services Commission. [Google Scholar]
- NPR (2019). “PFAS-contaminated water turned residents in a W. Michigan community into activists.” from https://www.michiganradio.org/post/pfas-contaminated-water-turned-residents-w-michigan-community-activists.
- Post GB, Gleason JA, & Cooper KR (2017). Key scientific issues in developing drinking water guidelines for perfluoroalkyl acids: Contaminants of emerging concern. PLoS biology, 15(12), e2002855. [DOI] [PMC free article] [PubMed] [Google Scholar]
- Thomsen C, Haug LS, Stigum H, Froshaug M, Broadwell SL and Becher G (2010). Changes in concentrations of perfluorinated compounds, polybrominated diphenyl ethers, and polychlorinated biphenyls in Norwegian breast-milk during twelve months of lactation. Environmental Science and Technology, 44(24), 9550–9556. 10.1021/es1021922. [DOI] [PubMed] [Google Scholar]
- van Beijsterveldt IALP, van Zelst BD, van den Berg SAA, de Fluiter KS, van der Steen M, & Hokken-Koelega ACS (2022). Longitudinal poly- and perfluoroalkyl substances (PFAS) levels in Dutch infants. Environment International. 160:107068. 10.1016/j.envint.2021.107068 [DOI] [PubMed] [Google Scholar]
- Vestergren R, & Cousins IT (2009). Tracking the pathways of human exposure to perfluorocarboxylates. Environmental Science and Technology, 43(15), 5565–5575. 10.1021/ES900228K/SUPPL_FILE/ES900228K_SI_001.PDF [DOI] [PubMed] [Google Scholar]
- Verner MA, Ngueta G, Jensen ET, Fromme H, Volkel W, Nygaard UC, … Longnecker MP. (2016). A Simple pharmacokinetic model of prenatal and postnatal exposure to perfluoroalkyl substances (PFASs). Environ Sci Technol, 50(2), 978–986. 10.1021/acs.est.5b04399. [DOI] [PubMed] [Google Scholar]
- Westfield Department of Public Works (DPW) (2015). January 1, 2014 through December 31, 2014 Water Quality Report. Westfield, MA, Westfield Water Resources Department. [Google Scholar]
- Westfield Department of Public Works (DPW) (2017). January 1, 2016 through December 31, 2016 Water Quality Report. Westfield, MA, Department of Public Works – Water Division. [Google Scholar]
- Westfield Department of Public Works (DPW) (2018). January 1, 2017 through December 31, 2017 Water Quality Report. Westfield, MA, Department of Public Works – Water Division. [Google Scholar]
- Westfield Department of Public Works (DPW) (2019). January 1, 2018 through December 31, 2018 Water Quality Report. Westfield, MA, Department of Public Works – Water Division. [Google Scholar]
- Worley RR, Moore SM, Tierney BC, Ye X, Calafat AM, Campbell S, … Fisher J. (2017). Per- and polyfluoroalkyl substances in human serum and urine samples from a residentially exposed community. Environ Int, 106, 135–143. 10.1016/j.envint.2017.06.007. [DOI] [PMC free article] [PubMed] [Google Scholar]
- Xue J, Zartarian V, Wang SW, Liu SV and Georgopoulos P (2010). Probabilistic Modeling of Dietary Arsenic Exposure and Dose and Evaluation with 2003–2004 NHANES Data. Environmental Health Perspectives, 118(3), 345–350. 10.1289/ehp.0901205. [DOI] [PMC free article] [PubMed] [Google Scholar]
- Zhang T, Sun H, Lin Y, Qin X, Zhang Y, Geng X and Kannan K (2013). Distribution of poly- and perfluoroalkyl substances in matched samples from pregnant women and carbon chain length related maternal transfer. Environmental Science and Technology, 47(14), 7974–7981. 10.1021/es400937y. [DOI] [PubMed] [Google Scholar]
Associated Data
This section collects any data citations, data availability statements, or supplementary materials included in this article.