

Abstract
The methyl transfer reaction between SAM and glycine catalyzed by Glycine N-Methyltransferase (GNMT) was examined using QM-cluster models generated by Residue Interaction Network ResidUe Selector (RINRUS). RINRUS is a Python-based tool that can build QM-cluster models with rules-based processing of the active site residue interaction network. This way of enzyme model-building allows quantitative analysis of residue/fragment contributions to kinetic and thermodynamic properties of the enzyme. Many residue fragments are important for the GNMT catalytic reaction, such as Gly137, Asn138 and Arg175 which interact with the glycine substrate, and Trp30, Asp85, and Tyr242 which interact with the SAM cofactor. Our study shows that active site fragments that interact with the glycine substrate and SAM cofactor must both be included in the QM-cluster models. Even though the proposed mechanism is a simple one-step reaction, GNMT may be a rather challenging case study for QM-cluster models because convergence in energetics requires models with > 350 atoms. “Maximal” QM-cluster models built with either qualitative contact count ranking or quantitative interaction energies from Functional Group Symmetry Adapted Perturbation Theory provide acceptable results. Hence, important residue fragments that contribute to the energetics of the methyl-transfer reaction in GNMT are correctly identified in the RIN. Observations from this work suggest new directions to better establish an effective approach for constructing atomic-level enzyme models.
Graphical Abstract

INTRODUCTION
In computational enzymology, scientists encounter many complex problems when attempting to understand enzymatic reaction mechanisms at an atomic scale. Ontologies and automated workflows are lacking that can fragment the macromolecule into a computationally achievable size with either multiscale quantum mechanics/molecular mechanics (QM/MM) or QM-only “cluster models”. Without a standard set of building principles available in the community, automation, reproducibility, and calibration are challenging. There have been some recent successful attempts to calibrate quantum chemical levels of theory (one-electron basis sets, wave function or density functional choice, and implicit solvation scheme) for modeling atomic-level enzyme kinetics.1,2 However, an overall lack of automation and model design standards raise the learning curve for new practitioners, prevent a deeper understanding of differences between QM/MM and QM-cluster enzymology, and inhibit quantitative comparison to experimental results.
RINRUS (Residue Interaction Network ResidUe Selector), is a standalone Python-based toolkit developed by our group that integrates mathematical and chemical analytics tools for systematic and quantitative study of protein structure and reactivity within the framework of QM-cluster models.3 The software designs front-end atomic-level models based on several schemes ranking the importance of active site resides and fragments, primarily employing 1) simple structural metrics such as radial distance of fragments from a defined active site “center”, 2) qualitative descriptors derived from the Residue Interaction Network,4–6 or 3) quantitative descriptors derived from Functional Group / Intramolecular Symmetry Adapted Perturbation Theory (F/I-SAPT).7–11 RINRUS contains an algorithmic method for trimming residues, capping atomic valencies, and freezing Cα/Cβ atoms of residues. Thus, reproducibility is embedded into the RINRUS-designed QM-cluster model input files, which are generated and can be subsequently run using several popular open-source and commercial quantum chemistry packages.
This work uses RINRUS to study the proposed mechanism for Glycine N-methyltransferase (GNMT). GNMT belongs to the enzyme class of methyltransferases, which catalyze the transfer of a methyl group from a S-Adenosyl methionine (SAM, AdoMet) cofactor to small-molecule substrates. SAM is a well-known methyl donor and is converted to S-Adenosyl homocysteine (SAH, AdoHcy) in the process. The methyltransferase class of enzymes are druggable targets implicated in several metabolic diseases12–15 and thus atomic-level exploration and calibration is valuable.
One well-studied example of a methyltransferase enzyme is human Catechol-O-Methyltransferase (COMT). An X-ray crystal structure of COMT (PDB:3BWM) complexed with SAM and a 3,5-dinitrocatechol inhibitor at 1.98 Å resolution16 has been a focus of several QM/MM and QM-cluster model benchmark efforts.17–24 The non-spherical nature of the COMT active site provides a useful case study to demonstrate slow convergence of energies and properties with respect to model size when expanding radially from the Mg2+ ion at the center of the active site. Recently, a QM-cluster model study based on the X-ray crystal structure of human COMT was published by our group to explore the convergence of the energetics of the methyl transfer reaction with respect to growing QM-cluster model size using five different model-building schemes.19 Activation free energies and reaction free energies were computed using Density Functional Theory (DFT) for 550 unique QM-cluster models built with the RINRUS toolkit. K-means clustering was used to identify a set of residues that contribute systematically for convergence of ΔG‡ and ΔGrxn with a modest model size of 200–300 atoms. The findings also indicate that building models stepwise using residues ranked by the number of interactions with substrate/cofactor led to accelerated convergence within 2 kcal/mol of the largest ~500-atom QM-cluster models.19
Another type of methyltransferases is Glycine N-methyltransferase (GNMT), which is found in endocrine system organs of several mammals.25 GNMT transfers the methyl group from SAM to glycine, forming sarcosine (Scheme 1). Unlike many methyltransferases, GNMT is known for regulating the SAM/SAH ratio,14,26–28 which is important for SAM-dependent methyltransferase in cells. GNMT and COMT both belong to the AdoMet methyltransferase class I family, sharing a structural core; yet there are two fundamental differences – the GNMT active site is metal-free, and the methyl group of SAM is transferred to a nitrogen atom on a glycine substrate rather than an oxygen on a catechol substrate.29 The first X-ray crystal structure of GNMT in complex with SAM was determined at 3.0 Å resolution and has a unique “closed” structure.30 It has been observed that in the active site of GNMT, the binding of SAM and glycine follows a sequential order, with SAM binding before glycine,31 and the enzyme shows a sigmoidal rate behavior with respect to SAM concentration.26,32 Compared to COMT there are fewer computational studies on GNMT. Our research on COMT made a case that ranking residue importance based on RIN descriptors can be used to build reliable QM-cluster models with a size of 200–300 atoms. This work will test the same hypothesis on the proposed GNMT reaction mechanism.
Scheme 1:

Reaction mechanism of the methyl transfer by Glycine N-methyltransferase (GNMT), which catalyzes the transfer of a methyl group from S-adenosylmethionine (SAM) to glycine, resulting in the formation of S-adenosylhomocysteine (SAH) and sarcosine (N-methylglycine). In this one step reaction, methyl group is located in-between the S atom of SAM and N atom of glycine.
The apparent kinetic rate constant () of the wild-type GNMT from rat liver cytosol was measured to be 27.0 min−1 at 30 °C and pH 7.2.33 The free energy of activation converted from the rate constant of the wild-type protein is 18.2 kcal/mol. A R175K mutation reduced the binding affinity of glycine but not SAM, indicating Arg175 is important for glycine ligand binding. The rate constant of the R175K mutant was measured to be 9.94 min−1 with a significantly reduced and compared to the wild-type, which indicated that this mutation reduced catalytic efficiency.30 In 2003, X-ray crystal structures of the wild-type GNMT in complex with SAM and acetate (a known potent competitive inhibitor of glycine)33,34 and the R175K mutated enzyme in complex with SAM (PDBs: 1NBH and 1NBI)33 were determined with similar resolution (3.0 and 2.8 Å resolution, respectively). More recently, the activity of rat GNMT was measured radiometrically by steady-state kinetic measurements by Zhang and Klinman.29 The rate constant of GNMT was determined to be 174.5±23.2 min−1 for the wild type protein at 37 °C and neutral pH under saturated substrate conditions. The free energy of activation can be converted from the rate constant of the wild-type protein to be 17.4–17.6 kcal/mol.
The first theoretical study of the GNMT active site kinetics was a QM-cluster model study using different sized (ranging from 22 to 98 atoms) models in 2005 by Velichkova and Himo.35 The models were based on the acetate-inhibited X-ray crystal structure (PDB: 1NBH) and employed DFT with the B3LYP36–40 functional and 6–31G(d,p) basis sets for geometry optimization. At the optimized geometry, a single-point energy calculation was performed with a larger basis set [B3LYP/6–311+G(2d,2p)]. Implicit solvation effects were calculated as a single-point energy based on the optimized geometry at the B3LYP/6–31G(d,p) level using the conductor-like COSMO41–44 solvation model with the polarizable dielectric continuum (dielectric constant ε = 4). However, implicitly solvated single point energies on top of gas-phase optimized geometries can sometimes produce unreliable kinetics for QM-cluster models.45 The smallest model used by Velichkova and Himo included only the SAM, glycine, and Arg175 fragments. With this smallest model, the activation energy and reaction energy were predicted to be 11.2 and −20.1 kcal/mol, respectively. From the largest model in their study (including SAM, glycine, Arg175, Tyr21, Gly137, Asn138, and Tyr194) the free energies of activation and reaction were computed to be 15.0 and −14.1 kcal/mol. By adding one residue at a time to the smallest model, the change in activation free energies ranged from −1.3 (SAM + glycine + Arg175 + Gly137) to +6.4 kcal/mol (SAM + glycine + Arg175 + Tyr194), providing a semi-quantitative estimation of the influence of active site residues on kinetics/thermodynamics. A later computational study by Moliner et al.46 used QM/MM MD simulations with the rat-liver X-ray crystal structure and found the free energy of activation to be 15.2 kcal/mol, which is close to the value of the largest model of Velichkova and Himo as well as experimental data. In that study, the QM region only included the SAM and glycine and was computed at the AM1 or M06–2X/6–31+G(d,p) level of theory.
In this work, active site fragment ranking schemes based on Residue Interaction Network information are employed for building different sized QM-cluster models to study the GNMT N-demethylation reaction mechanism. Systematic QM-cluster model building provides insight on the function and importance of various residues, and how to build QM-cluster models in a more general way that is not only limited to chemical intuition and consideration of experimental results. Furthermore, an increasing number of case studies and benchmarks performed in our group will provide guidance on employing residue interaction networks to build the “right model” for the “right reason”, which will lead to improved comparison with experimental biokinetics and drug discovery. RINRUS-based QM-cluster models applied to the larger class of methyltransferases may elucidate previously unknown trends or commonalities in structure and function.
COMPUTATIONAL METHODS
The X-ray crystal structure of GNMT in complex with S-adenosyl-L-methionine (SAM, positively charged) and acetate (ACT, negatively charged) (PDB: 1NBH) was used to construct the models for quantum mechanical computations. The acetate inhibitor was changed to glycine (Gly, negatively charged form) in all models. In this study, only the wild type protein is used to construct models. RINRUS then utilizes the reduce program47 to add H atoms to the PDB file.
In the early computational study by Velichkova and Himo, eight small QM models were studied focusing on the effects of six important residues. The largest model that Velichkova and Himo35 investigated contained the SAM, glycine, Tyr21, Gly137, Asn138, Arg175, and Tyr194. We also created an exact same set of QM-cluster models composed of these residue fragments, labeled Himo-A, Himo-B, Himo-C, Himo-D, Himo-E, Himo-F, Himo-G, Himo-L1, Himo-L2, and Himo-L3, and Himo-L+H; where Himo-A through Himo-G include SAM, Gly, Arg175 and one or two additional active site residues (see Table S1); Himo-L1, Himo-L2, Himo-L3 are three conformations of the largest (“L”) model constructed by Velichkova and Himo that contains seven fragments and 98 atoms with 7 atoms kept frozen. Himo-L1 and Himo-L3 are constructed from the X-ray crystal structure with the OH group on Tyr21 pointing towards or away from SAM respectively in the initial TS guess, while Himo-L2 is constructed starting from the optimized Himo-L+H TS structure but with His142 removed. Two additional models were tested including the Himo-Seed model which has only SAM and Gly substrate and the Himo-L+H model which has all the fragments of Himo-L1 plus His142. His142 clearly has a large impact on kinetics and thermodynamics in the study by Himo. However, it was not included in their largest QM-cluster model. In all Himo-based QM-cluster models, the SAM cofactor was truncated the same way as in the Himo study,35 to an ethylmethylthioethane cation. All other QM-cluster models reported in this study used the full SAM molecule. Selected frozen atoms for the Himo-based models were equivalent to those frozen in the Himo study.
For constructing new QM-cluster models with RINRUS, a residue interaction network (RIN) of the entire protein needs to be first realized. In this study, the program probe48 was used to generate residue-residue atom contact information. Then a “seed” needs to be defined based on the fragments fundamental to the catalytic reaction. Ranking schemes for fragment selection then prioritize fragments that have either the highest number of interatomic contacts, the highest number of interaction types, or the largest magnitude interaction energies with the seed. In the first set of RINRUS QM-cluster models, SAM and Gly were defined as the seed, where contact counts between atoms of active site fragments with atoms of both the glycine substrate and SAM cofactor from the probe-based RIN were summed. A total of 25 residues (Table 1) were identified having one or more interatomic contacts48 with Gly or SAM (the active site of the enzyme is shown in Figure 1 with the 25 residues shown in green stick and Gly+SAM shown in magenta stick. In addition, 2D structure for this RIN is shown in Figure 2), and these residues were ranked based on decreasing number of contacts with the seed (shown in Table 1 with charge of each model and number of contacts between each residue fragment and the seed). His142 was singly protonated on the δ position as in the studies by Himo35 and Moliner.46 Among the 25 residues that interact with the seed fragments, Gly137 and Tyr194 interact with both SAM and glycine substrate, Tyr33, Asn138, Arg175, Tyr220, and Tyr242 interact with glycine substrate only, and the remaining 18 residue fragments interact with SAM only. The details of probe interaction types between the residue fragments and seed fragments are shown in Table S2. Based on the generated RIN, either main chain, side chain, or entire residues were trimmed and capped by RINRUS to fulfill atom valency in each model. The smallest RINRUS-designed QM-cluster model includes the SAM, Glycine substrate, Trp117, Trp30, and Tyr21 residues. These three residues all have more than 300 interaction counts with the seed. By increasing one fragment at a time based on the probe ranking, a total of 23 models were constructed with the largest “maximal” model containing 25 residues/fragments and the SAM+glycine seed (27 fragments total, 432 atoms). For the probe RIN with a Gly seed, 10 residue fragments were detected to interact with Gly. The smallest model has 5 residue fragments (SAM + Gly + Tyr21 + Trp117 + Arg175, 159 atoms). Tyr242 and Asn138 were ranked 6th and 7th in the ranking scheme (Table 2). Gly137 was found to have the least number of interaction counts with the substrate Gly, and with Gly137 included, the largest QM-cluster model with a Gly seed has 253 atoms.
Table 1.
Residue and trimming information for various sized QM-cluster models built based on residue fragments-seed (SAM+Gly) interaction counts of probe RIN. “Cα” indicates frozen alpha-carbon atoms for that residue, “Cα Cβ” indicates frozen alpha- and beta-carbons for that residue, “X” indicates no atom was frozen in the specified residue/fragment in the model. Residues ID#s written in italics were not identified in the smaller RIN as having contact with the seed but were added as bridging residues connecting two discrete residues such as Res8 model, Asp85 was not ranked among the top 8, but was added as a bridging residue. Gibbs free energies of activation and reaction are shown (in kcal/mol).
| contact counts | Charge | # of Atoms | Frozen Atoms | ΔG‡ | ΔGrxn | ||
|---|---|---|---|---|---|---|---|
|
| |||||||
| 1 | SAM293 | +1 | X | ||||
| 2 | Gly294 | 0 | X | ||||
| 3 | Trp117 | 627 | 0 | C α | |||
| Asn116 (mc) | 0 | C α | |||||
| 4 | Trp30 | 385 | 0 | Cα Cβ | |||
| 5 | Tyr21 | 300 | 0 | 129 | Cα Cβ | 19.2 | −20.2 |
| 6 | Asn116 (sc) | 269 | 0 | 136 | 20.5 | −17.9 | |
| 7 | Ser139 | 244 | 0 | 145 | C α | 14.1 | −20.9 |
| 8 | Ala86 | 190 | 0 | 160 | C α | 13.0 | −21.4 |
| Asp85 (mc) | 0 | C α | |||||
| 9 | Arg40 | 189 | +1 | 182 | Cα Cβ | 14.0 | −24.3 |
| 10 | Asp85 (sc) | 183 | 0 | 187 | C β | 17.3 | −17.9 |
| 11 | Tyr194 | 179 | 0 | 206 | Cα Cβ | 17.0 | −22.5 |
| 12 | Tyr242 | 172 | 0 | 225 | Cα Cβ | 17.2 | −24.3 |
| 13 | Asn138 | 165 | 0 | 239 | C α | 11.7 | −20.8 |
| 14 | Arg175 | 164 | +1 | 261 | Cα Cβ | 12.3 | −17.6 |
| 15 | Tyr33 | 128 | +1 | 280 | Cα Cβ | 11.5 | −22.3 |
| 16 | His142 | 118 | +1 | 295 | Cα Cβ | 10.3 | −22.6 |
| 17 | Tyr220 | 111 | +1 | 314 | Cα Cβ | 11.8 | −23.8 |
| 18 | Ser87 | 84 | +1 | 325 | C α | 11.4 | −23.7 |
| 19 | Ala115 | 57 | +1 | 332 | C α | 10.5 | −24.5 |
| 20 | Ile34 | 55 | +1 | 351 | Cα Cβ | 11.7 | −23.6 |
| 21 | Gly66 | 54 | +1 | 363 | C α | 12.3 | −18.7 |
| Cys65 (mc) | C α | ||||||
| 22 | Ala64 | 48 | +1 | 370 | C α | 11.4 | −19.2 |
| 23 | Gly137 | 39 | +1 | 377 | C α | 8.3 | −29.7 |
| 24 | Val69 | 28 | +1 | 391 | Cα Cβ | 8.7 | −28.4 |
| 25 | Leu136 | 24 | +1 | 398 | C α | 9.3 | −28.9 |
| 26 | Leu143 | 18 | +1 | 417 | C α | 10.9 | −26.8 |
| 27 | Met90 | 15 | +1 | 432 | C α | 9.1 | −29.7 |
|
| |||||||
| Himo-L1 | +1 | 98 | 13.0 | −18.0 | |||
Figure 1:

The active site of the X-ray crystal structure 1NBH chain A and the 3D structure shown in stick representation of the maximal model (Res27). The seed that includes the SAM and Gly is highlighted in magenta, and all other residues in the RIN are shown in green.
Figure 2:

2D structure of the maximal Res27 QM-cluster model which includes all residues that interact with SAM and glycine in PDB 1NBH.
Table 2.
Residue information for the various sized QM-cluster models built based on residue fragments-seed (Gly) interaction counts of probe-RIN. Gibbs free energies of activation and reaction are shown (in kcal/mol).
| Contact type counts | Res Charge | # of Atoms | ΔG‡ | ΔGrxn | ||
|---|---|---|---|---|---|---|
|
| ||||||
| 1 | Gly294 | −1 | ||||
| 2 | SAM293 | 0 | ||||
| 3 | Trp117 | 0 | ||||
| 4 | Trp21 | 0 | ||||
| 5 | Arg175 | 164 | +1 | 129 | 17.3 | −18.5 |
| 6 | Tyr242 | 172 | +1 | 148 | 16.7 | −22.1 |
| 7 | Asn138 | 165 | +1 | 167 | 16.8 | −37.8 |
| 8 | Tyr33 | 128 | +1 | 186 | 15.3 | −25.9 |
| 9 | Tyr194 | 116 | +1 | 205 | 15.6 | −13.5 |
| 10 | Tyr220 | 111 | +1 | 224 | 14.5 | −19.9 |
| 11 | Trp30 | 37 | +1 | 246 | 13.8 | −16.1 |
| 12 | Gly137 | 17 | +1 | 253 | 5.7 | −32.4 |
The largest QM-cluster model with SAM+Gly seed that was constructed from the probe-based RIN was used to compute seed-residue interaction energies with Functional-Group Symmetry-Adapted Perturbation Theory (F-SAPT),8 which is implemented in the PSI4 v1.549 program. F-SAPT can analyze and partition the non-covalent interaction energy between two bodies into electrostatic, exchange-repulsion, induction, and dispersion energies as in conventional SAPT. However, F-SAPT can further decompose one of the parent bodies into smaller sub-fragments such as user defined chemically meaningful functional groups. Here, one body in the F-SAPT computation is defined as the seed (Gly or Gly+SAM) and the second body is defined as the main chain and/or side chain of each amino acid residue present in the maximal QM-cluster model. The individual interaction energies between the seed and each main chain and/or side chain fragments are partitioned, and these F-SAPT interaction energies are incorporated into ranking the importance of residue fragments in the catalytic reaction step.10,19
As in our recently published work,10 the zeroth-order formulation of F-SAPT, F-SAPT0 is used for computing interaction energies with the jun-cc-pVDZ basis set on all atoms and frozen core electrons.8,11 Residues in the network are ranked according to the decreasing absolute value of the seed-fragment total interaction energy. When the substrate Gly alone was used as the seed, 22 residue fragments interact with Gly with an absolute interaction energy higher than 0.5 kcal/mol (Table 3), among which 16 have interaction energies higher than 1.0 kcal/mol. When SAM and Gly fragments are combined as the seed, 24 residue fragments interacting with SAM and/or Gly have an absolute interaction energy higher than 0.5 kcal/mol (Table 3), and 22 of the residue fragments have interaction energies higher than 1.0 kcal/mol. Two sets of F-SAPT-based QM-cluster models were incrementally built, with the size of the Gly-only seed and SAM+Gly seed models ranging from 81 to 384 and 81 to 385 atoms, respectively.
Table 3.
Residue mainchain or side chain (mc/sc) fragment ranking based on SAPT absolute total energy using Gly as the seed or SAM plus Gly as the seed. The F-SAPT total interaction energy (in kcal/mol) of each residue, charges and number of atoms of each model are listed along with the free energy of activation and reaction (in kcal/mol). The residues highlighted in red are not included in ResX-fsapt1 models.
| Gly Only | Eint | Charge | # of atoms | ΔG‡ | ΔGrxn | Gly plus SAM | Eint | Charge | # of atoms | ΔG‡ | ΔGrxn | |||
|---|---|---|---|---|---|---|---|---|---|---|---|---|---|---|
| 1 | Gly294 | Gly294 | ||||||||||||
| 2 | SAM293 | SAM293 | ||||||||||||
| 3 | Arg175 | sc | −110.0 | 1 | 81 | 30.7 | −9.2 | Arg175 | sc | −77.7 | 1 | 81 | 30.7 | −9.2 |
| 4 | Arg40 | sc | −33.3 | 2 | 103 | 29.6 | −18.7 | Asp85 | sc | −66.0 | 0 | 91 | 15.1 | −33.2 |
| 5 | Asp85 | sc | 24.7 | 1 | 113 | 15.1 | −22.3 | Arg40 | sc | −25.8 | 1 | 113 | 15.1 | −22.3 |
| 6 | Asn138 | sc | −20.6 | 1 | 125 | 14.0 | −19.8 | Ala64 | mc | −24.5 | 1 | 125 | 15.1 | −22.3 |
| 7 | Tyr220 | sc | −15.1 | 1 | 144 | 13.8 | −19.2 | Leu136 | mc | −21.2 | 1 | 137 | 16.7 | −22.4 |
| 8 | Tyr33 | sc | −12.8 | 1 | 163 | 17.2 | −16.9 | Tyr220 | sc | −16.8 | 1 | 156 | 17.3 | −19.3 |
| 9 | Asn138 | mc | 7.0 | 1 | 170 | 14.8 | −27.4 | Asn138 | sc | −13.7 | 1 | 170 | 14.3 | −25.6 |
| 10 | Gly137 | mc | 6.5 | 1 | 184 | 10.7 | −25.4 | Ser139 | sc | −13.6 | 1 | 181 | 11.7 | −23.4 |
| 11 | His142 | sc | 5.6 | 1 | 199 | 12.8 | −36.9 | His142 | sc | −12.1 | 1 | 196 | 16.1 | −19.8 |
| 12 | Ala64 | mc | 2.2 | 1 | 214 | 13.4 | −36.8 | Trp30 | sc | −10.8 | 1 | 218 | 10.4 | −32.5 |
| 13 | Tyr194 | sc | −1.6 | 1 | 233 | 12.3 | −35.6 | Tyr33 | sc | −10.4 | 1 | 237 | 9.1 | −32.7 |
| 14 | Tyr21 | sc | 1.4 | 1 | 252 | 11.3 | −25.1 | Trp117 | sc | −8.9 | 1 | 259 | 9.0 | −30.9 |
| 15 | Ala86 | mc | −1.2 | 1 | 269 | 13.9 | −24.5 | Tyr194 | sc | −5.4 | 1 | 278 | 9.0 | −30.9 |
| 16 | Met90 | sc | 1.1 | 1 | 284 | 14.2 | −24.5 | Gly137 | mc | −4.9 | 1 | 278 | 9.0 | −30.9 |
| 17 | Tyr242 | sc | −1.0 | 1 | 303 | 8.2 | −31.2 | Tyr21 | sc | 4.6 | 1 | 297 | 11.9 | −21.0 |
| 18 | Ala115 | mc | 0.9 | 1 | 315 | 10.4 | −24.8 | Ala86 | mc | 4.4 | 1 | 304 | 10.9 | −18.6 |
| 19 | Asn116 | mc | −0.9 | 1 | 315 | 10.4 | −24.8 | Ala115 | mc | −4.1 | 1 | 318 | 13.5 | −16.8 |
| 20 | Trp30 | sc | −0.6 | 1 | 337 | 9.2 | −23.3 | Met90 | sc | −3.5 | 1 | 333 | 13.7 | −16.4 |
| 21 | Trp117 | sc | 0.6 | 1 | 361 | 7.7 | −23.7 | Asn116 | mc | −3.1 | 1 | 333 | 13.7 | −16.4 |
| 22 | Ser87 | sc | −0.5 | 1 | 365 | 9.5 | −28.4 | Tyr242 | sc | −2.3 | 1 | 352 | 11.2 | −23.8 |
| 23 | Leu143 | sc | −0.5 | 1 | 384 | 9.5 | −28.5 | Asn138 | mc | −1.8 | 1 | 352 | 11.2 | −23.8 |
| 24 | Leu136 | mc | −0.3 | Ser87 | sc | 1.3 | 1 | 363 | 9.4 | −27.2 | ||||
| 25 | Ile34 | sc | −0.3 | Leu143 | sc | −0.8 | 1 | 382 | 10.1 | −27.3 | ||||
| 26 | Asn116 | sc | 0.3 | Ala86 | sc | −0.7 | 1 | 385 | 9.7 | −27.8 | ||||
| 27 | Ala86 | sc | −0.2 | Val69 | sc | −0.1 | ||||||||
| 28 | Ser139 | sc | 0.1 | Asn116 | sc | 0.0 | ||||||||
| 29 | Val69 | sc | 0.0 | Ile34 | sc | 0.0 | ||||||||
All subsequent QM-cluster model computations were performed using the Gaussian 16 program.50 Density functional theory (DFT) with the hybrid B3LYP exchange-correlation functional36–40 was employed with the 6–31G(d’) basis set for N, O, and S atoms51–53 and the 6–31G basis sets for C and H atoms.54 QM-cluster models incorporated the Grimme D3 (Becke-Johnson) dispersion correction (GD3BJ)55,56 and a conductor-like polarizable continuum model (CPCM)57,58 with cavity built using the universal force field (UFF) atomic radii, a non-default electrostatic scaling factor of 1.2, and the default parameters for water with an attenuated dielectric constant of ε = 4. This dielectric constant value35 has been previously determined as appropriate for simulating the less-polarized environment within an enzyme active site.59,60 Implicit solvation was incorporated in all geometry optimizations and harmonic frequency calculations. The computational methodology has been successfully employed in several enzyme studies which have reliable comparisons to experiment.19,61–64 Unscaled harmonic vibrational frequency calculations were used to identify all stationary points as either minima (no imaginary frequency) or transition states (only one imaginary frequency). Reactants and products corresponding to the methyl transfer TS were located by following the intrinsic reaction coordinate (IRC).65,66 The same “freeze code” scheme of Gaussian 16 used in other enzyme studies by our group is used in this study. It needs to be noted that all atoms in the SAM and glycine fragments are unfrozen in all RINRUS models. Zero-point energies (ZPE) and thermal enthalpy/free energy corrections were computed at 1 atm and 310 K.
The structures of every reactant, transition state, and product of every QM-cluster model reported here are represented in a PDB (Protein Data Bank) formatted file included with the SI. In the PDB files, the Cartesian coordinates are listed along with the corresponding atom freeze code information. The atom freeze code is specified in the last column of each line in the PDB file and is denoted by either “0” or “−1”. Specifically, a freeze code of “0” indicates that the atom is unfrozen and can move freely during the computation, while a code of “−1” indicates that the atom is frozen and remains fixed in its position throughout the computation.
The following labeling scheme ResX-Y is used for the QM-cluster model illustrating the reaction mechanism, where X = # of residues/fragments in the model (5 to 27); Y = R (reactant), TS (transition state), or P (product). For example, Res9-R refers to the optimized 9-fragment reactant structure. The Gly-only seed models follow the labeling scheme ResX-Y-Gly. For the F-SAPT-based models, when Gly is the seed fragment, as the labels ResX-Y-fsapt1 are used; and when both Gly and SAM are included in the seed, the label ResX-Y-fsapt2 is used.
RESULTS AND DISCUSSION
Himo-based models
Velichkova and Himo reported an activation energy and reaction energy (ΔG‡ and ΔGrxn) of 15.0 and −14.1 kcal/mol for their largest model. The minimal model (SAM+Gly) as well as models of Velichkova and Himo were re-tested, and the 3D cartoon of the optimized TS structures are shown in Figure S1. ΔG‡ and ΔGrxn of all Himo-based models computed in this study are shown in Figure 3 and Table S1. Comparatively, the initial QM-cluster models described in this work are constructed in the same fashion as Velichkova and Himo, but we utilize different basis sets, solvation schemes, and dispersion corrections. Hence, deviations from the original values of Velichkova and Himo are expected. The ΔG‡ and ΔGrxn of our Himo-seed model (SAM+Gly) are 17.0 and −21.5 kcal/mol, and the Himo-A model (SAM+Gly+Arg175) gives ΔG‡ and ΔGrxn values of 17.3 and −17.9 kcal/mol versus 11.2 and −20.1 kcal/mol of model A in Velichkova and Himo, shown in Figure 3. Our Himo-L1 model has a ΔG‡ and ΔGrxn of 13.0 and −18.0 kcal/mol at 310 K, which are lower than the values of the largest model of Velichkova and Himo (15.0 and −14.1 kcal/mol) and the experimental ΔG‡ value (17.4 – 17.6 kcal/mol), respectively. In the study of Velichkova and Himo, adding Tyr21, Asn138, Tyr194, or Tyr21+Gly137+Asn138+Tyr194 all led to a positive ΔΔG‡ value compared to model A. However, adding any of the core residue fragments to our Himo-A model leads to a negative ΔΔG‡ value, except Himo-L2 and Himo-L3. Our Himo-L+H model adds His142 to the largest model of Himo and has a ΔG‡ of 15.0 kcal/mol, which is also 2.3 kcal/mol lower than that of Himo-A and a ΔGrxn of −14.0 kcal/mol, which is 3.9 kcal/mol higher than that of Himo-A. For the largest Himo model, we found three conformations Himo-L1, Himo-L2, and Himo-L3 (Figure S1). Large energy differences are seen in the three models (Table S1), ΔG‡/ΔGrxn are 13.0/−18.0, 17.4/−15.8, 17.6/−16.0 kcal/mol for Himo-L1, Himo-L2, and Himo-L3 models, respectively. All the differences between our results and the ones from previous study indicate that QM-cluster models including only 7 residue fragments may not be an adequate enough representation of the GNMT active site to reliably depict the reaction environment, even though the largest model tested by Velichkova and Himo has a free energy of activation close to the experimental value. Hence, to gain more insight about GNMT and its catalysis, a more systematic approach is needed for finding a comprehensive QM-cluster model that eliminates size and composition deficiencies as a source of error.
Figure 3.

Free energy diagram of different sized Himo-based models (in blue, computed using B3LYP/6–31G(d’)/6–31G, built the same way as Himo) along with the Himo-Seed model (SAM plus Gly) and Himo-largest model plus His142 (Himo-L+H) built based on the models in ref 35. The free energies of the original models reported in ref 35 are shown in red. Symbols on top (triangles), middle (circles) and bottom (crosses) show the free energies of activation, reaction and charges for each model, respectively. The dashed line in magenta represents the experimental rate constant value converted to a free energy of activation of 17.5 kcal/mol.
RINRUS-based models: probe residue fragment ranking with a SAM+Gly seed
The ΔG‡ and ΔGrxn values of probe-based RINRUS QM-cluster models and the model charges are shown in Table 1 and Figure 4. Residue effects on the free energies are also examined using ΔΔG‡ and ΔΔGrxn [changes in ΔG‡ and ΔGrxn when model size increases by one residue (Figure S2)]. Among various sized models, the ΔG‡ values of RINRUS models range from 8.3 to 20.5 kcal/mol, and ΔGrxn values range from −29.7 to −17.6 kcal/mol at 310K, and the ΔG‡ and ΔGrxn values of the maximal model Res27 are 9.1 and −29.7 kcal/mol (Table 1, Figure 4). In this work, we propose two definitions for the “convergence” of a model building scheme: if both ΔG‡ and ΔGrxn of a model and all subsequent larger models are within either ±1 or ±3 kcal/mol of the ΔG‡ and ΔGrxn of the maximal model in the scheme.
Figure 4.

Free energy diagram of the 23 different sized RINRUS models along with the largest model in ref 35 built and computed in this study (B3LYP/6–31G(d’)/6–31G). Figure on top, middle and bottom show the free energies of activation for N-demethylation, reaction free energies, and charges for each model, respectively. The energies of Himo-L1 model (98 atoms) are shown in blue empty symbols. The dashed line in magenta represents the experimental value converted free energy of activation of 17.5 kcal/mol. The red dotted lines show the tight energy convergence range (within ±1 kcal/mol of the ΔG‡ and ΔGrxn of the maximal model Res27), the green dotted lines show the loose energy convergence range (within ±3 kcal/mol of the ΔG‡ and ΔGrxn of the maximal model Res27).
The two smallest models Res5 and Res6 have ΔG‡ values higher than 19 kcal/mol (Table 1, Figure 4). Starting from Res7, the ΔG‡ values of all models are below 17.5 kcal/mol, and unsigned ΔΔG‡ values stabilize after Ser139 is added. Still, some significant ΔΔG‡ and ΔΔGrxn values are seen when the charged residues Arg40 (Res9, ΔΔGrxn= −2.9 kcal/mol, Figure S2) and Asp85 (Res10, ΔΔG‡ and ΔΔGrxn of +3.3 and +6.4 kcal/mol, respectively in Figure S2) are sequentially added. From Res10 to Res12, ΔΔG‡ are small, ΔGrxn values become more negative. Adding Tyr194 (Res11) has a large effect on the reaction energy with ΔΔGrxn =−4.6 kcal/mol. While from Res12 to Res14, large ΔΔG‡ and ΔΔGrxn values are observed by adding Asn138 (Res13, −5.5 and +3.5 kcal/mol, respectively) and Arg175 (Res14, ΔΔGrxn = +3.2 kcal/mol). Among fragments of Ser139, Arg40, Asp85, Tyr194, Asn138, Arg175 that have large impact on free energies, only Tyr194, Asn138, and Arg175 residues were included in QM-cluster models constructed by Velichkova and Himo.35 The positively charged Arg175 was in every model of Velichkova and Himo as it hydrogen bonds to the two oxygen atoms of the Gly carboxyl group. To better characterize the effect of Arg175 in smaller models, Arg175 is added to Res5 to Res12 which are built from the X-ray structure, and all models are optimized. ΔG‡ and ΔGrxn values range from 12.6 to 27.2 kcal/mol and −23.3 to −2.6 kcal/mol, respectively (Table S3, Figure S3) and most models with Arg175 added are 4 to 7 kcal/mol higher in ΔG‡ and about 6 kcal/mol higher in ΔGrxn compared to the original models. However, no similar trends in ΔΔG‡ or ΔΔGrxn are found in the two sets of models (original Res5 to Res12 models without Arg175 and those with Arg175, Figure S3). Large changes in free energies and conformations such as a side chain reorientation of Tyr21 and large translation of the Gly substrate are observed in these small models (Figure S4). Energy/structure discrepancies between the sets of models with and without Arg175 suggest that smaller QM-cluster models are not reliable for studying this reaction as conformational freedom of each residue fragment is large. The Arg175 side chain hydrogen, which hydrogen bonds to the carboxyl group of Gly, may not be the only key residue for pinning down the Gly substrate in the active site or achieving energy consistency.
After Arg175 is included the Res14 probe-model, unsigned ΔΔG‡ values are less than 1.5 kcal/mol (Figure 4 and Figure S2), and ΔG‡ values are within 3.0 kcal/mol energy compared to that of Res27. Unsigned ΔΔGrxn values are less than 1.3 kcal/mol. However, convergence is disrupted by addition of Gly66 (Res21) and Ala64 (Res22), as the ΔΔGrxn values are +4.9 and −0.5 kcal/mol, respectively. The value of ΔGrxn for the Res22 model is 10.5 kcal/mol less negative than that of the maximal model.
Gly137 is included in Res23 which has an outsized structural effect on stabilizing the substrate, as its mainchain oxygen is a hydrogen bond acceptor to an amine hydrogen atom on the Gly substrate. Addition of Gly137 also causes the mainchain carbonyl group of Asn138 to shift and form two hydrogen bonds with the NH2 group of Gly while only one hydrogen bond is present in Res22. These newly established hydrogen bonds in Res23 make Gly substrate a stronger nucleophile which causes a decrease in kinetic and thermodynamic values (ΔΔG‡ = −3.1 and ΔΔGrxn = −10.5 kcal/mol compared to Res22, Figure S2). Gly137 also causes a decrease in ΔG‡ and ΔGrxn (ΔΔG‡ = −1.3 and ΔΔGrxn = −4.7 kcal/mol), which was also reported by Velichkova and Himo.35ΔG‡ values of the largest five probe-based models (Res23 to Res27) range from 8.3 to 10.9 kcal/mol, and ΔGrxn values range from −29.7 to −26.8 kcal/mol (Figure 4). The tight convergence of within ±1 kcal/mol free energy between a model and Res27 is disrupted by addition of Val69 (Res24, ΔΔGrxn = +1.3 kcal/mol compared to that of Res27) and Leu143 (Res26, changes in ΔG‡ and ΔGrxn are+1.7 and +2.9 kcal/mol compared to Res27). Our looser definition of QM-cluster model convergence is achieved with the 377-atom Res23 model. The energetics of GNMT catalysis is sensitive to addition of residue fragments even when the model sizes are relatively large. Res23 is the smallest RINRUS energy converged model which contains all residues in the Himo-L model (98 atoms), and additional residue fragments that stabilize SAM and Gly in the active site of the enzyme.
RINRUS-based models: probe residue fragment ranking with a smaller seed (Gly only)
It needs to be noted again that in all RINRUS-built QM-cluster models, the SAM was not trimmed. SAM is a much larger molecule than free glycine and several residues near the SAM cofactor have higher interaction counts than those that interact with Gly. For example, Trp117 (interacting only with SAM, 627 contacts) and Trp30 (348 interaction counts with SAM and only 37 with Gly) are ranked 3rd and 4th in the RIN, while Arg175 (only interacts with Gly, 164 contacts) is ranked 14th. Hence how to effectively weigh these interactions in order to balance the cofactor/substrate size difference may be another factor to add into consideration when building QM-cluster models.
We hypothesized that if we include all residues that interact only with the Gly, RINRUS would capture enough residues that interact also with the SAM to obtain quicker convergence of kinetics and thermodynamics with much smaller QM-cluster models compared to those converged in the original probe-ranking scheme with Gly+SAM seed. Therefore, a set of small QM-cluster models was built using probe-RIN contacts including Gly substrate as the only seed fragment. ΔG‡ and ΔGrxn for these models are shown in Table 2 and Figure 5. Consistently high ΔG‡ values are seen in the first 7 models (Res5-Gly to Res11-Gly ΔG‡ ranges from 13.8 to 17.3 kcal/mol, which are 4.7 to 8.2 kcal/mol higher than the maximal SAM+Gly model Res27), then large changes are observed in ΔG‡ and ΔGrxn after adding Gly137 in Res12-Gly (ΔΔG‡ and ΔΔGrxn are −8.1 and −16.3 kcal/mol, respectively). Specifically, the Gly137 main chain blocks a shift of the SAM methionine group towards Tyr194 and Gly substrate, which is observed in other models. Hence, residues that interact solely with SAM are also needed to reach energy convergence and proper conformation, which indicates that QM-cluster models built based on a RIN with only Gly as the seed fragment is not adequate for describing the methyl transfer reaction in GNMT.
Figure 5:
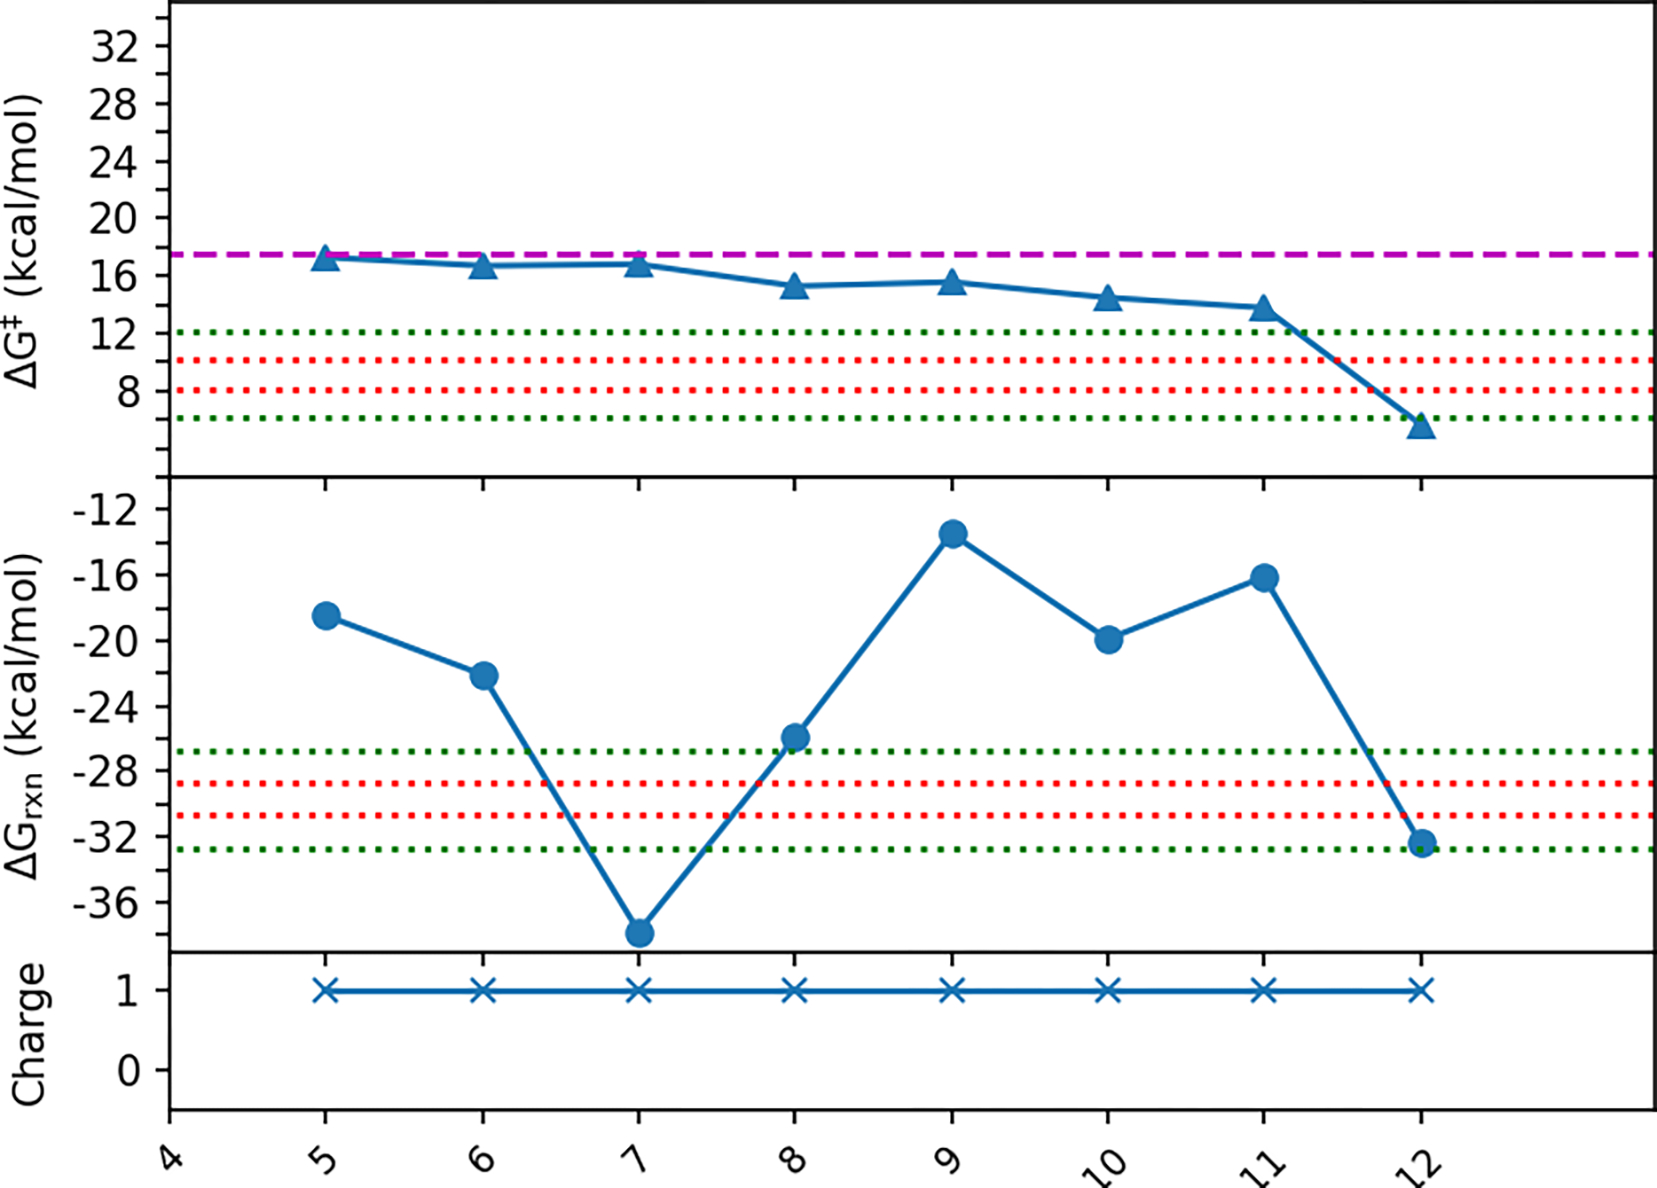
Free energies of activation and reaction of QM-cluster model built based on probe ranking of residue fragments interactions with Gly substrate only as the seed. The dashed line in magenta represents the experimental value converted free energy of activation of 17.5 kcal/mol. The red dotted lines show the tight energy convergence range (within ±1 kcal/mol of the ΔG‡ and ΔGrxn of the maximal model Res27), the green dotted lines show the loose energy convergence range (within ±3 kcal/mol of the ΔG‡ and ΔGrxn of the maximal model Res27).
F-SAPT interaction energy-based models: Gly only and SAM+Gly as seeds
Considering the limitations of using probe-SAM+Gly or Gly-only residue interaction counts to build QM-cluster models for achieving energy convergence in smaller sized models, a F-SAPT residue interaction energy-based ranking scheme was explored. F-SAPT ranks the charged residue fragments Arg175, Arg40, Asp85 much higher than probe-interaction counts with Gly+SAM seed. Arg40 and Asp85 residues only interact with SAM and are not included in the probe Gly-only RINRUS models (Table 2). As charged residues, they have relatively large F-SAPT interaction energies. The three charged residues are the first fragments that are added to the F-SAPT-based RINRUS models independent of including the SAM cofactor in the seed. Interestingly, the Gly-only seed has its interaction energy ranked in the order Arg175 > Arg40 > Asp 85, while the Gly+SAM seed ranks Arg175 > Asp85 > Arg40 (Table 3). The magnitude of interaction energies of the third-ranked fragment (Asp85; 24.7 kcal/mol in the Gly-only seed and Arg40; −25.8 kcal/mol in the Gly+SAM seed) are comparable to the magnitude of the various uncharged polar residues in the active site such as Asn138 and Ser139. Arg40 positions close to the carboxyl group of methionine on SAM and Asp85 hydrogen bonds to the two hydroxyl groups of the SAM adenosyl group. Neither residues are the closest ones to the methyl transfer reaction center compared to other residues of the active site RIN.
Based on the Gly interaction energies with active site fragments, 20 models, labeled Res3-fsapt1 to Res23-fsapt1, were investigated (Table 3 and Figure 6). Note that Res18-fsapt1 and Res19-fsapt1 models are equivalent because the Asn116 main chain ranked 19th is already added to cap the Ala115 main chain in Res18-fsapt1. Immense changes in the kinetic and thermodynamic values manifest in the 3 smallest-sized models, which is expected. ΔΔG‡ and ΔΔGrxn values are diminished after adding more residues to the model where Gly and the adenosyl group of SAM are stabilized by polar uncharged residues and residues with hydrophobic sidechains (Figure 6). However, unsigned ΔΔGrxn values are greater than 4 kcal/mol when adding Asn138 in Res9-fsapt1, His142 in Res11-fsapt1, Tyr21 in Res14-fsapt1, Tyr242 in Res17-fsapt1, Ala115 in Res18-fsapt1, and Ser87 in Res22-fsapt1. Among the larger models, only Res17-fsapt1 (Tyr242) has a large ΔΔG‡ value of −6.0 kcal/mol. All other models have an unsigned ΔΔG‡ less than 3.0 kcal/mol. In the probe-models, Tyr21 is first included in the smallest model (Res5, ranked 5th), while Tyr242 and His142 are ranked 12th and 16th. The ΔΔG‡ and ΔΔGrxn values of adding Tyr242 (+0.2 and −1.8 kcal/mol) and His142 (−0.8 and −0.3 kcal/mol) in the probe-models are much smaller in magnitude than those of the F-SAPT models. Starting from Res18-fsapt1 where Ala115 is included, the adenosyl group of SAM shifts compared to smaller-sized models but aligns well with larger-sized models. ΔΔG‡ and ΔΔGrxn values of Res23-fsapt1(384 atoms) are less than 0.1 kcal/mol, and ΔG‡ and ΔGrxn values of both models are less than 1.5 kcal/mol compared to those of the maximal probe SAM+Gly model Res27 (model we used to calculate F-SAPT interaction energies), which indicates that they are converged.
Figure 6:

Free energy diagram of the 21 different sized models built based on residue ranking using F-SAPT interaction energy with seed Gly only. Figure on top, middle and bottom show the free energies of activation for N-demethylation, reaction free energies, and charges for each model, respectively. The dashed line in magenta represents the experimental value converted free energy of activation of 17.5 kcal/mol. The red dotted lines show the tight energy convergence range (within ±1 kcal/mol of the ΔG‡ and ΔGrxn of the maximal model Res27), the green dotted lines show the loose energy convergence range (within ±3 kcal/mol of the ΔG‡ and ΔGrxn of the maximal model Res27).
When using SAM+Gly as the seed, significant changes are seen again when adding fragments to the smallest models. Unsigned changes in ΔGrxn greater than 3.0 kcal/mol were observed when adding Asn138 in Res9-fsapt2, Trp30 in Res12-fsapt2, Tyr21 in Res17-fsapt2, Tyr242 in Res22-fsapt2, and Ser87 in Res24-fsapt2. ΔΔG‡ values of Res9-fsapt2 (Asn138), Res11-fsapt2 (His142), Res12-fsapt2 (Trp30), and Res22-fsapt2 (Tyr242) are −3.0, +4.4, −5.7, and +2.9 kcal/mol, respectively (Figure 7). With the F-SAPT fragment ranking scheme, starting from Res24-fsapt2 (363 atoms), the changes in ΔG‡ and ΔGrxn of the largest three models are minuscule (ΔG‡ ranges from 9.4 to 10.1 kcal/mol and ΔGrxn range from −27.8 to −27.2 kcal/mol, respectively). The absolute values of ΔΔG‡ and ΔΔGrxn are less than 1 kcal/mol compared to Res26-fsapt2 and less than 3 kcal/mol compared to Res27, indicating that these three models are converged.
Figure 7:

Free energy diagram of the 24 different sized models built based on residue ranking using F-SAPT interaction energy with seed Gly plus SAM. Figure on top, middle and bottom show the free energies of activation for N-demethylation, reaction free energies, and charges for each model, respectively. The dashed line in magenta represents the experimental value converted free energy of activation of 17.5 kcal/mol. The red dotted lines show the tight energy convergence range (within ±1 kcal/mol of the ΔG‡ and ΔGrxn of the maximal model Res27), the green dotted lines show the loose energy convergence range (within ±3 kcal/mol of the ΔG‡ and ΔGrxn of the maximal model Res27).
There are 6 residue fragments that have an absolute interaction energy less than 0.5 kcal/mol with Gly-only seed. Among the 6, Leu136 and Val69 are ranked in the bottom 4, while Ile34, Asn116, Ala86, Ser139, are ranked 20th, 6th, 8th, and 7th according to probe interaction counts. All these residues have small effects on the energetics, except Ser139 as we see that when Ser139 included in Res7 in the probe SAM+Gly seed models, ΔΔG‡ = −6.4 kcal/mol. However, based on the F-SAPT interaction energies with SAM+Gly, Ser139 is ranked 10th and its effects on energetics are small (unsigned ΔΔG values are less than 3 kcal/mol), which indicates that when Ser139 is added to an already large model, its effect on free energies may be smaller. In the residue ranking of F-SAPT interaction energy with Gly+SAM, only Val69, Asn116, and Ile34 residue fragments have lower interaction energies than 0.5 kcal/mol. Hence, energy convergence is assumed to be achieved in both Gly-only and SAM+Gly F-SAPT based models with model size of about 360 atoms.
Larger basis set and density functional effects
The average ΔG‡ value of our converged probe-based SAM+Gly RINRUS models and F-SAPT models (Res23 to Res27, Res22-fsapt1 and Res23-fsapt1, and Res24-fsapt2 to Res26-fsapt2) is 9.5 kcal/mol, while the maximal QM-cluster model from probe-based interaction counts using Gly as the only fragment in the seed was an outlier and was discarded. The mean ΔG‡ value of our largest/converged models is in poor agreement with experimental measured kinetic data for the methyl transfer reaction in GNMT. However, the main purpose of this investigation is to minimize or eliminate QM-cluster model size and composition as a source of error. To test accuracy of GNMT QM-cluster models, a brief set of tests was performed by first employing a larger basis set (6–31+G**) on a set of small RINRUS-constructed models (Res8 - Res16) (Figure S5 and Table S4). Notable changes in model ΔG‡ values are observed (ΔΔG‡ ranges from −0.3 to +2.7 kcal/mol). However, computational cost increases immensely (1009 versus 1924 basis functions for Res8 and 1798 versus 3467 basis functions for Res16). Besides testing an increased basis set size, two other density functionals, PBE1PBE67,68 with GD3BJ and M06–2X69 without GD3BJ were also tested using the probe-based Res27 model (Figure S5) and the default 6–31G(d’)/6–31G basis set combination. The ΔG‡ values also change notably (ΔΔG‡ =+3.1 and +1.5 kcal/mol, respectively). Considering the massive computational cost and weaker dependence on DFT kinetics and thermodynamics, it is difficult to recommend adopting larger basis sets while testing fragment ranking/selection schemes in computational enzymology. However, determining an appropriate and short list of density functionals for QM-cluster modeling of enzymes is currently under investigation in our labs and others.1,2,70–73
Conclusions
The methyl transfer reaction between SAM and Gly catalyzed by GNMT was examined using QM-cluster models generated by RINRUS. Several residue fragments ranking schemes have been explored, including probe interaction counts and F-SAPT interaction energies between residue fragments with Gly only or SAM+Gly. The maximal model Res27 in which all the residue fragments that interact with SAM+Gly are included provides a ΔG‡ and ΔGrxn of 9.1 and −29.7 kcal/mol. The ΔG‡ and ΔGrxn values of Res23 to Res26 differ from that of Res27 by less than 3 kcal/mol. Hence, convergence in energies starts from the model with 377 atoms (Res23) using the probe-based contact count ranking. Small Gly-only probe-based models are unreliable for calculating the reaction energetics because the residue fragments that interact with SAM are missing from those models and the free energies of the models are not converged. F-SAPT ranks charged residues much higher, but to achieve energy convergence, QM-cluster models with more than 360 atoms are still required, whether Gly or Gly+SAM are used as the seed fragments. Although F-SAPT-based QM-cluster models seem to converge kinetic and thermodynamic values with slightly smaller models, an F-SAPT ranking scheme requires expensive front-end calculations. Hence, significantly more calibration of enzyme case studies, as well as an exploration of additional residue ranking schemes is essential.
Our larger QM-cluster models show a ΔG‡ value much lower than experiment, but we consciously use a somewhat outmoded level of theory to focus on kinetic and thermodynamic convergence with respect to model size. However, studies in our group have shown systematic underprediction of activation energies using the B3LYP-GD3BJ/6–31G(d’) level of theory. We have observed increases in ΔG‡ values (up to +2.7 kcal/mol) of several small models using larger basis set 6–31+G** and increases in ΔG‡ values (up to +3.1 kcal/mol) of the maximal model with newer generation functionals. Another source of error in our computations may arise from using only QM-cluster models based on the X-ray crystal structure instead of sampling conformations and non-equilibrium structures from Molecular Dynamics simulations.
Interestingly, the convergence of kinetic and thermodynamic values with respect to QM-cluster model size behaves much differently for the GNMT case study than COMT. While there is growing precedent that the largest RINRUS-constructed model (dubbed the “maximal” model) will reliably emulate the active site environment, even removing one or two fragments from the maximal GNMT QM-cluster models can qualitatively affect activation free energies and/or reaction energies. For very different reasons than COMT, the GNMT case study provides a challenge for benchmarking computational enzymology. We propose that the primary factor is the disparate molecular size of the small glycine substrate and the large SAM cofactor. Residues that interact with the Gly substrate were the focus of the first QM-cluster model study by Velichkova and Himo, but in their models, the SAM cofactor was trimmed to a small fragment. When incorporating the complete SAM fragment, our RINRUS-constructed QM-cluster models based on a probe-ranking scheme and using Gly as the seed fragment gave inconsistent results compared to our other RINRUS model-building schemes. Problems with the Gly-only seed models indicate both the methionine and adenosyl moiety of the SAM cofactor contribute a great deal to the kinetics and thermodynamics of the GNMT catalysis. Overall, small QM-cluster models cannot provide reliable kinetic or thermodynamic results, further indicating that a systematic approach to approximating the chemical environment of the active site is important for building QM-cluster models of enzymes.
While activation energies of the largest RINRUS-built QM-cluster models of GNMT are qualitatively lower than experimental results, the level of theory can be greatly improved when seeking a more effective approach for studying computational enzymology with QM-cluster and QM/MM methods. Currently, several studies are being carried out in our labs to calibrate an appropriate electronic structure theory for atomic-level enzyme models.
Supplementary Material
Figure S1: The optimized TS structures of all Himo-based models computed in this study.
Figure S2: The changes in free energies of activation and rection for each model when a new residue/fragment added and forming a larger model.
Figure S3: Free energy diagram of the original probe-based RINRUS Res5 to Res12 models and those with Arg175 added.
Figure S4: The optimized reactants (R), transition states (TS), and products (P) of Res12 and Res12 plus Arg175 models aligned.
Figure S5: Free energy diagram of the RINRUS Res8 to Res16 models computed with larger basis set and Res27 model computed with different functionals.
Table S1. Free energies of activation and reaction (in kcal/mol) for various sized Himo-based models built in this study.
Table S2. Residue fragment and seed (Gly plus SAM) interaction map/fingerprint.
Table S3. Gibbs free energies of activation and reaction of Arg175 added Res5 to Res12 models (in kcal/mol).
Table S4. Free energies of activation and reaction for RINRUS models from Res8 to Res16 run with larger basis set 6–31+G** and Res27 at PBE1PBE with GD3BJ and M06–2X without GD3BJ.
Table S5. Thermochemical data of all Himo-based models reported reactants, transition states, and products of the methyl transfer reaction catalyzed by Glycine N-Methyltransferase (GNMT). (absolute energies in Hartrees, relative energies in kcal mol−1).
Table S6. Thermochemical data of all probe SAM+Gly seed RINRUS models reported reactants, transition states, and products of the methyl transfer reaction catalyzed by Glycine N-Methyltransferase (GNMT). (absolute energies in Hartrees, relative energies in kcal mol−1).
Table S7. Thermochemical data of all Arg175 added probe SAM+Gly seed RINRUS models (Res5 to Res12 models) reported reactants, transition states, and products of the methyl transfer reaction catalyzed by Glycine N-Methyltransferase (GNMT). (absolute energies in Hartrees, relative energies in kcal mol−1).
Table S8. Thermochemical data of all probe Gly seed RINRUS models reported reactants, transition states, and products of the methyl transfer reaction catalyzed by Glycine N-Methyltransferase (GNMT). (absolute energies in Hartrees, relative energies in kcal mol−1).
Table S9. Thermochemical data of all Gly seed F-SAPT models reported reactants, transition states, and products of the methyl transfer reaction catalyzed by Glycine N-Methyltransferase (GNMT). (absolute energies in Hartrees, relative energies in kcal mol−1).
Table S10. Thermochemical data of all SAM+Gly seed F-SAPT models reported reactants, transition states, and products of the methyl transfer reaction catalyzed by Glycine N-Methyltransferase (GNMT). (absolute energies in Hartrees, relative energies in kcal mol−1).
Table S11. Thermochemical data of all large basis set models and newer functionals Res27 model reported reactants, transition states, and products of the methyl transfer reaction catalyzed by Glycine N-Methyltransferase (GNMT). (absolute energies in Hartrees, relative energies in kcal mol−1).
Acknowledgements
This work was supported by the National Science Foundation (CAREER) BIO-1846408 (for NJD), DOE BES SBIR DE-SC0021568 (for NJD), and National Institute of General Medical Sciences of the National Institute of Health under award number 1R35GM145206-01 (for QC). The High-Performance Computing Center and the Computational Research on Materials Institute at The University of Memphis (CROMIUM) also provided generous resources for this research. We thank Dr. Taylor Santaloci for proofreading the manuscript.
References
- (1).Sirirak J; Lawan N; Van der Kamp MW; Harvey JN; Mulholland AJ Benchmarking Quantum Mechanical Methods for Calculating Reaction Energies of Reactions Catalyzed by Enzymes. PeerJ Phys. Chem. 2020, 2, e8. 10.7717/peerj-pchem.8. [DOI] [Google Scholar]
- (2).Wappett DA; Goerigk L Toward a Quantum-Chemical Benchmark Set for Enzymatically Catalyzed Reactions: Important Steps and Insights. J. Phys. Chem. A 2019, 123 (32), 7057–7074. 10.1021/acs.jpca.9b05088. [DOI] [PubMed] [Google Scholar]
- (3).Cheng Q; DeYonker NJ; Summers TJ; Agbaglo DA; Suhagia T; Manuel PA GitHub - Natedey/RINRUS: Residue Interaction Network ResidUe Selector (RINRUS) Public Release. Https://Github.Com/Natedey/RINRUS (Accessed 2022-09-14). 2022. [Google Scholar]
- (4).Amitai G; Shemesh A; Sitbon E; Shklar M; Netanely D; Venger I; Pietrokovski S Network Analysis of Protein Structures Identifies Functional Residues. J. Mol. Biol. 2004, 344 (4), 1135–1146. 10.1016/j.jmb.2004.10.055. [DOI] [PubMed] [Google Scholar]
- (5).Doncheva NT; Klein K; Domingues FS; Albrecht M Analyzing and Visualizing Residue Networks of Protein Structures. Trends Biochem. Sci. 2011, 36 (4), 179–182. 10.1016/j.tibs.2011.01.002. [DOI] [PubMed] [Google Scholar]
- (6).Piovesan D; Minervini G; Tosatto SCE The RING 2.0 Web Server for High Quality Residue Interaction Networks. Nucleic Acids Res. 2016, 44 (W1), W367–W374. 10.1093/nar/gkw315. [DOI] [PMC free article] [PubMed] [Google Scholar]
- (7).Parrish RM; Sherrill CD Spatial Assignment of Symmetry Adapted Perturbation Theory Interaction Energy Components: The Atomic SAPT Partition. J. Chem. Phys. 2014, 141 (4), 044115. 10.1063/1.4889855. [DOI] [PubMed] [Google Scholar]
- (8).Parrish RM; Parker TM; Sherrill CD Chemical Assignment of Symmetry-Adapted Perturbation Theory Interaction Energy Components: The Functional-Group SAPT Partition. J. Chem. Theory Comput. 2014, 10 (10), 4417–4431. 10.1021/ct500724p. [DOI] [PubMed] [Google Scholar]
- (9).Parrish RM; Gonthier JF; Corminbœuf C; Sherrill CD Communication: Practical Intramolecular Symmetry Adapted Perturbation Theory via Hartree-Fock Embedding. J. Chem. Phys. 2015, 143 (5), 051103. 10.1063/1.4927575. [DOI] [PubMed] [Google Scholar]
- (10).Summers TJ; Hemmati R; Miller JE; Agbaglo DA; Cheng Q; DeYonker NJ Evaluating the Active Site-Substrate Interplay between x-Ray Crystal Structure and Molecular Dynamics in Chorismate Mutase. J. Chem. Phys. 2023, 158 (6), 065101. 10.1063/5.0127106. [DOI] [PubMed] [Google Scholar]
- (11).Parker TM; Burns LA; Parrish RM; Ryno AG; Sherrill CD Levels of Symmetry Adapted Perturbation Theory (SAPT). I. Efficiency and Performance for Interaction Energies. J. Chem. Phys. 2014, 140 (9), 094106. 10.1063/1.4867135. [DOI] [PubMed] [Google Scholar]
- (12).Yeo E-J; Briggs WT; Wagner C Inhibition of Glycine N-Methyltransferase by 5-Methyltetrahydrofolate Pentaglutamate. J. Biol. Chem. 1999, 274 (53), 37559–37564. 10.1074/jbc.274.53.37559. [DOI] [PubMed] [Google Scholar]
- (13).Yen C-H; Lin Y-T; Chen H-L; Chen S-Y; Chen Y-MA The Multi-Functional Roles of GNMT in Toxicology and Cancer. Toxicol. Appl. Pharmacol. 2013, 266 (1), 67–75. 10.1016/j.taap.2012.11.003. [DOI] [PubMed] [Google Scholar]
- (14).Wagner C; Briggs WT; Cook RJ Inhibition of Glycine N-Methyltransferase Activity by Folate Derivatives: Implications for Regulation of Methyl Group Metabolism. Biochem. Biophys. Res. Commun. 1985, 127 (3), 746–752. 10.1016/S0006-291X(85)80006-1. [DOI] [PubMed] [Google Scholar]
- (15).Luka Z; Mudd SH; Wagner C Glycine N -Methyltransferase and Regulation of S -Adenosylmethionine Levels. J. Biol. Chem. 2009, 284 (34), 22507–22511. 10.1074/jbc.R109.019273. [DOI] [PMC free article] [PubMed] [Google Scholar]
- (16).Rutherford K; Le Trong I; Stenkamp RE; Parson WW Crystal Structures of Human 108V and 108M Catechol O-Methyltransferase. J. Mol. Biol. 2008, 380 (1), 120–130. 10.1016/j.jmb.2008.04.040. [DOI] [PubMed] [Google Scholar]
- (17).Kulik HJ Large-Scale QM/MM Free Energy Simulations of Enzyme Catalysis Reveal the Influence of Charge Transfer. Phys. Chem. Chem. Phys. 2018, 20 (31), 20650–20660. 10.1039/C8CP03871F. [DOI] [PMC free article] [PubMed] [Google Scholar]
- (18).Kulik HJ; Zhang J; Klinman JP; Martinez TJ How Large Should the QM Region Be in QM/MM Calculations? The Case of Catechol O-Methyltransferase. J. Phys. Chem. B 2015, 120 (44), 11381–11394. 10.1021/acs.jpcb.6b07814. [DOI] [PMC free article] [PubMed] [Google Scholar]
- (19).Summers TJ; Cheng Q; Palma MA; Pham D-T; Kelso DK; Webster CE; DeYonker NJ Cheminformatic Quantum Mechanical Enzyme Model Design: A Catechol-O-Methyltransferase Case Study. Biophys. J. 2021, 120 (17), 3577–3587. 10.1016/j.bpj.2021.07.029. [DOI] [PMC free article] [PubMed] [Google Scholar]
- (20).Kuhn B; Kollman PA QM−FE and Molecular Dynamics Calculations on Catechol O -Methyltransferase: Free Energy of Activation in the Enzyme and in Aqueous Solution and Regioselectivity of the Enzyme-Catalyzed Reaction. J. Am. Chem. Soc. 2000, 122 (11), 2586–2596. 10.1021/ja992218v. [DOI] [Google Scholar]
- (21).Ruggiero GD; Williams IH; Roca M; Moliner V; Tuñón I QM/MM Determination of Kinetic Isotope Effects for COMT-Catalyzed Methyl Transfer Does Not Support Compression Hypothesis. J. Am. Chem. Soc. 2004, 126 (28), 8634–8635. 10.1021/ja048055e. [DOI] [PubMed] [Google Scholar]
- (22).Lameira J; Bora RP; Chu ZT; Warshel A Methyltransferases Do Not Work by Compression, Cratic, or Desolvation Effects, but by Electrostatic Preorganization. Proteins Struct. Funct. Bioinforma. 2015, 83 (2), 318–330. 10.1002/prot.24717. [DOI] [PMC free article] [PubMed] [Google Scholar]
- (23).Rod TH; Ryde U Quantum Mechanical Free Energy Barrier for an Enzymatic Reaction. Phys. Rev. Lett. 2005, 94 (13), 138302. 10.1103/PhysRevLett.94.138302. [DOI] [PubMed] [Google Scholar]
- (24).Rod TH; Ryde U Accurate QM/MM Free Energy Calculations of Enzyme Reactions: Methylation by Catechol O -Methyltransferase. J. Chem. Theory Comput. 2005, 1 (6), 1240–1251. 10.1021/ct0501102. [DOI] [PubMed] [Google Scholar]
- (25).Heady JE; Kerr SJ Purification and Characterization of Glycine N-Methyltransferase. J. Biol. Chem. 1973, 248 (1), 69–72. 10.1016/S0021-9258(19)44446-3. [DOI] [PubMed] [Google Scholar]
- (26).Ogawa H; Fujioka M Induction of Rat Liver Glycine Methyltransferase by High Methionine Diet. Biochem. Biophys. Res. Commun. 1982, 108 (1), 227–232. 10.1016/0006-291X(82)91855-1. [DOI] [PubMed] [Google Scholar]
- (27).Cook RJ; Horne DW; Wagner C Effect of Dietary Methyl Group Deficiency on One-Carbon Metabolism in Rats. J. Nutr. 1989, 119 (4), 612–617. 10.1093/jn/119.4.612. [DOI] [PubMed] [Google Scholar]
- (28).Balaghi M; Horne DW; Wagner C Hepatic One-Carbon Metabolism in Early Folate Deficiency in Rats. Biochem. J. 1993, 291 (1), 145–149. 10.1042/bj2910145. [DOI] [PMC free article] [PubMed] [Google Scholar]
- (29).Zhang J; Klinman JP Convergent Mechanistic Features between the Structurally Diverse N - and O -Methyltransferases: Glycine N -Methyltransferase and Catechol O -Methyltransferase. J. Am. Chem. Soc. 2016, 138 (29), 9158–9165. 10.1021/jacs.6b03462. [DOI] [PMC free article] [PubMed] [Google Scholar]
- (30).Huang Y; Komoto J; Konishi K; Takata Y; Ogawa H; Gomi T; Fujioka M; Takusagawa F Mechanisms for Auto-Inhibition and Forced Product Release in Glycine N-Methyltransferase: Crystal Structures of Wild-Type, Mutant R175K and S-Adenosylhomocysteine-Bound R175K Enzymes. J. Mol. Biol. 2000, 298 (1), 149–162. 10.1006/jmbi.2000.3637. [DOI] [PubMed] [Google Scholar]
- (31).Konishi K; Fujioka M Chemical Modification of a Functional Arginine Residue of Rat Liver Glycine Methyltransferase. Biochemistry 1987, 26 (25), 8496–8502. 10.1021/bi00399a069. [DOI] [PubMed] [Google Scholar]
- (32).Ogawa H; Gomi T; Fujioka M Mammalian Glycine N-Methyltransferases. Comparative Kinetic and Structural Properties of the Enzymes from Human, Rat, Rabbit and Pig Livers. Comp. Biochem. Physiol. Part B Comp. Biochem. 1993, 106 (3), 601–611. 10.1016/0305-0491(93)90137-T. [DOI] [PubMed] [Google Scholar]
- (33).Takata Y; Huang Y; Komoto J; Yamada T; Konishi K; Ogawa H; Gomi T; Fujioka M; Takusagawa F Catalytic Mechanism of Glycine N- Methyltransferase. Biochemistry 2003, 42 (28), 8394–8402. 10.1021/bi034245a. [DOI] [PubMed] [Google Scholar]
- (34).Fu Z; Hu Y; Konishi K; Takata Y; Ogawa H; Gomi T; Fujioka M; Takusagawa F Crystal Structure of Glycine N -Methyltransferase from Rat Liver †, ‡. Biochemistry 1996, 35 (37), 11985–11993. 10.1021/bi961068n. [DOI] [PubMed] [Google Scholar]
- (35).Velichkova P; Himo F Methyl Transfer in Glycine N -Methyltransferase. A Theoretical Study. J. Phys. Chem. B 2005, 109 (16), 8216–8219. 10.1021/jp0443254. [DOI] [PubMed] [Google Scholar]
- (36).Lee C; Yang W; Parr RG Development of the Colle-Salvetti Correlation-Energy Formula into a Functional of the Electron Density. Phys. Rev. B 1988, 37 (2), 785–789. 10.1103/PhysRevB.37.785. [DOI] [PubMed] [Google Scholar]
- (37).Becke AD Density-Functional Exchange-Energy Approximation with Correct Asymptotic Behavior. Phys. Rev. A 1988, 38 (6), 3098–3100. 10.1103/PhysRevA.38.3098. [DOI] [PubMed] [Google Scholar]
- (38).Becke AD Density-functional Thermochemistry. I. The Effect of the Exchange-only Gradient Correction. J. Chem. Phys. 1992, 96 (3), 2155–2160. 10.1063/1.462066. [DOI] [Google Scholar]
- (39).Becke AD Density-functional Thermochemistry. II. The Effect of the Perdew–Wang Generalized-gradient Correlation Correction. J. Chem. Phys. 1992, 97 (12), 9173–9177. 10.1063/1.463343. [DOI] [Google Scholar]
- (40).Becke AD Density-functional Thermochemistry. III. The Role of Exact Exchange. J. Chem. Phys. 1993, 98 (7), 5648–5652. 10.1063/1.464913. [DOI] [Google Scholar]
- (41).Cammi R; Mennucci B; Tomasi J Second-Order Møller−Plesset Analytical Derivatives for the Polarizable Continuum Model Using the Relaxed Density Approach. J. Phys. Chem. A 1999, 103 (45), 9100–9108. 10.1021/jp991564w. [DOI] [Google Scholar]
- (42).Cammi R; Mennucci B; Tomasi J Fast Evaluation of Geometries and Properties of Excited Molecules in Solution: A Tamm-Dancoff Model with Application to 4-Dimethylaminobenzonitrile. J. Phys. Chem. A 2000, 104 (23), 5631–5637. 10.1021/jp000156l. [DOI] [Google Scholar]
- (43).Cossi M; Rega N; Scalmani G; Barone V Polarizable Dielectric Model of Solvation with Inclusion of Charge Penetration Effects. J. Chem. Phys. 2001, 114 (13), 5691–5701. 10.1063/1.1354187. [DOI] [Google Scholar]
- (44).Cossi M; Scalmani G; Rega N; Barone V New Developments in the Polarizable Continuum Model for Quantum Mechanical and Classical Calculations on Molecules in Solution. J. Chem. Phys. 2002, 117 (1), 43–54. 10.1063/1.1480445. [DOI] [Google Scholar]
- (45).Hwang JK; King G; Creighton S; Warshel A Simulation of Free Energy Relationships and Dynamics of SN2 Reactions in Aqueous Solution. J. Am. Chem. Soc. 1988, 110 (16), 5297–5311. 10.1021/ja00224a011. [DOI] [Google Scholar]
- (46).Świderek K; Tuñón I; Williams IH; Moliner V Insights on the Origin of Catalysis on Glycine N -Methyltransferase from Computational Modeling. J. Am. Chem. Soc. 2018, 140 (12), 4327–4334. 10.1021/jacs.7b13655. [DOI] [PMC free article] [PubMed] [Google Scholar]
- (47).Word JM; Lovell SC; Richardson JS; Richardson DC Asparagine and Glutamine: Using Hydrogen Atom Contacts in the Choice of Side-Chain Amide Orientation 1 1Edited by J. Thornton. J. Mol. Biol. 1999, 285 (4), 1735–1747. 10.1006/jmbi.1998.2401. [DOI] [PubMed] [Google Scholar]
- (48).Word JM; Lovell SC; LaBean TH; Taylor HC; Zalis ME; Presley BK; Richardson JS; Richardson DC Visualizing and Quantifying Molecular Goodness-of-Fit: Small-Probe Contact Dots with Explicit Hydrogen Atoms 1 1Edited by J. Thornton. J. Mol. Biol. 1999, 285 (4), 1711–1733. 10.1006/jmbi.1998.2400. [DOI] [PubMed] [Google Scholar]
- (49).Smith DGA; Burns LA; Simmonett AC; Parrish RM; Schieber MC; Galvelis R; Kraus P; Kruse H; Di Remigio R; Alenaizan A; et al. P si4</Scp> 1.4: Open-Source Software for High-Throughput Quantum Chemistry. J. Chem. Phys. 2020, 152 (18), 184108. 10.1063/5.0006002. [DOI] [PMC free article] [PubMed] [Google Scholar]
- (50).Frisch MJ; Trucks GW; Schlegel HB; Scuseria GE; Robb MA; Cheeseman JR; Scalmani G; Barone V; Petersson GA; Nakatsuji H; et al. Gaussian 16 Revision B.01. 2016.
- (51).Hariharan PC; Pople JA The Influence of Polarization Functions on Molecular Orbital Hydrogenation Energies. Theor. Chim. Acta 1973, 28 (3), 213–222. 10.1007/BF00533485. [DOI] [Google Scholar]
- (52).Petersson GA; Al-Laham MA A Complete Basis Set Model Chemistry. II. Open-Shell Systems and the Total Energies of the First-Row Atoms. J. Chem. Phys. 1991, 94 (9), 6081–6090. 10.1063/1.460447. [DOI] [Google Scholar]
- (53).Foresman JB; Frisch Æ Exploring Chemistry with Electronic Structure Methods (2nd Ed.). Pittsburgh, PA: Gaussian Inc. 1996, pp 266, 278–283. [Google Scholar]
- (54).Hehre WJ; Ditchfield R; Pople JA Self—Consistent Molecular Orbital Methods. XII. Further Extensions of Gaussian—Type Basis Sets for Use in Molecular Orbital Studies of Organic Molecules. J. Chem. Phys. 1972, 56 (5), 2257–2261. 10.1063/1.1677527. [DOI] [Google Scholar]
- (55).Grimme S; Ehrlich S; Goerigk L Effect of the Damping Function in Dispersion Corrected Density Functional Theory. J. Comput. Chem. 2011, 32 (7), 1456–1465. 10.1002/jcc.21759. [DOI] [PubMed] [Google Scholar]
- (56).Grimme S; Antony J; Ehrlich S; Krieg H A Consistent and Accurate Ab Initio Parametrization of Density Functional Dispersion Correction (DFT-D) for the 94 Elements H-Pu. J. Chem. Phys. 2010, 132 (15), 154104. 10.1063/1.3382344. [DOI] [PubMed] [Google Scholar]
- (57).Barone V; Cossi M Quantum Calculation of Molecular Energies and Energy Gradients in Solution by a Conductor Solvent Model. J. Phys. Chem. A 1998, 102 (11), 1995–2001. 10.1021/jp9716997. [DOI] [Google Scholar]
- (58).Cossi M; Rega N; Scalmani G; Barone V Energies, Structures, and Electronic Properties of Molecules in Solution with the C-PCM Solvation Model. J. Comput. Chem. 2003, 24 (6), 669–681. 10.1002/jcc.10189. [DOI] [PubMed] [Google Scholar]
- (59).Siegbahn PEM; Blomberg MRA Transition-Metal Systems in Biochemistry Studied by High-Accuracy Quantum Chemical Methods. Chem. Rev. 2000, 100 (2), 421–438. 10.1021/cr980390w. [DOI] [PubMed] [Google Scholar]
- (60).Blomberg MRA; Borowski T; Himo F; Liao R-Z; Siegbahn PEM Quantum Chemical Studies of Mechanisms for Metalloenzymes. Chem. Rev. 2014, 114 (7), 3601–3658. 10.1021/cr400388t. [DOI] [PubMed] [Google Scholar]
- (61).DeYonker NJ; Webster CE Phosphoryl Transfers of the Phospholipase D Superfamily: A Quantum Mechanical Theoretical Study. J. Am. Chem. Soc. 2013, 135 (37), 13764–13774. 10.1021/ja4042753. [DOI] [PubMed] [Google Scholar]
- (62).Summers TJ; Cheng Q; DeYonker NJ A Transition State “Trapped”? QM-Cluster Models of Engineered Threonyl-TRNA Synthetase. Org. Biomol. Chem. 2018, 16 (22), 4090–4100. 10.1039/C8OB00540K. [DOI] [PubMed] [Google Scholar]
- (63).DeYonker NJ; Webster CE A Theoretical Study of Phosphoryl Transfers of Tyrosyl-DNA Phosphodiesterase I (Tdp1) and the Possibility of a “Dead-End” Phosphohistidine Intermediate. Biochemistry 2015, 54 (27), 4236–4247. 10.1021/acs.biochem.5b00396. [DOI] [PubMed] [Google Scholar]
- (64).Cheng Q; DeYonker NJ Acylation and Deacylation Mechanism and Kinetics of Penicillin G Reaction with Streptomyces R61 DD -peptidase. J. Comput. Chem. 2020, 41 (18), 1685–1697. 10.1002/jcc.26210. [DOI] [PubMed] [Google Scholar]
- (65).Fukui K Formulation of the Reaction Coordinate. J. Phys. Chem. 1970, 74 (23), 4161–4163. 10.1021/j100717a029. [DOI] [Google Scholar]
- (66).Fukui K The Path of Chemical Reactions - the IRC Approach. Acc. Chem. Res. 1981, 14 (12), 363–368. 10.1021/ar00072a001. [DOI] [Google Scholar]
- (67).Adamo C; Barone V Toward Reliable Density Functional Methods without Adjustable Parameters: The PBE0 Model. J. Chem. Phys. 1999, 110 (13), 6158–6170. 10.1063/1.478522. [DOI] [Google Scholar]
- (68).Ernzerhof M; Scuseria GE Assessment of the Perdew–Burke–Ernzerhof Exchange-Correlation Functional. J. Chem. Phys. 1999, 110 (11), 5029–5036. 10.1063/1.478401. [DOI] [PubMed] [Google Scholar]
- (69).Zhao Y; Truhlar DG The M06 Suite of Density Functionals for Main Group Thermochemistry, Thermochemical Kinetics, Noncovalent Interactions, Excited States, and Transition Elements: Two New Functionals and Systematic Testing of Four M06-Class Functionals and 12 Other Function. Theor. Chem. Acc. 2008, 120 (1–3), 215–241. 10.1007/s00214-007-0310-x. [DOI] [Google Scholar]
- (70).Wappett DA; Goerigk L A Guide to Benchmarking Enzymatically Catalysed Reactions: The Importance of Accurate Reference Energies and the Chemical Environment. Theor. Chem. Acc. 2021, 140 (6), 68. 10.1007/s00214-021-02770-9. [DOI] [Google Scholar]
- (71).Ahmadi S; Barrios Herrera L; Chehelamirani M; Hostaš J; Jalife S; Salahub DR Multiscale Modeling of Enzymes: QM-Cluster, QM/MM, and QM/MM/MD: A Tutorial Review. Int. J. Quantum Chem. 2018, 118 (9), e25558. 10.1002/qua.25558. [DOI] [Google Scholar]
- (72).Wappett DA; Goerigk L Benchmarking Density Functional Theory Methods for Metalloenzyme Reactions : The Introduction of the MME55 Set. 10.26434/chemrxiv-2023-w341f. [DOI] [PMC free article] [PubMed]
- (73).Glanowski M; Kachhap S; Borowski T; Szaleniec M Model Setup and Procedures for Prediction of Enzyme Reaction Kinetics with QM-Only and QM:MM Approaches; 2022; pp 175–236. 10.1007/978-1-0716-1767-0_10. [DOI] [PubMed] [Google Scholar]
Associated Data
This section collects any data citations, data availability statements, or supplementary materials included in this article.
Supplementary Materials
Figure S1: The optimized TS structures of all Himo-based models computed in this study.
Figure S2: The changes in free energies of activation and rection for each model when a new residue/fragment added and forming a larger model.
Figure S3: Free energy diagram of the original probe-based RINRUS Res5 to Res12 models and those with Arg175 added.
Figure S4: The optimized reactants (R), transition states (TS), and products (P) of Res12 and Res12 plus Arg175 models aligned.
Figure S5: Free energy diagram of the RINRUS Res8 to Res16 models computed with larger basis set and Res27 model computed with different functionals.
Table S1. Free energies of activation and reaction (in kcal/mol) for various sized Himo-based models built in this study.
Table S2. Residue fragment and seed (Gly plus SAM) interaction map/fingerprint.
Table S3. Gibbs free energies of activation and reaction of Arg175 added Res5 to Res12 models (in kcal/mol).
Table S4. Free energies of activation and reaction for RINRUS models from Res8 to Res16 run with larger basis set 6–31+G** and Res27 at PBE1PBE with GD3BJ and M06–2X without GD3BJ.
Table S5. Thermochemical data of all Himo-based models reported reactants, transition states, and products of the methyl transfer reaction catalyzed by Glycine N-Methyltransferase (GNMT). (absolute energies in Hartrees, relative energies in kcal mol−1).
Table S6. Thermochemical data of all probe SAM+Gly seed RINRUS models reported reactants, transition states, and products of the methyl transfer reaction catalyzed by Glycine N-Methyltransferase (GNMT). (absolute energies in Hartrees, relative energies in kcal mol−1).
Table S7. Thermochemical data of all Arg175 added probe SAM+Gly seed RINRUS models (Res5 to Res12 models) reported reactants, transition states, and products of the methyl transfer reaction catalyzed by Glycine N-Methyltransferase (GNMT). (absolute energies in Hartrees, relative energies in kcal mol−1).
Table S8. Thermochemical data of all probe Gly seed RINRUS models reported reactants, transition states, and products of the methyl transfer reaction catalyzed by Glycine N-Methyltransferase (GNMT). (absolute energies in Hartrees, relative energies in kcal mol−1).
Table S9. Thermochemical data of all Gly seed F-SAPT models reported reactants, transition states, and products of the methyl transfer reaction catalyzed by Glycine N-Methyltransferase (GNMT). (absolute energies in Hartrees, relative energies in kcal mol−1).
Table S10. Thermochemical data of all SAM+Gly seed F-SAPT models reported reactants, transition states, and products of the methyl transfer reaction catalyzed by Glycine N-Methyltransferase (GNMT). (absolute energies in Hartrees, relative energies in kcal mol−1).
Table S11. Thermochemical data of all large basis set models and newer functionals Res27 model reported reactants, transition states, and products of the methyl transfer reaction catalyzed by Glycine N-Methyltransferase (GNMT). (absolute energies in Hartrees, relative energies in kcal mol−1).