Fig 3.
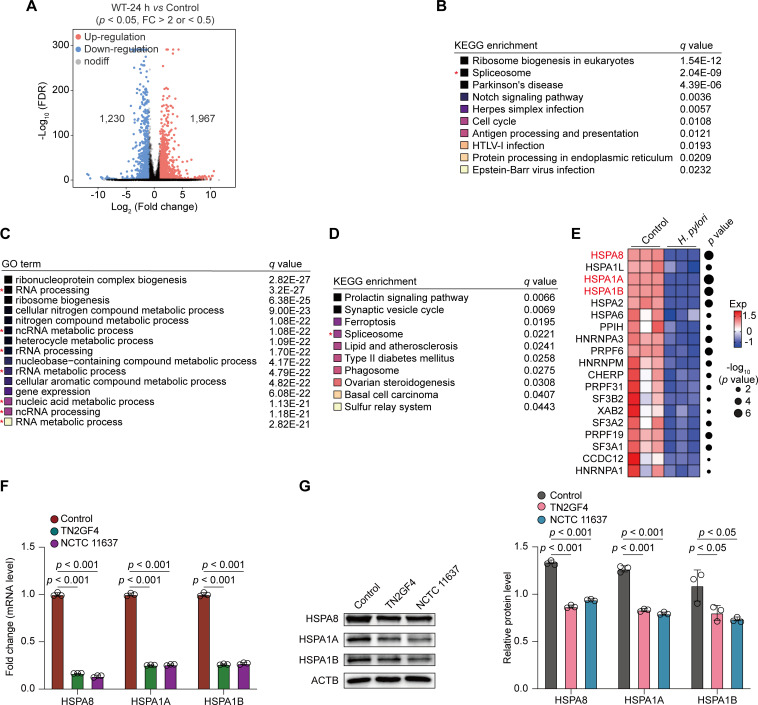
Repressed expression of multiple splicing factors in response to H. pylori infection. (A–E) GES-1 cells were infected with WT or cagA-mutated H. pylori TN2GF4 strains (MOI 100) for 3 h and then exposed to gentamicin (100 µg/mL) for 24 h to eliminate the extracellular bacteria. (A) Volcano plot showing the DEGs obtained from GES-1 cells infected with WT H. pylori TN2GF4 strain for 24 h compared with mock infection (FC > 2 or <0.5, P value < 0.05). Of these, 1,967 DEGs were upregulated, whereas 1,230 DEGs were downregulated in H. pylori-infected cells. Benjamini-Hochberg adjusted two-sided Wilcoxon test. (B) KEGG annotation of the top 10 enriched biological pathways using the downregulated DEGs from WT H. pylori TN2GF4-infected GES-1 cells compared with mock infection after 24 h post-challenge. Colored squares represented the q value (black, small; yellow, big). (C) GO annotation of the top 15 enriched biological pathways using the downregulated DEGs from WT H. pylori TN2GF4-infected GES-1 cells compared with mock infection after 24 h post-challenge. Colored squares represented the q value (black, small; yellow, big). (D) KEGG annotation of the top 10 enriched biological pathways using the downregulated DEGs from cagA-mutated H. pylori TN2GF4-infected GES-1 cells compared with mock infection after 24 h post-challenge. Colored squares represented the q value (black, small; yellow, big). (E) Heatmap showing the expression of splicing regulators in uninfected GES-1 cells or cells infected with WT H. pylori TN2GF4 strains for 24 h. Dot size indicates the −log10 transformed P values, color coding based on normalized expression levels. (F and G) GES-1 cells were infected with H. pylori TN2GF4 or NCTC11637 strains (MOI 100) for 3 h and then exposed to gentamicin (100 µg/mL) for 24 h to eliminate the extracellular bacteria. The mRNA (F) and protein (G) expression of HSPA8, HSPA1A, and HSPA1B was determined in uninfected GES-1 cells or cells infected with H. pylori TN2GF4 or NCTC 11637 strains. β-Actin was used as the loading control. All the quantitative data were presented as means ± SD from three independent experiments. *P < 0.05 and ***P < 0.001.

