Fig 5.
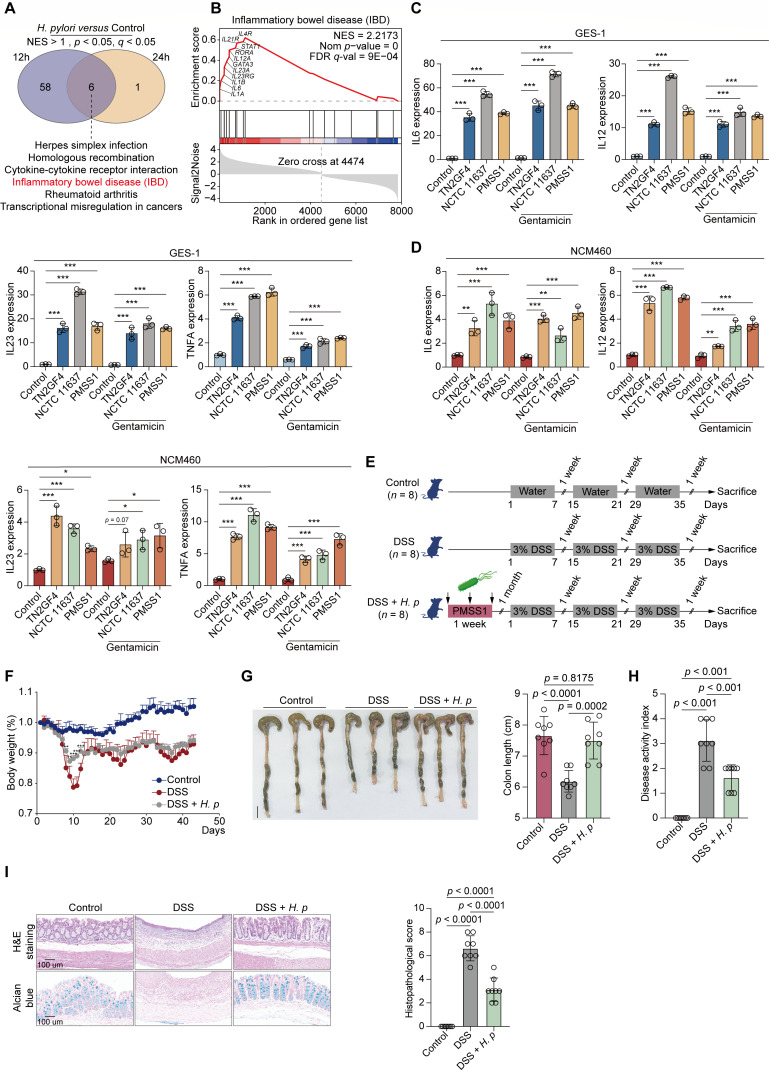
Gastric H. pylori colonization alleviated the severity of chronic DSS-induced colitis. (A and B) GES-1 cells were infected with WT H. pylori TN2GF4 strain (MOI 100) for 3 h and then exposed to gentamicin (100 µg/mL) for 12 or 24 h to eliminate the extracellular bacteria. (A) Venn diagram showing the number of GSEA-enriched biological pathways in H. pylori-infected GES-1 cells compared with mock infection after 12 or 24 h challenge, with six pathways including IBD pathway (red) being simultaneously enriched in both two timepoints. (B) GSEA enrichment plot showed that the “IBD” pathway was enriched in H. pylori-infected GES-1 cells for 24 h compared with mock infection. IBD pathway-related genes that were upregulated in response to H. pylori infection were labeled. (C and D) GES-1 (C) or NCM460 (D) cells were infected with H. pylori TN2GF4, NCTC 11637, or PMSS1 strains (MOI 100) for 24 h with or without gentamicin (100 µg/mL) treatment. The mRNA expression of IL6, IL12, IL23, and TNFA were determined. β-Actin was used as the loading control. The quantitative data were presented as means ± SD from three independent experiments. (E–J) C57BL/6J mice were orally inoculated with H. pylori PMSS1 strain (n = 8 animals) or the vehicle (n = 8 animals) for 1 month, followed by the administration of three cycles of 3% DSS (7 days/cycle), each separated by 7 days of regular water. (E) Schematic overview of the experimental design. (F) The changes of mice body weight after DSS administration were monitored. Mean ± SD from eight mice in each group. (G) (Left) Representative photographs of mouse colon tissue from each group were presented. Scale bar = 1 cm. (Right) The colon length of each mice was recorded. (H) The DAI index per mice was evaluated. (I) The histological analysis of mice colon tissue was performed by hematoxylin and eosin (H&E) and alcian blue staining. Scale bar = 100 µm. Histological scores of the DSS-induced colitis were evaluated. The quantitative data were presented as means ± SD. *P < 0.05, **P < 0.01, and ***P < 0.001.

