



Abstract
Background:
Per- and polyfluoroalkyl substances (PFAS) are widely detected in pregnant women and associated with adverse outcomes related to impaired placental function. Human chorionic gonadotropin (hCG) is a dimeric glycoprotein hormone that can indicate placental toxicity.
Objectives:
Our aim was to quantify the association of serum PFAS with placental hCG, measured as an intact molecule (hCG), as free alpha-() and beta-subunits (), and as a hyperglycosylated form (h-hCG), and evaluate effect measure modification by social determinants and by fetal sex.
Methods:
Data were collected from 326 pregnant women enrolled from 2015 to 2019 in the UPSIDE study in Rochester, New York. hCG forms were normalized for gestational age at the time of blood draw in the first trimester [multiple of the median (MoM)]. Seven PFAS were measured in second-trimester maternal serum. Multivariate imputation by chained equations and inverse probability weighting were used to evaluate robustness of linear associations. PFAS mixture effects were estimated by Bayesian kernel machine regression.
Results:
Perfluorohexane sulfonic acid (PFHxS) [: 0.29 log MoM units per log PFHxS; 95% confidence interval (CI): 0.08, 0.51] and perfluorodecanoic acid (PFDA) (hCG: ; 95% CI: , ) were associated with hCG in the single chemical and mixture analyses. The PFAS mixture was negatively associated with and positively with . Subgroup analyses revealed that PFAS associations with hCG differed by maternal race/ethnicity and education. Perfluoropentanoic acid (PFPeA) was associated with only in Black participants (; 95% CI: , ) and in participants with high school education or less (; 95% CI: , ); conversely, perfluorononanoic acid (PFNA) was negatively associated with only in White participants (; 95% CI: , ) and with only in participants with a college education or greater (; 95% CI: , ). These findings were robust to testing for selection bias, confounding bias, and left truncation bias where PFAS detection frequency was . Two associations were negative in male (and null in female) pregnancies: Perfluoroundecanoic acid (PFUnDA) with , and PFNA with h-hCG.
Conclusions:
Evidence was strongest for the association between PFHxS and PFDA with hCG in all participants and for PFPeA and PFNA within subgroups defined by social determinants and fetal sex. PFAS mixture associations with and differed, suggesting subunit-specific types of toxicity and/or regulation. Future studies will evaluate the biological, clinical and public health significance of these findings. https://doi.org/10.1289/EHP12950
Introduction
Per- and polyfluoroalkyl substances (PFAS) are a class of synthetic chemicals with a chain of carbon atoms bonded to fluorine atoms.1 Because of the strong carbon-fluorine bond, PFAS are thermally and chemically stable and water and oil resistant, rendering them ideal for use in industrial and consumer products, including furniture, food packaging, and firefighting foam.2 Some PFAS are referred to as “forever chemicals” in the environment because of their nondegradability.3 Perfluorooctanoic acid (PFOA) and perfluorooctanesulfonic acid (PFOS) are still widely detected in the environment even after production has declined.4 At the same time, PFAS such as perfluorohexane sulfonic acid (PFHxS) have been used as a replacement and have also been detected widely in biota.5–7 Virtually all people in the United States have been exposed to some PFAS because of their wide-scale application and accumulation in the environment.8 Newer replacement PFAS are measured in human sera at increasing levels in recent years.9 PFAS bind high-abundance serum proteins like albumin in aquatic species10 and in human tissues.11 Some PFAS have half-lives of 2–8 y in the body12,13; hence, concentrations are typically stable within a pregnancy and across multiple consecutive pregnancies.14–16
Several pregnancy complications and adverse birth outcomes are associated with some PFAS exposures, including hypertensive disorders,17,18 gestational diabetes,19–22 lower birth weight,23–25 and pregnancy loss.26,27 PFAS exposure as a potential cause of placental toxicity contributing to these outcomes is not well understood.28–31 The placenta is a temporal endocrine organ that exists only during pregnancy. It serves as a conduit between the mother and the developing fetus for the transfer of nutrients, oxygen, xenobiotics and hormones.32 Previous studies have shown that the efficiency of PFAS transfer to the fetus differs by carbon chain lengths and chemical structure.33
Placental toxicity of PFAS has been demonstrated in vivo and in vitro. For example, mice exposed to PFOA or GenX (the replacement chemical HFPO-DA) had a greater incidence of placental lesions34 and PFOA, PFOS, and GenX had proliferative and pro-apoptotic effects on JEG-3 human placental trophoblasts, derived from a choriocarcinoma.35 PFOS altered expression of PPARG, mRNAs, and proteins in the peroxisome proliferator–activated receptor () pathway in two human placental cell lines, with corroboration of effects on placental development in an in vivo moue model.36 In light of these findings, we hypothesize that PFAS may interfere with placental development and/or function in humans.
Human chorionic gonadotropin (hCG) is a glycoprotein hormone primarily produced during pregnancy by trophoblast cells in the placenta.37 hCG is used to detect pregnancy at a very early stage and plays an important role in pregnancy maintenance because it supports luteal progesterone production by activating the LH/hCG receptor (LHCGR).37 Several other critical roles, that may be independent of LHCGR,38,39 have been proposed.40–43 There are four forms of hCG, including the intact hormone (intact hCG, which is a heterodimer of alpha- and beta-subunits), free subunit (), free subunit (), and hyperglycosylated intact hCG (h-hCG).37 Serum levels of hCG generally increase rapidly during the first trimester with a peak at 9 to 10 wk.44 Different forms of hCG follow different time courses over pregnancy and are partially produced by different tissues in the body and cell types in the placenta. For example, the alpha-subunit of hCG is produced by the placenta and the maternal and fetal pituitaries and increases over the entire length of the pregnancy.45–47 h-hCG is mainly made by cytotrophoblastic cells48 and has been proposed to facilitate trophoblast invasion and placental development.49
In addition to analysis gaining insight into the role of PFAS effects on the placenta by evaluating associations of PFAS with hCG concentrations, we also examined socioeconomic and sociodemographic context. An important factor is that PFAS exposure has been shown to vary by maternal race across birth cohorts in other studies50–53 (Table S1). We theorized race/ethnicity to operate as an effect modifier in the PFAS and hCG association because of where it falls on a complex pathway that connects historical factors and structural and individual-level forms of discrimination. This analytical framework has been recently proposed by Howe et al.54 Serum hCG levels also vary by maternal race, after accounting for maternal weight, fetal sex differences, smoking, and diabetes status.55,56
The primary aim of the paper was to evaluate linear associations in a birth cohort study of seven PFAS, modeled as single chemicals, and four forms of hCG and their effect measure modification by social determinants of health and by fetal sex. A secondary aim was to evaluate the combined association of seven PFAS, modeled as a mixture, and four forms of hCG.
Methods
Study Participants
Participants were enrolled in the Understanding Pregnancy Signals and Infant Development (UPSIDE) study,57 which is part of the National Institutes of Health (NIH) Environmental influences on Child Health Outcomes program.58 In brief, between 2015 and 2019, UPSIDE recruited women in the first trimester of pregnancy ( gestation) from outpatient obstetric clinics affiliated with the University of Rochester Medical Center. Pregnant women were considered eligible if they were of age, had a singleton pregnancy, had no substance abuse problems, had no psychotic illness or major endocrine disorders at enrollment, and were able to communicate in English. This information was collected by self-report and from the medical record. A total of 326 participants were recruited, and nonfasting blood samples were collected in the first and second trimesters. Information regarding sociodemographic characteristics (i.e., race/ethnicities and education) or time-varying characteristics (i.e., employment, income and marital status) were provided by the participants at their first-trimester visit. Participants identified their race/ethnicity by questionnaire as one of the following: Hispanic, Non-Hispanic White, Non-Hispanic Black, Asian, or Mixed race (including more than one race). In addition, they identified as one of the following ethnicities: Hispanic or Latino, Non-Hispanic or Non-Latino. The institutional review boards at the University of Rochester School of Medicine and Dentistry, Rutgers University, and the University of Pittsburgh approved this study. All participants provided informed written consent.
PFAS Analysis in the Second Trimester Serum
Fourteen PFAS were measured at the Wadsworth Center’s CHEAR Laboratory Hub. These included perfluorobutanesulfonic acid [PFBS, CAS 375-73-5, limit of detection (LOD) ], perfluorohexanesulfonic acid (PFHxS, CAS 355-46-4, LOD 0.02), perfluorooctanesulfonic acid (PFOS, CAS 1763-23-1, LOD 0.02), perfluoroheptanoic acid (PFHPA, CAS 375-85-9, LOD 0.0224), perfluorooctanoic acid (PFOA, CAS 335-67-1, LOD 0.02), perfluorononanoic acid (PFNA, CAS 375-95-1, LOD 0.032), perfluorodecanoic acid (PFDA, CAS 335-76-2, LOD 0.02), perfluoroundecanoic acid (PFUnDA, CAS 2058-94-8, LOD 0.02), perfluorododecanesulfonate (PFDoDA, CAS 307-55-1, LOD 0.0224), perfluorooctanesulfonamide (PFOSA, CAS 754-91-6, LOD 0.02), N-ethyl perfluorooctane sulfonamido acetic acid (NEtFOSAA, CAS 2991-50-6, LOD 0.032), N-methyl perfluorooctane sulfonamido acetic acid (N-MeFOSAA, CAS 2355-31-9, LOD 0.032), perfluoropentanoic acid (PFPeA, CAS 2706-90-3, LOD 0.0224) and perfluorohexanoic acid (PFHxA, CAS 307-24-4, LOD 0.02) The LOD for individual PFAS varied from 0.02 to . The details of the analytical methods have been described previously, and no changes were made here.59 The method is based on solid-phase extraction (hybrid-SPE) and ultra high-performance liquid chromatography–tandem mass spectrometry. Proteins were precipitated with 1% ammonium formate in methanol.
hCG Analysis in Maternal Serum
Different forms of hCG were measured in maternal serum, including the intact hormone (intact hCG, which is a heterodimer of alpha- and beta-subunits, LOD ), free subunit (, LOD ), free subunit (, LOD ), and hyperglycosylated intact hCG (h-hCG, LOD ).37 All forms of hCG were analyzed at the Department of Clinical Chemistry, University of Helsinki, Finland. The details of analytical methods have been described previously.60 Serum samples were diluted 1:100 before analysis (1 part of sample and 100 parts of dilution buffer). In brief, intact hCG () was measured using a sandwich-type time-resolved immunofluorometric assay (IFMA) specific for intact dimer. Others were measured using in-house IFMAs, specific for free and subunits (). The in-house IFMA for h-hCG () detects both hyperglycosylated intact dimer and hyperglycosylated . All samples were analyzed in duplicate.
Directed Acyclic Graph (DAG)
We conceptualized maternal race/ethnicity here as a variable to measure “membership in a marginalized versus a privileged group defined by race/ethnicity.”54 According to the causal diagram (Figure 1), this is a factor that occurs upstream of proximal causes of a person’s PFAS exposure. Race/ethnicity is a social and political construct and not a biologic construct.61 Education and income, also related to membership in groups defined by race/ethnicity, are more proximal to direct causes of PFAS exposure and were evaluated here as effect modifiers. The DAG in Figure 1 is based on a proposal by Howe et al. on how to conceptualize race/ethnicity in epidemiological studies where the goal is to infer an exposure effect on an outcome and specifically on the data-generating mechanism that produced a disparity in the exposure effect.54
Figure 1.
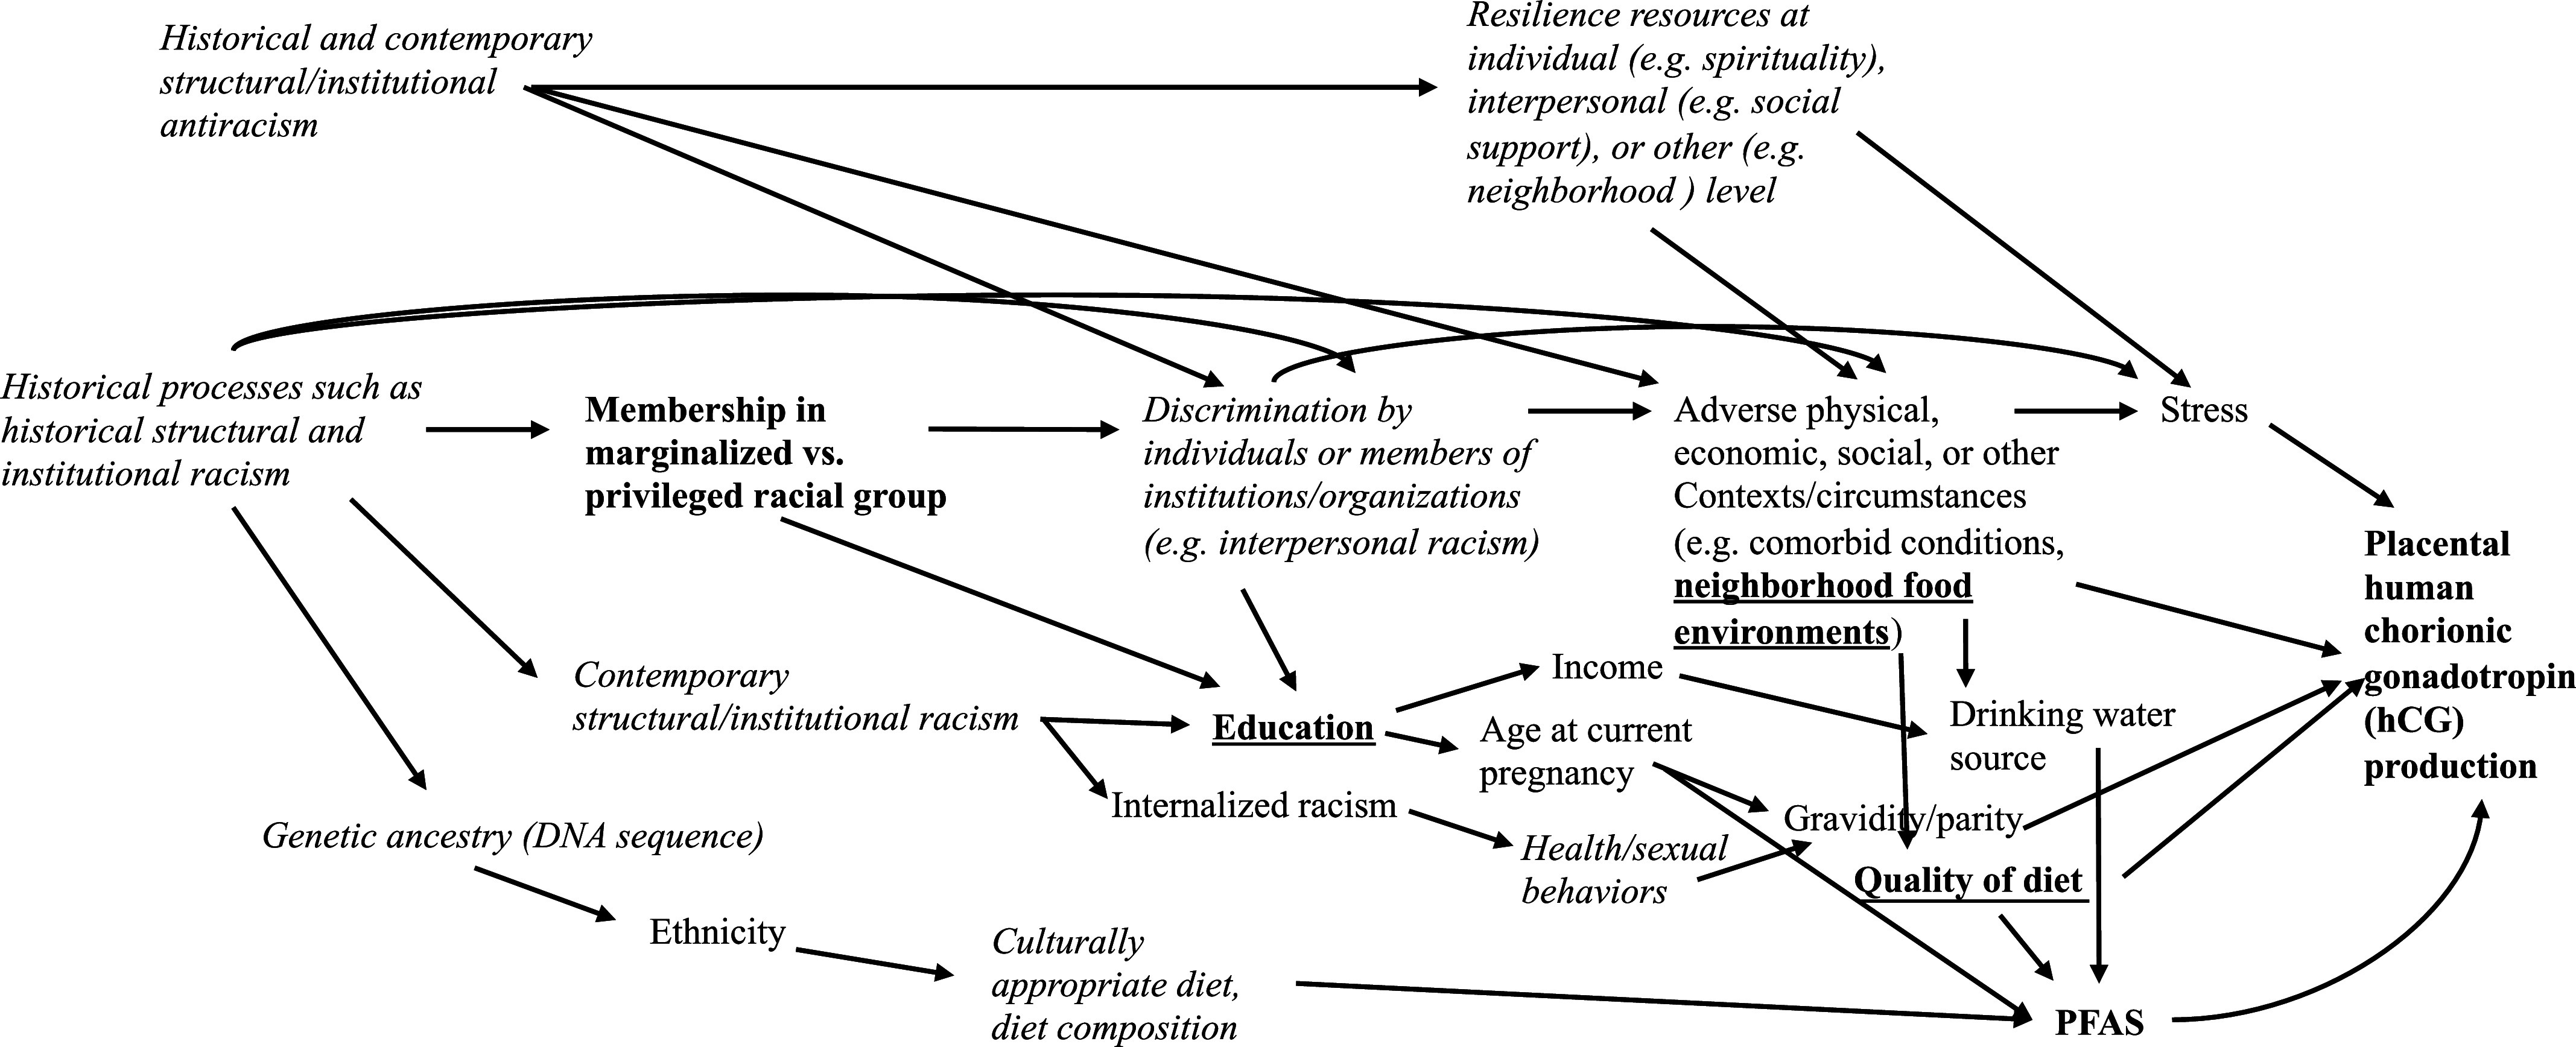
Causal diagram to identify association of maternal PFAS levels and placental hCG, adapted from Howe et al. Italicized nodes are unmeasured in the current study. Underlined nodes indicate potential points of intervention to modify PFAS exposure risk. Note: hCG, human chorionic gonadotropin; PFAS, per- and polyfluoroalkyl substances.
Statistical Analysis
We selected 7 of the 14 PFAS (PFHxS, PFOS, PFPeA, PFOA, PFNA, PFDA, and PFUnDA) for the final analysis based on a cutoff frequency of 60% of samples (or greater) above the LOD. Values below the LOD were substituted as the LOD divided by the square root of 2. PFAS levels were natural log transformed to normalize their distribution for use in regression models. hCG levels were normalized by the gestational age at sample collection and expressed as concentration of multiple of median (MoM).62 Gestational age as noted in the medical record is based on early crown–rump length ultrasound measurement. When that was not available (7.4% of pregnancies), gestational age was based on date of last menstrual period.
DAG theory, specifically addressing social and historical determinants of PFAS levels, was applied to identify distal and proximal sources of confounding, beyond those measured in this study (Figure 1).54 Proximal variables fell into the following categories: demographics, anthropometrics, reproductive history (parity-categorical, gravidity-continuous), medical history (preconception and pregnancy illness was a variable created by the UPSIDE study team and included flu, respiratory illness, urinary tract infection, other infections, and fever), medications (asthma/allergy and antihistamine medicines-categorical), supplements (Vitamin B6-categorical). Information on maternal age (years), race/ethnicity (five categories), education (below high school vs. high school and greater than high school), and smoking (yes, no) were obtained by maternal report. Proximal sources of variability and causes of hCG levels fall into these same categories and were described in a previous review.63 The Pearson correlation test was used for continuous variables, and -test/analysis of variance (ANOVA) was used for categorical variables to empirically identify potential confounders () related to serum PFAS and hCG levels (Tables S13–S17). Prepregnancy body mass index (BMI) was obtained from electronic medical records. Education was prioritized as a representative measure of socioeconomic status (SES) with low missingness (2.2%). We measured sex during the fetal period when it was defined by the presence of female vs. male genitalia imaged by ultrasound.
Linear regression models were used to examine the relationship between second-trimester PFAS and the first-trimester hCG. Using the DAG combined with the data-driven approach described above, four potential confounders and effect modifiers were identified: fetal sex, maternal race/ethnicity, income, and education. In contrast to social determinants, fetal sex is a biological construct here and is also associated with PFAS and hCG levels.62,64 These factors were added to models by including them as covariates and also by including an interaction product term of (serum PFAS × covariate). Subgroup specific beta coefficients and 95% confidence intervals (CIs) were calculated by linear contrast statements (package: multcomp in R). Participants with missing values for confounders were excluded from the analysis.
In the framework of linear regression, sensitivity analyses were conducted to evaluate the impacts a) of selection bias (imputation of missing data that would otherwise result in dropping participants from the analysis), b) of imbalance in covariates among participants and residual confounding, and c) left truncation bias of the exposure in cases where the PFAS chemical was detected in of the participants. Multivariate imputation by chained equations (package: mice in R) was used to impute missing values for PFAS (missingness: 12%), covariates (missingness: ), and hCG (missingness: 3%) to address potential selection bias and to analyze the full set of data in 326 pregnancies.65 We assumed the missing values were due to missing blood samples and missing at random. We created an imputed dataset using variables related to both exposure and outcomes and used predictive mean matching to estimate the likely value of the missing data point. Five datasets were generated and averaged. A sensitivity analysis was conducted by fitting the same linear regression model using the imputed dataset. Inverse probability weighting (IPW) (package: ipw in R) was used to balance the distribution of covariates by applying stabilized weights.66 Finally, tertiles were calculated for those PFAS that were detected in of samples, the same models were fit, and results were compared with those models in which PFAS values below detection were assigned an imputed value () as described above. This was a validation step to check potential bias due to overweighting of samples (i.e., left truncation bias) that were below detection and all assigned the same value by the imputation approach. Outlier diagnostics were applied. Regressions were run with and without outliers, and results were compared. The reference analysis did not include any imputed data. -values were reported to evaluate group differences and interactions. Associations are reported as beta coefficients and their 95% CIs. Associations are emphasized as “meaningful” if they were robust to the four sensitivity analyses and had narrow CIs.
The Bayesian kernel machine regression (BKMR) was used to estimate the effect of the PFAS mixture on serum hCGs. BKMR is a statistical method that can be used to flexibly model the individual and joint effects of exposure to mixtures of chemicals by using a kernel function.67 A Gaussian kernel was selected as a flexible function that accommodates nonlinearity and/or interactions among the PFAS. Markov chain Monte Carlo iterations were run 10,000 times to generate the posterior inclusion probability (PIP). The PIP can be used to rank the chemicals by strength of contribution to the mixture effect. BKMR was implemented with the R package “bkmr.” All statistical analyses were performed using R (version.4.0.5; R Core Development Team). Interaction -values of 0.2 or less were considered meaningful.
Results
Descriptive Statistics
Characteristics of the study participants are reported in Table 1 and are consistent with those reported elsewhere for the UPSIDE study.57 Subject characteristics differed between pregnant women with PFAS values () and those for whom PFAS were not analyzed due to a missing second-trimester blood sample (). Possible reasons for the missing samples were that they missed the visit, they dropped out of the study before the delivery of their baby, or had a pregnancy loss (information not available). Those who did not stay in the study were younger by 2 y on average, had higher prepregnancy BMI, had a slightly lower value, and were more likely to be Black or Hispanic (Table 1). After imputation, the mean levels for PFAS and for hCG in the original sample and the imputed sample were similar (Table S2).
Table 1.
Characteristics of the UPSIDE study participants, comparing those with and without second trimester serum PFAS measures.
| All | PFAS sample | PFAS missing | -Valuea | |
|---|---|---|---|---|
| 326 | 286 | 40 | ||
| or (%) | ||||
| Maternal age (y) | 28.8 (4.7) | 29.0 (4.6) | 27.2 (5.1) | 0.04 |
| Body mass index | 28.4 (7.1) | 28.0 (7.1) | 31.1 (6.4) | 0.008 |
| Gestational week serum (PFAS) | 21.2 (1.8) | 21.2 (1.8) | NA | NA |
| Missing | 40 (12%) | 0 (0%) | NA | NA |
| Gestational week serum (hCG) | 12.2 (1.3) | 12.2 (1.3) | 12.2 (1.53) | 0.91 |
| Missing | 31 | 2 | 29 | |
| Parity () | 207 (65.3%) | 188 (65.7%) | 19 (61.3%) | 0.77 |
| Gravidity | 1.88 (1.8) | 1.88 (1.8) | 1.87 (1.8) | 0.98 |
| Pre- and pregnancy illnessb | 2 (0.6%) | 2 (0.7%) | 0 (0%) | 1.00 |
| Medication, asthma or allergy | 21 (6.6%) | 20 (7.0%) | 1 (3.1%) | 0.63 |
| Medication, antihistamine | 27 (8.3%) | 26 (9.3%) | 1 (3.1%) | 0.40 |
| Vitamin B6 supplement | 21 (6.7%) | 20 (7.1%) | 1 (3.1%) | 0.63 |
| Ethnicity | 0.17 | |||
| Hispanic or Latino | 35 (11%) | 28 (10%) | 7 (18%) | |
| Non-Hispanic or Non-Latino | 291 (89%) | 258 (90%) | 33 (83%) | |
| Race/ethnicity | 0.02 | |||
| White and Non-Hispanic | 180 (55%) | 166 (58%) | 14 (35%) | |
| Asian | 12 (3.7%) | 12 (4.2%) | 0 (0.0%) | |
| Black/AA and Non-Hispanic | 85 (26%) | 68 (24%) | 17 (43%) | |
| Hispanic | 35 (11%) | 28 (10%) | 7 (18%) | |
| Mixed race | 14 (4.3%) | 12 (4.2%) | 2 (5.0%) | |
| Education | 0.11 | |||
| Less than high school | 15 (4.7%) | 11 (3.9%) | 4 (12%) | |
| High school | 107 (34%) | 94 (33%) | 13 (38%) | |
| Some college | 44 (14%) | 41 (14%) | 3 (79%) | |
| Bachelor’s | 78 (25%) | 68 (24%) | 10 (29%) | |
| Postgraduate degree | 75 (24%) | 71 (25%) | 4 (29%) | |
| Missing | 7 | 1 | 6 | |
| Marital status (first trimester) | 0.17 | |||
| Married | 170 (54%) | 157 (56%) | 13 (38%) | |
| Living as married | 15 (4.8%) | 13 (4.7%) | 2 (5.9%) | |
| Divorced | 2 (0.6%) | 2 (0.7%) | 0 (0%) | |
| Single | 126 (40%) | 107 (38%) | 19 (56%) | |
| Missing | 13 | 7 | 6 | |
| Income (tertiles) | 0.18 | |||
| Low () | 67 (25%) | 58 (24%) | 9 (33%) | |
| Middle ( and ) | 135 (50%) | 120 (48%) | 15 (56%) | |
| High () | 66 (25%) | 63 (26%) | 3 (11%) | |
| Missing | 58 | 45 | 13 | |
| Smoker (first trimester) | 0.49 | |||
| No | 288 (88%) | 259 (93%) | 29 (91%) | |
| Yes | 22 (7.1%) | 19 (6.8%) | 3 (9.4%) | |
| Missing | 16 | 8 | 8 | |
| Ever smoker | 0.21 | |||
| No | 219 (70%) | 192 (69%) | 26 (82%) | |
| Yes | 93 (30%) | 87 (31%) | 6 (19%) | |
| Missing | 14 | 7 | 7 | |
| Vaping (first trimester) | 1.00 | |||
| No | 309 (100%) | 277 (100%) | 32 (100%) | |
| Yes | 0 (0%) | 0 (0%) | 0 (0%) | |
| Missing | 17 | 9 | 8 | |
| Infant sex | 0.84 | |||
| Male | 157 (50%) | 144 (50%) | 13 (46%) | |
| Female | 157 (50%) | 142 (50%) | 15 (54%) | |
| Missing | 12 | 0 | 12 | |
| (log pmol/L) | 9.23 (0.25) | 9.24 (0.25) | 9.18 (0.39) | 0.44 |
| (log pmol/L) | 7.34 (0.35) | 7.35 (0.35) | 7.22 (0.34) | 0.05 |
| hyperglycosylated hCG (log pmol/L) | 9.44 (0.53) | 9.45 (0.53) | 9.35 (0.53) | 0.34 |
| hCG (log pmol/L) | 11.08 (0.30) | 11.09 (0.30) | 11.00 (0.29) | 0.12 |
| Missing | 14 | 3 | 11 | |
| hCG from medical record (log, second trimester) | 10.43 (0.8) | 10.44 (0.78) | 10.41 (0.91) | 0.93 |
| Missing | 298 | 265 | 33 | |
Note: Missing values: unless noted, there are no missing values. AA, African American; hCG, human chorionic gonadotropin; NA, not applicable; PFAS, perfluoroalkyl substances; SD, standard deviation; UPSIDE, Understanding Pregnancy Signals and Infant Development.
t-Test was used to compare means of continuous variables. Chi-square test or Fisher exact test was used to compare frequencies of categorical variables.
Preconception and pregnancy illness was a variable created by the UPSIDE study team and included flu, respiratory illness, urinary tract infection, other infections, and fever.
Unadjusted Correlations
Concentrations of all PFAS were positively correlated with each other, except for PFPeA (Table S3). Intact hCG (; 95% CI: , ), (; 95% CI: , ), and h-hCG (; 95% CI: , ) were all negatively correlated with gestational age at the time of blood collection within a narrow window in the first trimester, whereas (; 95% CI: 0.30, 0.49) was positively associated with gestational age. After transformation to the MoM (normalized for gestational age variation), these associations became null or weaker in magnitude. Pearson correlations with gestational age at time of sample were: MoM (; 95% CI: , 0.10), MoM (; 95% CI: , 0.01), h-hCG MoM (; 95% CI: , ), and intact hCG MoM (; 95% CI: , ). The MoM value was used in all analyses of PFAS associations. Second-trimester PFAS were not associated with gestational age at time of blood sample. PFAS levels in the sample overall differed by race/ethnicity (Table 2). Asian participants had the highest levels of PFDA, PFUnDA, PFNA, PFOA, and PFOS, and Non-Hispanic White participants had the highest levels of PFHxS (Table 2).
Table 2.
Serum perfluoroalkyl substances (PFAS, ng/mL) in the second trimester (), in all participants and by race/ethnicity among participants in the UPSIDE study.
| PFAS | Detection rates | LOD | Percentile | Geometric | ||||||||
|---|---|---|---|---|---|---|---|---|---|---|---|---|
| 10% | 50% | 90% | Overall mean | Hispanic | White & Non-Hispanic | Black/AA & Non-Hispanic | Asian | Mixed race | -Value | |||
| PFDA | 82.9% | 0.02 | 0.01 | 0.06 | 0.15 | 0.05 (2.4) | 0.04 (2.1) | 0.06 (2.4) | 0.05 (2.4) | 0.12 (2.7) | 0.05 (2.0) | 0.01 |
| PFPeA | 62.2% | 0.02 | 0.02 | 0.06 | 0.29 | 0.06 (3.4) | 0.05 (3.7) | 0.07 (3.4) | 0.04 (3.1) | 0.05 (3.6) | 0.07 (4.0) | 0.08 |
| PFUnDA | 61.9% | 0.02 | 0.01 | 0.03 | 0.12 | 0.04 (2.5) | 0.03 (2.2) | 0.03 (2.5) | 0.04 (2.3) | 0.10 (2.6) | 0.03 (2.3) | 0.0003 |
| PFHxS | 100% | 0.02 | 1.05 | 1.72 | 3.07 | 1.73 (1.5) | 1.64 (1.4) | 1.87 (1.5) | 1.56 (1.6) | 1.50 (1.2) | 1.44 (1.6) | 0.006 |
| PFNA | 100% | 0.03 | 0.14 | 0.25 | 0.49 | 0.26 (1.8) | 0.24 (1.5) | 0.26 (1.8) | 0.27 (1.9) | 0.36 (1.6) | 0.18 (1.4) | 0.01 |
| PFOA | 100% | 0.02 | 0.27 | 0.59 | 1.15 | 0.57 (1.9) | 0.59 (1.6) | 0.64 (1.8) | 0.42 (2.0) | 0.79 (2.0) | 0.41 (1.7) | |
| PFOS | 100% | 0.02 | 1.39 | 2.5 | 4.29 | 2.49 (1.6) | 2.40 (1.6) | 2.67 (1.7) | 2.14 (1.5) | 2.89 (1.6) | 2.07 (1.6) | 0.01 |
Note: LOD, limit of detection (ng/mL); PFAS, perfluoroalkyl substances; PFDA, perfluorodecanoic acid; PFHxS, perfluorohexanesulfonic acid; PFNA, perfluorononanoic acid; PFOA, perfluorooctanoic acid; PFOS, perfluorooctanesulfonic acid; PFPeA, perfluoropentanoic acid; PFUnDA, perfluoroundecanoic acid; -value, Kruskal-Wallis rank sum test; SD, standard deviation; UPSIDE, Understanding Pregnancy Signals and Infant Development.
Concentrations of first-trimester serum , intact hCG and hyperglycosylated hCG were highly correlated with each other (). , on the other hand, was not correlated with (; 95% CI: , 0.18) and weakly correlated with h-hCG (; 95% CI: 0.15, 0.36) and hCG (; 95% CI: 0.24, 0.44).
Prepregnancy BMI was negatively correlated and income was positively correlated with PFAS levels (Table S13). Pregnant women with higher education and women married or living as married and nonsmokers tended to have a higher PFAS levels (Table S15). Based on these correlations, BMI, income, education, marital status, and smoking were included as potential confounders of the PFAS and hCG association. Parity, gravidity, maternal illness, pregnancy complication, medication and supplements in the first trimester were not included in the final models.
Single PFAS Associations
Of the 7 PFAS by 4 hCGs analyzed (28 associations), 2 associations were robust to all analytical approaches (Figure 2; Table S4, robust associations indicated by footnote). PFHxS was positively associated with (beta coefficient 0.29 log MoM units per log unit PFHxS; 95% CI: 0.08, 0.51) (Figure 2; Table S4). PFDA (; 95% CI: , ) was negatively associated with hCG (Figure 2; Table S4). In some cases, a specific analytical approach had a marked effect on the association. For example, the association of PFHxS and was 4-fold stronger with IPW (0.42; 95% CI: 0.28, 0.56) whereas the association of PFHxS and hCG were null with IPW (0.20; 95% CI: , 0.63; Table S4). IPW rendered participants more similar with respect to their covariates or potential confounders. The tertile analysis, to address left truncation bias by combining in one category values below detection with low values above detection, strengthened the association of PFDA and hCG while also widening the confidence interval (; 95% CI: , ). The PFOA and hCG associations were notably impacted by selection bias and/or missing data. Precision increased with the imputation of values for the 40 participants (Table S4). Three outliers were identified in the association of PFDA and and . Removal vs. inclusion of these values did not have an appreciable effect on the regression results (Table S16). Additional analyses including other potential confounders were aligned closely with the more parsimonious analysis (Table S5).
Figure 2.

Associations of serum perfluoroalkyl substances (PFAS, log) and four forms of 1st trimester hCG as log MoM, in participants of the UPSIDE study (). Models were adjusted for prepregnancy maternal body mass index, age, race/ethnicity, income, education level, and smoking status. Dots represent point estimates of the beta coefficient and lines represent their 95% CIs. Dotted line is the null value. Beta coefficients and CIs are in Table S4. Note: CI, confidence interval; hCG, human chorionic gonadotropin; MoM, multiple of median; PFDA, perfluorodecanoic acid; PFHxS, perfluorohexanesulfonic acid; PFNA, perfluorononanoic acid; PFOA, perfluorooctanoic acid; PFOS, perfluorooctanesulfonic acid; PFPeA, perfluoropentanoic acid; PFUnDA, perfluoroundecanoic acid; UPSIDE, Understanding Pregnancy Signals and Infant Development.
PFAS Mixture Associations
Mixture associations were strongest with and by visual inspection of the overall plot (Figure 3). The 95% credible intervals included the null value (Figure 3A,B). Mixture associations with the heterodimers hCG and h-hCG were null (Figure 3C,D). The PFAS mixture was negatively associated with (Figure 3A) and positively associated with (Figure 3B). PFDA was the strongest contributor to the association with (PIP: 0.76; Table 3), and PFHxS was the strongest contributor to the association with (PIP: 0.91; Table 3). PFDA and PFHxS were associated with and respectively in the single chemical analysis (Table S4). The BKMR-generated univariate plots provide additional insights on nonlinearities. PFHxS associations varied in shape (linear, concave) and magnitude across the four plots, and PFDA varied in the strength of the association (Figure S1). The bivariate plots provide insight on two-way interactions between the PFAS, in cases where the lines are not parallel across quantiles. There was no evidence of interaction of PFAS in association with and (Figure S2A,B). In association with h-hCG and hCG, there was evidence of interaction of both PFOA and PFOS with PFHxS and with PFPeA (Figures S2C,D).
Figure 3.
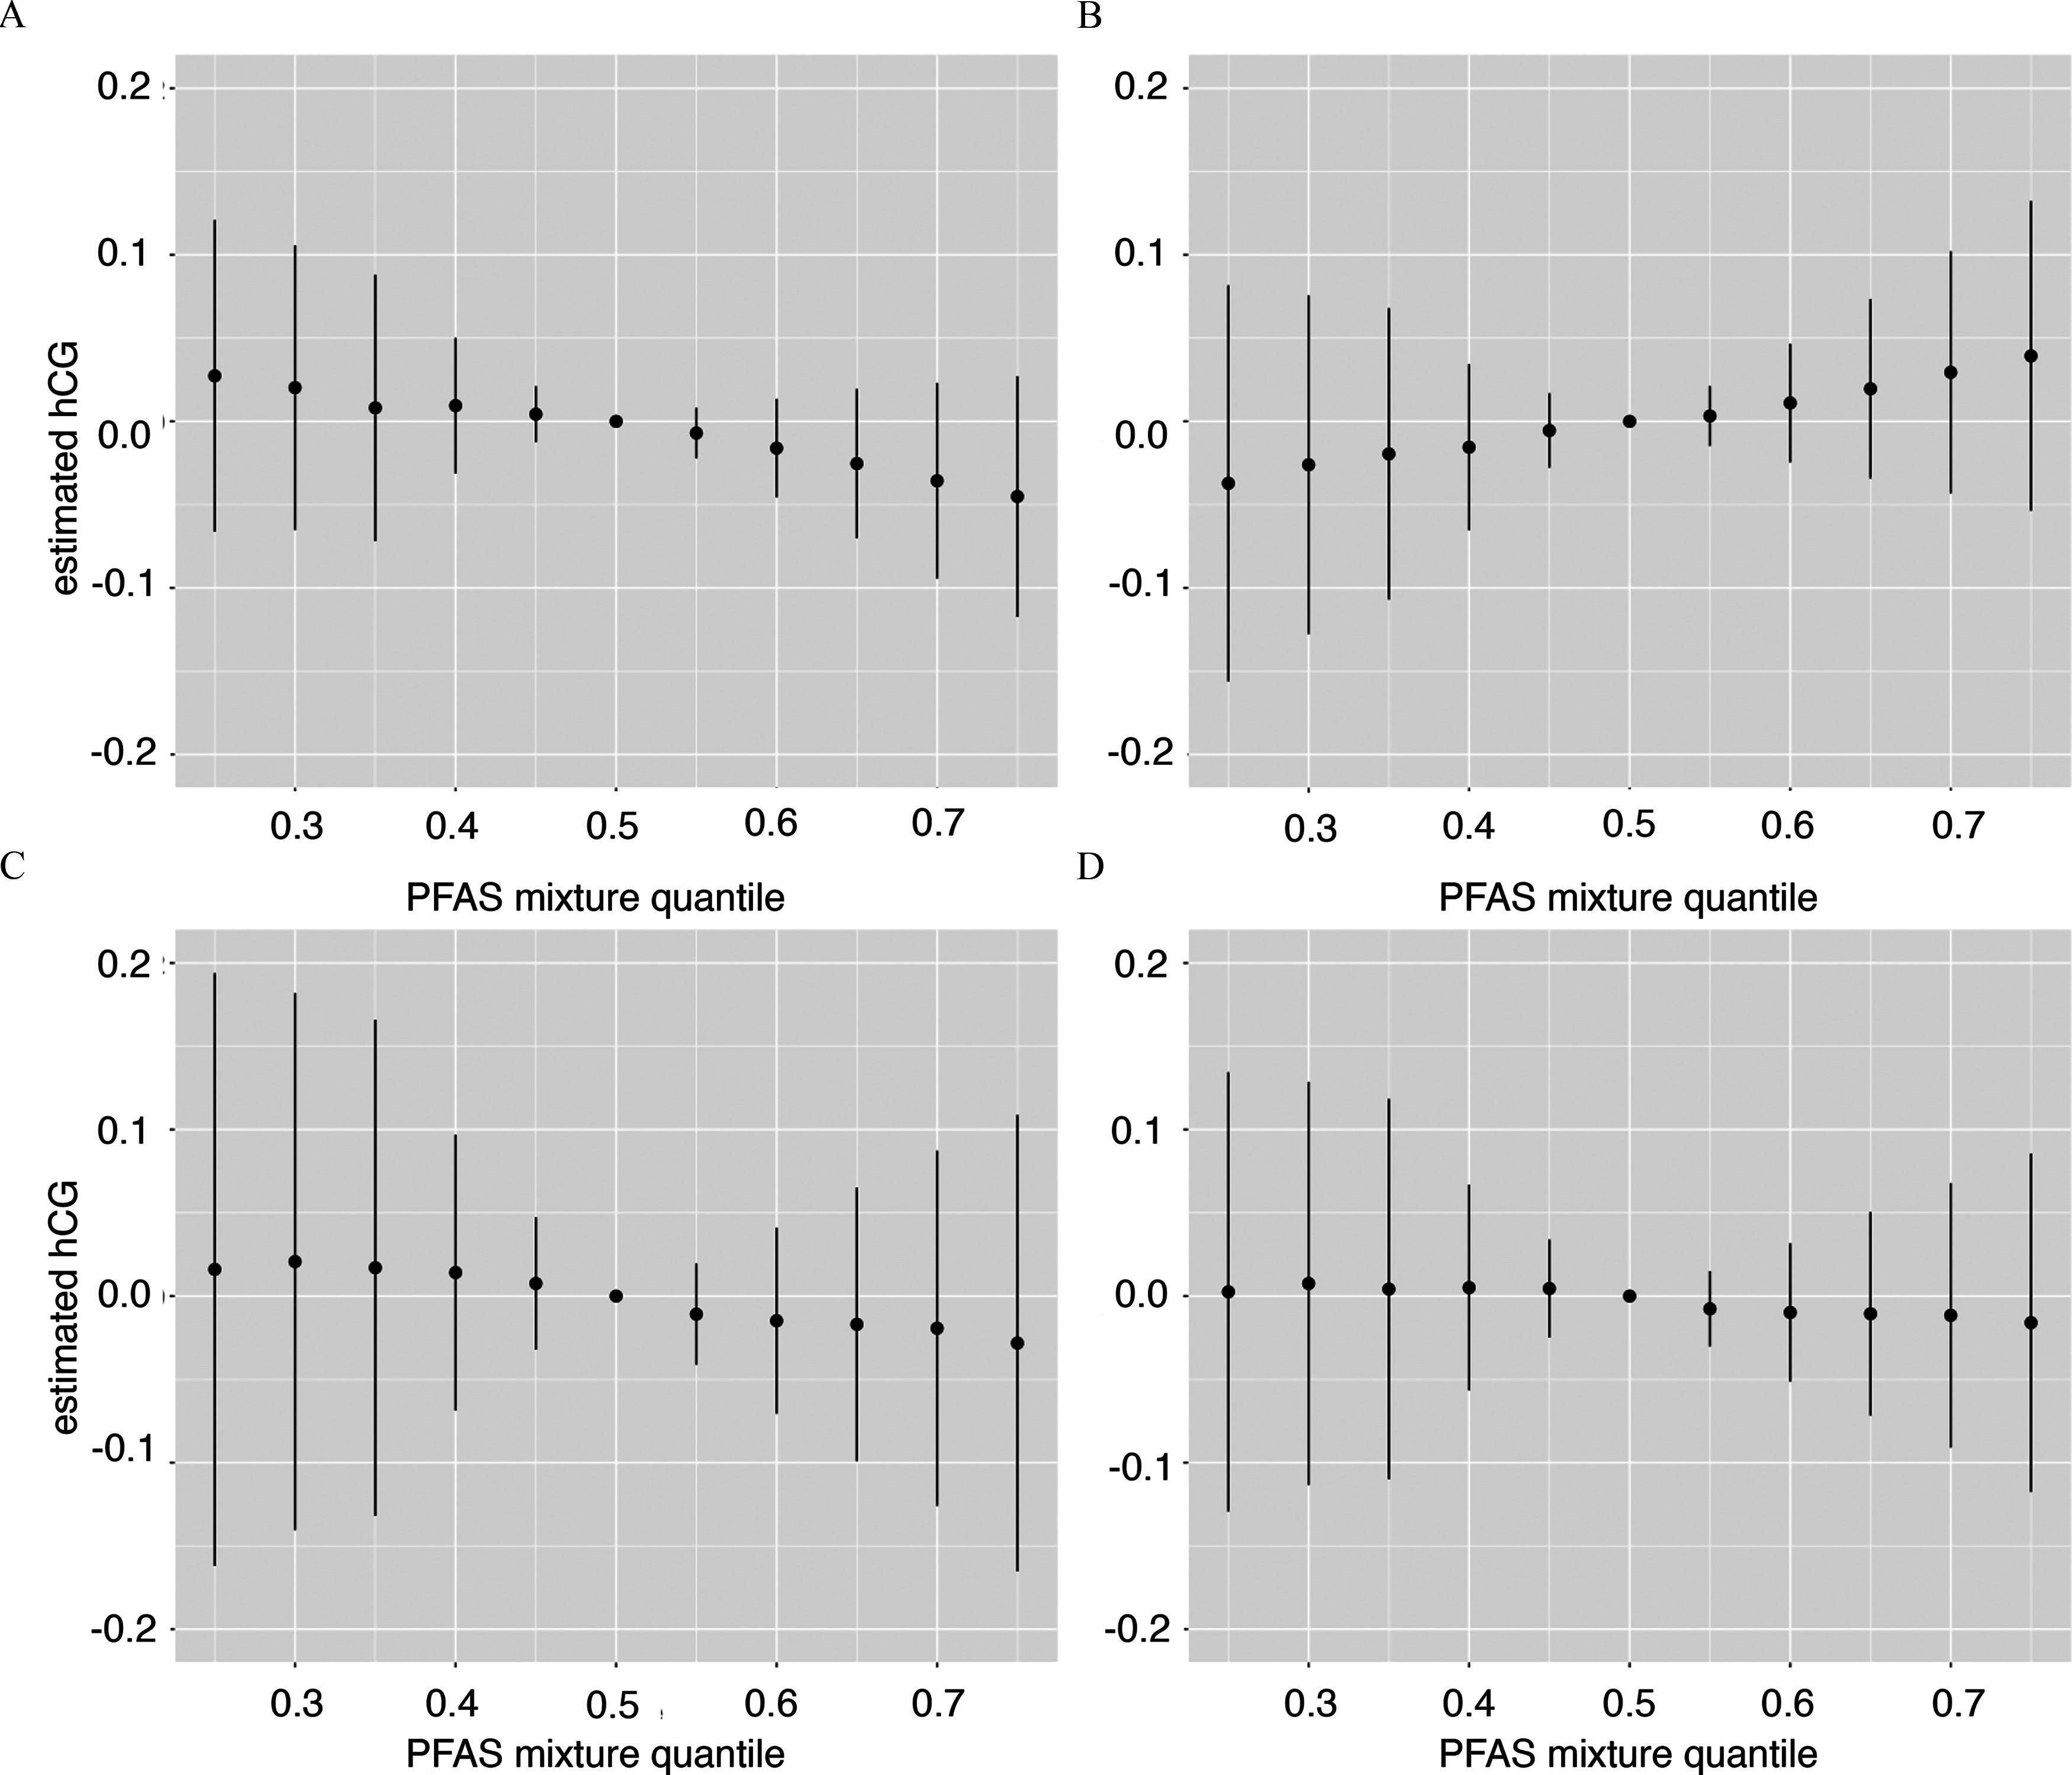
Overall PFAS mixture effect, estimated by BKMR, on (A) ; (B) ; (C) h-hCG; (D) intact hCG, adjusted for prepregnancy maternal body mass index, age, race/ethnicity, education level, and smoking status in participants of the UPSIDE study. The plot shows the estimated differences in hCG and 95% CrIs per quantile increase in all PFAS, in comparison with when all PFAS are held at their median levels. Supporting data for the BKMR analysis are in Table 2 and Figures S1 and S2; numeric data can be found in Table S19. Note: BKMR, Bayesian kernel machine regression; CI, credible interval; hCG, human chorionic gonadotropin; , human chorionic gonadotropin alpha; , human chorionic gonadotropin beta; h-hCG, hyperglycosylated hCG; UPSIDE, Understanding Pregnancy Signals and Infant Development.
Table 3.
BKMR estimated PIPs for each PFAS in estimation of mixture effect on different forms of hCG among pregnant women in the UPSIDE study (). The PIP ranks the single PFAS chemicals by strength of contribution to the effect of the PFAS mixture on specific hCG.
| PFAS | ||
|---|---|---|
| PFDA | 0.76 | 0.31 |
| PFPeA | 0.17 | 0.18 |
| PFUnDA | 0.44 | 0.19 |
| PFHxS | 0.59 | 0.91 |
| PFNA | 0.42 | 0.25 |
| PFOA | 0.52 | 0.27 |
| PFOS | 0.45 | 0.22 |
Note: Models were adjusted for prepregnancy BMI, age, race/ethnicity, age, education, and smoking status at the first trimester. The PIP shows the likelihood that a specific chemical within the group would be included in the model, and PIP can be used to rank the chemicals by strength of contribution to the mixture effect. This is an output of the BKMR model. It provides evidence to rank PFAS compounds by strength of association. The PIP is bounded by 0 and 1 and does not have a measure of uncertainty. BKMR, Bayesian kernel machine regression; BMI, body mass index; hCG, human chorionic gonadotropin; , human chorionic gonadotropin alpha; , human chorionic gonadotropin beta; PFDA, perfluorodecanoic acid; PFHxS, perfluorohexanesulfonic acid; PFNA, perfluorononanoic acid; PFOA, perfluorooctanoic acid; PFOS, perfluorooctanesulfonic acid; PFPeA, perfluoropentanoic acid; PFUnDA: perfluoroundecanoic acid; PIP, posterior inclusion probabilities; UPSIDE, Understanding Pregnancy Signals and Infant Development.
Single PFAS Associations by Subgroups, and Analysis of Robustness
To identify robust subgroup associations in the single chemical analysis, interaction -values were compared across the three analytical approaches (i.e., sensitivity analysis) to address missing data/selection bias, confounding bias, and left truncation bias due to imputation of values below detection (Table 4; Tables S6–S12, S18). Robustness refers here to consistency of association across the original analysis and the sensitivity analyses in direction of association and in the test of interaction (interaction ; see Tables 4 and 5 indicated by footnote). According to these criteria, maternal race/ethnicity was the strongest and most consistent modifier of the PFAS and hCG association. Of 28 associations, 5 were modified by maternal race/ethnicity (PFPeA and , PFPeA and h-hCG, PFuNDA and , PFNA and , PFOA and ), 5 by education (PFPeA and , PFPeA and h-hCG, PFNA and , PFNA and hCG, PFNA and h-hCG), and 2 by fetal sex (PFPeA and and PFNA and h-hCG). Income was evaluated and was not an effect modifier of PFAS-hCG (Table S18). PFPeA was negatively associated with (beta coefficient , 95% CI: , ) and h-hCG (; 95% CI: , ) in Black women and in women with a high school education [ (95% CΙ: , ), (95% CI: , )]. PFOA had a positive association with in Hispanic women only (0.52; 95% CI: 0.00, 1.04). Findings in Asian (3.7%), Hispanic (11%), and Mixed race (4.3%) groups were inconclusive due to sample size. PFNA was negatively associated with , intact hCG, and h-hCG in women with a college education (coefficients averaged ; 95% CI: , ). PFNA was negatively associated with in White participants (; 95% CI: , ). The analysis did not yield evidence of consistent differences between women carrying female and women carrying male fetuses, with two exceptions. PFNA was negatively associated with h-hCG in women carrying male fetuses (; 95% CI: , ; interaction -value: 0.09), and PFPeA was negatively associated with in women carrying males (; 95% CI: , ; interaction -value: 0.02) (Table 5).
Table 4.
Adjusted linear associations (beta coefficients, 95% CIs) of serum PFAS and hCG by maternal race/ethnicity and education subgroups in UPSIDE study participants (). Models are adjusted for prepregnancy BMI, age, race/ethnicity, income, education, and smoking status at the first trimester. Interaction -values are presented to indicate where there are meaningful differences between subgroups.
| PFAS by race/ethnicity | Maternal race/ethnicity | PFAS by education | Education | ||||||
|---|---|---|---|---|---|---|---|---|---|
| Hispanic | White | Black | Asian | Mixed race | High School | ||||
| PFDA | |||||||||
| 0.07 | (, 0.06) | (, ) | (, 0.11) | (, 0.19) | (, 0.53) | 0.63 | (, 0.04) | (, ) | |
| 0.03 | (, 0.13) | (, 0.11) | (, ) | 0.30 (, 0.73) | (, 0.23) | 0.99 | (, 0.11) | (, 0.03) | |
| h-hCG | 0.18 | 0.01 (, 0.39) | (, 0.10) | (, ) | 0.12 (, 0.58) | (, 0.07) | 0.51 | (, 0.18) | (, 0.03) |
| hCG | 0.64 | (, 0.14) | (, 0.01) | (, 0.02) | 0.07 (, 0.38) | (, 0.16) | 0.42 | (, 0.09) | (, ) |
| PFPeA | |||||||||
| 0.55 | (,0.08) | (, 0.04) | (, 0.05) | (, 0.18) | 0.18 (, 0.44) | 0.35 | 0.01 (, 0.09) | (, 0.01) | |
| 0.05a | 0.01 (, 0.22) | 0.02 (, 0.10) | (, ) | 0.05 (, 0.37) | 0.07 (, 0.45) | 0.04a | (, ) | 0.01 (, 0.09) | |
| h-hCG | 0.04a | (, 0.17) | (, 0.07) | (, ) | 0.12 (, 0.46) | 0.04 (, 0.43) | 0.04a | (, ) | (, 0.06) |
| hCG | 0.17 | (, 0.13) | (, 0.04) | (, ) | 0.01 (, 0.24) | 0.02 (, 0.29) | 0.22a | (, ) | (, 0.02) |
| PFUnDA | |||||||||
| a | (, 0.18) | (, 0.02) | 0.09 (, 0.22) | (, ) | (, 0.03) | 0.15 | 0.02 (, 0.14) | (, 0.00) | |
| 0.01 | (, 0.18) | 0.03 (, 0.14) | (, ) | 0.57 (0.15, 0.99) | 0.21 (, 0.85) | 0.11 | (, 0.04) | 0.03 (, 0.14) | |
| h-hCG | 0.29 | 0.07 (, 0.42) | 0.01 (, 0.13) | (, 0.08) | 0.37 (, 0.82) | 0.32 (, 1.01) | 0.32 | (, 0.11) | 0.04 (, 0.15) |
| hCG | 0.36 | 0.01 (, 0.25) | (, 0.06) | (, 0.07) | 0.24 (, 0.55) | 0.22 (, 0.69) | 0.38 | (, 0.06) | 0.00 (, 0.08) |
| PFHxS | |||||||||
| 0.18a | (, 0.45) | 0.15 (, 0.32) | 0.04 (, 0.28) | (, ) | 0.23 (, 0.93) | 0.38 | 0.01 (, 0.23) | 0.13 (, 0.30) | |
| 0.14 | (, 0.46) | 0.27 (0.03, 0.52) | 0.38 (0.02, 0.73) | 2.40 (0.43, 4.38) | 0.31 (, 1.32) | 0.36 | 0.42 (0.10, 0.74) | 0.24 (, 0.48) | |
| h-hCG | 0.41 | (, 0.53) | 0.15 (, 0.42) | 0.27 (, 0.65) | 1.82 (, 3.95) | 0.44 (, 1.53) | 0.90 | 0.21 (, 0.56) | 0.19 (, 0.45) |
| hCG | 0.60 | 0.17 (0.00, 0.35) | 0.25 (, 0.51) | 0.87 (, 2.30) | 0.39 (, 1.12) | 0.18 (, 0.37) | 0.74 | 0.23 (0.00, 0.46) | 0.18 (0.00, 0.36) |
| PFNA | |||||||||
| 0.03a | (, 0.25) | (, ) | 0.03 (, 0.19) | (, ) | (, 0.32) | 0.48 | (, 0.00) | (, 0.04) | |
| 0.15 | (, 0.40) | (, 0.07) | (, 0.23) | 0.94 (, 1.98) | (, 0.30) | 0.04a | 0.11 (, 0.33) | (, ) | |
| h-hCG | 0.12 | 0.27 (, 0.97) | (, ) | 0.01 (, 0.26) | 0.76 (, 1.86) | (, 0.53) | 0.14a | 0.02 (, 0.25) | (, ) |
| hCG | 0.06 | 0.00 (, 0.47) | (, ) | 0.05 (, 0.22) | 0.46 (, 1.19) | (, 0.22) | 0.08a | 0.01 (, 0.17) | (, ) |
| PFOA | |||||||||
| 0.11 | (, 0.04) | (, 0.06) | (, 0.04) | (, ) | 0.27 (, 0.86) | 0.20 | (, ) | (, 0.04) | |
| 0.01a | 0.52 (0.00, 1.04) | (, 0.15) | (, 0.04) | 0.35 (, 0.99) | (, ) | 0.68 | (, 0.14) | (, 0.13) | |
| h-hCG | 0.07 | 0.42 (, 0.98) | (, 0.00) | (, ) | (, 0.67) | (, ) | 0.43 | (, ) | (, 0.02) |
| hCG | 0.02 | 0.32 (, 0.70) | (, 0.03) | (, ) | 0.11 (, 0.57) | (, ) | 0.45 | (, 0.01) | (, 0.04) |
| PFOS | |||||||||
| 0.56 | 0.22 (, 0.63) | (, 0.09) | (, 0.20) | (, 0.32) | 0.25 (, 1.01) | 0.69 | (, 0.14) | (, 0.12) | |
| 0.15 | 0.42 (, 1.03) | 0.00 (, 0.19) | (, 0.36) | 0.49 (, 1.52) | (, ) | 0.73 | 0.06 (, 0.36) | 0.00 (, 0.20) | |
| h-hCG | 0.19 | 0.47 (, 1.12) | (, 0.09) | 0.01 (, 0.41) | 0.10 (, 1.20) | (, 0.04) | 0.54 | 0.02 (, 0.33) | (, 0.11) |
| hCG | 0.05 | 0.38 (, 0.82) | (, 0.07) | 0.00 (, 0.27) | 0.36 (, 1.10) | (, ) | 0.38 | 0.05 (, 0.26) | (, 0.08) |
Note: PFAS, perfluoroalkyl substances; PFDA, perfluorodecanoic acid; PFHxS, perfluorohexanesulfonic acid; PFNA, perfluorononanoic acid; PFOA, perfluorooctanoic acid; PFOS, perfluorooctanesulfonic acid; PFPeA, perfluoropentanoic acid; PFUnDA, perfluoroundecanoic acid; UPSIDE, Understanding Pregnancy Signals and Infant Development.
Interactions that were robust to sensitivity analyses: a) imputation by multichained equations to evaluate selection bias for 40 participants missing PFAS and covariate values (); b) inverse probability weighting () to reduce confounding; and c) PFAS tertile regressions () to address bias due to left truncation of PFAS distribution, where of PFAS values were below detection (Table S17).
Table 5.
Adjusted linear associations (beta coefficients, 95% CIs) of serum PFAS and hCG by fetal sex subgroups in UPSIDE study participants (). Models are adjusted for prepregnancy BMI, age, race/ethnicity, income, education, and smoking status at the first trimester. Interaction -values are presented to indicate where there are meaningful differences between male and female pregnancies.
| PFAS by fetal sex | Fetal sex | ||
|---|---|---|---|
| Male | Female | ||
| PFDA | |||
| 0.93 | (, ) | (, ) | |
| 0.44 | (, 0.09) | (, 0.02) | |
| h-hCG | 0.91 | (, 0.07) | (, 0.09) |
| hCG | 0.53 | (, 0.03) | (, ) |
| PFPeA | |||
| 0.13 | 0.01 (, 0.07) | (, 0.00) | |
| 0.38 | (, 0.09) | (, 0.03) | |
| h-hCG | 0.84 | (, 0.04) | (, 0.02) |
| hCG | 0.17 | (, 0.05) | (, ) |
| PFUnDA | |||
| 0.02a | (, ) | 0.02 (, 0.11) | |
| 0.67 | 0.01 (, 0.14) | (, 0.10) | |
| h-hCG | 0.98 | 0.01 (, 0.15) | 0.01 (, 0.15) |
| hCG | 0.86 | (, 0.07) | (, 0.08) |
| PFHxS | |||
| 0.80 | 0.07 (, 0.26) | 0.10 (, 0.28) | |
| 0.74 | 0.34 (0.06, 0.62) | 0.28 (0.02, 0.54) | |
| h-hCG | 0.52 | 0.14 (, 0.43) | 0.27 (, 0.55) |
| hCG | 0.75 | 0.18 (, 0.37) | 0.22 (0.03, 0.41) |
| PFNA | |||
| 0.69 | (, 0.06) | (, 0.00) | |
| 0.35 | (, 0.07) | (, 0.17) | |
| h-hCG | 0.09a | (, ) | (, 0.18) |
| hCG | 0.35 | (, 0.00) | (, 0.07) |
| PFOA | |||
| 0.72 | (, 0.03) | (, 0.00) | |
| 0.74 | (, 0.11) | (, 0.16) | |
| h-hCG | 0.53 | (, ) | (, 0.05) |
| hCG | 0.87 | (, 0.02) | (, 0.04) |
| PFOS | |||
| 0.51 | 0.00 (, 0.16) | (, 0.09) | |
| 0.51 | 0.07 (, 0.30) | (, 0.20) | |
| h-hCG | 0.79 | (, 0.21) | (, 0.17) |
| hCG | 0.68 | (, 0.16) | (, 0.11) |
Note: CI, confidence interval; hCG, human chorionic gonadotropic; , hCG alpha; , hCG beta; h-hCG, hyperglycosylated hCG; PFAS, perfluoroalkyl substances; PFDA, perfluorodecanoic acid; PFHxS, perfluorohexanesulfonic acid; PFNA, perfluorononanoic acid; PFOA, perfluorooctanoic acid; PFOS, perfluorooctanesulfonic acid; PFPeA, perfluoropentanoic acid; PFUnDA, perfluoroundecanoic acid; UPSIDE, Understanding Pregnancy Signals and Infant Development.
Interactions were robust to sensitivity analyses: a) imputation by multichained equations to evaluate selection bias for 40 participants missing PFAS and covariate values (); b) inverse probability weighting () to reduce confounding; and c) PFAS tertile regressions () to address bias due to left truncation of PFAS distribution, where of PFAS values were below detection (Table S17).
Discussion
To the best of our knowledge, this is the first epidemiological investigation to quantify associations between PFAS and hCG levels, a measure of placental function. Of the seven PFAS analyzed here, PFHxS was positively associated with first-trimester , and PFDA was negatively associated with hCG across different analytical approaches used to minimize selection bias due to missing data, imbalances in covariates, and PFAS detection rates . This finding was corroborated by the mixture analysis in which PFHxS and PFDA were both the strongest contributors to the overall PFAS association with and , respectively. PFPeA and PFNA were associated with hCG within social determinant subgroups, suggesting that these PFAS may be factors contributing to health disparity in pregnancy. The UPSIDE study was not designed to study subgroup specific effects. These analyses are exploratory and should be interpreted with caution.
Of the four forms of hCG, PFAS were more often associated with the alpha and the beta subunits. The PFAS mixture was negatively associated with , and positively associated with (CIs included the null). This supports the theory that different subunits of hCG are regulated in distinct ways, given the same exposure. This may be explained by receptor-mediated actions of the alpha,68 beta,39 and hyperglycosylated forms.69 It may also point to differences in PFAS susceptibility between maternal and placental target tissues, given the alpha subunit also originates in the maternal pituitary.70 This is only a hypothesis, and mechanistic work to understand the molecular and causal bases of these subunit differences is warranted. These studies can be conducted using placental tissue samples and/or by modeling these processes in vitro using human primary tissue. Based on our findings, we posit that there is a need in epidemiological research to measure the alpha and beta forms of hCG in pregnancy, especially in the first trimester when serum levels of the alpha and beta subunits are not well correlated.43
One of the strongest findings in the present study was the association of PFHxS and hCG in maternal serum. Recently, we reported in the same sample a positive association of serum PFHxS (measured at a single time point in the second trimester) with testosterone in women carrying male fetuses.71 Because hCG is capable of binding the LHCGR in testis and stimulating testosterone synthesis,72 it is plausible that the regulation of maternal testosterone synthesis (ovary, adrenal, adipose tissue) by PFHxS is mediated by hCG. Thus, we theorize that there may be a common mechanism of PFHxS toxicity in pregnancy that results in higher levels of hCG by way of activation of the receptor. In turn, placental hCG regulates maternal and fetal steroidogenesis. However, this mechanism remains to be experimentally validated. In future analyses, these exposures and hormonal biomarkers can be analyzed jointly (maternal–placental–fetal), and in association with hormone-sensitive outcomes in the mothers and children.
Our findings add to the literature by suggesting that PFHxS is distinguished from other PFAS in its association with placental and steroid hormone levels.73,74 This association may be explained by its longer half-life (i.e. 8.5–15 y) in the body in comparison with other PFAS.75–78 Collectively these studies support further evaluation of PFHxS as an endocrine disruptor during pregnancy and hCG as a mediator and readily measurable reporter molecule for the toxicity of PFHxS.
PFAS activation of the receptor may be the biological mechanism that explains these associations. PFAS can bind and activate the human receptor.79 is widely expressed in the placenta, regulates hCG synthesis, and may have a role in placental and fetal steroidogenesis more broadly.80–82 We do not have an explanation for why PFHxS had a positive effect on hCG and PFDA had a negative effect. We note that PFDA was the greatest contributor to the negative effect of the PFAS mixture on . Hence, one explanation is that PFDA is affecting the maternal pituitary production of through one mechanism, and PFHxS is affecting the placental production of and the heterodimeric forms through a separate mechanism. The PFAS have different activation potencies, which could explain why some PFAS were associated with hCG and others were not. The ordering of human activation potency for chemicals measured in one study was: .79
Effect measure modification was studied in detail here to detect factors that may explain differences in the magnitude and direction of associations and that explain race/ethnicity and social disparities in the associations with PFAS. Of the four modifiers of associations evaluated, maternal race/ethnicity was the strongest and accounted for differences in magnitude and direction of association. In the framework of this analysis, membership in marginalized vs. privileged groups based on race/ethnicity is a cause of a pregnant person’s lived experience (Figure 1). This is mapped to a causal pathway that includes different types of discrimination, including access to education and the degree to which a person experiences and internalizes the effects of systemic racism.54 In this context, it is recommended that researchers consider race/ethnicity as an effect modifier at the population level.54 Vulnerability in this context is not only defined by higher exposures in one group vs. another but by the full pathway by which stressors in the physical and social environments (“above the skin”) are transferred and translate to physiological and molecular changes “below” the skin. Racial disparities in exposure to endocrine-disrupting chemicals and reproductive health outcomes are well documented. However, it is not understood why or how certain subgroups are more vulnerable than others, given the same or even lower exposure.83–85 We found that the associations here were modified by education but not by income, even though PFAS has been associated with income across other studies.86 This difference may be due to challenges we had in measuring income, missingness of the data, and the fact that some participants, given recruitment took place at an academic hospital, were academic scientists in training. In that situation, maternal income does not reflect maternal education, past income, or future income. This analysis is motivated by the idea that social determinants of health may work to distinguish vulnerable subpopulations and ultimately to provide more salient information on causes of disparities and ideas for intervention. PFPeA was associated with hCG in vulnerable subpopulations as determined by race/ethnicity and education. There is virtually no human toxicity information available for PFPeA. More work is needed to understand the potential implications.
In a comparison across studies on PFAS measured in pregnancy, the UPSIDE study levels were generally lower than those reported in earlier studies and similar to those measured in pregnant women in San Francisco at about the same time.50,87–90 However, PFHxS was slightly higher in our sample in comparison with other samples. Though PFHxS was also phased out in the United States,91 it has a longer half-life than PFOA and PFOS, which may explain why it continues to increase in the population.92 Production and use continued beyond 2000.93 It is also possible that there are regional differences in exposure sources and environmental levels and/or exposure routes that account for differences between the Rochester and San Francisco PFHxS levels.
Findings on maternal race/ethnicity differences in the association were sensitive to the potential differential loss of Black and Hispanic women between the first and second trimester study visits (this study was not designed specifically to study race/ethnic differences). To address this issue of imbalance in the available data, sensitivity analyses were carried out using imputation and IPW. In the nonimputed dataset, among Black women there were stronger negative PFAS-hCG associations in comparison with White women, and the CIs were generally wider due to smaller sample size. A subset of these differences in PFOA, PFHxS, PFNA, PFPeA, and PFUnDA associations with hCG were robust to the missing data. The mixtures analysis (Bayesian statistics) served as a validation of the single chemical regression analysis (frequentist statistics). Both analyses led to the same finding of PFHxS and PFDA being associated with hCG. Based on the BKMR, we conclude that the linear models were adequate and the PFAS chemicals did not interact strongly with each other.
Future work is needed to examine the relevance of these associations of PFAS and placental hCG on child neurodevelopment and other outcomes.94 This analysis can be enhanced by the inclusion of thyroid hormone, which is involved in fetal brain development. Maternal thyroid hormone is necessary for normal fetal brain development.95 Maternal PFHxS in pregnancy was negatively associated with thyroxine (T4) in 726 pregnancies,90 and hCG regulates maternal thyroid hormone production in the first trimester.96,97
The timing of exposure relative to outcome was a limitation in this analysis. The assumption is made here that second-trimester PFAS levels were representative of first-trimester PFAS levels, which were not measured in this study. This is supported by the long half-life of PFAS in the body (average of 4 y) and the stability in PFAS levels in the first- and third-trimester maternal plasma, and across two consecutive pregnancies.14–16 We believe that the potential for bias due to the reverse temporality of the associations was minimal. PFAS did not vary by gestational age at time of blood draw within the second trimester. Based on this and the long half-life of PFAS, we assumed a priori that PFAS levels within person over the time period of study were stable and the relative ranking of individuals by exposure was also stable across the first and second trimesters. Our analysis, reported separately, using the same second-trimester PFAS measures and sex steroid hormones measured in all three trimesters found that associations were generally similar across trimesters and became stronger from the first to third trimesters.73 If this trend is the same with placental hCG, we would predict stronger associations with temporally matched PFAS and hCG measures in the second and third trimesters. Similar to the maternal sex steroids measured in the UPSIDE study,73 increases over the course of pregnancy.45 This may explain why first-trimester was more likely to be associated with second-trimester PFAS, in comparison with the other forms of hCG that decreased from first to second trimester. Another limitation is residual confounding based on unmeasured social factors related to systemic and individual-level experiences of racism as depicted in Figure 1. Last but not least, the small sample size in Hispanic, Asian, and Mixed race groups may limit our interpretation in these groups.
Conclusion
To the best of our knowledge, this is the first study to estimate associations of PFAS and hCG, an essential and abundant placental hormone. Effect sizes (per log unit increase in PFAS) were generally equivalent to a one standard deviation shift in serum hCG. PFAS associations with hCG were modified by racial/ethnic groups and by education status. These data were analyzed as part of a pathway that links proximal factors related to physiology, diet, and health behaviors with more distal historical factors related to membership in marginalized vs. privileged groups. The subunit specific effects hold special importance as is also produced by maternal and fetal pituitaries and may be a marker for neuroendocrine function and stress.46,98–100 Findings require confirmation in a study that is well powered to address racial and ethnic subpopulations and in which detailed information is available on individual and group level experience of racism, discrimination, economic and social circumstances, and diet. This work contributes to the growing literature on PFAS toxicity in pregnancy. Better understanding the clinical implications of these results is an important next step. Although we cannot directly address that question in the current analysis, given the importance of hCG to successful pregnancy as well as fetal development (e.g., reproductive development, neurodevelopment), future experimental and epidemiological research is needed to test whether PFAS-related changes in hCG have long-term health impacts.
Supplementary Material
Acknowledgments
H.W.L., J.J.A., J.W., Q.Y., X.X., E.S.B., and T.C. were supported by R01ES029336. H.K. is supported by the Sigrid Jusélius Foundation. E.S.B., T.C., and R.K. are supported by R01HD083369, UG3/UH3OD023349, P30 ES005022.
Conclusions and opinions are those of the individual authors and do not necessarily reflect the policies or views of EHP Publishing or the National Institute of Environmental Health Sciences.
References
- 1.Buck RC, Franklin J, Berger U, Conder JM, Cousins IT, de Voogt P, et al. 2011. Perfluoroalkyl and polyfluoroalkyl substances in the environment: terminology, classification, and origins. Integr Environ Assess Manag 7(4):513–541, PMID: , 10.1002/ieam.258. [DOI] [PMC free article] [PubMed] [Google Scholar]
- 2.US EPA (US Environmental Protection Agency). 2017. Technical Fact Sheet–Perfluorooctane Sulfonate (PFOS) and Perfluorooctanoic Acid (PFOA), November 2017. https://19january2021snapshot.epa.gov/sites/static/files/2017-12/documents/ffrrofactsheet_contaminants_pfos_pfoa_11-20-17_508_0.pdf [accessed 17 August 2022].
- 3.Wang Z, DeWitt JC, Higgins CP, Cousins IT. 2017. A never-ending story of per- and polyfluoroalkyl substances (PFASs)? Environ Sci Technol 51(5):2508–2518, PMID: , 10.1021/acs.est.6b04806. [DOI] [PubMed] [Google Scholar]
- 4.US EPA (US Environmental Protection Agency). 2017. The Third Unregulated Contaminant Monitoring Rule (UCMR 3): Data Summary, January 2017. https://www.epa.gov/sites/default/files/2017-02/documents/ucmr3-data-summary-january-2017.pdf [accessed 15 September 2022].
- 5.Greaves AK, Letcher RJ. 2013. Linear and branched perfluorooctane sulfonate (PFOS) isomer patterns differ among several tissues and blood of polar bears. Chemosphere 93(3):574–580, PMID: , 10.1016/j.chemosphere.2013.07.013. [DOI] [PubMed] [Google Scholar]
- 6.Teunen L, Bervoets L, Belpaire C, De Jonge M, Groffen T. 2021. PFAS accumulation in indigenous and translocated aquatic organisms from Belgium, with translation to human and ecological health risk. Environ Sci Eur 33(1):39, 10.1186/s12302-021-00477-z. [DOI] [Google Scholar]
- 7.Houde M, De Silva AO, Muir DCG, Letcher RJ. 2011. Monitoring of perfluorinated compounds in aquatic biota: an updated review. Environ Sci Technol 45(19):7962–7973, PMID: , 10.1021/es104326w. [DOI] [PubMed] [Google Scholar]
- 8.ATSDR (Agency for Toxic Substances and Disease Registry). PFAS in the U.S. Population. https://www.atsdr.cdc.gov/pfas/health-effects/us-population.html [accessed 15 September 2022].
- 9.US CDC (US Centers for Disease Control and Prevention). National Report on Human Exposure to Environmental Chemicals. https://www.cdc.gov/exposurereport/ [accessed 15 September 2022].
- 10.Sun JM, Kelly BC, Gobas F, Sunderland EM. 2022. A food web bioaccumulation model for the accumulation of per- and polyfluoroalkyl substances (PFAS) in fish: how important is renal elimination?. Environ Sci Process Impacts 24(8):1152–1164, PMID: , 10.1039/d2em00047d. [DOI] [PMC free article] [PubMed] [Google Scholar]
- 11.Sagiv SK, Rifas-Shiman SL, Webster TF, Mora AM, Harris MH, Calafat AM, et al. 2015. Sociodemographic and perinatal predictors of early pregnancy per- and polyfluoroalkyl substance (PFAS) concentrations. Environ Sci Technol 49(19):11849–11858, PMID: , 10.1021/acs.est.5b02489. [DOI] [PMC free article] [PubMed] [Google Scholar]
- 12.Li Y, Fletcher T, Mucs D, Scott K, Lindh CH, Tallving P, et al. 2018. Half-lives of PFOS, PFHxS and PFOA after end of exposure to contaminated drinking water. Occup Environ Med 75(1):46–51, PMID: , 10.1136/oemed-2017-104651. [DOI] [PMC free article] [PubMed] [Google Scholar]
- 13.Xu Y, Fletcher T, Pineda D, Lindh CH, Nilsson C, Glynn A, et al. 2020. Serum half-lives for short- and long-chain perfluoroalkyl acids after ceasing exposure from drinking water contaminated by firefighting foam. Environ Health Perspect 128(7):77004, PMID: , 10.1289/EHP6785. [DOI] [PMC free article] [PubMed] [Google Scholar]
- 14.Fisher M, Arbuckle TE, Liang CL, LeBlanc A, Gaudreau E, Foster WG, et al. 2016. Concentrations of persistent organic pollutants in maternal and cord blood from the Maternal-Infant Research on Environmental Chemicals (MIREC) cohort study. Environ Health 15(1):59, PMID: , 10.1186/s12940-016-0143-y. [DOI] [PMC free article] [PubMed] [Google Scholar]
- 15.Papadopoulou E, Haug LS, Sabaredzovic A, Eggesbø M, Longnecker MP. 2015. Reliability of perfluoroalkyl substances in plasma of 100 women in two consecutive pregnancies. Environ Res 140:421–429, PMID: , 10.1016/j.envres.2015.04.022. [DOI] [PMC free article] [PubMed] [Google Scholar]
- 16.US CDC. Perfluorochemicals: General Information. https://www.cdc.gov/biomonitoring/PFAS_BiomonitoringSummary.html [accessed 1 June 2023].
- 17.Preston EV, Hivert M-F, Fleisch AF, Calafat AM, Sagiv SK, Perng W, et al. 2022. Early-pregnancy plasma per- and polyfluoroalkyl substance (PFAS) concentrations and hypertensive disorders of pregnancy in the project viva cohort. Environ Int 165:107335, PMID: , 10.1016/j.envint.2022.107335. [DOI] [PMC free article] [PubMed] [Google Scholar]
- 18.Huang R, Chen Q, Zhang L, Luo K, Chen L, Zhao S, et al. 2019. Prenatal exposure to perfluoroalkyl and polyfluoroalkyl substances and the risk of hypertensive disorders of pregnancy. Environ Health 18(1):5, PMID: , 10.1186/s12940-018-0445-3. [DOI] [PMC free article] [PubMed] [Google Scholar]
- 19.Shapiro GD, Dodds L, Arbuckle TE, Ashley-Martin J, Ettinger AS, Fisher M, et al. 2016. Exposure to organophosphorus and organochlorine pesticides, perfluoroalkyl substances, and polychlorinated biphenyls in pregnancy and the association with impaired glucose tolerance and gestational diabetes mellitus: the MIREC study. Environ Res 147:71–81, PMID: , 10.1016/j.envres.2016.01.040. [DOI] [PubMed] [Google Scholar]
- 20.Matilla-Santander N, Valvi D, Lopez-Espinosa M-J, Manzano-Salgado CB, Ballester F, Ibarluzea J, et al. 2017. Exposure to perfluoroalkyl substances and metabolic outcomes in pregnant women: evidence from the Spanish INMA birth cohorts. Environ Health Perspect 125(11):117004, PMID: , 10.1289/EHP1062. [DOI] [PMC free article] [PubMed] [Google Scholar]
- 21.Wang H, Yang J, Du H, Xu L, Liu S, Yi J, et al. 2018. Perfluoroalkyl substances, glucose homeostasis, and gestational diabetes mellitus in Chinese pregnant women: a repeat measurement-based prospective study. Environ Int 114:12–20, PMID: , 10.1016/j.envint.2018.01.027. [DOI] [PubMed] [Google Scholar]
- 22.Liu X, Zhang L, Chen L, Li J, Wang Y, Wang J, et al. 2019. Structure-based investigation on the association between perfluoroalkyl acids exposure and both gestational diabetes mellitus and glucose homeostasis in pregnant women. Environ Int 127:85–93, PMID: , 10.1016/j.envint.2019.03.035. [DOI] [PubMed] [Google Scholar]
- 23.Wikström S, Lin P-I, Lindh CH, Shu H, Bornehag C-G. 2020. Maternal serum levels of perfluoroalkyl substances in early pregnancy and offspring birth weight. Pediatr Res 87(6):1093–1099, PMID: , 10.1038/s41390-019-0720-1. [DOI] [PMC free article] [PubMed] [Google Scholar]
- 24.Kashino I, Sasaki S, Okada E, Matsuura H, Goudarzi H, Miyashita C, et al. 2020. Prenatal exposure to 11 perfluoroalkyl substances and fetal growth: a large-scale, prospective birth cohort study. Environ Int 136:105355, PMID: , 10.1016/j.envint.2019.105355. [DOI] [PubMed] [Google Scholar]
- 25.Marks KJ, Cutler AJ, Jeddy Z, Northstone K, Kato K, Hartman TJ. 2019. Maternal serum concentrations of perfluoroalkyl substances and birth size in British boys. Int J Hyg Environ Health 222(5):889–895, PMID: , 10.1016/j.ijheh.2019.03.008. [DOI] [PMC free article] [PubMed] [Google Scholar]
- 26.Jensen TK, Andersen LB, Kyhl HB, Nielsen F, Christesen HT, Grandjean P. 2015. Association between perfluorinated compound exposure and miscarriage in Danish pregnant women. PLoS One 10(4):e0123496, PMID: , 10.1371/journal.pone.0123496. [DOI] [PMC free article] [PubMed] [Google Scholar]
- 27.Wikström S, Hussein G, Lingroth Karlsson A, Lindh CH, Bornehag C-G. 2021. Exposure to perfluoroalkyl substances in early pregnancy and risk of sporadic first trimester miscarriage. Sci Rep 11(1):3568, PMID: , 10.1038/s41598-021-82748-6. [DOI] [PMC free article] [PubMed] [Google Scholar]
- 28.Kovo M, Bar J, Schreiber L, Shargorodsky M. 2017. The relationship between hypertensive disorders in pregnancy and placental maternal and fetal vascular circulation. J Am Soc Hypertens 11(11):724–729, PMID: , 10.1016/j.jash.2017.09.001. [DOI] [PubMed] [Google Scholar]
- 29.Jarmuzek P, Wielgos M, Bomba-Opon D. 2015. Placental pathologic changes in gestational diabetes mellitus. Neuro Endocrinol Lett 36(2):101–105, PMID: . [PubMed] [Google Scholar]
- 30.Janthanaphan M, Kor-Anantakul O, Geater A. 2006. Placental weight and its ratio to birth weight in normal pregnancy at Songkhlanagarind Hospital. J Med Assoc Thai 89(2):130–137, PMID: . [PubMed] [Google Scholar]
- 31.Jauniaux E, Poston L, Burton GJ. 2006. Placental-related diseases of pregnancy: Involvement of oxidative stress and implications in human evolution. Hum Reprod Update 12(6):747–755, PMID: , 10.1093/humupd/dml016. [DOI] [PMC free article] [PubMed] [Google Scholar]
- 32.Griffiths SK, Campbell JP. 2014. Placental structure, function and drug transfer. Continuing Education in Anaesthesia Critical Care & Pain 15(2):84–89, 10.1093/bjaceaccp/mku013. [DOI] [Google Scholar]
- 33.Appel M, Forsthuber M, Ramos R, Widhalm R, Granitzer S, Uhl M, et al. 2022. The transplacental transfer efficiency of per- and polyfluoroalkyl substances (PFAS): a first meta-analysis. J Toxicol Environ Health B Crit Rev 25(1):23–42, PMID: , 10.1080/10937404.2021.2009946. [DOI] [PubMed] [Google Scholar]
- 34.Blake BE, Cope HA, Hall SM, Keys RD, Mahler BW, McCord J, et al. 2020. Evaluation of maternal, embryo, and placental effects in CD-1 mice following gestational exposure to perfluorooctanoic acid (PFOA) or hexafluoropropylene oxide dimer acid (HFPO-DA or GenX). Environ Health Perspect 128(2):27006, PMID: , 10.1289/EHP6233. [DOI] [PMC free article] [PubMed] [Google Scholar]
- 35.Bangma J, Szilagyi J, Blake BE, Plazas C, Kepper S, Fenton SE, et al. 2020. An assessment of serum-dependent impacts on intracellular accumulation and genomic response of per- and polyfluoroalkyl substances in a placental trophoblast model. Environ Toxicol 35(12):1395–1405, PMID: , 10.1002/tox.23004. [DOI] [PMC free article] [PubMed] [Google Scholar]
- 36.Li J, Quan X, Lei S, Huang Z, Wang Q, Xu P. 2021. PFOS inhibited normal functional development of placenta cells via PPARγ signaling. Biomedicines 9(6):677, PMID: , 10.3390/biomedicines9060677. [DOI] [PMC free article] [PubMed] [Google Scholar]
- 37.Cole LA. 2010. Biological functions of hCG and hCG-related molecules. Reprod Biol Endocrinol 8:102, PMID: , 10.1186/1477-7827-8-102. [DOI] [PMC free article] [PubMed] [Google Scholar]
- 38.Koistinen HK, Stenman U-H. 2020. LH/hCG receptor - independent activities of hCG and hCGbeta. In: 100 Years of Human Chorionic Gonadotropin: Reviews and New Perspectives, Chapter 4.3. Cole LA, Butler SA, eds. Elsevier Inc., 261–268. [Google Scholar]
- 39.Lee C-L, Chiu PCN, Hautala L, Salo T, Yeung WSB, Stenman U-H, et al. 2013. Human chorionic gonadotropin and its free beta-subunit stimulate trophoblast invasion independent of LH/hCG receptor. Mol Cell Endocrinol 375(1–2):43–52, PMID: , 10.1016/j.mce.2013.05.009. [DOI] [PubMed] [Google Scholar]
- 40.Polese B, Gridelet V, Araklioti E, Martens H, Perrier d’Hauterive S, Geenen V. 2014. The endocrine milieu and CD4 T-lymphocyte polarization during pregnancy. Front Endocrinol (Lausanne) 5:106, PMID: , 10.3389/fendo.2014.00106. [DOI] [PMC free article] [PubMed] [Google Scholar]
- 41.Filicori M, Fazleabas AT, Huhtaniemi I, Licht P, Rao CV, Tesarik J, et al. 2005. Novel concepts of human chorionic gonadotropin: reproductive system interactions and potential in the management of infertility. Fertil Steril 84(2):275–284, PMID: , 10.1016/j.fertnstert.2005.02.033. [DOI] [PubMed] [Google Scholar]
- 42.Licht P, Fluhr H, Neuwinger J, Wallwiener D, Wildt L. 2007. Is human chorionic gonadotropin directly involved in the regulation of human implantation?. Mol Cell Endocrinol 269(1–2):85–92, PMID: , 10.1016/j.mce.2006.09.016. [DOI] [PubMed] [Google Scholar]
- 43.Adibi JJ, Zhao Y, Koistinen H, Mitchell RT, Barrett ES, Miller R, et al. 2023. Molecular pathways in placental-fetal development and disruption. Mol Cell Endocrinol 581:112075, 10.1016/j.mce.2023.112075. [DOI] [PMC free article] [PubMed] [Google Scholar]
- 44.Korevaar TIM, Steegers EAP, de Rijke YB, Schalekamp-Timmermans S, Visser WE, Hofman A, et al. 2015. Reference ranges and determinants of total hCG levels during pregnancy: the Generation R Study. Eur J Epidemiol 30(9):1057–1066, PMID: , 10.1007/s10654-015-0039-0. [DOI] [PMC free article] [PubMed] [Google Scholar]
- 45.Nagy AM, Glinoer D, Picelli G, Delogne-Desnoeck J, Fleury B, Courte C, et al. 1994. Total amounts of circulating human chorionic gonadotrophin alpha and beta subunits can be assessed throughout human pregnancy using immunoradiometric assays calibrated with the unaltered and thermally dissociated heterodimer. J Endocrinol 140(3):513–520, PMID: , 10.1677/joe.0.1400513. [DOI] [PubMed] [Google Scholar]
- 46.Birken S, Maydelman Y, Gawinowicz MA, Pound A, Liu Y, Hartree AS. 1996. Isolation and characterization of human pituitary chorionic gonadotropin. Endocrinology 137(4):1402–1411, PMID: , 10.1210/endo.137.4.8625917. [DOI] [PubMed] [Google Scholar]
- 47.Uhlén M, Fagerberg L, Hallström BM, Lindskog C, Oksvold P, Mardinoglu A, et al. 2015. Proteomics. Tissue-based map of the human proteome. Science 347(6220):1260419, PMID: , 10.1126/science.1260419. [DOI] [PubMed] [Google Scholar]
- 48.Kovalevskaya G, Genbacev O, Fisher SJ, Caceres E, O’Connor JF. 2002. Trophoblast origin of hCG isoforms: cytotrophoblasts are the primary source of choriocarcinoma-like hCG. Mol Cell Endocrinol 194(1–2):147–155, PMID: , 10.1016/s0303-7207(02)00135-1. [DOI] [PubMed] [Google Scholar]
- 49.Evans J. 2016. Hyperglycosylated hCG: a unique human implantation and invasion factor. Am J Reprod Immunol 75(3):333–340, PMID: , 10.1111/aji.12459. [DOI] [PubMed] [Google Scholar]
- 50.Gardener H, Sun Q, Grandjean P. 2021. PFAS concentration during pregnancy in relation to cardiometabolic health and birth outcomes. Environ Res 192:110287, PMID: , 10.1016/j.envres.2020.110287. [DOI] [PMC free article] [PubMed] [Google Scholar]
- 51.Kato K, Wong L-Y, Chen A, Dunbar C, Webster GM, Lanphear BP, et al. 2014. Changes in serum concentrations of maternal poly- and perfluoroalkyl substances over the course of pregnancy and predictors of exposure in a multiethnic cohort of Cincinnati, Ohio pregnant women during 2003–2006. Environ Sci Technol 48(16):9600–9608, PMID: , 10.1021/es501811k. [DOI] [PMC free article] [PubMed] [Google Scholar]
- 52.Sagiv SK, Rifas-Shiman SL, Webster TF, Mora AM, Harris MH, Calafat AM, et al. 2015. Sociodemographic and perinatal predictors of early pregnancy per- and polyfluoroalkyl substance (PFAS) concentrations. Environ Sci Technol 49(19):11849–11858, PMID: , 10.1021/acs.est.5b02489. [DOI] [PMC free article] [PubMed] [Google Scholar]
- 53.Bommarito PA, Ferguson KK, Meeker JD, McElrath TF, Cantonwine DE. 2021. Maternal levels of perfluoroalkyl substances (PFAS) during early pregnancy in relation to preeclampsia subtypes and biomarkers of preeclampsia risk. Environ Health Perspect 129(10):107004, PMID: , 10.1289/EHP9091. [DOI] [PMC free article] [PubMed] [Google Scholar]
- 54.Howe CJ, Bailey ZD, Raifman JR, Jackson JW. 2022. Recommendations for using causal diagrams to study racial health disparities. Am J Epidemiol 191(12):1981–1989, PMID: , 10.1093/aje/kwac140. [DOI] [PMC free article] [PubMed] [Google Scholar]
- 55.Yaron Y, Lehavi O, Orr-Urtreger A, Gull I, Lessing JB, Amit A, et al. 2002. Maternal serum HCG is higher in the presence of a female fetus as early as week 3 post-fertilization. Hum Reprod 17(2):485–489, PMID: , 10.1093/humrep/17.2.485. [DOI] [PubMed] [Google Scholar]
- 56.Spencer K, Ong CYT, Liao AWJ, Nicolaides KH. 2000. The influence of ethnic origin on first trimester biochemical markers of chromosomal abnormalities. Prenat Diagn 20(6):491–494, PMID: , 10.1002/1097-0223(200006)20:6<491::AID-PD844>3.0.CO;2-3. [DOI] [PubMed] [Google Scholar]
- 57.O’Connor T, Best M, Brunner J, Ciesla AA, Cunning A, Kapula N, et al. 2021. Cohort profile: Understanding pregnancy signals and infant development (UPSIDE): a pregnancy cohort study on prenatal exposure mechanisms for child health. BMJ Open 11(4):e044798, PMID: , 10.1136/bmjopen-2020-044798. [DOI] [PMC free article] [PubMed] [Google Scholar]
- 58.Knapp EA, Kress AM, Parker CB, Page GP, McArthur K, Gachigi KK, et al. 2023. The environmental influences on child health outcomes (ECHO)-wide cohort. Am J Epidemiol 192(8):1249–1263, PMID: , 10.1093/aje/kwad071. [DOI] [PMC free article] [PubMed] [Google Scholar]
- 59.Honda M, Robinson M, Kannan K. 2018. A rapid method for the analysis of perfluorinated alkyl substances in serum by hybrid solid-phase extraction. Environ Chem 15(2):92–99, 10.1071/EN17192. [DOI] [Google Scholar]
- 60.Adibi JJ, Xun X, Zhao Y, Yin Q, LeWinn K, Bush NR, et al. 2021. Second-trimester placental and thyroid hormones are associated with cognitive development from ages 1 to 3 years. J Endocr Soc 5(5):bvab027, PMID: , 10.1210/jendso/bvab027. [DOI] [PMC free article] [PubMed] [Google Scholar]
- 61.Meloni M, Moll T, Issaka A, Kuzawa CW. 2022. A biosocial return to race? A cautionary view for the postgenomic era. Am J Hum Biol 34(7):e23742, PMID: , 10.1002/ajhb.23742. [DOI] [PMC free article] [PubMed] [Google Scholar]
- 62.Adibi JJ, Lee MK, Saha S, Boscardin WJ, Apfel A, Currier RJ. 2015. Fetal sex differences in human chorionic gonadotropin fluctuate by maternal race, age, weight and by gestational age. J Dev Orig Health Dis 6(6):493–500, PMID: , 10.1017/S2040174415001336. [DOI] [PMC free article] [PubMed] [Google Scholar]
- 63.Adibi JJ, Layden AJ, Yin Q, Xun X, Peddada S, Birru RL. 2021. A toolkit for the application of placental-fetal molecular biomarkers in epidemiologic studies of the fetal origins of chronic disease. Curr Epidemiol Rep 8(1):20–31, PMID: , 10.1007/s40471-020-00258-x. [DOI] [PMC free article] [PubMed] [Google Scholar]
- 64.Bjorvang RD, Mamsen LS. 2022. Sexually dimorphic accumulation of persistent organic pollutants in fetuses. Front Toxicol 4:909307, PMID: , 10.3389/ftox.2022.909307. [DOI] [PMC free article] [PubMed] [Google Scholar]
- 65.van Buuren S, Groothuis-Oudshoorn K. 2011. Mice: Multivariate imputation by chained equations in R. J Stat Soft 45(3):1–67, 10.18637/jss.v045.i03. [DOI] [Google Scholar]
- 66.van der Wal WM, Geskus RB. 2011. Ipw: an R package for inverse probability weighting. J Stat Soft 43(13):1–23, 10.18637/jss.v043.i13. [DOI] [Google Scholar]
- 67.Bobb JF, Valeri L, Claus Henn B, Christiani DC, Wright RO, Mazumdar M, et al. 2015. Bayesian kernel machine regression for estimating the health effects of multi-pollutant mixtures. Biostatistics 16(3):493–508, PMID: , 10.1093/biostatistics/kxu058. [DOI] [PMC free article] [PubMed] [Google Scholar]
- 68.Blithe DL, Richards RG, Skarulis MC. 1991. Free alpha molecules from pregnancy stimulate secretion of prolactin from human decidual cells: a novel function for free alpha in pregnancy. Endocrinology 129(4):2257–2259, PMID: , 10.1210/endo-129-4-2257. [DOI] [PubMed] [Google Scholar]
- 69.Koistinen H, Koel M, Peters M, Rinken A, Lundin K, Tuuri T, et al. 2019. Hyperglycosylated hCG activates LH/hCG-receptor with lower activity than hCG. Mol Cell Endocrinol 479:103–109, PMID: , 10.1016/j.mce.2018.09.006. [DOI] [PubMed] [Google Scholar]
- 70.Hagen C, McNeilly AS. 1975. Identification of human luteinizing hormone, follicle-stimulating hormone, luteinizing hormone beta-subunit and gonadotrophin alpha-subunit in foetal and adult pituitary glands. J Endocrinol 67(1):49–57, PMID: , 10.1677/joe.0.0670049. [DOI] [PubMed] [Google Scholar]
- 71.Rivera-Núñez Z, Kinkade CW, Zhang Y, Rockson A, Bandera EV, Llanos AAM, et al. 2022. Phenols, parabens, phthalates and puberty: a systematic review of synthetic chemicals commonly found in personal care products and girls’ pubertal development. Curr Environ Health Rep 9(4):517–534, PMID: , 10.1007/s40572-022-00366-4. [DOI] [PMC free article] [PubMed] [Google Scholar]
- 72.Huhtaniemi IT, Korenbrot CC, Jaffe RB. 1977. HCG binding and stimulation of testosterone biosynthesis in the human fetal testis. J Clin Endocrinol Metab 44(5):963–967, PMID: , 10.1210/jcem-44-5-963. [DOI] [PubMed] [Google Scholar]
- 73.Rivera-Núñez Z, Kinkade CW, Khoury L, Brunner J, Murphy H, Wang C, et al. 2023. Prenatal perfluoroalkyl substances exposure and maternal sex steroid hormones across pregnancy. Environ Res 220:115233, PMID: , 10.1016/j.envres.2023.115233. [DOI] [PMC free article] [PubMed] [Google Scholar]
- 74.National Academies of Sciences, Engineering, and Medicine. 2022. Guidance on PFAS Exposure, Testing, and Clinical Follow-Up. Washington, DC: The National Academies Press. [PubMed] [Google Scholar]
- 75.Bartell SM, Calafat AM, Lyu C, Kato K, Ryan PB, Steenland K. 2010. Rate of decline in serum PFOA concentrations after granular activated carbon filtration at two public water systems in Ohio and West Virginia. Environ Health Perspect 118(2):222–228, PMID: , 10.1289/ehp.0901252. [DOI] [PMC free article] [PubMed] [Google Scholar]
- 76.Olsen GW, Burris JM, Ehresman DJ, Froehlich JW, Seacat AM, Butenhoff JL, et al. 2007. Half-life of serum elimination of perfluorooctanesulfonate, perfluorohexanesulfonate, and perfluorooctanoate in retired fluorochemical production workers. Environ Health Perspect 115(9):1298–1305, PMID: , 10.1289/ehp.10009. [DOI] [PMC free article] [PubMed] [Google Scholar]
- 77.Mokra K. 2021. Endocrine disruptor potential of short- and long-chain perfluoroalkyl substances (PFASs)-a synthesis of current knowledge with proposal of molecular mechanism. Int J Mol Sci 22(4):2148, PMID: , 10.3390/ijms22042148. [DOI] [PMC free article] [PubMed] [Google Scholar]
- 78.Russell MH, Nilsson H, Buck RC. 2013. Elimination kinetics of perfluorohexanoic acid in humans and comparison with mouse, rat and monkey. Chemosphere 93(10):2419–2425, PMID: , 10.1016/j.chemosphere.2013.08.060. [DOI] [PubMed] [Google Scholar]
- 79.Evans N, Conley JM, Cardon M, Hartig P, Medlock-Kakaley E, Gray LE Jr.. 2022. In vitro activity of a panel of per- and polyfluoroalkyl substances (PFAS), fatty acids, and pharmaceuticals in peroxisome proliferator-activated receptor (PPAR) alpha, PPAR gamma, and estrogen receptor assays. Toxicol Appl Pharmacol 449:116136, PMID: , 10.1016/j.taap.2022.116136. [DOI] [PMC free article] [PubMed] [Google Scholar]
- 80.Handschuh K, Guibourdenche J, Cocquebert M, Tsatsaris V, Vidaud M, Evain-Brion D, et al. 2009. Expression and regulation by PPARgamma; of hCG alpha- and beta-subunits: comparison between villous and invasive extravillous trophoblastic cells. Placenta 30(12):1016–1022, PMID: , 10.1016/j.placenta.2009.09.006. [DOI] [PubMed] [Google Scholar]
- 81.Adibi JJ, Buckley JP, Lee MK, Williams PL, Just AC, Zhao Y, et al. 2017. Maternal urinary phthalates and sex-specific placental mRNA levels in an urban birth cohort. Environ Health 16(1):35, PMID: , 10.1186/s12940-017-0241-5. [DOI] [PMC free article] [PubMed] [Google Scholar]
- 82.Adibi JJ, Whyatt RM, Hauser R, Bhat HK, Davis BJ, Calafat AM, et al. 2010. Transcriptional biomarkers of steroidogenesis and trophoblast differentiation in the placenta in relation to prenatal phthalate exposure. Environ Health Perspect 118(2):291–296, PMID: , 10.1289/ehp.0900788. [DOI] [PMC free article] [PubMed] [Google Scholar]
- 83.Ruiz D, Becerra M, Jagai JS, Ard K, Sargis RM. 2018. Disparities in environmental exposures to endocrine-disrupting chemicals and diabetes risk in vulnerable populations. Diabetes Care 41(1):193–205, PMID: , 10.2337/dc16-2765. [DOI] [PMC free article] [PubMed] [Google Scholar]
- 84.James-Todd TM, Chiu YH, Zota AR. 2016. Racial/ethnic disparities in environmental endocrine disrupting chemicals and women’s reproductive health outcomes: epidemiological examples across the life course. Curr Epidemiol Rep 3(2):161–180, PMID: , 10.1007/s40471-016-0073-9. [DOI] [PMC free article] [PubMed] [Google Scholar]
- 85.Sutton MY, Anachebe NF, Lee R, Skanes H. 2021. Racial and ethnic disparities in reproductive health services and outcomes, 2020. Obstet Gynecol 137(2):225–233, PMID: , 10.1097/AOG.0000000000004224. [DOI] [PMC free article] [PubMed] [Google Scholar]
- 86.Nelson JW, Scammell MK, Hatch EE, Webster TF. 2012. Social disparities in exposures to bisphenol a and polyfluoroalkyl chemicals: a cross-sectional study within NHANES 2003–2006. Environ Health 11(1):10, PMID: , 10.1186/1476-069X-11-10. [DOI] [PMC free article] [PubMed] [Google Scholar]
- 87.Sagiv SK, Rifas-Shiman SL, Fleisch AF, Webster TF, Calafat AM, Ye X, et al. 2018. Early-pregnancy plasma concentrations of perfluoroalkyl substances and birth outcomes in project viva: Confounded by pregnancy hemodynamics?. Am J Epidemiol 187(4):793–802, PMID: , 10.1093/aje/kwx332. [DOI] [PMC free article] [PubMed] [Google Scholar]
- 88.Rahman ML, Zhang C, Smarr MM, Lee S, Honda M, Kannan K, et al. 2019. Persistent organic pollutants and gestational diabetes: a multi-center prospective cohort study of healthy US women. Environ Int 124:249–258, PMID: , 10.1016/j.envint.2019.01.027. [DOI] [PubMed] [Google Scholar]
- 89.Eick SM, Hom Thepaksorn EK, Izano MA, Cushing LJ, Wang Y, Smith SC, et al. 2020. Associations between prenatal maternal exposure to per- and polyfluoroalkyl substances (PFAS) and polybrominated diphenyl ethers (PBDEs) and birth outcomes among pregnant women in San Francisco. Environ Health 19(1):100, PMID: , 10.1186/s12940-020-00654-2. [DOI] [PMC free article] [PubMed] [Google Scholar]
- 90.Preston EV, Webster TF, Claus Henn B, McClean MD, Gennings C, Oken E, et al. 2020. Prenatal exposure to per- and polyfluoroalkyl substances and maternal and neonatal thyroid function in the project viva cohort: a mixtures approach. Environ Int 139:105728, PMID: , 10.1016/j.envint.2020.105728. [DOI] [PMC free article] [PubMed] [Google Scholar]
- 91.Minnesota Department of Health. PFHxS and Groundwater. https://www.health.state.mn.us/communities/environment/risk/docs/guidance/gw/pfhxsinfo.pdf [accessed 1 June 2023].
- 92.Li Y, Fletcher T, Mucs D, Scott K, Lindh CH, Tallving P, et al. 2018. Half-lives of PFOS, PFHxS and PFOA after end of exposure to contaminated drinking water. Occup Environ Med 75(1):46–51, PMID: , 10.1136/oemed-2017-104651. [DOI] [PMC free article] [PubMed] [Google Scholar]
- 93.Cheryl H. 2022. Governments agree to eliminate PFHxS. C En Global Enterp 100(23):14. 10.1021/cen-10023-polcon2. [DOI] [Google Scholar]
- 94.Ames JL, Burjak M, Avalos LA, Braun JM, Bulka CM, Croen LA, et al. 2023. Prenatal exposure to per- and polyfluoroalkyl substances and childhood autism-related outcomes. Epidemiology 34(3):450–459, PMID: , 10.1097/EDE.0000000000001587. [DOI] [PMC free article] [PubMed] [Google Scholar]
- 95.Moog NK, Entringer S, Heim C, Wadhwa PD, Kathmann N, Buss C. 2017. Influence of maternal thyroid hormones during gestation on fetal brain development. Neuroscience 342:68–100, PMID: , 10.1016/j.neuroscience.2015.09.070. [DOI] [PMC free article] [PubMed] [Google Scholar]
- 96.Pekonen F, Alfthan H, Stenman UH, Ylikorkala O. 1988. Human chorionic gonadotropin (hCG) and thyroid function in early human pregnancy: circadian variation and evidence for intrinsic thyrotropic activity of hCG. J Clin Endocrinol Metab 66(4):853–856, PMID: , 10.1210/jcem-66-4-853. [DOI] [PubMed] [Google Scholar]
- 97.Mann K, Hoermann R. 1993. Thyroid stimulation by placental factors. J Endocrinol Invest 16(5):378–384, PMID: , 10.1007/BF03348862. [DOI] [PubMed] [Google Scholar]
- 98.Clements JA, Reyes FI, Winter JS, Faiman C. 1976. Studies on human sexual development. III. Fetal pituitary and serum, and amniotic fluid concentrations of LH, CG, and FSH. J Clin Endocrinol Metab 42(1):9–19, PMID: , 10.1210/jcem-42-1-9. [DOI] [PubMed] [Google Scholar]
- 99.Lähteenmäki P. 1978. The disappearance of HCG and return of pituitary function after abortion. Clin Endocrinol (Oxf) 9(2):101–112, PMID: , 10.1111/j.1365-2265.1978.tb02188.x. [DOI] [PubMed] [Google Scholar]
- 100.Korhonen J, Alfthan H, Ylöstalo P, Veldhuis J, Stenman UH. 1997. Disappearance of human chorionic gonadotropin and its alpha- and beta-subunits after term pregnancy. Clin Chem 43(11):2155–2163, PMID: . [PubMed] [Google Scholar]
Associated Data
This section collects any data citations, data availability statements, or supplementary materials included in this article.