

Abstract
The emergence of single-cell RNA sequencing (scRNA-seq) technology has revolutionized the identification of cell types and the study of cellular states at a single-cell level. Despite its significant potential, scRNA-seq data analysis is plagued by the issue of missing values. Many existing imputation methods rely on simplistic data distribution assumptions while ignoring the intrinsic gene expression distribution specific to cells. This work presents a novel deep-learning model, named scMultiGAN, for scRNA-seq imputation, which utilizes multiple collaborative generative adversarial networks (GAN). Unlike traditional GAN-based imputation methods that generate missing values based on random noises, scMultiGAN employs a two-stage training process and utilizes multiple GANs to achieve cell-specific imputation. Experimental results show the efficacy of scMultiGAN in imputation accuracy, cell clustering, differential gene expression analysis and trajectory analysis, significantly outperforming existing state-of-the-art techniques. Additionally, scMultiGAN is scalable to large scRNA-seq datasets and consistently performs well across sequencing platforms. The scMultiGAN code is freely available at https://github.com/Galaxy8172/scMultiGAN.
Keywords: single-cell RNA-seq, cell-specific imputation, generative adversarial networks (GAN), deep learning
INTRODUCTION
Single-cell RNA sequencing (scRNA-seq) is a powerful tool that enables researchers to explore the intricacies of cellular heterogeneity of complex biological systems at a single-cell level, offering new insights into cellular processes and disease mechanisms [1]. scRNA-seq differs from traditional bulk RNA sequencing as it allows the examination of individual cells’ gene expression profiles in a heterogeneous sample, enabling the unbiased identification of rare or previously unknown cell types within a tissue or organism.
Through this technology, novel cell types have been discovered across vast tissues and species [2–4], leading to a better understanding of cellular heterogeneity and functions.
Moreover, scRNA-seq technology can track developmental relationships and lineage among heterogeneous cellular states over time, allowing researchers to study dynamic processes in cell differentiation or response to stimuli, such as embryonic development or cancer progression [5–7]. It has also shown great potential in precision medicine, including clinical drug selection and new drug development [8–10].
Although providing high-resolution data, scRNA-seq still faces many challenges [11]. Unlike bulk RNA-seq which measures the average gene expression level of a group of cells, scRNA-seq may encounter massive missing gene expression values or dropouts’ due to technical limitations such as mRNA degradation after cell lysis, low capture efficiency, unstable amplification, excessive dilution of cell libraries and low sequencing depth [12–15]. Biological limitations, such as low RNA content in individual cells or gene expression silencing during cell development, may also contribute to the presence of missing values [16]. Missing values in scRNA-seq data can lead to biased cell-type clustering, reduced statistical power in downstream analyses, such as differential gene expression analysis, or even false discoveries [10, 17, 18]. Therefore, carefully addressing and accounting for missing values in scRNA-seq data analysis is crucial to ensure the reliability and robustness of downstream analyses.
To address the issue of dropout in scRNA-seq data, various imputation methods have been developed. These methods can be broadly classified into four categories: smoothing-based, model-based, low-rank matrix-based and deep learning-based. Smoothing-based methods leverage cells with similar expression profiles to smooth or diffuse gene expression values to impute missing values. The MAGIC method [19] shares expression information among similar cells and diffuses it to impute missing values, whereas DrImpute [20] clusters cells into groups and utilizes the average expression of cells in the same group to impute missing values. Model-based methods directly construct statistical models for sparse data. For instance, scImpute [21] assigns probabilities to missing gene expression values and imputes them using similar cells that are not affected by dropouts. Low-rank matrix-based methods capture linear relationships between cells, map high-dimensional space to low-dimensional space and recover expression levels from low-rank matrices. ENHANCE [22] employs principal component analysis (PCA) to decrease the dimension of the original matrix and imputes missing values from the PC space. Deep learning-based methods construct a latent space based on nonlinear relationships between cells and then reconstruct gene expression matrices from the estimated latent space. AutoImpute [23] uses an autoencoder to estimate a latent space that is then used for imputing gene expression matrices. Although these methods have been widely applied, many existing methods rely on simplistic assumptions about the data while ignoring the complex gene-gene expression dependencies, which can lead to imprecise gene expression estimates, especially in cases where there is complex scRNA-seq data distribution.
Recently, techniques such as generative adversarial network (GAN) have also been applied in imputing scRNA-seq data, including scGAIN [24] and scIGANs [25]. Among these, scIGANs has outperformed several state-of-the-art methods [25]. GAN-based imputation methods employ GANs to learn the underlying nonlinear gene-gene dependencies of single-cell gene expression. During training, the generator produces synthetic single-cell gene expression, while the discriminator evaluates whether the generator’s outputs are authentic or generated. However, current GAN-based models generate synthetic scRNA-seq profiles based on noise input, which is not cell-specific. Once trained, the generator takes noise as input to conduct scRNA-seq imputation regardless of which cell is being analyzed.
Therefore, in this study, we developed a cell-specific imputation method, called scMultiGAN, to impute dropouts based on each cell’s specific expression profile. scMultiGAN employs a two-stage training process involving multiple GANs’ collaboration. In the first stage, scMultiGAN trains two generators: one to simulate the authentic gene expression, and the other to model the dropout distribution. After the training, the well-trained authentic data generator is used to simulate the ground-truth data in the second stage. Here, scMultiGAN trains the third generator, which takes the cell’s raw expression as input and outputs the imputed dropouts. We systematically evaluated the performance of scMultiGAN and compared it with state-of-the-art methods on a series of simulated and real-world scRNA-seq datasets. The results showed that our method had superior performance in imputation accuracy, cell clustering, gene differential analysis and trajectory analysis. Additionally, scMultiGAN can be scaled to large scRNA-seq datasets and works stably across sequencing platforms. Figure 1 depicts the overview of the scMultiGAN framework for scRNA-seq data imputation.
Figure 1.

Overview of scMultiGAN network for single-cell gene expression data imputation. (A) The network structure of the first training stage of scMultiGAN. The expression matrix is converted into a square image and its corresponding mask matrix is obtained. After training, two generators can be obtained for generating the mask matrix and simulated real data respectively. (B) The network structure of the second training stage of scMultiGAN. We will use the pre-trained model  in (A). The raw data and the corresponding mask matrix are fed to the network. After training, the network for gene expression data imputation
  is obtained.
MATERIALS AND METHODS
In this work, we present scMultiGAN, a deep GAN specifically designed for imputing missing values in scRNA-seq data. We first provide an overview of scMultiGAN’s deep learning architecture and then describe the two-stage training process featured by multiple GANs’ collaboration (Figure 1). To assess the performance of scMultiGAN, we have designed a series of experiments that evaluate multiple aspects, such as imputation accuracy, cell clustering, gene differential analysis, trajectory analysis, robustness across sequencing platforms, and scalability in large datasets. We compare our results with those obtained from five state-of-the-art methods. Figure 2 illustrates the datasets and experimental setup. Additionally, we briefly introduce simulated and real-world scRNA-seq datasets, as well as benchmark metrics for evaluation. More details can be found in the Supplementary Information.
Figure 2.
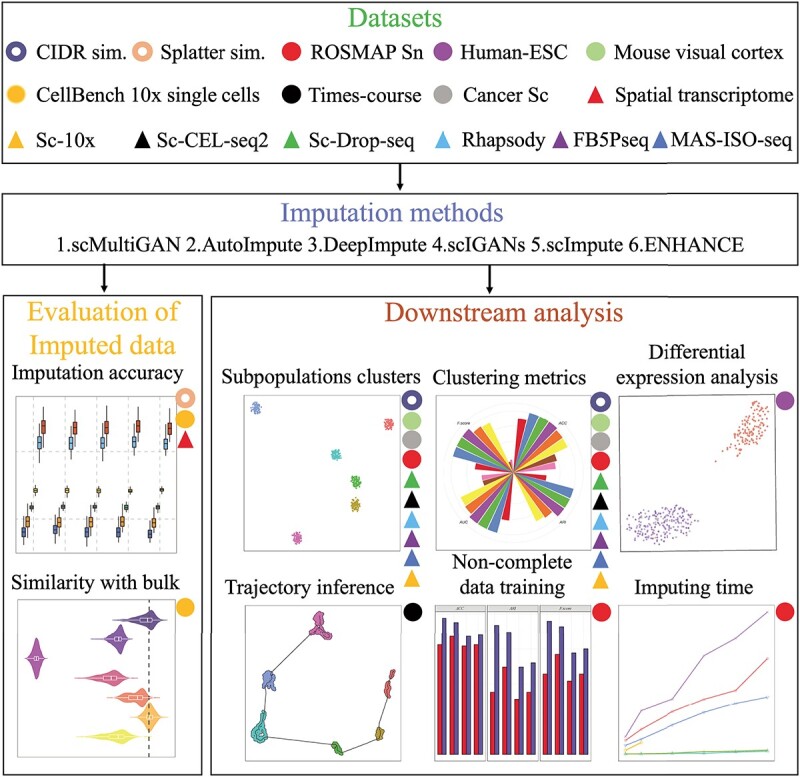
An overall schematic view of the datasets and experiments used in this study. The colored circles or triangles denote the respective datasets utilized in the corresponding downstream analyses. The empty circles represent simulation datasets and the triangles indicate different sequencing platforms. Five state-of-the-art imputation methods are compared in eight downstream tasks. Abbreviations: sim., Sc and Sn stand for simulation, single-cell and single-nuclear, respectively.
The architecture overview of scMultiGAN
scMultiGAN is a deep learning framework designed based on multiple deep GANs for scRNA-seq imputation. The scMultiGAN architecture utilizes three GANs, training them in two stages as illustrated in Figure 1. In the first stage, two GANs are trained to model the underlying real data distribution and the missing (or masking) data distribution. This stage primarily aims to develop a robust generator capable of simulating true’ data based on noise and potential cell labels. The second stage involves training another GAN to perform cell-specific imputation. The objective of this stage is to produce an accurate generator for scRNA-seq imputation, relying on the cell’s raw expression profiles. The subsequent section provides further details on these two training stages. It is worth noting that if cell labels are unavailable, scMultiGAN assigns labels to cells based on unsupervised clustering.
To train these GANs more efficiently, we modify the GAN framework to minimize an approximation of the Earth-Mover’s distance (EM distance, the first-order form of the Wasserstein distance) instead of the Jensen–Shannon (JS) divergence, which is used in the original GAN framework, by adopting the Wasserstein distance (measuring the distance between two probability distributions). The objective function of Wasserstein GAN (WGAN) [26] is shown in equation 1:
 |
(1) |
where  and
and  represent the discriminator and generator, respectively, while
  denotes the real data distribution and
  signifies the noise distribution. The full set of 1-Lipschitz functions is represented by
  . The model is formulated as a minimax game in which the discriminator aims to maximize the loss function
  , and the generator seeks to minimize it. The 1-Lipschitz function helps constrain the discriminator’s output range, preventing unstable training due to excessively large outputs. In scMultiGAN, we employ the Wasserstein GAN with gradient penalty (WGAN-GP) [27] to ensure the discriminator is a 1-Lipschitz function (a function whose rate of change is bounded by 1). WGAN-GP incorporates two techniques: weight pruning and gradient penalty. The former constrains the discriminator’s weights within a fixed interval, maintaining an appropriate output range. However, excessive weight pruning can result in gradient disappearance, while insufficient pruning may cause the model to fail to converge. Consequently, we also employ the gradient penalty. Specifically, we add an additional penalty term,
  , where
  ,
,  is a randomly sampled value from a uniform distribution, and
  is a hyperparameter. Each GAN in scMultiGAN combines weight pruning and gradient penalty, training the model with the final objective function as shown in equation 2:
 |
(2) |
We provide a detailed introduction to the generator and discriminator used in scMultiGAN in Supplementary Information, and also their network structures as shown in Supplementary Figures S1, S2 and S3.
The first stage training: modeling the scRNA-seq data
The primary objective of scMultiGAN is to train a deep GAN, denoted as  , for imputing missing values in scRNA-seq profiles utilizing the raw expression matrix and potential cell labels. In
  , the generator’s goal is to produce imputed scRNA-seq data, while the discriminator’s goal is to distinguish the imputed data from the true’ data, which is randomly sampled from the real data distribution. Therefore, in the first stage, we need to train a true’ data generator, called
  , capable of approximating the ground-truth scRNA-seq data for each cell type.
To accomplish this, we design two GANs in this stage to model the real expression data and the missing data. Specifically, for each cell, its expression profile is transformed from read counts to transcripts per million (TPM), followed by log normalization. Afterward, the expression profile of each cell is reshaped into a two-dimensional expression matrix, represented as  . We employ a mask matrix
  to signify the missing data; if
  is not missing, then
  , otherwise, it is 0. As
  and
and  originate from two independent data distributions, we construct two GANs, GAN
 and GAN
 , to model their respective distributions. The data generator and mask generator denoted as
  and
and  (see Supplementary Information for their structures), are utilized to simulate the expression matrix
  and mask matrix
  , respectively. The corresponding discriminators are represented as
  and
and  . The
. The  can be trained using
  and
and  directly. However, training
  directly with
  and
and  is not feasible, as
  would only generate the raw data. To simulate the non-missing real data, we combine the expression matrix and the mask matrix using Equation 3:
 |
(3) |
where  is the complement matrix of
  , and
, and  is a hyperparameter. The
  is trained with
  and
and  . We define two loss functions
  and
and  , as shown in Equations 4 and 5, to train the GAN
 and GAN
 respectively:
 |
(4) |
 |
(5) |
where  is a hyperparameter, and
  is a combined loss function that balanced the loss of
  and
and  .
.
The second stage training: facilitating the scRNA-seq imputation
In the second stage of training, our objective is to train a generator that precisely imputes scRNA-seq dropouts, denoted as the imputation generator  . The architecture of this GAN, referred to as
  , is illustrated in Figure 1B. The main structure of
  is based on the UNet (see Supplementary Information and Supplementary Figure S2). It accepts the raw scRNA-seq data
  , the mask matrix
  , a noise matrix
  and cell labels as inputs, and generates the imputed data matrix as the output. We employ the well-trained real-data generator
  to create the true’ dataset and utilize a discriminator
  to differentiate the imputed data from the true’ data. The loss function is presented in Equation 6:
 |
(6) |
After the training process converges,  is utilized to perform scRNA-seq imputation. It is important to note that scMultiGAN retains only the imputed dropout values from the output of
  , while the original non-missing values are filled back. The two-stage design of scMultiGAN enables separate training and imputation processes, providing significant flexibility for the task of scRNA-seq imputation. For instance, users can train the model with a small portion of the dataset and perform imputation for the entire dataset. Alternatively, users can train the model on a reference dataset and apply it to other datasets. This approach could be highly useful and adaptable in large datasets and transfer learning. In the Results section, we demonstrate the exceptional performance of scMultiGAN using this imputation strategy on a large scRNA-seq dataset.
Benchmark and evaluation metrics
We employed the SC3 [28] method for clustering, setting the number of clusters equal to the number of known cell types present in each dataset. To assess the performance of each method, we primarily utilized four evaluation metrics: adjusted Rand index (ARI), accuracy (ACC), area under the receiver operating characteristic curve (AUC) and F-score. More details about the metrics are included in the Supplementary Information.
Data availability
To evaluate the performance of scMultiGAN, multiple simulated and real-world scRNA-seq datasets are analyzed, as shown in Figure 2. The detailed introduction to these datasets can be found in the Supplementary Information. Briefly, considering the bias and different simulated data distribution between different simulators, we prepare two simulated datasets for accuracy evaluation. We use Splatter [29] to simulate the scRNA-seq profile including 8100 genes and 400 cells (five cell types with 72, 75, 93, 84 and 76 single cells, respectively) with a data dropout rate of 92.9%. The other dataset is simulated using the scSimulator function of CIDR [30] package, which includes 20 210 genes and 480 cells and exhibited a dropout rate of 53% before imputation. Multiple real-world datasets are also involved in multiple functional analyses. The human lung adenocarcinoma cell lines (10x Genomics data) are obtained from the CellBench [31], which is available at the Gene Expression Omnibus (GEO) under accession code GSM3618014. The paired bulk samples can be found under GEO accession number GSE86337. The mouse visual cortex scRNA-seq data [32] and time-course scRNA-seq data [33] are available at GEO under accession code GSE65525. The Human-ESC scRNA-seq data [33] are available at GEO under accession code GSE75748. The cross-platform scRNA-seq data [31] are available at the https://github.com/LuyiTian/sc_mixology/tree/master/data/csv. The ROSMAP snRNA-seq data are obtained from Synapse platform (ID: syn3219045) with approval. Two scRNA-seq datasets for cancers, including primary breast cancer and melanoma, are available under GEO accession code GSE75688 [34] and GSE72056 [35], respectively. Spatial transcriptomic data and scRNA-seq datasets in different platforms (including 10x genomic, CEL-seq2, Drop-seq, Rhapsody,MAS-ISO-seq and FB5Pseq) are also used to evaluate the methods [31, 36–38].
RESULTS AND DISCUSSION
scMultiGAN demonstrates high imputation accuracy in comparison to five state-of-the-art methods
To evaluate the imputation accuracy on scRNA-seq profiles, we initially simulated a single-cell RNA-seq dataset containing five cell types and a dropout rate of 92.9% using Splatter [29] (see Methods and Supplementary Information). The imputation process was performed by scMultiGAN and five other state-of-the-art methods, including ENHANCE [22], AutoImpute [23], DeepImpute [39], scImpute [21] and scIGANs [25]. These methods have proven to outperform many other approaches (Supplementary Table S1). Imputation accuracy was assessed by the mean squared error (MSE) and Pearson’s r for each cell, based on the imputed gene expression values and hidden true values. Figure 3 depicts the distribution of MSE and Pearson’s r across cells in the five simulated cell types. It is shown that scMultiGAN consistently attains the smallest average MSE and highest average Pearson’s r among all compared methods, followed by DeepImpute, ENHANCE, AutoImpute and scIGANs, indicating strong accuracy for scRNA-seq imputation.
Figure 3.

The imputation accuracy of scMultiGAN and five other state-of-the-art methods on a simulated scRNA-seq dataset with five cell types and a high dropout rate. (A) The boxplots of mean squared error(MSE) and (B) Pearson’s r values between true values and imputed values across cells in five cell types. The MSE and Pearson’s r between true values and imputed values are shown at the top of the figure. The arrangement of methods is the same for cell types. (C) The boxplots of Pearson’s r values between masked true values and imputed values in real-world scRNA-seq data and spatial transcriptome data (D). The x-axis represents various dropout rates.
We also evaluate the imputation accuracy on real-world scRNA-seq data and spatial transcriptome. We conducted the simulation experiment based on the real-world human lung adenocarcinoma cell lines (10x Genomics data) from CellBench [31] (see Methods and Supplemental Information). For each of the five cell types and the overall mixed cells, we first randomly dropped 10–90% non-zero expression values and then applied the six imputation methods to infer those dropouts. Next, we calculated Pearson’s correlation coefficient to measure the imputation accuracy. The results for the aggregated mixed cells are shown in Figure 3(C). It shows that our method, scMultiGAN, achieves the best accuracy across the different dropout rates. At the 10% dropout rate, the average imputation accuracy reaches 96.7%, even if the dropout rate increases to 90%, scMultiGAN still manages to maintain commendable accuracy. we assessed the methods using a 10x Visium spatial transcriptomics (ST) dataset [40] under identical experimental conditions. Figure 3D demonstrates that our method consistently surpasses other approaches when applied to ST data. This underscores the robust accuracy of scMultiGAN in imputing scRNA-seq data.
scMultiGAN enhances expression similarity between imputed scRNA-seq and bulk RNA-seq
To evaluate scMultiGAN’s ability in recovering the true expression values, we first compared the similarity between imputed scRNA-seq expression profiles and the corresponding bulk RNA-seq profiles obtained from a uniform cell population. Following Hou et al.’s work, we employed the 10x Genomics scRNA-seq data from five human lung adenocarcinoma cell lines (H2228, H1975, HCC827, H838 and A549) [31] and their matching bulk RNA-seq data as the test dataset (Methods and Supplementary Information). Since cell lines are typically homogeneous and exhibit deep-sequenced expression profiles, we used the average gene expression profile from the duplicate bulk RNA-seq for each cell line as the ground truth. We then compared scRNA-seq profiles with bulk RNA-seq profiles pre- and post-imputation in three scenarios, as depicted in Supplementary Figure S4.
Firstly, we calculated the gene expression similarity between the bulk profile and the cross-cell-averaged scRNA-seq profile (pseudo-bulk profile) using Pearson’s correlation coefficient (PCC). After employing scMultiGAN’s imputation, we observed a substantial increase of the gene expression similarity. For instance, in cell line H838, the similarity between scRNA-seq and bulk RNA-seq data increased from 0.59 to 0.68 post-imputation (Figure 4A). We also observed increase of gene expression similarity in all five cell lines by 6.9–15.3% (Figure 4B). Additionally, we compared scMultiGAN with five state-of-the-art methods across all cell lines, determining scMultiGAN as the best performer and the only method that enhanced correlations in all cell lines (Figure 4B, Supplementary Figure S6).
Figure 4.

Imputation of scRNA-seq improved the expression similarity with bulk RNA-seq. (A) The similarity between averaged scRNA-seq data and bulk RNA-seq data in cell line H838. Averaged gene expression values across cells (pseudo-bulk, x-axis) are compared with the mean gene expression profile in bulk samples (y-axis). Each dot represents a gene, and the color indicates the gene density in a local area. (B) Bar chart displaying PCC values between bulk and pseudo-bulk expression profiles pre- and post-imputation using six methods across five cell lines. (C) Violin plots of PCC values measured between bulk data and each individual cell’s expression profile pre- and post-imputation by six methods in cell line H838. The black dashed line represents the PCC value between pseudo-bulk’ and bulk. (D) Average PCC values between gene expression profiles of individual cells and bulk data within each of the five cell lines. (E) Similarity of LFC profiles between the scRNA-seq data and the bulk data. LFC profile of a cell (or bulk sample) is a vector of LFC values of all genes measured between two cell lines (HCC837 and H838 in this case). (F) Average PCC values between LFC profiles of individual cells and bulk data within each of the pairwise combination of five cell lines.
Secondly, we compared the scRNA-seq profile of each individual cell with the bulk profile, using various imputation methods or no imputation at all. Figure 4(C) demonstrated that scMultiGAN achieved the highest average correlation (0.59) and smallest correlation variance in cell line H838. Subsequent methods, including ENHANCE, scImpute, DeepImpute and scIGANs, yielded comparable or superior correlations to the non-imputation (raw) scenario. However, DeepImpute-derived correlation scores were notably lower than non-imputation. Similar results were observed in other cell lines (Supplementary Figure S7). The average performance of these methods across all cell lines is displayed in Figure 4(D). scMultiGAN achieves the best results in four cell lines and ranks second in H2228 (average PCC = 0.53), whereas ENHANCE performs marginally better in H2228 (average PCC = 0.55).
Lastly, we evaluated scMultiGAN’s ability to maintain cell expression variance between distinct cell lines. Unlike previous experiments measuring similarity based on expression profiles directly, we first determined the log fold change (LFC) between two cell lines using single-cell profiles or bulk profiles, then measured the similarity between LFC profiles derived from scRNA-seq data and bulk RNA-seq data (Supplementary Figure S4). In the case of cell line pair HCC827-H838, three methods (i.e. ENHANCE, scMultiGAN and scImpute) better-preserved cell-type differences than no imputation (Figure 4E). Considering all cell line combinations, ENHANCE achieved the best correlation performance, with scMultiGAN ranking second but only exhibiting a slightly smaller correlation variance than ENHANCE (Figure 4F). The results were consistent in other cell line pairs (Supplementary Figure S8).
scMultiGAN improves single-cell subpopulation stratification without introducing extra noise
Accurately identifying single-cell subpopulations is a crucial application of scRNA-seq. However, recovering dropouts in scRNA-seq profiles may introduce extra noise, potentially disrupting subpopulation stratification. To assess scMultiGAN’s performance in stratifying single-cell subpopulations, we simulated a scRNA-seq dataset comprising six subpopulations and a 50% dropout rate using the CIDR package [30] (see Methods and Supplementary Information). The dataset contained 480 cells, with 80 single cells per subpopulation. We performed imputation using various methods, followed by SC3 clustering, and compared their performance based on four clustering metrics: ARI, F-score, AUROC (ROC) and ACC (see Methods). After dimension reduction using uniform manifold approximation and projection (UMAP), clustering results are visualized in Figure 5(A). Dropout events (from full” to raw”) led to subpopulation mixing. Both scMultiGAN and scImpute successfully recovered subpopulation stratification post-imputation (all four metrics equal to 1), while other methods introduced extra noise, resulting in imperfect subpopulation stratification or even worse performance than non-imputation (Figure 5B). For instance, AutoImpute and DeepImpute performed worse than non-imputation (the raw’) in F-score and ROC metrics.
Figure 5.

scMultiGAN effectively identifies cell subpopulations without introducing additional noise. (A) UMAP visualization of the simulated scRNA-seq data with 480 cells in six cell types pre- and post-imputation. Subpopulation stratification is compared based on raw data, and data post-imputation. Full’ represents the simulated scRNA-seq data without dropouts, while raw’ represents the data with 50% dropouts. Other subplots are visualized based on post-imputation datasets by six imputation methods. (B) ACC, AUC, ARI and F-score metrics obtained by applying the SC3 clustering on raw, full and post-imputation simulated datasets. (C) UMAP visualization of the real scRNA-seq data from the mouse visual cortex (with eight cell types and a dropout rate of 92.4%) pre- and post-imputation. (D) ACC, AUC, ARI and F-score metrics obtained by applying the SC3 clustering on raw, and post-imputation scRNA-seq data from the mouse visual cortex.
To further evaluate subpopulation stratification in real samples, we used a mouse visual cortex scRNA-seq dataset [32] for a second assessment. We randomly selected 2000 single cells after quality control, which were divided into eight subpopulations with a 92.4% dropout rate (see Methods and Supplementary Information). After imputation using different methods, clustering performance and UMAP visualizations are displayed in Figure 5(C). scMultiGAN demonstrated the best performance across all four metrics, followed by scImpute, ENHANCE and non-imputation. Notably, some subgroups were difficult to distinguish in the raw data, but scMultiGAN-imputed expression profiles significantly improved classification. For example, macrophages and microglia are closely related, as microglia are macrophages residing within the central nervous system. These two subpopulations are challenging to differentiate based on raw scRNA-seq profiles. However, scMultiGAN’s imputation enabled clear distinction between the two subgroups. A similar improvement occurred in classifying excitatory neurons and interneurons. Clustering performance based on AutoImpute, scIGANs and DeepImpute was worse than non-imputation (Figure 5D), likely due to the introduction of additional noise. In the Supplemental Information, we further assessed the subpopulation stratification capability using two cancer scRNA-seq datasets: primary breast cancer [34] and melanoma [35]. The findings indicate that scMultiGAN consistently outperforms other methods across all metrics for the primary breast cancer dataset and also ranks as the top method for the melanoma dataset. This suggests that scMultiGAN is highly effective for cancer single-cell RNA-seq datasets (Supplementary Figure S9). In summary, both simulated and real-data-based subgroup stratification experiments demonstrated that scMultiGAN enhanced single-cell subpopulation stratification without introducing extra noise.
scMultiGAN enhances the differential expression analysis in single-cell transcriptomics
Differential expression analysis is one of the primary downstream analyses in single-cell transcriptomics, enabling the detection of cell-type-specific marker genes and the examination of cell-type-specific responses to perturbations such as disease or other stimuli. We hypothesized that scRNA-seq imputation would improve the resolution of marker gene expression profiles, thereby enhancing their ability to stratify single-cell subpopulations. To test this hypothesis, we analyzed gene expression patterns using a scRNA-seq dataset of human embryonic stem cells (ESCs) consisting of 350 single cells. This dataset comprised two subtypes, namely H1 ESC ( ) and definitive endoderm cells (DEC,
  ). The dropout rate of the scRNA-seq dataset was found to be 49.1%. Matched bulk RNA-seq datasets were also available, with two DEC samples and four H1 ESC samples.
We first conducted a differential gene expression (DGE) analysis between DECs and H1 ESCs using bulk RNA-seq data, considering the resulting DEGs as the gold standard (see Supplementary Information). Next, we used scMultiGAN and five other methods for scRNA-seq imputation, followed by a DEG analysis for each. The findings are displayed in Figure 6(A) and (B). By comparing the intersections of DEGs from raw, bulk and post-imputation datasets, we found that the scMultiGAN-imputed dataset identified significantly more common DEGs with the bulk dataset ( ) compared with other methods. Additionally, scMultiGAN helped detect the largest number of DEGs. Suboptimal performances were observed for scIGANs and scImpute (Figure 6A). We also examined the proportion of up-regulated and down-regulated DEGs (Figure 6B). In the bulk dataset, down-regulated DEGs were 1.3 times more prevalent than up-regulated DEGs. The scMultiGAN-imputed dataset closely resembled the bulk dataset (ratio = 1.1), while the ratios for scImpute and scIGANs-derived datasets were 3.4 and 3.8, respectively. This indicates that scMultiGAN more effectively balances up-regulated and down-regulated DEGs during the imputation compared with other methods.
Figure 6.

scMultiGAN enhances DEG analysis in scRNA-seq data. (A) Upset plot of DEGs identified in the human ESC single-cell dataset pre- and post-imputation. ”Bulk’ represents DEGs identified in the matched bulk RNA-seq dataset, which are treated as the gold standard. Blue bars show the common DEGs with the bulk dataset. Black bars indicate the common DEGs with the raw scRNA-seq dataset. The red bars represent the DEGs unique to each particular dataset. (B) Venn diagrams of up- and down-regulated DEGs identified in the bulk RNA-seq dataset and post-imputation datasets by scMultiGAN, scIGANs and scImpute. (C) UMAP visualization of differential expression levels (Z-scores) of two marker genes, SOX2 and CXCR4, before and after imputation. SOX2 and CXCR4 serve as marker genes for H1 and DEC cells, respectively. (D) Boxplots of three top-upregulated genes (HLM, PHYHIPL and ASB5) and three top-downregulated genes (C7orf63, ALKBH8 and KBTBDB). These genes were identified with bulk RNA-seq, and their expression levels were shown in the raw scRNA-seq and scMultiGAN-imputed datasets, and compared in H1 and DEC cell types, respectively.
To show the effect of marker genes in stratifying subpopulations, we visualized the differential expression levels (Z-scores) of two marker genes, SOX2 and CXCR4, before and after imputation using the UMAP plot (Figure 6C). We observed that the two subgroups could be classified more explicitly after scMultiGAN’s imputation, and differential expression levels of the two marker genes tended to be stronger. Furthermore, to illustrate the improvement in DEG analysis, we selected six genes for case studies, including three top-upregulated genes (HLX, PHYHIPL and ASB5) and three top-downregulated genes (C7orf63, ALKBH8 and KBTBDB) between DEC and H1. As illustrated in Figure 6(D), the differential expression patterns of these genes were significantly disrupted by dropouts in the raw data. However, after the scMultiGAN imputation, these patterns were substantially restored. It’s worth noting that the effect of enhancing differential expression patterns by scMultiGAN also outperformed other methods (Supplementary Figure S10 and Supplementary Figure S11). These results support our hypothesis that enhancing single-cell gene expression profiles improves their role in differential expression analysis and in classifying single-cell subpopulations.
scMultiGAN enhances time-course scRNA-seq analysis and improves cellular trajectory inference
In single-cell transcriptomics, trajectory inference or pseudo-temporal ordering is an important computational task that identifies the sequence of dynamic biological processes cells undergo and organizes cells based on their temporal progression through the process. To evaluate the impact of scRNA-seq imputation on time-course scRNA-seq analysis, we performed cellular trajectory inference using a time-course scRNA-seq dataset from the same human ESC study as in the previous section. This dataset contained six time points during the differentiation of embryonic stem cells (0H) into definitive endoderm cells (96H), with intermediate time points at 12H, 24H, 36H and 72H. Monocle3’s cellular trajectory inference function was used to infer cell pseudo-times. We compared the inferred pseudo-times and true times in the raw time-course data and data after imputation. The scMultiGAN-derived imputation dataset achieved the highest accuracy in trajectory inference.
As shown in Figure 7(A), without imputation, the correlation between true time and inferred pseudo-time was 0.68. After scMultiGAN imputation, the correlation increased to 0.97, significantly improving the accuracy of cellular trajectory inference. The second-best performance was achieved by scImpute (0.86), which was 11% lower than scMultiGAN, followed by scIGANs (0.74) and ENHANCE (0.73). AutoImpute (0.39) and DeepImpute (0.14) performed worse than non-imputation, possibly due to the introduction of extra noise. Although scImpute achieved the second-best correlation score, the time inference at 36H had a large variance, and the inferred time order was not as expected at 12H, 24H and 36H.
Figure 7.
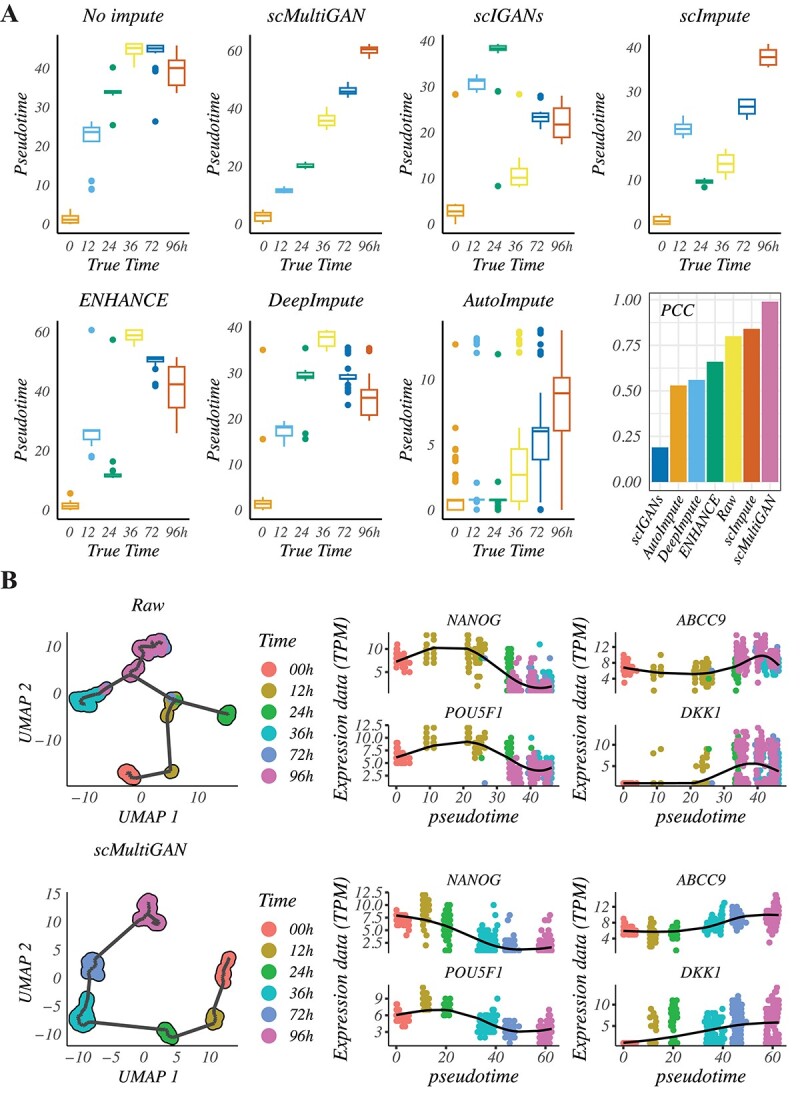
scMultiGAN improves the performance of cell trajectory analysis. (A) The Human-ESC dataset contains cells from six different developmental time points (0H, 12H, 24H, 36H, 72H and 96H). Monocle3 was used to infer cell pseudo-times for raw data and data imputed by six methods, and Pearson’s Correlation Coefficient (PCC) was measured between pseudo-times and actual cell developmental times. (B) Reconstruction of cell trajectories based on the original data and imputed data. The expression levels of four marker genes (NANOG, POU5F1, ABCC9 and DKK1) were visualized at different developmental time points pre- and post-imputation.
We also reconstructed trajectories using Monocle3 (Figure 7B, Supplementary Figure S12). Without imputation, the cell development trajectory was unreliable, and time-course cell groups were mixed up. Imputation with scMultiGAN resulted in a strong alignment between inferred pseudo-times and actual temporal progression. We analyzed time-course marker genes for undifferentiated embryonic stem cells (NANOG and POU5F1) and DECs (ABCC9 and DKK1), finding that scMultiGAN imputation substantially improved the resolution and accuracy of their dynamic gene expressions. In summary, these results indicate that scMultiGAN can effectively recover time-course dynamics in single-cell transcriptomics.
scMultiGAN is robust across sequencing platforms and scalable for large scRNA-seq datasets
With the rapid development of scRNA-seq technologies, single-cell studies tend to generate a large number of cells and may vary in sequencing platforms. Therefore, it is crucial to evaluate the imputation performance of scMultiGAN across various sequencing platforms and its scalability in studies with large sample sizes. To achieve this goal, we first compared imputation methods based on three scRNA-seq datasets that were sequenced across three different platforms. The mixed dataset consisted of three human lung adenocarcinoma cell lines (H2228, H1975 and HCC827) and was sequenced by 10X Genomics, CEL-seq2 and Drop-seq platforms, respectively [31]. We performed imputation on these cross-platform datasets using scMultiGAN and five other state-of-the-art methods, followed by dimension reduction and visualization using UMAP (Figure 8A). As can be seen, different platforms do influence imputation performance. scMultiGAN is one of the top-ranked methods that is minimally affected by the sequencing platforms. However, ENHANCE, AutoImpute and DeepImpute were significantly affected by the sequencing methods. In the Supplemental Information, we further show that scMultiGAN outperforms other methods on the recently developed FACS-based 5’ end scRNA-seq sequencing platform (FB5Pseq) [38], the long transcriptome sequencing platform (MAS-ISO-seq) [37] and the Rhapsody sequencing platform [36] (Supplementary Figure S13).
Figure 8.

scMultiGAN is robust across sequencing platforms and scalable for large scRNA-seq datasets. (A) UMAP plots of scRNA-seq datasets of three cell lines (H2228, H1975 and HCC827) in three sequencing platforms (10x, CEL-seq and Drop-seq) pre- and post-imputation. Each row represents a sequencing platform, and each column represents the dataset before or after imputation by six methods. (B) Performance comparison between scMultiGAN and DeepImpute. The two methods were trained on the dataset randomly extracted 40% cells from the ROSMAP dataset, and tested on datasets post-imputation. In sum, 40, 60, 80 and 100% cells of the ROSMAP scRNA-seq dataset were used for imputation and performance comparison. (C) Running time of different imputation methods on various sizes of datasets. In sum, 10, 20, 40, 60, 80 and 100% cells of the ROSMAP scRNA-seq dataset were used for running-time testing.
Next, we tested the scalability of scMultiGAN in handling datasets with large cell sizes. We applied the ROSMAP snRNA-seq dataset [41, 42] from the Synapse platform, which contained 70 634 single cells of the human brain in eight cell types. We randomly selected 40% cells to train scMultiGAN, and then applied the well-trained model on test datasets with different sample sizes, generated by randomly selecting 40, 60, 80 and the full set of single cells. We compared our method with DeepImpute, which is the only method (of the five we compared before) capable of performing similar train-test partitions. Other methods like ENHANCE require the full dataset for training. We used the SC3 method for clustering after imputation and evaluated the performance based on ACC, ARI and F-score (Figure 8B). The results showed that scMultiGAN achieved much better performance than DeepImpute in all metrics. For scMultiGAN, the best performance was achieved in the 40% training dataset, and the performance would gradually decrease as the dataset became larger, as expected.
Additionally, we compared the running time of six imputation methods on subsets of the ROSMAP scRNA-seq dataset. In sum, 10, 20, 40, 60, 80 and the full set of single cells were randomly selected as test datasets. Each method was in its default setting and all were run on the same workstation with hardware settings of an A6000 (48GB) GPU and 256GB memory. The results were shown in Figure 8(C), and scMultiGAN took more time compared with ENHANCE and DeepImpute due to the deep GAN training process. But it is more efficient than scIGANs, which is also a GAN-based method. In summary, scMultiGAN is capable of handling large scRNA-seq datasets and works stably across sequencing platforms.
CONCLUSIONS
scRNA-seq has become a powerful tool in biological research, with widespread applications in identifying previously undiscovered cell types, investigating cell heterogeneity and lineage relationships, and discovering novel biomarkers and therapeutic targets. However, due to high levels of technical and biological variation, scRNA-seq suffers from a high dropout rate, which can lead to biased downstream analyses and the loss of valuable biological information.
In this work, we propose a new deep learning model named scMultiGAN, designed to perform imputation for single-cell transcriptome data. Rather than generating missing values based on random noise as traditional GAN models do, our model coordinates multiple GAN models to achieve accurate cell-specific imputation. Experimental results show that scMultiGAN outperforms existing state-of-the-art methods and significantly improves downstream analyses such as cell classification, gene differential analysis and trajectory analysis. Furthermore, scMultiGAN is scalable to large scRNA-seq datasets and works stably across sequencing platforms. In summary, imputation plays a critical role in addressing the challenge of missing values in scRNA-seq data and improving the accuracy and reliability of downstream analyses. We believe as scRNA-seq data continues to accumulate and gain popularity, scMultiGAN can aid the research community in enhancing data quality and advancing a wide range of downstream applications.
Key Points
This work presents scMultiGAN, which utilizes multiple collaborative deep generative adversarial networks (GANs) to effectively address missing values in scRNA-seq data.
Different from traditional GAN-based methods that perform imputation based on random noises, scMultiGAN employs a two-stage training process to achieve the cell-specific imputation.
scMultiGAN has high imputation accuracy based on experiments of real-world and simulated scRNA-seq datasets.
scMultiGAN can enhance downstream analyses including cell clustering, differential gene expression analysis and trajectory analysis, outperforming existing state-of-the-art methods.
scMultiGAN is scalable to large scRNA-seq datasets and consistently performs well across sequencing platforms.
Supplementary Material
ACKNOWLEDGMENTS
We thank all of contributors of the open-source datasets and freely available tools used in this study. The ROSMAP snRNAseq study data were generated from postmortem brain tissue provided by the Religious Orders Study and Rush Memory and Aging Project cohort at Rush Alzheimer’s Disease Center, Rush University Medical Center, Chicago. This work was funded by NIH grants U01AG061356 (De Jager/Bennett), RF1AG057473 (De Jager/Bennett) and U01AG046152 (De Jager/Bennett) as part of the AMP-AD consortium, as well as NIH grants R01AG066831 (Menon) and U01AG072572 (De Jager/St George-Hyslop).
Author Biographies
Tao Wang is an associate professor in Bioinformatics and Artificial Intelligence at the Northwestern Polytechnical University. His research interests include the development and application of bioinformatics methods for the analysis of genomics data.
Hui Zhao is a graduate student in Automation Technology at the Northwestern Polytechnical University. His research activity is the development of computational methods for genomics data.
Yungang Xu is a professor in Bioinformatics at the Xi’an Jiaotong University. His research activities are mainly focused on developing bioinformatics methods and tools for the analysis of next-generation sequencing data.
Yongtian Wang is an associate professor in Bioinformatics at the Northwestern Polytechnical University. His research activities are mainly focused on development and application of methods for Bioinformatics.
Xuequn Shang is a professor in Bioinformatics and Big Data Analysis at the Northwestern Polytechnical University. Her research activities are mainly focused on development and application of methods for biomedical, educational and financial Big Data.
Jiajie Peng is an associate professor in Bioinformatics and Artificial Intelligence at the Northwestern Polytechnical University. His research interests include the development and application of bioinformatics methods for the analysis of genomics and single-cell sequencing data.
Bing Xiao is a professor in Automation Control at the Northwestern Polytechnical University. His research interests include the development of biomedical methods for medical and mechanical data.
Contributor Information
Tao Wang, School of Computer Science, Northwestern Polytechnical University, 1 Dongxiang Rd., 710072 Xi’an, China; Key Laboratory of Big Data Storage and Management, Ministry of Industry and Information Technology, Northwestern Polytechnical University, 1 Dongxiang Rd., 710072 Xi’an, China.
Hui Zhao, School of Automation, Northwestern Polytechnical University, 1 Dongxiang Rd., 710072 Xi’an, China.
Yungang Xu, Department of Cell Biology and Genetics, School of Basic Medical Sciences, Xi’an Jiaotong University Health Science Center, No.28, West Xianning Road, 710061 Xi’an, China.
Yongtian Wang, School of Computer Science, Northwestern Polytechnical University, 1 Dongxiang Rd., 710072 Xi’an, China; Key Laboratory of Big Data Storage and Management, Ministry of Industry and Information Technology, Northwestern Polytechnical University, 1 Dongxiang Rd., 710072 Xi’an, China.
Xuequn Shang, School of Computer Science, Northwestern Polytechnical University, 1 Dongxiang Rd., 710072 Xi’an, China; Key Laboratory of Big Data Storage and Management, Ministry of Industry and Information Technology, Northwestern Polytechnical University, 1 Dongxiang Rd., 710072 Xi’an, China.
Jiajie Peng, School of Computer Science, Northwestern Polytechnical University, 1 Dongxiang Rd., 710072 Xi’an, China; Key Laboratory of Big Data Storage and Management, Ministry of Industry and Information Technology, Northwestern Polytechnical University, 1 Dongxiang Rd., 710072 Xi’an, China.
Bing Xiao, School of Automation, Northwestern Polytechnical University, 1 Dongxiang Rd., 710072 Xi’an, China.
FUNDING
This work has been supported by the National Natural Science Foundation of China (No. 62102319), China Postdoctoral Science Foundation (No. 2022M712595), Fundamental Research Funds for the Central Universities (No. G2021KY05112), Young Elite Scientists Sponsorship Program by Xi’an (No. 095920221376).
References
- 1. Kiselev VY, Andrews TS, Hemberg M. Challenges in unsupervised clustering of single-cell RNA-seq data. Nat Rev Genet 2019;20(5):273–82. [DOI] [PubMed] [Google Scholar]
- 2. Zeisel A, Muñoz-Manchado AB, Codeluppi S, et al. Cell types in the mouse cortex and hippocampus revealed by single-cell RNA-seq. Science 2015;347(6226):1138–42. [DOI] [PubMed] [Google Scholar]
- 3. Grün D, Lyubimova A, Kester L, et al. Single-cell messenger RNA sequencing reveals rare intestinal cell types. Nature 2015;525(7568):251–5. [DOI] [PubMed] [Google Scholar]
- 4. Villani A-C, Satija R, Reynolds G, et al. Single-cell RNA-seq reveals new types of human blood dendritic cells, monocytes, and progenitors. Science 2017;356(6335):eaah4573. [DOI] [PMC free article] [PubMed] [Google Scholar]
- 5. Yan L, Yang M, Hongshan Guo L, et al. Single-cell RNA-seq profiling of human preimplantation embryos and embryonic stem cells. Nat Struct Mol Biol 2013;20(9):1131–9. [DOI] [PubMed] [Google Scholar]
- 6. Patel AP, Tirosh I, Trombetta JJ, et al. Single-cell RNA-seq highlights intratumoral heterogeneity in primary glioblastoma. Science 2014;344(6190):1396–401. [DOI] [PMC free article] [PubMed] [Google Scholar]
- 7. Wu SZ, Al-Eryani G, Roden DL, et al. A single-cell and spatially resolved atlas of human breast cancers. Nat Genet 2021;53(9):1334–47. [DOI] [PMC free article] [PubMed] [Google Scholar]
- 8. Cha J, Lee I. Single-cell network biology for resolving cellular heterogeneity in human diseases. Exp Mol Med 2020;52(11):1798–808. [DOI] [PMC free article] [PubMed] [Google Scholar]
- 9. Hsieh C-Y, Wen J-H, Lin S-M, et al. scDrug: from single-cell RNA-seq to drug response prediction. Comput Struct Biotechnol J 2023;21:150–7. [DOI] [PMC free article] [PubMed] [Google Scholar]
- 10. Jovic D, Liang X, Zeng H, et al. Single-cell RNA sequencing technologies and applications: a brief overview. Clin Transl Med 2022;12(3):e694. [DOI] [PMC free article] [PubMed] [Google Scholar]
- 11. Stegle O, Teichmann SA, Marioni JC. Computational and analytical challenges in single-cell transcriptomics. Nat Rev Genet 2015;16(3):133–45. [DOI] [PubMed] [Google Scholar]
- 12. McDavid A, Finak G, Chattopadyay PK, et al. Data exploration, quality control and testing in single-cell QPCR-based gene expression experiments. Bioinformatics 2013;29(4):461–7. [DOI] [PMC free article] [PubMed] [Google Scholar]
- 13. Kharchenko PV, Silberstein L, Scadden DT. Bayesian approach to single-cell differential expression analysis. Nat Methods 2014;11(7):740–2. [DOI] [PMC free article] [PubMed] [Google Scholar]
- 14. Hicks SC, William Townes F, Teng M, Irizarry RA. Missing data and technical variability in single-cell RNA-sequencing experiments. Biostatistics 2018;19(4):562–78. [DOI] [PMC free article] [PubMed] [Google Scholar]
- 15. Qiu P. Embracing the dropouts in single-cell RNA-seq analysis. Nat Commun 2020;11(1):1169. [DOI] [PMC free article] [PubMed] [Google Scholar]
- 16. Sekula M, Gaskins J, Datta S. Detection of differentially expressed genes in discrete single-cell RNA sequencing data using a hurdle model with correlated random effects. Biometrics 2019;75(4):1051–62. [DOI] [PubMed] [Google Scholar]
- 17. Brennecke P, Anders S, Kim JK, et al. Accounting for technical noise in single-cell RNA-seq experiments. Nat Methods 2013;10(11):1093–5. [DOI] [PubMed] [Google Scholar]
- 18. Zhang Z, Cui F, Lin C, et al. Critical downstream analysis steps for single-cell RNA sequencing data. Brief Bioinform 2021;22(5):bbab105. [DOI] [PubMed] [Google Scholar]
- 19. Van Dijk D, Sharma R, Nainys J, et al. Recovering gene interactions from single-cell data using data diffusion. Cell 2018;174(3):716–29. [DOI] [PMC free article] [PubMed] [Google Scholar]
- 20. Gong W, Kwak I-Y, Pota P, et al. DrImpute: imputing dropout events in single cell RNA sequencing data. BMC Bioinform 2018;19:1–10. [DOI] [PMC free article] [PubMed] [Google Scholar]
- 21. Li WV, Li JJ. An accurate and robust imputation method scImpute for single-cell RNA-seq data. Nat Commun 2018;9(1):997. [DOI] [PMC free article] [PubMed] [Google Scholar]
- 22. Wagner F, Barkley D, Yanai I. Accurate denoising of single-cell RNA-seq data using unbiased principal component analysis bioRxiv. 2019;655365. 10.1101/655365. [DOI]
- 23. Talwar D, Mongia A, Sengupta D, Majumdar A. AutoImpute: autoencoder based imputation of single-cell RNA-seq data. Sci Rep 2018;8(1):1–11. [DOI] [PMC free article] [PubMed] [Google Scholar]
- 24. Gunady MK, Kancherla J, Corrada Bravo H, Feizi S. scGAIN: single cell RNA-seq data imputation using generative adversarial networks bioRxiv. 2019;837302. 10.1101/837302. [DOI]
- 25. Yungang X, Zhang Z, You L, et al. ScIGANs: single-cell RNA-seq imputation using generative adversarial networks. Nucleic Acids Res 2020;48(15):e85–5. [DOI] [PMC free article] [PubMed] [Google Scholar]
- 26. Arjovsky M, Chintala S, Bottou L. Wasserstein GAN, Proceedings of the 34th International Conference on Machine Learning 2017;70:214–223. [Google Scholar]
- 27. Gulrajani I, Ahmed F, Arjovsky M, et al. Improved training of Wasserstein GANs. Adv Neural Inform Process Syst 2017;30:5769–5779. [Google Scholar]
- 28. Kiselev VY, Kirschner K, Schaub MT, et al. sc3: consensus clustering of single-cell RNA-seq data. Nat Methods 2017;14(5):483–6. [DOI] [PMC free article] [PubMed] [Google Scholar]
- 29. Zappia L, Phipson B, Oshlack A. Splatter: simulation of single-cell RNA sequencing data. Genome Biol 2017;18(1):174. [DOI] [PMC free article] [PubMed] [Google Scholar]
- 30. Lin P, Troup M, Ho JWK. CIDR: ultrafast and accurate clustering through imputation for single-cell RNA-seq data. Genome Biol 2017;18(1):1–11. [DOI] [PMC free article] [PubMed] [Google Scholar]
- 31. Tian L, Dong X, Freytag S, et al. Benchmarking single cell RNA-sequencing analysis pipelines using mixture control experiments. Nat Methods 2019;16(6):479–87. [DOI] [PubMed] [Google Scholar]
- 32. Klein AM, Mazutis L, Akartuna I, et al. Droplet barcoding for single-cell transcriptomics applied to embryonic stem cells. Cell 2015;161(5):1187–201. [DOI] [PMC free article] [PubMed] [Google Scholar]
- 33. Chu L-F, Leng N, Zhang J, et al. Single-cell RNA-seq reveals novel regulators of human embryonic stem cell differentiation to definitive endoderm. Genome Biol 2016;17:1–20. [DOI] [PMC free article] [PubMed] [Google Scholar]
- 34. Chung W, Eum HH, Lee H-O, et al. Single-cell RNA-seq enables comprehensive tumour and immune cell profiling in primary breast cancer. Nat Commun 2017;8(1):15081. [DOI] [PMC free article] [PubMed] [Google Scholar]
- 35. Tirosh I, Izar B, Prakadan SM, et al. Dissecting the multicellular ecosystem of metastatic melanoma by single-cell RNA-seq. Science 2016;352(6282):189–96. [DOI] [PMC free article] [PubMed] [Google Scholar]
-
36.
Shum EY, Walczak EM, Chang C, et al. Quantitation of MRNA transcripts and proteins using the BD Rhapsody
 single-cell analysis system. Single Mol Single Cell Seq 2019;1129:63–79. [DOI] [PubMed] [Google Scholar]
 - 37. Al’Khafaji AM, Smith JT, Garimella KV, et al. High-throughput RNA isoform sequencing using programmed CDNA concatenation. Nat Biotechnol 2023;1–5. [DOI] [PubMed] [Google Scholar]
- 38. Attaf N, Cervera-Marzal I, Dong C, et al. FB5P-seq: FACS-based 5-prime end single-cell RNA-seq for integrative analysis of transcriptome and antigen receptor repertoire in B and T cells. Front Immunol 2020;11:216. [DOI] [PMC free article] [PubMed] [Google Scholar]
- 39. Arisdakessian C, Poirion O, Yunits B, et al. DeepImpute: an accurate, fast, and scalable deep neural network method to impute single-cell rna-seq data. Genome Biol 2019;20(1):1–14. [DOI] [PMC free article] [PubMed] [Google Scholar]
- 40. Huazhu F, Hang X, Chong K, et al. Unsupervised spatially embedded deep representation of spatial transcriptomics. biorxiv. 2021;2021–06. [DOI] [PMC free article] [PubMed]
- 41. Bennett DA, Schneider JA, Arvanitakis Z, Wilson RS. Overview and findings from the religious orders study. Curr Alzheimer Res 2012;9(6):628–45. [DOI] [PMC free article] [PubMed] [Google Scholar]
- 42. Bennett DA, Schneider JA, Buchman AS, et al. Overview and findings from the Rush Memory and Aging Project. Curr Alzheimer Res 2012;9(6):646–63. [DOI] [PMC free article] [PubMed] [Google Scholar]
Associated Data
This section collects any data citations, data availability statements, or supplementary materials included in this article.
Supplementary Materials
Data Availability Statement
To evaluate the performance of scMultiGAN, multiple simulated and real-world scRNA-seq datasets are analyzed, as shown in Figure 2. The detailed introduction to these datasets can be found in the Supplementary Information. Briefly, considering the bias and different simulated data distribution between different simulators, we prepare two simulated datasets for accuracy evaluation. We use Splatter [29] to simulate the scRNA-seq profile including 8100 genes and 400 cells (five cell types with 72, 75, 93, 84 and 76 single cells, respectively) with a data dropout rate of 92.9%. The other dataset is simulated using the scSimulator function of CIDR [30] package, which includes 20 210 genes and 480 cells and exhibited a dropout rate of 53% before imputation. Multiple real-world datasets are also involved in multiple functional analyses. The human lung adenocarcinoma cell lines (10x Genomics data) are obtained from the CellBench [31], which is available at the Gene Expression Omnibus (GEO) under accession code GSM3618014. The paired bulk samples can be found under GEO accession number GSE86337. The mouse visual cortex scRNA-seq data [32] and time-course scRNA-seq data [33] are available at GEO under accession code GSE65525. The Human-ESC scRNA-seq data [33] are available at GEO under accession code GSE75748. The cross-platform scRNA-seq data [31] are available at the https://github.com/LuyiTian/sc_mixology/tree/master/data/csv. The ROSMAP snRNA-seq data are obtained from Synapse platform (ID: syn3219045) with approval. Two scRNA-seq datasets for cancers, including primary breast cancer and melanoma, are available under GEO accession code GSE75688 [34] and GSE72056 [35], respectively. Spatial transcriptomic data and scRNA-seq datasets in different platforms (including 10x genomic, CEL-seq2, Drop-seq, Rhapsody,MAS-ISO-seq and FB5Pseq) are also used to evaluate the methods [31, 36–38].