Abstract
Increased antimicrobial resistance (AMR) among bacteria underscores the need to strengthen AMR surveillance and promote data-based prescribing. To evaluate trends and associations between antimicrobial usage (AMU) and AMR, we explored a dataset of 34,672 bacterial isolates collected between 2015 and 2020 from clinical samples at the University Teaching Hospital (UTH) in Lusaka, Zambia. The most frequently isolated species were Escherichia coli (4,986/34,672; 14.4%), Staphylococcus aureus (3,941/34,672; 11.4%), and Klebsiella pneumoniae (3,796/34,672; 10.9%). Of the 16 drugs (eight classes) tested, only amikacin and imipenem showed good (> 50%) antimicrobial activity against both E. coli and K. pneumoniae, while nitrofurantoin was effective only in E. coli. Furthermore, 38.8% (1,934/4,980) of E. coli and 52.4% (2,079/3,791) of K. pneumoniae isolates displayed multidrug resistance (MDR) patterns on antimicrobial susceptibility tests. Among S. aureus isolates, 44.6% (973/2,181) were classified as methicillin-resistant (MRSA). Notably, all the MRSA exhibited MDR patterns. The annual hospital AMR rates varied over time, while there was a weak positive relationship (r = 0.38, 95% CI = 0.11–0.60) between the monthly use of third-generation cephalosporins (3GCs) and 3GC resistance among Enterobacterales. Overall, the results revealed high AMR rates that fluctuated over time, with a weak positive relationship between 3GC use and resistance. To our knowledge, this is the first report to evaluate the association between AMU and AMR in Zambia. Our results highlight the need to strengthen antimicrobial stewardship programs and optimize AMU in hospital settings.
Introduction
Therapeutic challenges related to antimicrobial-resistant bacteria raise considerable concern worldwide. Many experts regard antimicrobial resistance (AMR) as a clear and present danger, projected to kill 10 million people annually by 2050 [1]. To help mitigate the global AMR crisis, the 68th World Health Assembly in May 2015 adopted five strategic objectives (SOs) from the Global Action Plan [2]. The second SO involves research and surveillance, which enables the development of focused intervention policies to guide antimicrobial prescribing decisions and limit AMR spread. AMR surveillance encompasses phenotypic and genotypic methods, each with specific strengths and limitations. For instance, whole-genome sequencing (WGS) can track AMR spread, but this approach is limited to known AMR genes and mutations. Furthermore, the presence of an AMR gene may not necessarily translate to phenotypic resistance if the gene is truncated or harbors frameshift mutations [3].
In contrast, phenotypic tests cannot evaluate AMR spread patterns but demonstrate a microbe’s response to an antibiotic, with direct clinical implications relevant to patient treatment. Furthermore, phenotypic tests might not detect inducible resistance when AMR genes are expressed only after prolonged exposure to antibiotics [4]. Therefore, an ideal surveillance system should utilize both molecular and phenotypic methods for better effectiveness. Yet, due to cost constraints and other limitations, only one approach is often adopted. Professional agencies such as the World Health Organization (WHO) recommend traditional antimicrobial susceptibility tests (AST) for AMR surveillance [5]. Similarly, the European Antimicrobial Resistance Surveillance Network [6] and the US National Antimicrobial Resistance Monitoring System [7] employ AST in their routine programs. Consequently, most developed countries have well-established AST-based monitoring programs aligned with these international bodies.
Although none of the 47 WHO members from Africa had launched comprehensive surveillance systems by 2017 [8], the political will among African countries is slowly growing. This is evidenced by the development of AMR national action plans by several member states, including Ghana, Liberia, Burkina Faso, Ethiopia, Kenya, Malawi, and South Africa [9]. Zambia launched its One Health Surveillance Platform for AMR in 2020 [10], supported by over ten hospitals that perform laboratory-based AST during routine operations. Local researchers have utilized the data generated by these hospitals to develop institutional antibiograms for clinicians in the country. For example, Roth et al. (2021) recently published treatment guidelines for infectious disease specialists and other practitioners based on susceptibility data recorded at the University Teaching Hospital (UTH) from 2015 to 2017 [11].
While AMR is a broad phenomenon encompassing various microbes, Enterobacterales resistant to third-generation cephalosporins (3GCs) are among the most dreaded because of their associated high mortality in humans [12,13]. However, factors driving the emergence of 3GC resistance are still poorly understood. This study aimed to evaluate the resistance trends and patterns among bacteria tested from 2015 to 2020. Furthermore, the relationship between 3GC usage and resistance among Enterobacterales was also explored.
Methods
Study site
The UTH is the largest hospital in Zambia, with a bed capacity of 1655. Being the highest-level referral hospital, the UTH provides services to all ten provinces, yielding results generalizable to the country. We obtained data on AMR in bacterial species and AMU between 2015 and 2020 at the UTH. The study period was chosen based on data available at the time of collection in September 2021. The data was previously collected using the UTH’s robust Laboratory Information System that uses Data Intensive Systems and Applications, making the data uniform despite being entered by different personnel over time.
Analysis of AST data
To identify AST patterns at the UTH, raw data was collected for microorganisms isolated at the Microbiology Laboratory from 2015 to 2020 (S1 Table). The UTH ensured patient anonymity by unlinking personal data from patient identifiers prior to availing data for analysis. The data included microbial species and their AST results previously obtained by the VITEK 2 compact (bioMe’rieux, France), using VITEK® 2 AST-GN86 and AST-GP67 cards for Gram-negative and Gram-positive bacteria, respectively. Quality control of these VITEK cards was performed using the standard laboratory strain of Escherichia coli 25922. A cascade testing of antibiotics was used, and the breakpoints, which were based on the Clinical and Laboratory Standards Institute guidelines, were constant over the years. However, when VITEK cards were unavailable, ASTs were performed manually by disk diffusion, though the frequency of such occurrences was not determined. Furthermore, the antibiotics used for disk diffusion were based on the availability of disks.
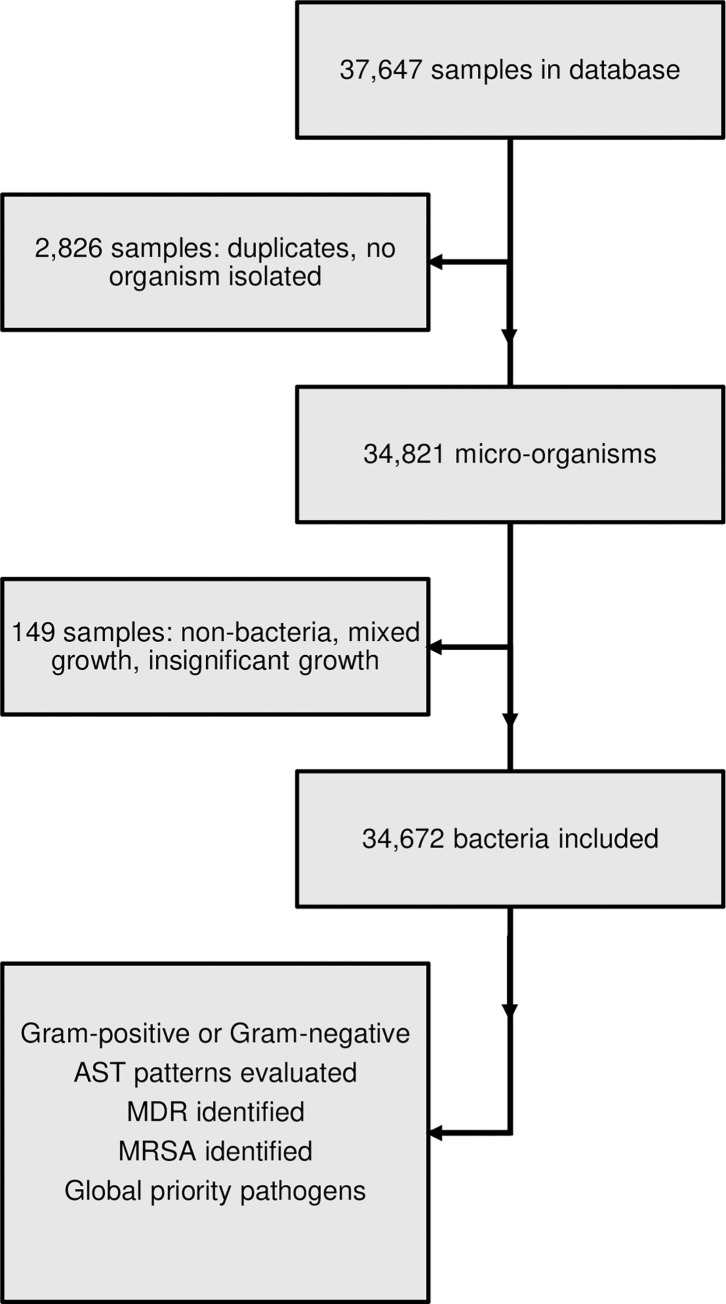
Normal flora (e.g., E. coli in stool samples) that are not routinely reported were not part of the data. Also, non-bacteria (e.g., Cryptococcus, Candida, Prototheca, etc.) were excluded from the data pool, along with samples having mixed or insignificant growth. Furthermore, duplicated data was trimmed to one entry, and samples with no organisms isolated were removed from the dataset (Fig 1). The bacteria were then classified as either Gram-positive or Gram-negative, and the frequency of each species was computed. Data manipulation was achieved with the R packages dplyr v1.0.7 [14] and reshape2 v1.4.4 [15], and AMR patterns for selected species were visualized using ggplot2 v3.3.5 [16]. Categorical variables were assessed by Chi-square if all the values of the generated 2 x 2 Table were ≥ 5, while the Fisher’s exact test was used whenever this condition was not fulfilled. Furthermore, odds ratios were determined with the epi.2by2 command of the epiR package. Finally, numeric variables were analyzed using Pearson’s product moment correlation in R.
Fig 1. Study flowchart.
The figure shows the collection and analysis of data on bacterial strains isolated at the UTH Microbiology Laboratory. Duplicates and samples with insignificant or no growth, no bacteria, and mixed growth were excluded from the dataset. The information was used to identify Gram-positive and Gram-negative bacteria, MDR, MRSA, and WHO global priority pathogens.
To identify multidrug resistance (MDR), drugs were grouped by antimicrobial class, and multidrug-resistant isolates were defined as those resistant to one or more agents from at least three categories [17]. Furthermore, methicillin-resistant Staphylococcus aureus (MRSA) was defined as S. aureus isolates with reported resistance to cefoxitin (FOX) [18]. Finally, global priority pathogens listed by the WHO [19] were characterized by resistance to a representative antibiotic for each drug class. Based on testing frequency, imipenem (IPM) represented carbapenems, while ciprofloxacin (CIP) and cefotaxime (CTX) represented fluoroquinolones and 3GCs, respectively.
Association of AMU with AMR
To quantify the usage of antimicrobials, we extracted hospital pharmacy data on the antibiotics dispensed monthly to the medical wards (E-block, Internal Medicine) in 2016, 2017, 2018, and 2020. Notably, there was no available data for 2015 and 2019 due to technical and human resource challenges. The medical wards were conveniently selected due to the availability of patient admission records. Using the Anatomical Therapeutic Chemical classification system [20], AMU was expressed as the Defined Daily Dose (DDD) per 100-patient days. Due to the cascade testing of antibiotics, AST data included antibiotics from the same class. Therefore, to avoid double-counting, AMR to 3GCs was defined as the percentage of isolates resistant to cefotaxime (CTX); CTX was chosen as a representative 3GC based on the testing frequency and clinical usage.
Ethical issues
Ethical clearance was obtained from the Excellence in Research Ethics and Science (ERES; Reference number 2015-Feb-018) Converge. Furthermore, permission to use data was obtained from the UTH management, Ministry of Health under the Government of the Republic of Zambia. This study is part of the Government policy on monitoring AMR trends in Zambia. Patient anonymity was ensured by unlinking personal data from patient identifiers.
Results
Species distribution varied among clinical sources
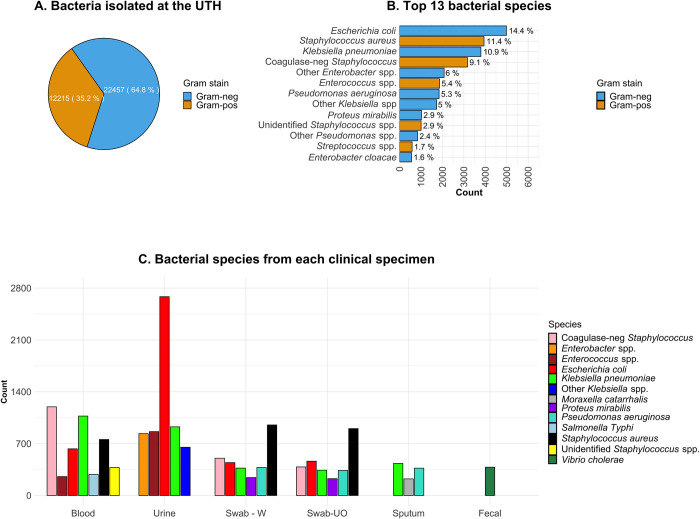
From the review of UTH microbiology data, we found that 34,672 bacterial isolates were collected between 2015 and 2020, with Gram-negative species (22,457/34,672; 64.8%) being more abundant (Fig 2A, S2 Table). Overall, E. coli was the most predominant (4,986/34,672; 14.4%), followed by S. aureus (3,941/34,672; 11.4%) and Klebsiella pneumoniae (3,796/34,672; 10.9%) (Fig 2B). Of the 34,672 isolates analyzed, 28,336 (81.7%) had details on the clinical source, the majority being urine (8,082/28,336; 28.5%), blood (6,728/28,336; 23.7%), wound swabs (4,328/28,336; 15.3%), and swabs of unknown origin (4,222/28,336; 14.9%) (Fig 2C).
Fig 2. Characteristics of bacteria in the study.
A. Classification of the isolated bacteria based on Gram-staining results. B. The top 13 organisms in the dataset. A cutoff prevalence of > 1.5% was used for the selection. C. Distribution of species across clinical samples. Normal flora organisms (e.g., E. coli in stool) were not included. Swab-W; wound swab. Swab-UO; swab with unknown origin.
Bacteremia cases were mainly caused by coagulase-negative Staphylococci (1,197/6,728; 17.8%), K. pneumoniae (1,072/6,728; 15.9%), S. aureus (756/6,728; 11.2%), and E. coli (630/6,728; 9.4%) (S3 Table). While a number of studies report E. coli in over 50% of bacteriuria cases [21,22], in this study, E. coli accounted for 33.2% of the cases (2,684/8,082). Meanwhile, S. aureus dominated wounds (952/4,328; 22.0%) and swabs of unknown origin (903/4,222; 21.4%). Furthermore, S. aureus had the highest frequency among Gram-positive species, with most of them isolated from wound swabs (952/3,117; 30.5%) and swabs of unknown origin (903/3,117; 29.0%). In contrast, coagulase-negative Staphylococci were more abundant in blood samples (1,197/2,524; 47.4%), with much lower frequencies in wound swabs (503/2,524; 19.9%) and swabs of unknown origin (385/2,524; 15.3%) (S3 Table). Meanwhile, most Enterococcus species were isolated from urine samples (862/1,530; 56.3%), with a much lower frequency in blood (255/1,530; 16.7%). Of the 862 Enterococcus isolates from urine, E. faecalis alone accounted for 29.7% (256/862). Finally, several bacterial species of public health concern were isolated, including 384 Vibrio cholerae strains from stool and 285 Salmonella enterica subsp. enterica serovar Typhi isolates from blood samples (Fig 2C).
AMR rates were high among the isolates
To determine the effectiveness of antibiotics, the AST results of the most isolated organisms were reviewed. The analysis showed that most drugs were less than 50% effective against the most frequently detected Gram-negative species, i.e., E. coli and K. pneumoniae (Table 1). The least effective drug was ampicillin (AMP), with only 6.8% (205/3,018) E. coli isolates being susceptible to this drug. β-lactamase inhibitors restore susceptibility to β-lactam antibiotics by irreversibly inhibiting β-lactamases [23]. Accordingly, the average proportion of E. coli (201/707, 28.4%) susceptible to AMP/sulbactam was higher than that for AMP alone. Moreover, this proportion was comparable to what we observed for co-amoxiclav (amoxicillin/clavulanic acid or AMX/CLA); 27.9% (150/538) for E. coli. The susceptibility pattern to AMX alone was not available in our data.
Table 1. Antimicrobial susceptibility pattern of E. coli and K. pneumoniae.
| E. coli | K. pneumoniae | |||||
|---|---|---|---|---|---|---|
| Drug | Tested | S | S (%)† | Tested | S | S (%)† |
| Ampicillin | 3018 | 205 | 6.8 | N/A | N/A | N/A |
| Ampicillin/sulbactam | 707 | 201 | 28.4 | 738 | 146 | 19.8 |
| Co-amoxiclav | 538 | 150 | 27.9 | 648 | 126 | 19.4 |
| Cefotaxime | 847 | 344 | 40.6 | 847 | 179 | 21.1 |
| Ceftazidime | 1067 | 324 | 30.4 | 1451 | 224 | 15.4 |
| Ceftriaxone | 871 | 295 | 33.9 | 1143 | 166 | 14.5 |
| Co-trimoxazole | 1741 | 235 | 13.5 | 1543 | 154 | 10.0 |
| Gentamicin | 1915 | 954 | 49.8 | 2396 | 831 | 34.7 |
| Nalidixic acid | 1609 | 381 | 23.7 | 671 | 166 | 24.7 |
| Norfloxacin | 2107 | 876 | 41.6 | 875 | 350 | 40.0 |
| Ciprofloxacin | 1807 | 701 | 38.8 | 2247 | 819 | 36.4 |
| Amikacin | 514 | 361 | 70.2 | 514 | 340 | 66.1 |
| Imipenem | 810 | 772 | 95.3 | 1369 | 1299 | 94.9 |
| Tobramycin | 445 | 217 | 48.8 | 527 | 133 | 25.2 |
| Tetracycline | 517 | 101 | 19.5 | 505 | 165 | 32.7 |
| Nitrofurantoin ‡ | 2632 | 1750 | 66.5 | 1539 | 553 | 35.9 |
†An antibiotic was considered effective if > 50% of the tested isolates were susceptible.
‡Nitrofurantoin was effective against E. coli but not against K. pneumoniae, N/A; Not Applicable.
S; susceptible.
Equally, 3GCs showed poor activity against Gram-negative species, with only a few isolates susceptible to CTX, ceftazidime (CAZ), and ceftriaxone (CRO) (Table 1). In addition, most non-β-lactam drugs also displayed low activity levels, as observed for co-trimoxazole (sulfamethoxazole/trimethoprim or SXT), tetracycline, gentamicin (GEN), nalidixic acid, norfloxacin, and CIP. On the other hand, two drugs showed good (> 50%) activity against E. coli and K. pneumoniae. Specifically, amikacin (AMK) exhibited effectiveness in over two-thirds of the isolates, while IPM was active in about 95%. Furthermore, nitrofurantoin (NIT) was active against 66.5% (1,750/2,632) of E. coli isolates, but its effectiveness against K. pneumoniae was only 35.9% (553/1,539) (Table 1).
Notably, the number of drugs effective against S. aureus was higher than those against E. coli and K. pneumoniae (Table 2). Generally, β-lactam antibiotics were ineffective, displaying antimicrobial activity in less than 50% of the tested S. aureus isolates. For instance, penicillin (PEN) and AMP were only effective in 11.6% (321/2,760) and 20.1% (38/189) of the isolates, respectively, while CTX and CRO had less than 50% effectiveness. However, unlike the observations made in E. coli and K. pneumoniae, a combination of AMX and CLA was effective in over 50% of the S. aureus isolates. Additionally, most non-β-lactam antibiotics were active against these isolates, with the highest effectiveness observed for linezolid (LZD) (424/451; 94.0%), vancomycin (VAN) (284/303; 93.7%), and NIT (323/346; 93.3%) (Table 2).
Table 2. Antimicrobial susceptibility pattern of S. aureus.
| Drug | Tested | S | S (%)† |
|---|---|---|---|
| Ampicillin | 189 | 38 | 20.1 |
| Penicillin | 2760 | 321 | 11.6 |
| Co-amoxiclav | 376 | 240 | 63.8 |
| Cefotaxime | 742 | 312 | 42.0 |
| Chloramphenicol | 1332 | 1054 | 79.1 |
| Ceftriaxone | 383 | 181 | 47.3 |
| Co-trimoxazole | 1477 | 363 | 24.6 |
| Gentamicin | 2408 | 1491 | 61.9 |
| Clindamycin | 1314 | 978 | 74.4 |
| Levofloxacin | 238 | 153 | 64.3 |
| Ciprofloxacin | 2507 | 1413 | 56.4 |
| Amikacin | 242 | 175 | 72.3 |
| Linezolid | 451 | 424 | 94.0 |
| Vancomycin | 303 | 284 | 93.7 |
| Tetracycline | 620 | 333 | 53.7 |
| Nitrofurantoin | 346 | 323 | 93.3 |
| Erythromycin | 2946 | 1427 | 48.4 |
| Moxifloxacin | 190 | 129 | 67.9 |
†An antibiotic was considered effective if > 50% of the tested isolates were susceptible.
S; susceptible.
High MDR rates were detected among the isolates
To assess the level of MDR, the proportion of isolates resistant to at least one antibiotic from three or more drug classes was evaluated. We found that 38.8% (1,934/4,980) of E. coli and 52.4% (2,079/3,791) of K. pneumoniae isolates exhibited MDR phenotypes (Table 3). In addition, the MDR frequencies were significantly higher in blood samples compared to urine for both E. coli (Odds Ratio (OR) = 2.12, 95% CI = 1.76–2.56) and K. pneumoniae (OR = 8.18, 95% CI = 6.66–10.05) (S4 Table).
Table 3. MDR prevalence among E. coli, K. pneumoniae, and S. aureus.
| Species | Total screened | MDR phenotype (%) | ||
| Yes | No | |||
| E. coli | 4980 | 1934 (38.8) | 3046 (61.2) | |
| K. pneumoniae | 3971 | 2079 (52.4) | 1892 (47.6) | |
| S. aureus (overall) | 3420 | 1460 (42.7) | 1960 (57.3) | |
| S. aureus (MRSA) | 973 | 973 (100) | 0 (0) | |
| S. aureus (MSSA) | 1178 | 175 (14.9) | 1003 (85.1) | |
| S. aureus (FOX-Int) | 30 | 10 (33.3) | 20 (66.7) | |
| MRSA antibiotic susceptibility | ||||
| Drug | Total tested | S (%) | I (%) | R (%) |
| Ciprofloxacin | 749 | 258 (34.4) | 70 (9.3) | 421(56.2) |
| Gentamicin | 716 | 304 (42.5) | 59 (8.2) | 353 (49.3) |
| Clindamycin | 364 | 208 (57.1) | 53 (14.6) | 103 (28.3) |
| Chloramphenicol | 298 | 205 (68.8) | 24 (8.1) | 69 (33.7) |
| Linezolid | 183 | 166 (90.7) | 1 (0.5) | 16 (8.7) |
| Nitrofurantoin | 75 | 69 (92.0) | 3 (4.0) | 3 (4.0) |
| Vancomycin | 76 | 71 (93.4) | 0 (0.0) | 5 (6.6) |
| Oxacillin | 112 | 4 (3.6) | 0 (0.0) | 108 (96.4) |
S; susceptible. I; intermediate. R; resistant.
For S. aureus, the overall MDR prevalence was 42.7% (1,460/3,420), with higher odds of occurrence in blood than wound swabs (OR = 1.25, 95% CI = 1.02–1.53) (S4 Table). To identify MRSA, the susceptibility of the isolates to FOX was assessed. Of the 2,181 isolates with FOX AST results, 973 (44.6%) were classified as MRSA, while 1,178 (54.0%) were sensitive to FOX and categorized as methicillin-susceptible S. aureus (MSSA) (Table 3). Further analysis showed that while all 973 (100%) MRSA exhibited MDR, only 14.9% (175/1,178) MSSA displayed MDR. Despite the high MDR prevalence among MRSA, some drugs showed high activity against these isolates. Specifically, VAN was effective in 93.4% (71/76) MRSA isolates, with NIT and LZD showing 92.0% (69/75) and 90.7% (166/183) effectiveness, respectively (Table 3).
AMR rates varied over time
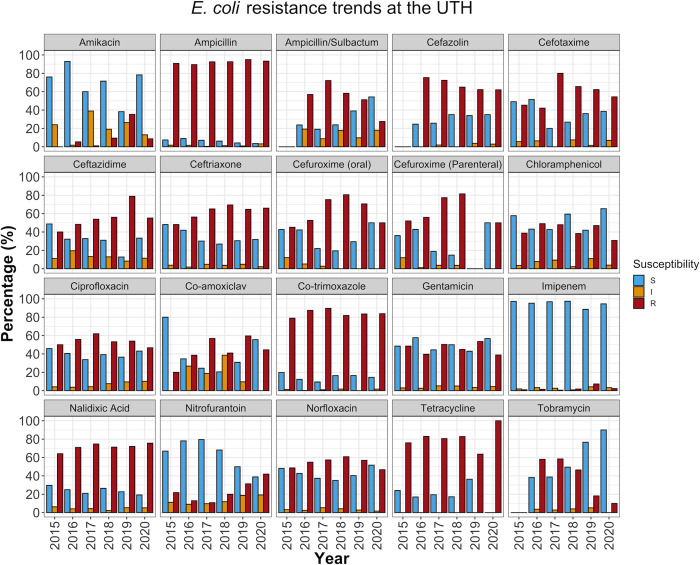
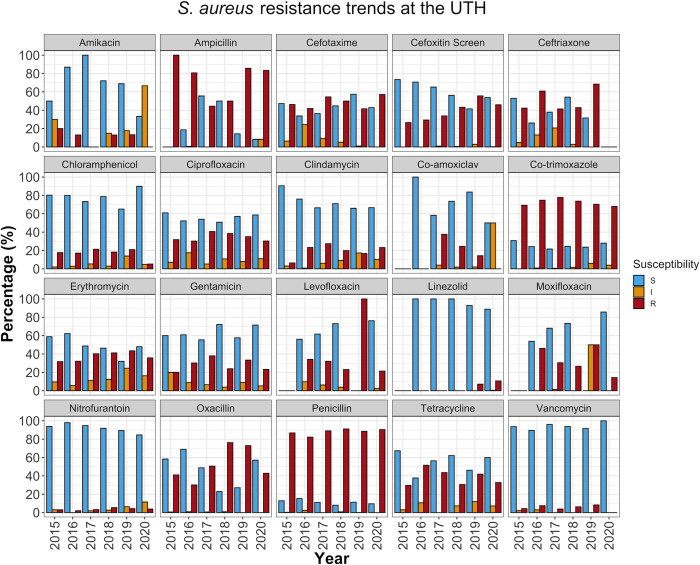
To determine the annual trends in AMR patterns over the study period, we stratified the antibiotic susceptibilities of the isolates by year. We found that some drugs that displayed good (> 50%) activity overall had lost effectiveness over time. For example, NIT, which showed an overall efficacy of 66.5% (1750/2632) in E. coli (Table 1), was more effective in the first half of the study period, with a peak effectiveness of 79.5% (435/547) in 2017. However, NIT effectiveness reduced to 38.8% (101/260) over the next three years (2018 to 2020) (P < 0.001) (Fig 3, S5 Table). A downward trend was also observed in S. aureus, where NIT effectiveness reduced from a peak of 98.0% (48/49) in 2016 to 84.6% (22/26) by 2020 (P = 0.046) (Fig 4, S5 Table).
Fig 3. AST pattern for E. coli.
The data was segmented into one-year intervals from 2015 to 2020. The plot represents the percentage of E. coli isolates susceptible, resistant, or exhibiting intermediate resistance to various antimicrobial drugs. The blue bars show the overall effectiveness of the drugs in a particular year. S (blue bars); susceptible strains. I (orange bars); strains with intermediate resistance; R (red bars); resistant strains.
Fig 4. AST pattern for S. aureus.
The figure represents the percentage of S. aureus isolates susceptible, resistant, or exhibiting intermediate resistance to various antimicrobial drugs. The blue bars show the overall effectiveness of the drugs in a particular year. S (blue bars); susceptible strains. I (orange bars); strains with intermediate resistance; R (red bars); resistant strains.
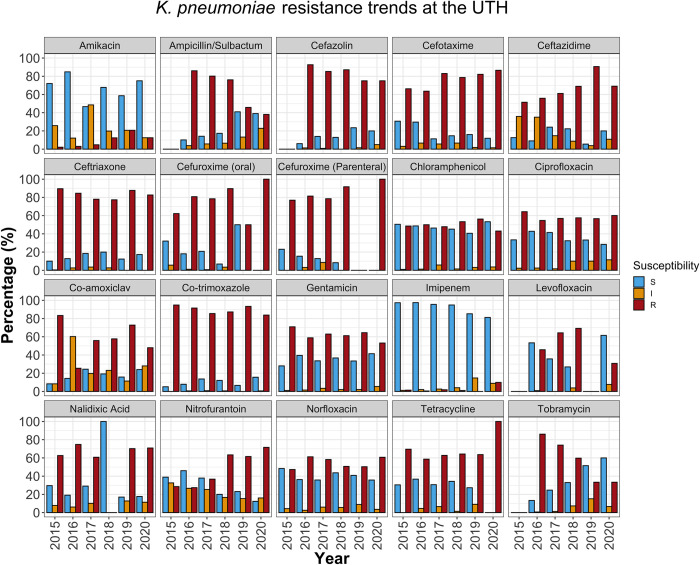
On the other hand, GEN activity rarely exceeded 50% and 40% in E. coli (Fig 3) and K. pneumoniae (Fig 5), respectively. Furthermore, while GEN and kanamycin (KAN) were dispensed during the study period (S6 Table), susceptibility to tobramycin (TOB) increased between 2017 and 2020, from around 40% to 90% in E. coli (Fig 3) and 23% to 60% in K. pneumoniae (Fig 5). This is consistent with classic research on aminoglycoside resistance, which suggests limited cross-resistance among class members [24], with TOB showing potency in isolates resistant to GEN or KAN [25].
Fig 5. AST pattern for K. pneumoniae.
The plot shows the percentage of K. pneumoniae isolates susceptible, resistant, or exhibiting intermediate resistance to various antimicrobial drugs. The blue bars represent the overall effectiveness of the drugs in a particular year. S (blue bars); susceptible strains. I (orange bars); strains with intermediate resistance; R (red bars); resistant strains.
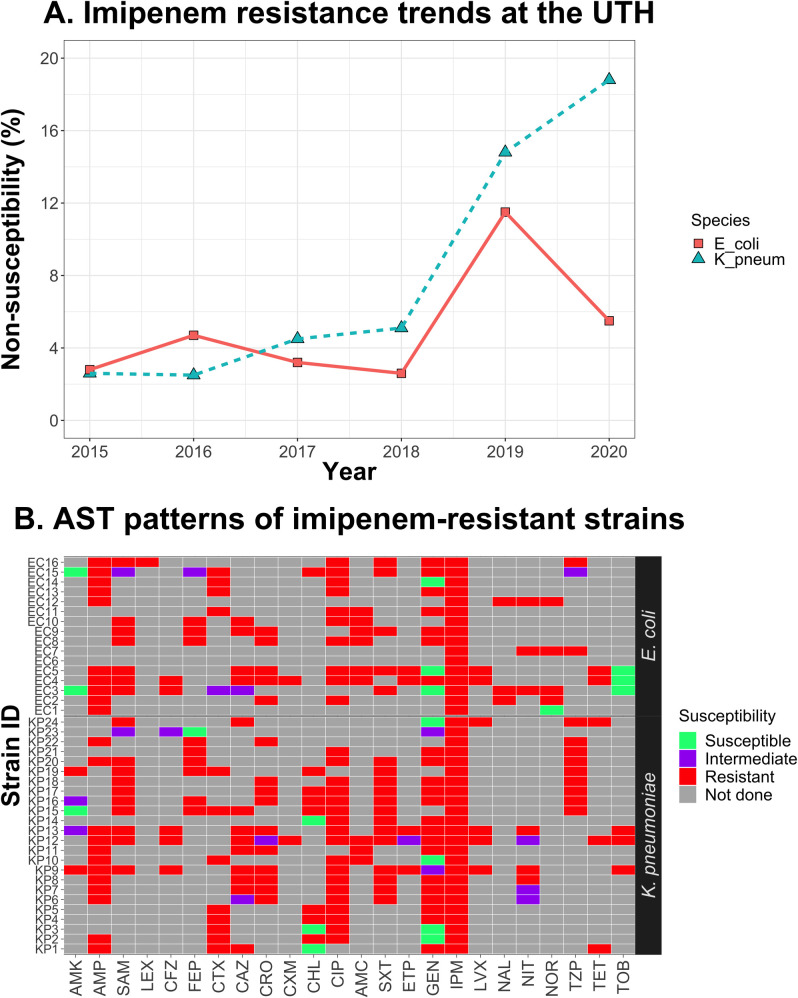
Furthermore, we observed an increase in MRSA prevalence, typically detected based on FOX resistance [18]. Specifically, FOX effectiveness, at 73.5% (36/49) in 2015, decreased progressively, reaching 41.5% (344/829) in 2019 (P < 0.001) and 53.8% (226/420) in 2020 (P = 0.013) (S5 Table). Finally, we also observed a drop in IPM effectiveness against E. coli (P = 0.012) and K. pneumoniae (P = 0.048) in 2019. Although susceptibility was restored in E. coli in 2020 (P = 0.306), IPM effectiveness against K. pneumoniae reduced further (P = 0.006) (Fig 6A, S5 Table). Overall, IPM non-susceptibility was observed in 108 isolates, of which 40 (37%) were resistant, and 68 (63%) exhibited intermediate susceptibility. Previous studies have recommended that patients infected with strains displaying intermediate susceptibility be treated with a higher dose of the same drug [26], but resistant isolates necessitate using a different antibiotic. Therefore, we explored the 40 IPM-resistant isolates for possible alternative agents. We noted that only 35% (14/40) were susceptible to at least one agent, although no defined pattern existed. Nevertheless, IPM-resistant E. coli isolates tested against AMK (n = 2) and TOB (n = 3) were susceptible to these drugs; however, these sample sizes were too low to allow any meaningful interpretation of the data (Fig 6B).
Fig 6. IPM non-susceptibility in E. coli and K. pneumoniae.
A. Assessment of IPM efficacy in E. coli and K. pneumoniae from 2015 to 2020. Red squares and turquoise triangles represent the percentage of imipenem non-susceptible (i.e., resistant or intermediate) strains of E. coli and K. pneumoniae, respectively, per year. B. Susceptibility patterns of IPM-resistant isolates against other antimicrobial drugs.
Correlation between 3GC usage and resistance among Enterobacterales
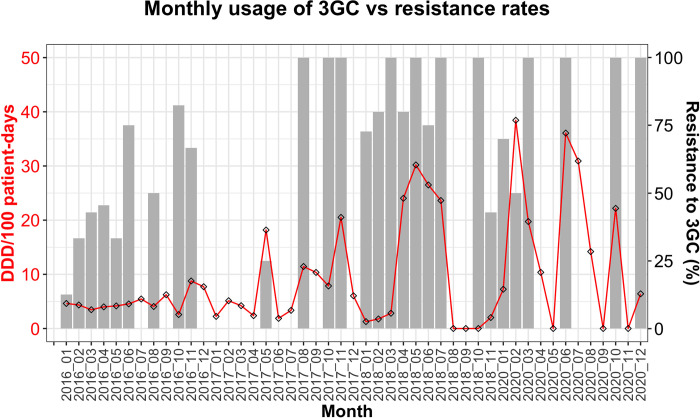
3GCs are a clinically significant class of antimicrobials because of their effectiveness as first- and second-line drugs in a wide range of bacterial infections. However, the reported high usage of 3GCs at the UTH [27] could drive the emergence of AMR in this vital drug class. To quantify the use of 3GCs, we evaluated the quantities of CTX, CAZ, and CRO dispensed monthly to the medical wards (E-block) for use among inpatients. From the available data (2016, 2017, 2018, and 2020), the most used 3GCs were CTX (226.4 DDDs/100 patient-days) and CRO (223.4 DDDs/100 patient-days), while CAZ (1.5 DDDs/100 patient-days) was rarely used (S7 Table). Notably, there were no records of oral 3GCs being dispensed during the period under review. By visually inspecting the monthly usage and resistance trends in over 15 species belonging to Enterobacterales (n = 690), we noted a relationship between 3GC use and resistance. Precisely, increases in 3GC use coincided with high 3GC resistance and vice versa (Fig 7). Furthermore, there was a weak positive correlation between the two variables (r = 0.38, 95% CI = 0.11–0.60).
Fig 7. Relationship between 3GC use and resistance.
The monthly consumption of 3GCs was expressed as DDD per 100-patient days (red line, left y-axis), while the percentage of Enterobacterales resistant to 3GCs (right y-axis) is represented by grey bars.
Detection of WHO priority pathogens
Under the "critical" priority tier, we found carbapenem-resistant Acinetobacter baumanii and Pseudomonas aeruginosa at 7.7% (10/130) and 4.4% (20/454), respectively (S8 Table). We also found carbapenem-resistant Enterobacterales belonging to various genera, including Proteus, Enterobacter, Citrobacter, and Salmonella, with resistance rates ranging from 0.7 to 5.5%. In addition, the species in this priority category showed high levels of 3GC resistance, especially K. pneumoniae (596/806; 73.9%), K. oxytoca (55/96; 57.3%), E. coli (465/847; 54.9%), and E. cloacae (59/109; 54.1%) (S8 Table).
The "high" priority pathogens included VAN-resistant Enterococcus faecium (2/87; 2.3%) and S. aureus (15/303; 5.0%), MRSA (973/2,181; 44.6%), quinolone-resistant S. enterica serovar Typhi (43/113; 38.1%), and Neisseria gonorrheae resistant to quinolones (7/10; 70%) or 3GCs (2/5; 40%). However, no Helicobacter or Campylobacter species were reported during the study period. Finally, the "medium" priority tier was represented by PEN-non-susceptible Streptococcus pneumoniae (13/66; 19.7%), AMP-resistant Haemophilus influenzae (16/45; 35.6%), and two species of fluoroquinolone-resistant Shigella, namely flexneri (2/93; 5.1%) and dysenteriae (3/9; 33.3%).
Discussion
Using retrospective data (2015–2020) of bacterial isolates from clinical samples at the UTH, we found several Gram-positive and Gram-negative species with high AMR rates that fluctuated over time. Furthermore, MDR was frequent in E. coli, K. pneumoniae, and S. aureus, especially among isolates obtained from blood samples. Importantly, we found a weak positive relationship between monthly 3GC use and resistance among Enterobacterales isolated from patients in medical wards.
The high prevalence of MRSA observed in this study coincides with the reported increased use of β-lactams at the UTH [28]. Similarly, studies elsewhere have associated heavy antimicrobial use with MRSA [29]. MRSA produces a mecA-encoded penicillin-binding protein (i.e., PBP2a) with a low affinity for β-lactams. However, its susceptibility to various anti-staphylococcal penicillins may vary, making phenotypic characterization challenging. For instance, 3.6% of the cefoxitin-resistant S. aureus in this study were susceptible to oxacillin (Table 3), consistent with previous findings which suggest that oxacillin is a less reliable predictor of MRSA [30]. Despite the high MDR prevalence among MRSA (Table 3), the MRSA in this study were largely susceptible to non-β-lactam antibiotics. For instance, VAN, the first-line treatment for MRSA infections [31], and LZD, which is associated with better clinical outcomes and fewer adverse effects [32], exhibited high activity against MRSA. However, our results already suggest the emergence of LZD resistance from 2019 (Fig 4).
Among Gram-negative bacteria, E. coli and K. pneumoniae exhibited resistance to most antibiotics tested. Notably, 54.9% (465/847) of E. coli and 73.9% (596/806) K. pneumoniae isolates were resistant to 3GCs (i.e., CTX) (S8 Table), thus meeting the "critical" category of global pathogens listed by the WHO [19]. In addition, several other Enterobacterales exhibited high 3GC resistance, including K. oxytoca (57.3%), E. cloacae (54.1%), E. agglomerans (50.0%), and Proteus mirabilis (42.9%). By analyzing monthly ward-level data for 690 Enterobacterale isolates, we found that the usage of 3GCs was related with resistance to this drug class. However, our AMU estimates were based on antibiotic doses dispensed by the pharmacy unit, which may not accurately reflect the amounts administered to patients. Therefore, future studies should ascertain AMU by directly reviewing patient drug charts and prescriptions.
The likely mechanism of 3GC resistance could be the production of extended-spectrum β-lactamases (ESBLs) that hydrolyze β-lactam antibiotics, such as CTX. We recently characterized CTX-resistant Enterobacteriaceae from the UTH, where we observed the blaCTX-M ESBL gene in 97.8% (45/46) isolates [33]. Also, we found other AMR genes encoding resistance to several antibiotics, which could explain the high MDR rates observed in this study. Although MDR in E. coli and K. pneumoniae was more common among isolates from blood compared to urine, our dataset lacked information on gender, which could confound the results. For instance, while urinary tract infection (UTI) is generally more common in females [34], UTI complicated by multidrug-resistant ESBL producers is commonly associated with the male gender [35]. Therefore, the proportion of MDR among urine isolates would depend partly on the gender composition of the tested population; thus, stratifying results by gender would give a more accurate comparison. In addition, while the interpretation of manual disk diffusion was standardized and quality-controlled using the automated VITEK 2 compact, the tests depended on disk availability, leading to discrepancies in the number of antibiotics tested (S1 Table). Furthermore, our data lacked bacterial species-disease information as well as details on antibiotic use in non-medical wards. Thus, future studies should be aimed at addressing these shortcomings.
While most E. coli and K. pneumoniae isolates in this study were susceptible to carbapenems, IPM resistance increased in 2019. Unfortunately, therapeutic options for carbapenem-resistant E. coli and K. pneumoniae were limited, mainly due to the non-availability of alternatives such as colistin. Other "critical" priority pathogens included A. Baumanni and P. aeruginosa, resistant to carbapenems, and several Enterobacteriaceae species resistant to carbapenems and 3GCs. Furthermore, several "high" and "medium" priority pathogens were detected, including VAN-resistant E. faecium and fluoroquinolone-resistant S. enterica serovar Typhi. However, while our study is based on an exhaustive list of all the bacterial isolates processed during the study period, some isolates did not have susceptibility results, limiting our ability to estimate the true prevalence of some priority pathogens. For example, only 31.0% (113/364) of the S. enterica serovar Typhi isolates were tested for fluoroquinolone resistance. Similarly, only 30.6% (66/216) of the isolated S. pneumoniae had susceptibility results for AMP. Nevertheless, the frequently isolated pathogens, such as E. coli, K. pneumoniae, and S. aureus, had sufficient AST data to allow valid inferences.
The routine surveillance of AMR may be necessary to design local treatment protocols; however, our results show that such protocols require regular revision for optimal empirical therapy. For instance, clindamycin (CLI) was effective in about 90% of S. aureus isolates in 2015, but its activity was below 70% in 2020. Despite its nonuse, this reduction in CLI effectiveness could have arisen from cross-resistance with macrolides (e.g., erythromycin), which were dispensed during the period under review (S6 Table). However, confirming this hypothesis requires screening isolates for the erm gene, which encodes a target-modifying enzyme to cause resistance to macrolides, lincosamides (e.g., CLI), and streptogramin B [36]. Furthermore, confirmation of other AMR mechanisms will be necessary to implement target-specific AMR control measures effectively.
For example, the observed carbapenem resistance among several Gram-negative species could have been caused by increased active efflux of drugs across the membrane, alterations in the outer membrane porins, or mutations leading to newer PBPs [37]. Equally, resistance could have been due to carbapenemases encoded on plasmids that expand the bacterial host range [38], thus requiring more rigorous control measures than adaptive resistance. The limitations in our data could be addressed by genotypic studies that detect AMR genes and mutations and distinguish clonal AMR spread from horizontal gene transfer. Specifically, there is a need to supplement AST data with WGS to allow robust AMR transmission modeling.
Conclusion
We analyzed AST data for bacterial species isolated from diverse clinical sources at the UTH between 2015 and 2020. Our results revealed varying AMR rates over the study period, suggesting that antibiograms should be updated regularly based on AMR trends. Furthermore, there was a relationship between 3GC usage and resistance among Enterobacterales from patients in medical wards, emphasizing the need to strengthen antimicrobial stewardship. Finally, there were limited treatment options for carbapenem-resistant isolates, highlighting the need to preserve essential antibiotics and explore other last-resort medicines, such as colistin. We anticipate that this study will help guide policy formulation on antimicrobial stewardship.
Supporting information
(XLSX)
(XLS)
(DOCX)
(DOCX)
(DOCX)
(DOCX)
(XLS)
(DOCX)
Data Availability
All relevant data are within the manuscript and its Supporting Information files. We have added the original dataset from the UTH Microbiology Laboratory as S1 Table (anonymized patient IDs).
Funding Statement
This research project was supported in part by a grant from the Ministry of Education, Culture, Sports, Science and Technology (MEXT), Japan, for the Joint Research Program of the Hokkaido University International Institute for Zoonosis Control to YS, Japan Agency for Medical Research and Development (AMED) under Grant Number JP223fa627005 and JP22wm0125008 to YS, JSPS KAKENHI under Grant Number 21K15430 to AP. The funders had no role in study design, data collection and analysis, decision to publish, or preparation of the manuscript.
References
- 1.O’Neill J. Antimicrobial Resistance: Tackling a crisis for the health and wealth of nations. 2014. Available from: https://amr-review.org/sites/default/files/AMR%20Review%20Paper%20-%20Tackling%20a%20crisis%20for%20the%20health%20and%20wealth%20of%20nations_1.pdf. [Google Scholar]
- 2.The World Health Organization. Global action plan on antimicrobial resistance (2015). 2016. Available from: https://www.who.int/publications/i/item/9789241509763. [DOI] [PubMed] [Google Scholar]
- 3.Ocejo M, Oporto B, Lavín JL, Hurtado A. Whole genome-based characterisation of antimicrobial resistance and genetic diversity in Campylobacter jejuni and Campylobacter coli from ruminants. Sci Rep. 2021;11(1):8998. Epub 20210426. doi: 10.1038/s41598-021-88318-0 ; PubMed Central PMCID: PMC8076188. [DOI] [PMC free article] [PubMed] [Google Scholar]
- 4.Nash KA, Brown-Elliott BA, Wallace RJ Jr. A novel gene, erm(41), confers inducible macrolide resistance to clinical isolates of Mycobacterium abscessus but is absent from Mycobacterium chelonae. Antimicrob Agents Chemother. 2009;53(4):1367–76. Epub 20090126. doi: 10.1128/AAC.01275-08 ; PubMed Central PMCID: PMC2663066. [DOI] [PMC free article] [PubMed] [Google Scholar]
- 5.The World Health Organization. Surveillance standards for antimicrobial resistance. 2002. Available from: http://apps.who.int/iris/bitstream/handle/10665/67426/WHO_CDS_CSR_DRS_2001.5.pdf?sequence=1. [Google Scholar]
- 6.European Centre for Disease Prevention and Control. Antimicrobial resistance in the EU/EEA (EARS-Net)—Annual Epidemiological Report for 2019. Stockholm:ECDC. 2020. Available from: https://www.ecdc.europa.eu/sites/default/files/documents/surveillance-antimicrobial-resistance-Europe-2019.pdf. [Google Scholar]
- 7.Centers for Disease Control and Prevention. The National Antimicrobial Resistance Monitoring System: Strategic Plan 2021–2025. 2020. Available from: https://www.fda.gov/media/79976/download. [Google Scholar]
- 8.Essack SY, Desta AT, Abotsi RE, Agoba EE. Antimicrobial resistance in the WHO African region: current status and roadmap for action. Journal of Public Health. 2016;39(1):8–13. doi: 10.1093/pubmed/fdw015 [DOI] [PMC free article] [PubMed] [Google Scholar]
- 9.The World Health Organization. Library of AMR national action plans. 2021. Available from: https://www.who.int/teams/surveillance-prevention-control-AMR/national-action-plan-monitoring-evaluation/library-of-national-action-plans. [Google Scholar]
- 10.The Zambia National Public Health Institute. Baseline Information for Integrated Antimicrobial Resistance Surveillance in Zambia. 2020. Available from: https://cdn.cseindia.org/attachments/0.42695000_1580121963_Baseline-information-for-integrated-surveillance.pdf. [Google Scholar]
- 11.Roth BM, Laps A, Yamba K, Heil EL, Johnson JK, Stafford K, et al. Antibiogram Development in the Setting of a High Frequency of Multi-Drug Resistant Organisms at University Teaching Hospital, Lusaka, Zambia. Antibiotics. 2021;10(7):782. doi: 10.3390/antibiotics10070782 [DOI] [PMC free article] [PubMed] [Google Scholar]
- 12.Wang JL, Lee CC, Lee CH, Lee NY, Hsieh CC, Hung YP, et al. Clinical Impact of Sequence Type 131 in Adults with Community-Onset Monomicrobial Escherichia Coli Bacteremia. J Clin Med. 2018;7(12). Epub 20181203. doi: 10.3390/jcm7120508 ; PubMed Central PMCID: PMC6306926. [DOI] [PMC free article] [PubMed] [Google Scholar]
- 13.World Health Organization. WHO publishes list of bacteria for which new antibiotics are urgently needed. 2017. Available from: https://www.who.int/news/item/27-02-2017-who-publishes-list-of-bacteria-for-which-new-antibiotics-are-urgently-needed. [Google Scholar]
- 14.Wickham H, Francois R, Henry L, Müller K. dplyr: A grammar of data manipulation. R package version 04. 2015;3:p156. [Google Scholar]
- 15.Wickham H. Reshaping data with the reshape package. Journal of statistical software. 2007;21(12):1–20. [Google Scholar]
- 16.Wickham H. ggplot2: Elegant Graphics for Data Analysis 2016. https://ggplot2 tidyverse org 2021;10:978–3. [Google Scholar]
- 17.Magiorakos AP, Srinivasan A, Carey RB, Carmeli Y, Falagas ME, Giske CG, et al. Multidrug-resistant, extensively drug-resistant and pandrug-resistant bacteria: an international expert proposal for interim standard definitions for acquired resistance. Clin Microbiol Infect. 2012;18(3):268–81. Epub 2011/07/29. doi: 10.1111/j.1469-0691.2011.03570.x . [DOI] [PubMed] [Google Scholar]
- 18.Fernandes CJ, Fernandes LA, Collignon P, Resistance obotAGoA. Cefoxitin resistance as a surrogate marker for the detection of methicillin-resistant Staphylococcus aureus. Journal of Antimicrobial Chemotherapy. 2005;55(4):506–10. doi: 10.1093/jac/dki052 [DOI] [PubMed] [Google Scholar]
- 19.World Health Organization. WHO publishes list of bacteria for which new antibiotics are urgently needed. 2017. Available from: https://www.who.int/news/item/27-02-2017-who-publishes-list-of-bacteria-for-which-new-antibiotics-are-urgently-needed. [Google Scholar]
- 20.World Health Organization. WHO Collaborating Centre for Drug Statistics Methodology: ATC classification index with DDDs and Guidelines for ATC classification and DDD assignment. Oslo, Norway: Norwegian Institute of Public Health. 2006:15. [Google Scholar]
- 21.Vranic SM, Zatric N, Rebic V, Aljicevic M, Abdulzaimovic A. The Most Frequent Isolates from Outpatients with Urinary Tract Infection. Mater Sociomed. 2017;29(1):17–20. doi: 10.5455/msm.2017.29.17-20 ; PubMed Central PMCID: PMC5402357. [DOI] [PMC free article] [PubMed] [Google Scholar]
- 22.Niranjan V, Malini A. Antimicrobial resistance pattern in Escherichia coli causing urinary tract infection among inpatients. Indian J Med Res. 2014;139(6):945–8. ; PubMed Central PMCID: PMC4165009. [PMC free article] [PubMed] [Google Scholar]
- 23.Tooke CL, Hinchliffe P, Bragginton EC, Colenso CK, Hirvonen VHA, Takebayashi Y, et al. β-Lactamases and β-Lactamase Inhibitors in the 21st Century. The molecular basis of antibiotic action and resistance. 2019;431(18):3472–500. [DOI] [PMC free article] [PubMed] [Google Scholar]
- 24.Crowe C, Sanders E. Is there complete cross-resistance of gram-negative bacilli to gentamicin and tobramycin? Antimicrobial agents and chemotherapy. 1972;2(5):415–6. doi: 10.1128/AAC.2.5.415 [DOI] [PMC free article] [PubMed] [Google Scholar]
- 25.Del Bene VE, Farrar WE Jr. Tobramycin: in vitro activity and comparison with kanamycin and gentamicin. Antimicrob Agents Chemother. 1972;1(4):340–2. doi: 10.1128/AAC.1.4.340 ; PubMed Central PMCID: PMC444218. [DOI] [PMC free article] [PubMed] [Google Scholar]
- 26.Rodloff A, Bauer T, Ewig S, Kujath P, Müller E. Susceptible, intermediate, and resistant—the intensity of antibiotic action. Dtsch Arztebl Int. 2008;105(39):657–62. Epub 20080926. doi: 10.3238/arztebl.2008.0657 ; PubMed Central PMCID: PMC2701059. [DOI] [PMC free article] [PubMed] [Google Scholar]
- 27.Masich AM, Vega AD, Callahan P, Herbert A, Fwoloshi S, Zulu PM, et al. Antimicrobial usage at a large teaching hospital in Lusaka, Zambia. PLoS One. 2020;15(2):e0228555. Epub 2020/02/11. doi: 10.1371/journal.pone.0228555 ; PubMed Central PMCID: PMC7010251. [DOI] [PMC free article] [PubMed] [Google Scholar]
- 28.Mudenda W, Chikatula E, Chambula E, Mwanashimbala B, Chikuta M, Masaninga F, et al. Prescribing Patterns and Medicine Use at the University Teaching Hospital, Lusaka, Zambia. Medical Journal of Zambia. 2016;43(2):94–102. [Google Scholar]
- 29.Tacconelli E, De Angelis G, Cataldo MA, Pozzi E, Cauda R. Does antibiotic exposure increase the risk of methicillin-resistant Staphylococcus aureus (MRSA) isolation? A systematic review and meta-analysis. Journal of Antimicrobial Chemotherapy. 2007;61(1):26–38. doi: 10.1093/jac/dkm416 [DOI] [PubMed] [Google Scholar]
- 30.Pardo L, Giudice G, Mota MI, Gutiérrez C, Varela A, Algorta G, et al. Phenotypic and genotypic characterization of oxacillin-susceptible and mecA positive Staphylococcus aureus strains isolated in Uruguay. Rev Argent Microbiol. 2022;54(4):293–8. Epub 20220617. doi: 10.1016/j.ram.2022.05.004 . [DOI] [PubMed] [Google Scholar]
- 31.Liu C, Bayer A, Cosgrove SE, Daum RS, Fridkin SK, Gorwitz RJ, et al. Clinical Practice Guidelines by the Infectious Diseases Society of America for the Treatment of Methicillin-Resistant Staphylococcus aureus Infections in Adults and Children. Clinical Infectious Diseases. 2011;52(3):e18–e55. doi: 10.1093/cid/ciq146 [DOI] [PubMed] [Google Scholar]
- 32.Wunderink RG, Niederman MS, Kollef MH, Shorr AF, Kunkel MJ, Baruch A, et al. Linezolid in methicillin-resistant Staphylococcus aureus nosocomial pneumonia: a randomized, controlled study. Clin Infect Dis. 2012;54(5):621–9. Epub 20120112. doi: 10.1093/cid/cir895 . [DOI] [PubMed] [Google Scholar]
- 33.Shawa M, Furuta Y, Mulenga G, Mubanga M, Mulenga E, Zorigt T, et al. Novel chromosomal insertions of IS Ecp1-bla CTX-M-15 and diverse antimicrobial resistance genes in Zambian clinical isolates of Enterobacter cloacae and Escherichia coli. Antimicrobial Resistance & Infection Control. 2021;10(1):1–16. doi: 10.1186/s13756-021-00941-8 [DOI] [PMC free article] [PubMed] [Google Scholar]
- 34.Foxman B. Epidemiology of urinary tract infections: Incidence, morbidity, and economic costs. 2003;49(2):53–70. [DOI] [PubMed] [Google Scholar]
- 35.Raphael E, Glymour MM, Chambers HF. Trends in prevalence of extended-spectrum beta-lactamase-producing Escherichia coli isolated from patients with community- and healthcare-associated bacteriuria: results from 2014 to 2020 in an urban safety-net healthcare system. Antimicrob Resist Infect Control. 2021;10(1):118. Epub 20210811. doi: 10.1186/s13756-021-00983-y ; PubMed Central PMCID: PMC8359060. [DOI] [PMC free article] [PubMed] [Google Scholar]
- 36.Efthymia P, Constantinos P. Resistance of Staphylococci to Macrolides-Lincosamides- Streptogramins B (MLSB): Epidemiology and Mechanisms of Resistance. Rijeka: IntechOpen; 2018. p. Ch. 7. [Google Scholar]
- 37.Papp-Wallace KM, Endimiani A, Taracila MA, Bonomo RA. Carbapenems: past, present, and future. Antimicrob Agents Chemother. 2011;55(11):4943–60. Epub 20110822. doi: 10.1128/AAC.00296-11 ; PubMed Central PMCID: PMC3195018. [DOI] [PMC free article] [PubMed] [Google Scholar]
- 38.Li B, Feng J, Zhan Z, Yin Z, Jiang Q, Wei P, et al. Dissemination of KPC-2-Encoding IncX6 Plasmids Among Multiple Enterobacteriaceae Species in a Single Chinese Hospital. Frontiers in Microbiology. 2018;9(478). doi: 10.3389/fmicb.2018.00478 [DOI] [PMC free article] [PubMed] [Google Scholar]
Associated Data
This section collects any data citations, data availability statements, or supplementary materials included in this article.
Supplementary Materials
(XLSX)
(XLS)
(DOCX)
(DOCX)
(DOCX)
(DOCX)
(XLS)
(DOCX)
Data Availability Statement
All relevant data are within the manuscript and its Supporting Information files. We have added the original dataset from the UTH Microbiology Laboratory as S1 Table (anonymized patient IDs).


