

Abstract
Objective
This study aims to elucidate the long‐term benefit of newborn screening (NBS) for individuals with long‐chain 3‐hydroxy‐acyl‐CoA dehydrogenase (LCHAD) and mitochondrial trifunctional protein (MTP) deficiency, inherited metabolic diseases included in NBS programs worldwide.
Methods
German national multicenter study of individuals with confirmed LCHAD/MTP deficiency identified by NBS between 1999 and 2020 or selective metabolic screening. Analyses focused on NBS results, confirmatory diagnostics, and long‐term clinical outcomes.
Results
Sixty‐seven individuals with LCHAD/MTP deficiency were included in the study, thereof 54 identified by NBS. All screened individuals with LCHAD deficiency survived, but four with MTP deficiency (14.8%) died during the study period. Despite NBS and early treatment neonatal decompensations (28%), symptomatic disease course (94%), later metabolic decompensations (80%), cardiomyopathy (28%), myopathy (82%), hepatopathy (32%), retinopathy (17%), and/or neuropathy (22%) occurred. Hospitalization rates were high (up to a mean of 2.4 times/year). Disease courses in screened individuals with LCHAD and MTP deficiency were similar except for neuropathy, occurring earlier in individuals with MTP deficiency (median 3.9 vs. 11.4 years; p = 0.0447). Achievement of dietary goals decreased with age, from 75% in the first year of life to 12% at age 10, and consensus group recommendations on dietary management were often not achieved.
Interpretation
While NBS and early treatment result in improved (neonatal) survival, they cannot reliably prevent long‐term morbidity in screened individuals with LCHAD/MTP deficiency, highlighting the urgent need of better therapeutic strategies and the development of disease course‐altering treatment.
Introduction
Inherited deficiency of long‐chain 3‐hydroxy‐acyl‐CoA dehydrogenase (LCHAD) activity (OMIM #609016) and defects of additional enzymatic functions of the mitochondrial trifunctional protein (MTP) (OMIM #609015) impair mitochondrial β‐oxidation of fatty acids. MTP, catalyzing the second to fourth step in this pathway, is a hetero‐octamer composed of four α‐ and four β‐subunits. 1 Pathogenic biallelic variants in the HADHA (α‐subunit) or HADHB (β‐subunit) gene result in reduced enzyme activities of (a) long‐chain 3‐enoyl‐CoA hydratase (α‐subunit), (b) LCHAD (α‐subunit), and/or (c) long‐chain 3‐ketoacyl‐CoA thiolase (β‐subunit). 2 LCHAD deficiency (LCHADD) is caused by homozygosity for the common HADHA variant c.1528G>C (using transcript NM_000182.5 3 ) and is characterized by selective decrease in LCHAD activity, while MTP deficiency (MTPD) also affects additional enzymatic functions of the MTP complex, including other variants in the HADHA gene.
Due to the impaired energy production from long‐chain fatty acids, clinical symptoms predominantly occur or worsen during catabolic episodes such as febrile illness and fasting. The broad phenotypic spectrum of LCHADD/MTPD includes episodic hypoketotic hypoglycemia, cardiomyopathy, skeletal myopathy including (recurrent) rhabdomyolysis, hepatopathy, retinopathy and neuropathy, reflecting the long‐term impact of accumulating mitochondrial toxins on energy metabolism, particularly 3‐hydroxypalmitoyl‐CoA. 4 , 5 , 6 , 7
LCHADD/MTPD have been included in newborn screening (NBS) programs worldwide 8 , 9 , 10 since the 1990s. 11 , 12 , 13 In the prescreening era, mortality and morbidity were considered substantial for individuals with LCHADD/MTPD with an overall lethality in pediatric cohorts of 40%–90%. 14 , 15 , 16
Since the implementation of NBS for LCHADD/MTPD, reports on small cohorts have been published (N = 3–22 17 , 18 , 19 , 20 , 21 ), demonstrating that (a) many newborns were asymptomatic at the time of NBS report 17 , 18 , 20 and remained asymptomatic during early infancy, 17 while (b) neonatal decompensation 11 , 18 and (c) long‐term complications were not reliably prevented. 18 , 19 However, knowledge about the long‐term benefits of NBS and early intervention is still scarce.
The present national multicenter observational study aims to evaluate (a) the long‐term survival and neurological outcome of screened and early‐treated individuals with LCHADD and MTPD and (b) the impact of currently recommended dietary treatment protocols on the disease course and long‐term outcome.
Patients and Methods
Study population
The national multicenter observational study included individuals with LCHADD or MTPD (a) identified by NBS in Germany (between 1 January 1999 and 31 December 2020), extending the prospective multicenter observational NBS cohort in Southwest Germany (DRKS‐ID: DRKS00013329 11 ) and (b) patients diagnosed following the onset of symptoms.
Inclusion criteria were (a) confirmation of LCHADD or MTPD according to the national NBS guideline for the confirmation of positive NBS results 22 and (b) written informed consent of patients and/or caregivers. The study was approved by the local ethics committee of the coordinating site (University Hospital Heidelberg, application no. S‐104/2005) and subsequently by the contributing sites.
Data collection
Biochemical parameters of NBS and confirmatory diagnosis, genetic testing, medical history, clinical follow‐up parameters, and therapy were assessed prospectively at defined ages in the regional study 11 and were gathered retrospectively by systematic evaluation of medical records for the national extension cohort and for patients diagnosed after the onset of symptoms. The dietary treatment and adherence were assessed annually until the age of 10 years by analyzing the medical and dietary records of each participant retrospectively.
Classifications and definitions
In analogy to previous publications, individuals with homozygosity for the common HADHA gene variant c.1528G>C (p.Glu510Gln) 4 , 5 and/or selective decrease in the enzymatic activity of LCHAD were classified as LCHADD, while individuals with reduced activities in long‐chain 3‐enoyl‐CoA hydratase and long‐chain 3‐ketoacyl‐CoA thiolase, and other pathogenic homozygous or compound heterozygous variants of HADHA or HADHB were classified as MTPD. Participants were also grouped according to the mode of diagnosis: the NBS group includes patients identified by NBS, while the symptomatic group contains patients diagnosed after the onset of clinical symptoms. Individuals of the latter group were either missed by NBS (false‐negative), were born before the start of the NBS program for LCHADD/MTPD in Germany, or in a country without NBS for LCHADD/MTPD.
According to the literature, 14 , 16 , 23 the following symptoms (human phenotype ontology codes) were considered disease‐specific: hypoketotic hypoglycemia (HP:0001985), myopathy [i.e., (intermittent) rhabdomyolysis (HP:0003201), chronic creatine kinase (CK) elevation (HP:0003236), reduced strength (HP:0003324), muscular hypotonia (HP:0001252), and myalgia (HP: 0003326)], acute/chronic cardiomyopathy (HP:0001638), hepatopathy [i.e., selective elevation of liver enzymes (HP:0002910), hepatomegaly (HP:0002240), and/or nonalcoholic steatohepatitis (HP:0001397)], peripheral neuropathy (HP:0009830) [i.e., absence of reflexes, typical clinical signs (e.g., foot drop or peripheral muscular atrophy), and/or abnormal nerve conduction], and pigmentary retinopathy (HP:0000580) [i.e., abnormal ophthalmoscopic findings like pigment granules in the retinal pigment epithelium and/or chorioretinal atrophy]. 24 While hypoglycemia, myopathy, cardiomyopathy, and hepatopathy manifest with fluctuating severity and hence may be reversible, neuropathy and retinopathy are considered permanent or progressive, although partially reversible cases of neuropathy have recently been reported. 5 , 25 A symptomatic disease course was defined as the occurrence of at least one disease‐specific symptom and/or metabolic decompensation during the study period.
Metabolic decompensation was defined as any event requiring hospitalization for at least one night because of subclinical biochemical derangement or any clinical presentation indicating metabolic decompensation (i.e., elevated CK, hypoglycemia, metabolic acidosis, severe muscle pain, muscle weakness, and/or impaired consciousness). Events of metabolic decompensation were grouped by the occurrence of hypoglycemia and/or rhabdomyolysis and/or other manifestations. Episodes with elevated serum CK ≤ 1000 U/L were defined as imminent rhabdomyolysis, those with CK > 1000 U/L as manifest rhabdomyolysis. 18 Hospitalization was defined as any hospital stay for at least one night, either because of impending or manifest metabolic decompensation, commonly precipitated by febrile or nonfebrile infections and feeding difficulties, or for elective reasons such as confirmatory diagnostics, vaccination, clinical follow‐ups, or therapy adjustment. Annual hospitalization and decompensation rates were evaluated for the first ten years of life and compared to mean values of the reference population. 26
Genotypes were displayed according to the transcripts NM_000182.5 for the HADHA‐ 3 and NM_000183.3 for the HADHB‐gene. 27 If necessary, they were converted using the Position Converter of Mutalyzer. 28
To date, LCHADD/MTPD is treated nutritionally. To evaluate potential therapeutic effects of this treatment, achievement of the dietary goals was assessed annually for each participant until the age of 10 years benchmarked by the four dietary goals according to consensus group recommendations 29 and national nutritional reference recommendation 30 : (1) restriction of long‐chain triglycerides intake, (2) avoidance of fasting, plus supplementation of (3) medium‐chain triglycerides, and (4) essential fatty acids. We analyzed whether the achievement of dietary goals had an impact on the clinical endpoints (metabolic decompensations, hospitalizations, and occurrence of clinical symptoms).
Statistical analysis
All statistical analyses were performed using “R,” a language for statistical computing and graphics. 31 Data that could not be retrieved and implausible data that could not be verified were treated as case‐wise missing value for the respective analysis. In descriptive statistics, mean, standard deviation, median, IQR, and range were calculated. To compare two‐way contingency tables, chi‐squared test was used; for comparison of small samples (e.g., cell counts below 5) that should not be computed by chi‐squared test, Boschloo test was used. Mann–Whitney U test was used to compare continuous variables between two groups. Holm alpha error adjustment was used in multiple comparisons. Age at onset of clinical symptoms and first metabolic decompensation was described and compared using Kaplan–Meier analysis and log‐rank test. Ratios were modeled using Poisson regression. The association between frequency of decompensations (dependent variable) and the independent variables maximum CK and disease (LCHADD and MTPD) were modeled with a generalized additive model with zero restricted Poisson family function with R package “gamlss.” p < 0.05 was considered statistically significant. Birth prevalence and 95%‐confidence interval (CI) were estimated using published annual reports of the German NBS program for the years 2004–2020 (German Society for Neonatal Screening). 32 Prevalence and 95% CI of HELLP syndrome and AFLP in the reference population were estimated using published data. 33 , 34 Data of the German Federal Statistical Office (Statistisches Bundesamt, URL: https://www.destatis.de/DE/Themen/Gesellschaft‐Umwelt/Gesundheit/Krankenhaeuser/Tabellen/entlassene‐patienten‐eckdaten.html) 26 and the recommendations of the German Nutrition Society (Deutsche Gesellschaft für Ernährung) 30 were used to compare study cohort data with the reference population where applicable.
Results
Birth prevalence of individuals with LCHADD and MTPD
Evaluating available annual reports of the German Society for Neonatal Screening, 32 LCHADD/MTPD are reported combined and were identified by NBS in 84 of 12,224,274 newborns between 2004 and 2020, while 6 children were known to be missed by NBS (false‐negative NBS result, 1 LCHADD and 5 MTPD; all included in this study). Thus, according to this cohort, sensitivity of NBS for LCHADD/MTPD in Germany is 93.3% (84 out of 90), and the estimated birth prevalence ranges from 1:145,000 newborns (identified by NBS) to 1:135,000 (overall).
Study population
A total of 67 individuals (31 LCHADD and 36 MTPD; Table 1) were enrolled in this study. Fifty‐four of them (27 LCHADD and 27 MTPD) were identified by NBS, while 13 individuals (4 LCHADD and 9 MTPD) were diagnosed symptomatically after a false‐negative NBS result (N = 6), birth in the pre‐NBS era or birth in a country without NBS for LCHADD/MTPD (N = 7; 3 LCHADD and 4 MTPD).
Table 1.
NBS, confirmatory diagnosis, and first symptoms in LCHAD and MTP deficiency identified by NBS or symptomatically.
| Identified by NBS | Diagnosed symptomatically | |||||||
|---|---|---|---|---|---|---|---|---|
| TOTAL | LCHADD | MTPD | p | TOTAL | LCHADD | MTPD | p | |
| N (f/m) | 54 (28/26) | 27 (15/12) | 27 (13/14) | 0.5860 | 13 (6/7) | 4 (0/4) | 9 (6/3) | 0.0328 |
| N deceased | 4 | 0 | 4 | 0.0759 | 1 | 0 | 1 | 0.9742 |
|
N Median (IQR; range) |
N Median (IQR; range) |
|||||||
|
Age at diagnosis NBS: [days] Symptomatic: [years] |
N = 46 19 (10–71; 1–338) |
N = 25 14 (10–52; 1–285) |
N = 21 21 (10–107; 5–338) |
0.3371 |
N = 12 6 (2.3–8.8; 0.3–73.3) |
N = 4 0.4 (0.4–5.5; 0.3–10.5) |
N = 8 6.2 (5.0–11.2; 4.0–73.3) |
0.1060 |
|
Age at start of treatment NBS: [days] Symptomatic: [years] |
N = 47 6 (5–10; 0–250) |
N = 25 6 (5–9; 0–31) |
N = 22 6 (5–16; 3–250) |
0.2187 |
N = 12 8.4 (3.3–11.1; 0.3–73.3) |
N = 4 0.5 (0.3–5.5; 0.3–10.5) |
N = 8 9.8 (6.7–13.5; 6.1–73.3) |
0.0740 |
|
Age at first disease specific symptoms* NBS: [months] Symptomatic: [years] |
N = 49 2 (0.1–8.5; 0–137.5) |
N = 27 4 (0.1–15; 0–137.5) |
N = 22 0.2 (0.1–5.7; 0–36) |
0.4545 |
N = 12 2.3 (0.3–3; 0–7) |
N = 4 0.4 (0.2–2.4; 0.2–3) |
N = 8 3 (1.1–6; 0–7) |
0.1197 |
|
Diagnostic delay** NBS: [months] Symptomatic: [years] |
NA* | NA | NA | NA |
N = 12 4.3 (2.6–6.4; 0–70.3) |
N = 4 0.2 (0.1–2; 0–7.5) |
N = 8 5.3 (4–7.6; 3.4–70.3) |
0.1060 |
| Age at last study visit [years] |
N = 50 5.5 (2.7–11.7; 0.02–19) |
N = 27 9.6 (3.0–13.9; 0.4–19) |
N = 23 4.3 (2.2–7.1; 0.02–11.7) |
0.0500 |
N = 12 11.1 (9.5–25.7; 8.6–73.6) |
N = 4 17.3 (10.5–27.7; 8.6–33.1) |
N = 8 10.2 (9.5–20.3; 9.2–73.6) |
0.6706 |
| Gestational age at birth [weeks of gestation] |
N = 47 36 (34–38; 25–40) |
N = 25 36 (34–38; 31–40) |
N = 22 38 (34–39; 25–40) |
0.9999 |
N = 6 38 (34–39; 34–40) |
N = 1 36 |
N = 5 39 (34–40; 34–40) |
– |
| Gestational Age if HELLP/AFLP group [weeks of gestation] |
N = 14 34 (32–35; 29–38) |
N = 8 33 (32–35; 31–38) |
N = 6 34 (31–35; 29–38) |
HELLP/AFLP yes vs. no 0.0002 | Missing | Missing | Missing | – |
|
Occurrence of HELLP/AFLP % (N/Ntotal) |
28.6 (14/49) | 30.7 (8/26) | 26.1 (6/23) | 0.7173 | Missing | Missing | Missing | – |
|
Newborn screening (NBS) Dried blood*** |
N Median (IQR; range) |
N Median (IQR; range) |
p NBS vs. false negative | |||||
| Age at first NBS report [days] |
N = 46 5 (3–6; 1–51) |
N = 24 5 (3–7; 1–13) |
N = 22 5 (3–6; 1–51) |
0.9920 |
N = 5 3 (3–3; 3–3) |
N = 0 3 (3–3; 3–3) |
N = 5 3 (3–3; 3–3) |
– |
|
C16OH [μmol/L] (Cut‐off***: 0.04 μmol/L) |
N = 39 0.27 (0.14–0.52; 0.03–2.61) |
N = 22 0.48 (0.17–0.66; 0.04–2.61) |
N = 17 0.19 (0.08–0.29; 0.03–0.50) |
0.0103 |
N = 5 0.1 (0.04–0.35; 0.02–0.36) |
N = 1 Below cut off |
N = 5 0.1 (0.04–0.35; 0.02–0.36) |
– |
|
C18:1OH [μmol/L] (Cut‐off***: 0.03 μmol/L) |
N = 37 0.24 (0.13–0.35; 0.02–2.95) |
N = 20 0.31 (0.17–0.57; 0.05–2.95) |
N = 17 0.22 (0.10–0.32; 0.02–0.41) |
0.0529 |
N = 5 0.05 (0.03–0.11; 0.02–0.13) |
N = 1 Below cut off |
N = 5 0.05 (0.03–0.11; 0.02–0.13) |
– |
|
C18OH [μmol/L] (Cut‐off***: 0.02 μmol/L) |
N = 33 0.25 (0.15–0.36; 0.02–1.49) |
N = 17 0.36 (0.17–0.65; 0.07–1.49) |
N = 16 0.21 (0.09–0.28; 0.02–0.41) |
0.0434 |
N = 3 0.07 (0.05–0.08) |
N = 1 Below cut off |
N = 3 0.07 (0.05–0.08) |
– |
C18OH, 3‐hydroxystearoylcarnitine; C18:1OH, 3‐hydroxyoleoylcarnitine; NA, not applicable.
Including decompensation.
Age at diagnosis—age at first disease‐specific symptoms.
Cut‐off used at the NBS laboratory of Heidelberg University Hospital.
The study cohort includes data on five deceased children (all with MTPD; Table 1). One newborn with MTPD and hydrops fetalis deceased on the first day of life prior NBS could be taken, the diagnosis was made postmortem. Four infants with MTPD (14.8%) died after positive NBS results: One at the age of 19 days of unreported causes, and 3 who presented with acute cardiomyopathy (age at first onset not reported) of decompensated heart failure at the ages of 5 (N = 2) and 6 months (N = 1), respectively. No infant of the screened LCHADD group died.
LCHADD/MTPD increases the risk of gestosis with prematurity
Data from 47 NBS group participants, born at a median (range) age of 36 (25–40) weeks of gestation, were available for analysis. Occurrence of hemolysis, elevated liver enzymes, and low platelet count (HELLP) syndrome or acute fatty liver of pregnancy (AFLP) [28.6% of pregnancies (HELLP: 24.5% and AFLP: 4.1%)] did not differ between mothers of infants with LCHADD or MTPD (p = 0.7173; Table 1) but was much higher than in the reference population (HELLP: 0.7%, 33 p < 0.0001; AFLP: 0.014%, 34 p < 0.0001) and was fatal in one mother of a child with MTPD. Infants were born earlier if pregnancies were complicated by HELLP syndrome or AFLP compared to those without [34 (29–38) vs. 38 (25–40) weeks of gestation; p = 0.0002; Table 1].
Diagnostic process quality of NBS for LCHADD/MTPD
Median (range) age at first NBS report [5 (1–51) days, Table 1] was within the recommended time window of the German NBS program (age at first NBS report: 4–6 days of life 35 ) with two exceptions: In one newborn with two index siblings the NBS sample was taken at the first day of life. A preterm infant (25 weeks of gestation) with an initially normal NBS result was identified later in the regular NBS recall at a corrected gestational age of 32 completed weeks. Thirty‐two percent [N = 16; LCHADD: 29.6% (8 out of 27) and MTPD: 34.8% (8 out of 23)] already had developed symptoms at the time of the first NBS report, with neonatal hypoglycemia being the most frequent symptom [22% (LCHADD: 25.9% and MTPD: 17.4%)]. In addition to hypoglycemia, 1 newborn with LCHADD had elevated CK and muscular hypotonia and 3 with MTPD presented also with metabolic acidosis, elevated CK, hepatopathy, cardiomyopathy, and/or cardiac arrhythmia. Two further MTPD patients in the NBS group were symptomatic without hypoglycemia, 1 with muscular hypotonia and 1 with mild hypertrophic cardiomyopathy.
Median (range) of C16OH concentration in the first NBS sample was higher in LCHADD [0.48 (0.04–2.61) μmol/L] than in MTPD [0.19 (0.03–0.5) μmol/L, cut‐off: 0.04; p = 0.0103]. Similar results were obtained for 3‐hydroxystearoylcarnitine (p = 0.0434) and in trend for 3‐hydroxyoleoylcarnitine (p = 0.0529; Table 1). The suspected diagnosis was confirmed by enzymatic (N = 7; 3 LCHADD, 4 MTPD) and/or genetic testing (N = 49; 25 LCHAD, 24 MTP; Table 2) at a median (range) age of 19 (1–338) days (Table 1). Forty‐one individuals had pathogenic HADHA and eight had HADHB gene variants. At least one allele with the common HADHA variant c.1528G>C (N = 36; homozygous: N = 25, compound heterozygous: N = 11) was found in 73.5%. Of note, individuals with MTPD who were compound heterozygous for this variant were more often symptomatic at first NBS report than those without [54.5% (6 out of 11) vs. 10% (1 out of 10); p = 0.0410]. No further differences in age at onset, frequency of clinical symptoms, and frequency of hospitalizations or decompensations were observed.
Table 2.
Genotypes and clinical phenotypes of the NBS group.
| No. | Diagnosis | Mode of diagnosis | Allele 1 (nucleotide change) | Allele 2 (nucleotide change) | Symptomatic at (suspected) diagnosis (yes/no) | Cardiomyopathy (yes/no) | Myopathy (yes/no) | Hepatopathy (yes/no) | Neuropathy (yes/no) | Retinopathy (yes/no) |
|---|---|---|---|---|---|---|---|---|---|---|
| 1–19 | LCHAD | NBS | 1–17: HADHA: c.1528G>C | 1‐17: HADHA: c.1528G>C | No | Yes: N = 7 | Yes: N = 17 | Yes: N = 4 | Yes: N = 6 | Yes: N = 5 |
| 18–19: missing a | 18–19: missing | No: N = 12 | No: N = 2 | No: N = 15 | No: N = 13 | No: N = 14 | ||||
| 20–27 | LCHAD | NBS | HADHA: c.1528G>C | HADHA: c.1528G>C | Yes | Yes: N = 1 | Yes: N = 6 | Yes: N = 3 | Yes: N = 2 | Yes: N = 1 |
| No: N = 6 | ||||||||||
| No: N = 7 | No: N = 2 | No: N = 5 | No: N = 6 | N.A.: N = 1 | ||||||
| 28–29 | MTP | NBS | HADHA: c.1528G>C | HADHA: c.1893delA | No | No: N = 2 | Yes: N = 2 | Yes: N = 1 | No | No: N = 1 |
| No: N = 1 | N = 2 | missing: N = 1 | ||||||||
| 30 | MTP | NBS | HADHA: c.1528G>C | HADHA: 1540delA | No | No | Yes | No | No | No |
| 31 | MTP | NBS | HADHA: c.1528G>C | HADHA: c.703C>T | No | No | Yes | Yes | No | No |
| 32 | MTP | NBS | HADHA: c.1528G>C | HADHA: c.IVS5‐2A>T | No | No | Yes | No | Yes | missing |
| 33 | MTP | NBS | HADHA: c.602T>C | HADHA: c.602T>C | No | No | No | No | No | No |
| 34 | MTP | NBS | HADHA: c.955G>A | HADHA: c.955G>A | No | No | Yes | No | Yes | No |
| 35 | MTP | NBS | HADHA: c.1480C>G | HADHA: c.1480C>G | No | Yes | Yes | No | No | No |
| 36 | MTP | NBS | HADHB: c.230A>G | HADHB: c.230A>G | No | Yes | Yes | No | No | missing |
| 37 | MTP | NBS | HADHB: c.580C>T | HADHB: c.1115A>T | No | No | Yes | No | No | No |
| 38 | MTP | NBS | HADHB: c.686G>A | HADHB: c.712C>T | No | No | Yes | Yes | Yes | No |
| 39 | MTP | NBS | HADHB: c.739C>T | HADHB: c.739C>T | No | No | No | No | No | No |
| 40 | MTP | NBS | HADHB: c.1198G>T | HADHB: c.442+663A>G | No | Yes | No | No | No | No |
| 41 | MTP | NBS | HADHB: c.1389+5G>A | HADHB: c.1389+5G>A | No | No | No | Yes | No | No |
| 42 | MTP | NBS | missing | missing | No | Yes | No | No | No | No |
| 43 | MTP | NBS | HADHA: c.1528G>C | HADHA: c.1195C>T | Yes | Yes | Yes | No | Yes | No |
| 44 | MTP | NBS | HADHA: c.1528G>C | HADHA: c.1493A>G | Yes | No | Yes | Yes | Yes | Yes |
| 45 | MTP | NBS | HADHA: c.1528G>C | HADHA: c.2107G>A | Yes | No | Yes | Yes | No | Yes |
| 46 | MTP | NBS | HADHA: c.1528G>C | HADHA: c.180_180+5 delinsA | Yes | No | Yes | Yes | No | No |
| 47 | MTP | NBS | HADHA: c.1528G>C | HADHA: c.274_278del | Yes | Yes | Yes | Yes | Yes | No |
| 48 | MTP | NBS | HADHA: c.1528G>C | HADHA: c.IVS14+1G>T | Yes | No | Yes | No | No | Yes |
| 49 | MTP | NBS | HADHB: c.88_91delTCCC | HADHB: c.88_91delTCCC | Yes | No | Yes | Yes | No | No |
| 50 | MTP | NBS | missing | missing | Yes | No | Yes | No | No | No |
| 51 b | MTP | NBS | HADHA: c.255‐2A>G | HADHA: c.255‐2A>G | missing | Yes | missing | missing | missing | missing |
| 52 b | MTP | NBS | HADHB: c.182G>A | HADHB: IVS4‐3C>G | missing | Yes | missing | missing | missing | missing |
| 53 b | MTP | NBS | HADHB: c.583C>T | HADHB: c.1280G>A | missing | Yes | missing | missing | missing | missing |
| 54 b | MTP | NBS | missing | missing | missing | missing | missing | missing | missing | missing |
Genotypes are displayed according to the transcripts NM_000182.5 for the HADHA‐ 3 and NM_000183.3 for the HADHB‐gene. 27 If necessary, they were converted using the position converter of mutalyzer. 28
Data not available.
Participant deceased.
Metabolic decompensations cannot be prevented in the screened individuals
Eighty percent of participants (40 out of 50) experienced at least one episode of metabolic decompensation (in total N = 151; Fig. 1A), first at a median age (IQR; range) of 0.8 (0–2.8; 0–15.1) years. The overall mean individual annual decompensation rate was highest during the first 4 years of life for LCHADD and MTPD (First year: 0.72, Fourth year: 0.77 times; Figure 2A), decreased with age and was lowest in the tenth year of life (0.06 per year; Fig. 2A). There was no difference in age at first decompensation (p = 0.8000) or total number of decompensations between LCHADD and MTPD (p = 0.6840). Latest metabolic decompensations were reported at a median (IQR; range) age of 7.3 (3.2–11; 0–17.4) years for LCHADD [age at last visit: 9.6 (0.4–19) years] and 3.3 (2.1–5; 0–9.2) years for MTPD [age at last visit: 4.3 (0.02–11.7) years].
Figure 1.
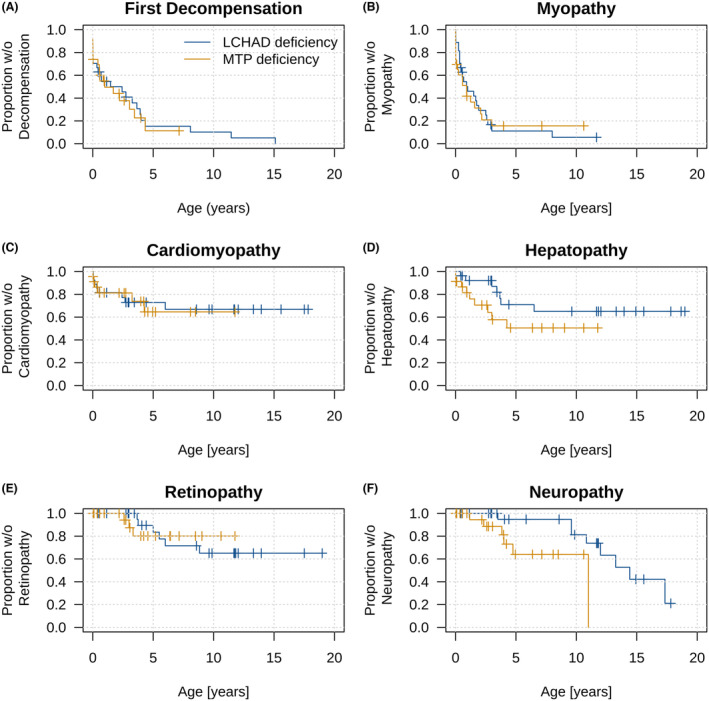
Onset and frequency of first metabolic decompensation and disease‐specific symptoms in LCHAD and MTP deficiency identified by NBS. Kaplan–Meier curves. (A) first metabolic decompensation, (B) myopathy, (C) cardiomyopathy, (D) hepatopathy, (E) retinopathy, and (F) neuropathy. Neuropathy occurred later in LCHAD than in MTP deficiency (p = 0.0447). No further differences were observed.
Figure 2.
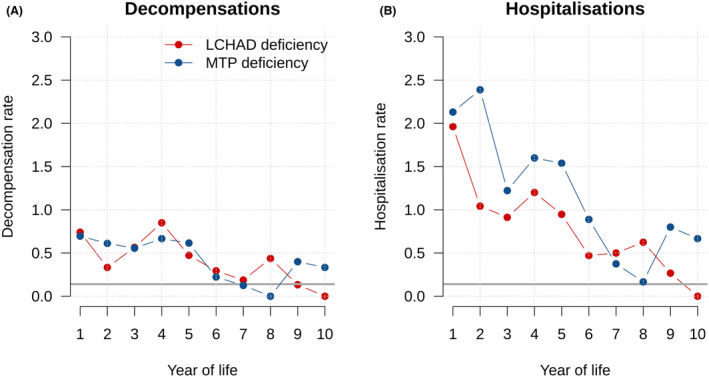
Mean individual annual rates of decompensations (A) and hospitalizations (B) in LCHAD and MTP deficiency identified by NBS. Hospitalization rate was highest in the first year for LCHAD and MTP deficiency (2.04), while the overall decompensation rate was highest in the fourth year (0.77). During the second year of life, individuals with MTPD were hospitalized more frequently (2.39 times per year) than those with LCHADD (1.04 times; p = 0.0010), while hospitalization did not differ for other age groups. Annual hospitalization rate of the German pediatric reference population 26 is depicted in gray.
The clinical presentation of metabolic decompensations changed with age: while hypoglycemia (N = 16; 10.6% of decompensations) occurred predominantly in neonates at a median age (IQR; range) of 0 (0–1; 0–1574) days, rhabdomyolysis (N = 130; 86.1%) was the leading indicator of subsequent metabolic decompensations, first occurring at a median (IQR; range) age of 1.2 (0.5–3; 0–15.1) years. Elevated CK levels above 1000 U/L occurred in 75% of the patients, and median (IQR; range) maximum CK concentrations did not differ between LCHADD [N = 55; 25,600 (2,900‐54,200; 300–135,700) U/L] and MTPD [N = 43; 13,200 (700–43,800; 200–104,200) U/L; p = 0.5709]. A positive correlation between maximum CK and total number of decompensations was observed for both LCHADD and MTPD (p < 0.0001), indicating that patients with frequent decompensations usually had more severe rhabdomyolysis during each decompensation. Triggers were reported for 98% of the metabolic decompensations. The main trigger was (febrile) infections (51.7%), followed by feeding difficulties (39.1%) and increased physical activity (14.6%), multiple answers were possible.
Hospitalizations to prevent metabolic decompensations are frequent
A total of 368 hospitalizations (LCHADD: N = 192, MTPD: N = 176) with a median (IQR; range) duration of 3 (2–6.5; 1–119) days were reported for the NBS group. Frequencies were highest during the first year of life (mean individual annual hospitalization rate: 2.04; Fig. 2B) and exceeded the mean individual annual hospitalization rate of the reference population (0.14, 26 ; Fig. 2B) by far. There was no difference in the total number or duration of hospitalizations between screened individuals with LCHADD and MTPD.
The major reason for hospitalization was prevention of (impending) metabolic decompensation (69.1% of admissions; LCHADD: 70.4%, MTP: 67.6%) with the main trigger of these episodes being (febrile) infections (66.3% of impending decompensations, 44.1% of total admissions). Further reasons for hospitalization were feeding difficulties (32.5%), elective admissions (e.g., for confirmation diagnostics, vaccination, clinical follow‐up, or therapy adjustment; 31.7%), and others (e.g., muscle pain or weakness, prematurity, decreased general condition, or trauma; 16.7%), multiple answers were possible.
Disease‐specific symptoms occur despite early identification and treatment
Until a median (range) age of 5.5 (0.02–19) years [LCHADD 9.6 (0.4–19) vs. MTPD 4.3 (0.02–11.7) years; p = 0.0500, Table 1], all but three infants younger than 1 year at last visit (1 LCHADD and 2 MTPD) experienced a symptomatic disease course (94%; 47 out of 50), with myopathy being the most common disease manifestation (82%; Fig. 1B). 40% [44.4% (LCHADD) vs. 34.8% (MTPD); p = 0.4870] presented already with retinopathy and/or peripheral neuropathy.
The clinical phenotype developed with age: In chronological order of age at onset [median (IQR; range)], the manifestation of cardiomyopathy [28% (14 out of 50); 0.4 (0–2.8; 0–6) years] shortly preceded myopathy [82% (41 out of 50); 0.6 (0.1–1.8; 0–8) years] and hepatopathy [32% (16/50); 2.2 (0.6–3.6; 0–6.5) years; Fig. 1B–D]. There were no differences in frequency or age at onset between screened individuals with LCHADD and MTPD. With increasing age, individuals with LCHADD and MTPD presented with retinopathy and neuropathy. Frequency and age at onset of retinopathy [22.2% (6 out of 27) vs. 15% (3 out of 20); p = 0.7738; at median (IQR; range) age of 5.3 (3.8–6.7; 3.7–8.8) years vs. 3 (2.6–3.3; 2.6–3.3) years; p = 0.9999; Fig. 1E] did not differ between LCHADD and MTPD. While neuropathy did not differ in frequency [LCHADD: 29.6% (8 out of 27) vs. MTPD: 26.1% (6 out of 23); p = 0.9999], it occurred at a later age [median (IQR; range)] in LCHADD [11.4 (9.6–14.1; 3.5–17.3) years] than in MTPD [3.9 (2–6.4; 1.2–11; p = 0.0447; Fig. 1F)].
Consensus group dietary treatment recommendations are inconsistently followed
Data regarding therapy, initially started at median 6 (range 0–250) days of age (Table 1), were available for 48 screened participants, all of whom received a special diet. In one patient, dietary therapy was started delayed (day 250) due to mild biochemical findings and prolonged genetic analysis (intronic variants), however during this time, prolonged fasting was avoided.
In all age groups, achievement of recommended dietary goals throughout the first 10 years of life (Table 3) was challenging and decreased with age. The dietary goals were best met in the first 3 years of life (56%–75% failed one goal at most) and least met in the eighth to tenth year of life (82%–88% failed two or more goals; Fig. 3A). Overall, therapy achievement with regard to restriction of long‐chain fatty acids and avoidance of fasting was more favorable than the supplementation with medium‐chain fatty acids and essential fatty acids (Fig. 3B).
Table 3.
Recommended components and goals of dietary therapy in LCHADD and MTPD.
| Restriction | Substitution | ||||
|---|---|---|---|---|---|
| Long‐chain triglycerides | Fasting time | Medium‐chain triglycerides | Essential fatty acids | ||
| % of patients with specific goals (N/N total) | 100 (48/48) | 100 (48/48) | 97.7 (47/48) | 95.8 (46/48) | |
| Tube feeding: N = 8 | |||||
| Year of life | Goal | ||||
| Max. [g/d] | Max. [h/day] | Max. [h/night] | Min. [g/d] | Min. [g/d] | |
| 1 | 7.8 | 4 | 8 | 13.3 | 3.4 |
| 2–3 | 14.4 | 4 | 12 | 24.4 | 4 |
| 4–7 | 17.8 | 4 | 12 | 28.9 | 6.7 |
| 8–10 | 21.1 | 4 | 12 | 33.3 | 6.7 |
Calculated for the first 10 years of life based on consensus group recommendations 29 and national guidelines. 30 Data were available for 48 participants, all of whom were treated with restriction of long‐chain triglycerides intake and fasting time. Substitution of medium‐chain triglycerides and essential fatty acids were administered in 47 and 46 individuals, respectively. Eight out of 48 were (temporarily) fed via PEG or NG tube.
Figure 3.
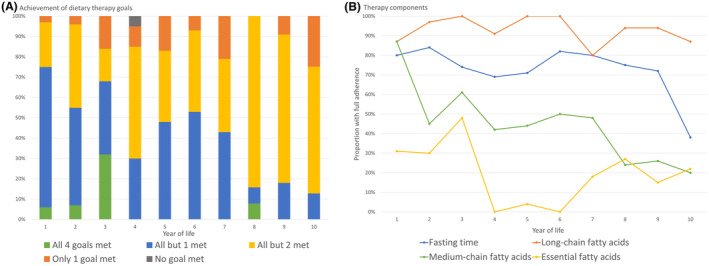
Dietary treatment in LCHAD and MTP deficiency identified by NBS. (A) Overall achievement of dietary goals, (B) Achievement of the different dietary goals. Calculated for the first 10 years of life based on consensus group recommendations 29 and national guidelines. 30 Therapy components were the restriction of (1) long‐chain triglycerides intake and (2) fasting time and substitution of (3) medium‐chain triglycerides, and (4) essential fatty acids. The data were collected by analyzing the medical and dietary records annually for each participant retrospectively.
Noteworthy, patients with LCHADD and MTPD who failed to achieve one dietary goal during the first 10 years of life (N = 20) did not differ from those who failed two or more goals (N = 21) in terms of frequency of decompensations (p = 0.7141) and hospitalizations (p = 0.7734) and the age at onset of the different specific clinical symptoms (p between 0.1913 and 0.9351). However, the frequency of hepatopathy was higher in patients who failed two or more dietary goals (52.2%; 11 out of 21) compared to those who failed to achieve one dietary goal (20%, 4 out of 20; p = 0.0384). In analogy, myopathy in trend [75% (15 out of 20) vs. 95.2% (20 out of 21); p = 0.0685] occurred more often in those who failed in median two or more dietary goals. There was no difference with regard to the frequency of cardiomyopathy, neuropathy, and retinopathy (p between 0.4481 and 0.7037) in both groups. None of the participants was treated with triheptanoin during the observation period.
Symptomatically diagnosed patients
With a median (range) age at last visit of 11.1 (8.6–73.6) years (Table 1), the 12 surviving symptomatically diagnosed individuals were older than the NBS group (p = 0.0009). Although first clinical signs in this group occurred at median (range) age of 0.4 (0.2–3) years for LCHADD and 3 (0–7) years for MTPD (p = 0.1197, Table 1), diagnosis was made at a median (range) age of 0.4 (0.3–10.5) years and 6.2 (4–73.3) years, respectively (p = 0.1060; Table 1), resulting in a median (range) diagnostic delay of 0.2 (0.1–7.5) years and 5.3 (4.6–70.3) years, respectively (p = 0.1060).
All symptomatically diagnosed individuals with LCHADD (N = 6) presented with an acute metabolic decompensation with hypoketotic hypoglycemia (N = 2), hepatopathy (N = 4), encephalopathy (N = 2), cardiomyopathy (N = 2), muscular hypotonia (N = 2), and/or vomiting/failure to thrive (N = 3). In symptomatically diagnosed individuals with MTPD, all but one, who presented with neonatal severe decompensation, primarily manifested with symptoms of neuropathy (87.5%) and myopathy (87.5%) after the neonatal period (Table 4).
Table 4.
Genotypes and clinical phenotypes of the symptomatic group.
| No. | Diagnosis | Mode of diagnosis | Allele 1 (nucleotide change) | Allele 2 (nucleotide change) | Symptomatic at (suspected) diagnosis (yes/no) | Cardiomyopathy (yes/no) | Myopathy (yes/no) | Hepatopathy (yes/no) | Neuropathy (yes/no) | Retinopathy (yes/no) |
|---|---|---|---|---|---|---|---|---|---|---|
| 55–57 | LCHAD | Symptomatic (no NBS) | 55+56 | 55+56 | Yes | Yes: N = 3 | Yes: N = 4 | Yes: N = 4 | Yes: N = 2 | Yes: N = 3 |
| HADHA: c.1528G>C | HADHA: c.1528G>C | |||||||||
| No: N = 1 | No: N = 2 | missing: N = 1 | ||||||||
| 57: missing a | 57: missing | |||||||||
| 58 | LCHAD | Symptomatic (false‐negative NBS) | HADHA: c.1528G>C | HADHA: c.1528G>C | Yes | Yes | Yes | Yes | No | No |
| 59 | MTP | Symptomatic (no NBS) | HADHA: c.1528G>C | HADHA: c.703C>T | Yes | No | Yes | Yes | Yes | No |
| 60 | MTP | Symptomatic (no NBS) | HADHA: c.955G>A | HADHA: c.955G>A | Yes | No | Yes | No | Yes | No |
| 61 | MTP | Symptomatic (no NBS) | missing | missing | Yes | Yes | Yes | Yes | Yes | missing |
| 62–64 | MTP | Symptomatic (false‐negative NBS) | HADHA: 1828C>G | HADHA: c.2281T>G | Yes | No: N = 3 | Yes: N = 2 | Yes: N = 1 | Yes: N = 3 | Yes: N = 1 |
| No: N = 2 | No: N = 2 | |||||||||
| 65 | MTP | Symptomatic (false‐negative NBS) | HADHA: c.703C>T | HADHA: c.955G>A | Yes | No | Yes | Yes | Yes | No |
| 66 | MTP | Symptomatic (false‐negative NBS) | HADHB: c.487G>A | HADHB: c.1154A>C | Yes | No | Yes | No | Yes | No |
| 67 b | MTP | Symptomatic (postmortem) | missing | missing | missing | missing | missing | missing | missing | missing |
Genotypes are displayed according to the transcripts NM_000182.5 for the HADHA‐ 3 and NM_000183.3 for the HADHB‐gene. 27 If necessary, they were converted using the position converter of mutalyzer. 28
Data not available.
Participant deceased.
Discussion
As the long‐term neurological and clinical benefit of screened individuals with LCHADD or MTPD has remained uncertain, we conducted a national multicenter observational study including 54 individuals with confirmed LCHADD/MTPD identified by NBS between 1999 and 2020 as well as 13 symptomatically diagnosed patients.
This study has elucidated the following major results: (a) Prematurity remains a significant health risk in screened individuals with LCHADD and MTPD. (b) The sensitivity of NBS for LCHADD/MTPD is 93.3%. Predominantly individuals with MTPD are missed. (c) Despite early identification and treatment, the vast majority of patients still presents with a symptomatic disease course (94%), including (recurrent) metabolic decompensation (80%), that is, rhabdomyolysis and/or hypoglycemia, and long‐term complications such as neuropathy. (d) The phenotypic spectrum is wide and overlapping, especially in MTPD. The genotype does not allow to precisely predict the clinical phenotype. (e) Overall achievement of dietary goals is improvable and decreases with age, particularly for medium‐chain triglyceride and essential fatty acid supplementation. (f) Except for the frequency of hepatopathy adherence to dietary treatment could not be shown to be associated with better clinical long‐term outcomes, highlighting the need for safe and efficacious therapies for individuals with LCHADD/MTPD.
The common premature birth may impact outcome and anabolism may impact the NBS result
It is well‐established that pregnancies with a fetus with LCHADD or MTPD are associated with an increased incidence of life‐threatening HELLP syndrome and AFLP, 36 , 37 , 38 both associated with premature birth. Although the incidence of these complications slightly varies in previously reported LCHADD/MTPD cohorts (HELLP syndrome: 10%–29% AFLP: 3%–4% 14 , 17 , 18 , 39 ), incidences in our cohort (HELLP syndrome: 23.4% and AFLP: 4.3%) match these ranges, being far above the incidence in the reference population. 33 , 34 This and the associated increased risk for premature birth, which is an independent risk factor for neurodevelopmental disorders, 40 cannot be prevented by NBS. Moreover, as acylcarnitine profiles of individuals with LCHADD/MTPD may normalize intermittently during anabolic metabolic states, 41 , 42 glucose administration, part of neonatal care after a premature birth, might increase the risk of false‐negative NBS results. The higher number of individuals with MTPD missed by NBS might further be explained by the less pronounced acylcarnitine patterns compared to newborns with LCHADD. As a consequence, the number of individuals with LCHADD/MTPD missed by NBS in this study and reported previously 5 , 18 , 43 results in a less favorable sensitivity of the LCHADD/MTPD NBS compared to other NBS conditions. To improve the sensitivity of NBS for LCHADD/MTPD, it is advisable, whenever possible, to collect NBS samples during a postnatal catabolic metabolic state. Furthermore, in accordance with a previous study, 43 even mildly elevated metabolic profiles should trigger molecular and/or functional confirmatory testing, particularly in instances of prematurity and/or if glucose was administered after birth. Further research is needed to improve the sensitivity of NBS, especially for MTPD.
Although early neonatal disease manifestation could not be prevented by NBS in about one third of individuals with LCHADD and MTPD, confirming results of a previous study, 18 NBS and early treatment resulted in improved neonatal (98.1%) and long‐term survival (92.6%) compared to the pre‐NBS era (overall mortality 35%–92% 15 , 17 ). However, it must be noted that due to the study design, underreporting of mortality and bias by advances in neonatal care cannot be completely ruled out. The “lethal phenotype” with neonatal death in MTPD, as described in the literature from the pre‐NBS era 16 and reported only twice in this cohort, might have been postponed into early infancy (three deceased infants at 5 and 6 months).
High long‐term morbidity despite NBS and specialized care
Overall, the phenotypic spectrum of individuals with LCHADD and MTPD is broad and overlapping, and overall morbidity was high despite early diagnosis and treatment. Neuropathy occurred earlier in MTPD, in analogy to a previous study, 5 but with similar frequencies in both groups. In our study, the total frequency of peripheral neuropathy was lower than in previous studies (up to 80%). 4 , 17 , 44 This might be due to different ages of the study cohorts but may also be explained by different follow‐up and monitoring strategies of different metabolic centers based on local use of electrophysiological studies in children.
Frequency of hospitalizations and metabolic decompensations were high, especially during the first 4 years of life, when frequent infections are common. Compared to the reference population, 26 children with LCHADD/MTPD were hospitalized much more often, emphasizing the burden on the affected children and their families. Frequency decreased with age but retained high during the entire observation period (last reported decompensation LCHADD: 17.4 years, MTPD: 9.2 years) and will probably remain at a similar risk in adolescence and adulthood due to the life‐long risk for metabolic decompensation.
These findings essentially highlight the therapeutic shortcomings of the utilized dietary treatment strategies. In the pathophysiology of LCHADD and MTPD, energy deficiency and the accumulation of toxic substrates play significant roles. Particularly, tissues with high metabolic activity, such as the liver and cells primarily reliant on fatty acid oxidation for energy production, such as heart and skeletal muscle, are profoundly affected. Moreover, recent research suggests that some of the accumulating metabolites in LCHADD/MTPD, such as 3‐hydroxypalmitic acid and 3‐hydroxytetradecanoic acid, cause tissue damage via the induction of mitochondrial dysfunction and the generation of reactive oxygen species, leading to (neuro‐)toxic effects including peripheral neuropathy and impairment of retinal pigment epithelium. 6 , 7 , 45
Although the established therapeutic strategies focus on promoting energy generation from alternative sources while also aiming at the mitigation of toxic metabolite formation, 40% of the participants manifested neuropathic long‐term complications (i.e., neuropathy and/or retinopathy), despite the young age of the cohort, highlighting the urgent need for better treatment strategies. One possible approach is the utilization of triheptanoin (a synthetic odd‐numbered medium‐chain triglyceride), which has been reported to significantly reduce decompensation and hospitalization frequency as well as frequency of cardiomyopathy 46 , 47 by providing anaplerotic substrates and therefore increasing energy production. 48 Notably, as triheptanoin was no approved drug in Germany during the course of study, none of the participants of this study received it during the observation period.
Achievement of dietary goals is challenging for patients and caring centers
With reference to the consensus group recommendations 29 and national dietary guidelines, 30 we evaluated the patients achievement of these goals and found the prescribed and followed therapeutic strategies to be highly inconsistent. In particular, the recommendations for medium‐chain fatty acids and essential fatty acid substitution were rarely followed. These findings are of specific interest in the context of the suggested association between the depletion of docosahexaenoic acid and retinopathy. 49 , 50 As published recommendations are based on a low level of evidence poor adherence to these recommendations might reflect uncertainty about the safety and effectiveness of these therapeutic measures. In this study, participants with better adherence to these recommendations did not necessarily have better clinical long‐term outcomes, except for hepatopathy and (in trend) myopathy.
In conclusion, the differences in prescription at different metabolic centers convey uncertainty regarding evidence with respect to safety and efficacy of available treatment strategies. In addition, patient's compliance was highly variant, possibly due to the challenging feasibility of a predominantly fat‐free diet in a child's daily life, as well as the unfavorable taste of certain substitute products. This results in a high therapeutic variability and unexpectedly poor treatment quality in terms of achieving the four dietary goals. Further investigations of the impact of established and novel therapeutic strategies are needed and the development of guidelines would be highly desirable.
Shortcomings
Although done with the highest effort, data collection from medical reports includes the risk of potentially incomplete datasets. This might have biased the analysis, especially the frequency of hospitalizations and decompensations might have been underestimated. Due to the significant age difference between the NBS and symptomatic group, a comparative analysis of the clinical endpoints could not be performed.
Conclusion
This national multicenter observational study, evaluating the largest published group of screened individuals with LCHADD/MTPD to date, confirms that early identification by NBS and immediate start of metabolic therapy improves (neonatal) survival but does not reliably protect against (neonatal) metabolic decompensations and substantial long‐term neurologic morbidity despite early treatment. Neuropathy occurs earlier in MTPD, and all individuals are at a life‐long risk of metabolic decompensation and thus frequently hospitalized. As there is indication that therapy may influence the occurrence of disease‐specific symptoms, evidence‐based treatment strategies, and guidelines are needed to optimize and harmonize clinical management. Strategies to improve NBS sensitivity should also be given more attention to increase screening success.
Author Contributions
Ulrike Mütze, Alina Ottenberger, Sarah C. Grünert, and Stefan Kölker conceptualized and designed the study. All listed authors contributed to the acquisition and analysis of data. Sven F. Garbade performed statistical analysis. Ulrike Mütze, Alina Ottenberger, and Stefan Kölker drafted the first manuscript and prepared the figures.
Conflict of Interest Statement
SK and GFH received research grants from the Dietmar Hopp Foundation, St. Leon‐Rot, Germany. All other authors have nothing to report.
Acknowledgments
We thank all patients and their families for their participation and trust. This study was generously supported by the Dietmar Hopp Foundation, St. Leon‐Rot, Germany (grant numbers 23011221, DH2011117 to GFH and SK). The authors confirm independence from the sponsor; the content of the article has not been influenced by the sponsor. For the publication fee we acknowledge financial support by Deutsche Forschungsgemeinschaft within the funding program “Open Access Publikationskosten” as well as by Heidelberg University. Open Access funding enabled and organized by Projekt DEAL.
Funding Statement
This work was funded by Dietmar Hopp Stiftung grants 23011221 and DH2011117.
References
- 1. Kamijo T, Aoyama T, Komiyama A, Hashimoto T. Structural analysis of cDNAs for subunits of human mitochondrial fatty acid beta‐oxidation trifunctional protein. Biochem Biophys Res Commun. 1994;199(2):818‐825. doi: 10.1006/bbrc.1994.1302 [DOI] [PubMed] [Google Scholar]
- 2. Houten SM, Violante S, Ventura FV, Wanders RJ. The biochemistry and physiology of mitochondrial fatty acid beta‐oxidation and its genetic disorders. Annu Rev Physiol. 2016;78:23‐44. doi: 10.1146/annurev-physiol-021115-105045 [DOI] [PubMed] [Google Scholar]
- 3. NCBI GenBank . Homo sapiens hydroxyacyl‐CoA dehydrogenase trifunctional multienzyme complex subunit alpha (HADHA), mRNA; nuclear gene for mitochondrial product. Accessed March 16, 2022. https://www.ncbi.nlm.nih.gov/nuccore/NM_000182.5
- 4. Spiekerkoetter U. Mitochondrial fatty acid oxidation disorders: clinical presentation of long‐chain fatty acid oxidation defects before and after newborn screening. J Inherit Metab Dis. 2010;33(5):527‐532. doi: 10.1007/s10545-010-9090-x [DOI] [PubMed] [Google Scholar]
- 5. Grunert SC, Eckenweiler M, Haas D, et al. The spectrum of peripheral neuropathy in disorders of the mitochondrial trifunctional protein. J Inherit Metab Dis. 2021;44(4):893‐902. doi: 10.1002/jimd.12372 [DOI] [PubMed] [Google Scholar]
- 6. Cecatto C, Godoy KDS, da Silva JC, Amaral AU, Wajner M. Disturbance of mitochondrial functions provoked by the major long‐chain 3‐hydroxylated fatty acids accumulating in MTP and LCHAD deficiencies in skeletal muscle. Toxicol in Vitro. 2016;36:1‐9. doi: 10.1016/j.tiv.2016.06.007 [DOI] [PubMed] [Google Scholar]
- 7. Ribas GS, Vargas CR. Evidence that oxidative disbalance and mitochondrial dysfunction are involved in the pathophysiology of fatty acid oxidation disorders. Cell Mol Neurobiol. 2022;42(3):521‐532. doi: 10.1007/s10571-020-00955-7 [DOI] [PMC free article] [PubMed] [Google Scholar]
- 8. Therrell BL, Padilla CD, Loeber JG, et al. Current status of newborn screening worldwide: 2015. Semin Perinatol. 2015;39(3):171‐187. doi: 10.1053/j.semperi.2015.03.002 [DOI] [PubMed] [Google Scholar]
- 9. Burgard P, Rupp K, Lindner M, et al. Newborn screening programmes in Europe; arguments and efforts regarding harmonization. Part 2. From screening laboratory results to treatment, follow‐up and quality assurance. J Inherit Metab Dis. 2012;35(4):613‐625. doi: 10.1007/s10545-012-9484-z [DOI] [PubMed] [Google Scholar]
- 10. Loeber JG, Burgard P, Cornel MC, et al. Newborn screening programmes in Europe; arguments and efforts regarding harmonization. Part 1. From blood spot to screening result. J Inherit Metab Dis. 2012;35(4):603‐611. doi: 10.1007/s10545-012-9483-0 [DOI] [PubMed] [Google Scholar]
- 11. Mütze U, Garbade SF, Gramer G, et al. Long‐term outcomes of individuals with metabolic diseases identified through newborn screening. Pediatrics. 2020;146(5):e20200444. [DOI] [PubMed] [Google Scholar]
- 12. Lindner M, Gramer G, Haege G, et al. Efficacy and outcome of expanded newborn screening for metabolic diseases—report of 10 years from South‐West Germany. Orphanet J Rare Dis. 2011;6:44. doi: 10.1186/1750-1172-6-44 [DOI] [PMC free article] [PubMed] [Google Scholar]
- 13. Gemeinsamer Bundesausschuss . Beschlusstext: Kinder‐Richtlinien (Neufassung Anlage 2: Neugeborenen‐Screening und weitere Themen). Accessed November 14, 2022. https://www.g‐ba.de/beschluesse/170/
- 14. den Boer ME, Wanders RJ, Morris AA, IJlst L, Heymans HS, Wijburg FA. Long‐chain 3‐hydroxyacyl‐CoA dehydrogenase deficiency: clinical presentation and follow‐up of 50 patients. Pediatrics. 2002;109(1):99‐104. doi: 10.1542/peds.109.1.99 [DOI] [PubMed] [Google Scholar]
- 15. Tyni T, Palotie A, Viinikka L, et al. Long‐chain 3‐hydroxyacyl‐coenzyme a dehydrogenase deficiency with the G1528C mutation: clinical presentation of thirteen patients. J Pediatr. 1997;130(1):67‐76. doi: 10.1016/s0022-3476(97)70312-3 [DOI] [PubMed] [Google Scholar]
- 16. Spiekerkoetter U, Sun B, Khuchua Z, Bennett MJ, Strauss AW. Molecular and phenotypic heterogeneity in mitochondrial trifunctional protein deficiency due to beta‐subunit mutations. Hum Mutat. 2003;21(6):598‐607. doi: 10.1002/humu.10211 [DOI] [PubMed] [Google Scholar]
- 17. Spiekerkoetter U, Lindner M, Santer R, et al. Management and outcome in 75 individuals with long‐chain fatty acid oxidation defects: results from a workshop. J Inherit Metab Dis. 2009;32(4):488‐497. doi: 10.1007/s10545-009-1125-9 [DOI] [PubMed] [Google Scholar]
- 18. Karall D, Brunner‐Krainz M, Kogelnig K, et al. Clinical outcome, biochemical and therapeutic follow‐up in 14 Austrian patients with long‐chain 3‐hydroxy acyl CoA dehydrogenase deficiency (LCHADD). Orphanet J Rare Dis. 2015;10:21. doi: 10.1186/s13023-015-0236-7 [DOI] [PMC free article] [PubMed] [Google Scholar]
- 19. De Biase I, Viau KS, Liu A, et al. Diagnosis, treatment, and clinical outcome of patients with mitochondrial trifunctional protein/long‐chain 3‐hydroxy acyl‐CoA dehydrogenase deficiency. JIMD Rep. 2017;31:63‐71. doi: 10.1007/8904_2016_558 [DOI] [PMC free article] [PubMed] [Google Scholar]
- 20. Rucklova K, Hruba E, Pavlikova M, et al. Impact of newborn screening and early dietary management on clinical outcome of patients with long chain 3‐Hydroxyacyl‐CoA dehydrogenase deficiency and medium chain acyl‐CoA dehydrogenase deficiency—a Retrospective Nationwide Study. Nutrients. 2021;13(9):2925. doi: 10.3390/nu13092925 [DOI] [PMC free article] [PubMed] [Google Scholar]
- 21. Lim CC, Vockley J, Ujah O, et al. Outcomes and genotype correlations in patients with mitochondrial trifunctional protein or isolated long chain 3‐hydroxyacyl‐CoA dehydrogenase deficiency enrolled in the IBEM‐IS database. Mol Genet Metab Rep. 2022;32:100884. doi: 10.1016/j.ymgmr.2022.100884 [DOI] [PMC free article] [PubMed] [Google Scholar]
- 22. AWMF . Konfirmationsdiagnostik bei Verdacht auf angeborene Stoffwechselkrankheiten aus dem Neugeborenenscreening, 027‐021. AWMF. Accessed June 15, 2020. https://www.awmf.org/leitlinien/detail/ll/027‐021.html
- 23. Pons R, Roig M, Riudor E, et al. The clinical spectrum of long‐chain 3‐hydroxyacyl‐CoA dehydrogenase deficiency. Pediatr Neurol. 1996;14(3):236‐243. doi: 10.1016/0887-8994(96)00021-5 [DOI] [PubMed] [Google Scholar]
- 24. Kohler S, Gargano M, Matentzoglu N, et al. The human phenotype ontology in 2021. Nucleic Acids Res. 2021;49(D1):D1207‐D1217. doi: 10.1093/nar/gkaa1043 [DOI] [PMC free article] [PubMed] [Google Scholar]
- 25. Grunert SC, Eckenweiler M, Spiekerkoetter U. Reversible sensory neuropathy in mitochondrial trifunctional protein deficiency. JIMD Rep. 2022;63(3):207‐210. doi: 10.1002/jmd2.12279 [DOI] [PMC free article] [PubMed] [Google Scholar]
- 26. Statistisches Bundesamt . Eckdaten der Krankenhauspatientinnen und ‐patienten. Accessed November 14, 2022. https://www.destatis.de/DE/Themen/Gesellschaft‐Umwelt/Gesundheit/Krankenhaeuser/Tabellen/entlassene‐patienten‐eckdaten.html
- 27. NCBI GenBank . Homo sapiens hydroxyacyl‐CoA dehydrogenase trifunctional multienzyme complex subunit beta (HADHB), transcript variant 1, mRNA; nuclear gene for mitochondrial product. Accessed March 16, 2022. https://www.ncbi.nlm.nih.gov/nuccore/NM_000183.3
- 28. Lefter M, Vis JK, Vermaat M, den Dunnen JT, Taschner PEM, Laros JFJ. Mutalyzer 2: next generation HGVS nomenclature checker. Bioinformatics. 2021;37(18):2811‐2817. doi: 10.1093/bioinformatics/btab051 [DOI] [PMC free article] [PubMed] [Google Scholar]
- 29. Spiekerkoetter U, Lindner M, Santer R, et al. Treatment recommendations in long‐chain fatty acid oxidation defects: consensus from a workshop. J Inherit Metab Dis. 2009;32(4):498‐505. doi: 10.1007/s10545-009-1126-8 [DOI] [PubMed] [Google Scholar]
- 30. DGE . Richtwerte für die Energiezufuhr. Accessed November 14, 2022. https://www.dge.de/wissenschaft/referenzwerte/energie/#mainContent
- 31. R: a language and environment for statistical computing . Version 4.1.3. The R Foundation. 2022. https://www.r‐project.org/
- 32. DGNS . Nationale Screeningreports Deutschland 2004‐2020. Accessed February 9, 2023. https://www.screening‐dgns.de/reports.php
- 33. Haram K, Svendsen E, Abildgaard U. The HELLP syndrome: clinical issues and management. A review. BMC Pregnancy Childbirth. 2009;9:8. doi: 10.1186/1471-2393-9-8 [DOI] [PMC free article] [PubMed] [Google Scholar]
- 34. Mjahed K, Charra B, Hamoudi D, Noun M, Barrou L. Acute fatty liver of pregnancy. Arch Gynecol Obstet. 2006;274(6):349‐353. doi: 10.1007/s00404-006-0203-6 [DOI] [PubMed] [Google Scholar]
- 35. G‐BA . Richtlinie des Gemeinsamen Bundesausschusses über die Früherkennung von Krankheiten bei Kindern (Kinder‐Richtlinie). BAnz AT 18.08.2016 B1. Accessed November 15, 2022. https://www.g‐ba.de/richtlinien/15/
- 36. Sims HF, Brackett JC, Powell CK, et al. The molecular basis of pediatric long chain 3‐hydroxyacyl‐CoA dehydrogenase deficiency associated with maternal acute fatty liver of pregnancy. Proc Natl Acad Sci U S A. 1995;92(3):841‐845. doi: 10.1073/pnas.92.3.841 [DOI] [PMC free article] [PubMed] [Google Scholar]
- 37. Treem WR, Shoup ME, Hale DE, et al. Acute fatty liver of pregnancy, hemolysis, elevated liver enzymes, and low platelets syndrome, and long chain 3‐hydroxyacyl‐coenzyme a dehydrogenase deficiency. Am J Gastroenterol. 1996;91(11):2293‐2300. [PubMed] [Google Scholar]
- 38. Chakrapani A, Olpin S, Cleary M, Walter JH, Wraith JE, Besley GT. Trifunctional protein deficiency: three families with significant maternal hepatic dysfunction in pregnancy not associated with E474Q mutation. J Inherit Metab Dis. 2000;23(8):826‐834. doi: 10.1023/a:1026712719416 [DOI] [PubMed] [Google Scholar]
- 39. Tyni T, Ekholm E, Pihko H. Pregnancy complications are frequent in long‐chain 3‐hydroxyacyl‐coenzyme a dehydrogenase deficiency. Am J Obstet Gynecol. 1998;178(3):603‐608. doi: 10.1016/s0002-9378(98)70446-6 [DOI] [PubMed] [Google Scholar]
- 40. Arpino C, Compagnone E, Montanaro ML, et al. Preterm birth and neurodevelopmental outcome: a review. Childs Nerv Syst. 2010;26(9):1139‐1149. doi: 10.1007/s00381-010-1125-y [DOI] [PubMed] [Google Scholar]
- 41. Elizondo G, Matern D, Vockley J, Harding CO, Gillingham MB. Effects of fasting, feeding and exercise on plasma acylcarnitines among subjects with CPT2D, VLCADD and LCHADD/TFPD. Mol Genet Metab. 2020;131(1–2):90‐97. doi: 10.1016/j.ymgme.2020.09.001 [DOI] [PMC free article] [PubMed] [Google Scholar]
- 42. Browning MF, Larson C, Strauss A, Marsden DL. Normal acylcarnitine levels during confirmation of abnormal newborn screening in long‐chain fatty acid oxidation defects. J Inherit Metab Dis. 2005;28(4):545‐550. doi: 10.1007/s10545-005-0545-4 [DOI] [PubMed] [Google Scholar]
- 43. Lotz‐Havla AS, Roschinger W, Schiergens K, et al. Fatal pitfalls in newborn screening for mitochondrial trifunctional protein (MTP)/long‐chain 3‐Hydroxyacyl‐CoA dehydrogenase (LCHAD) deficiency. Orphanet J Rare Dis. 2018;13(1):122. doi: 10.1186/s13023-018-0875-6 [DOI] [PMC free article] [PubMed] [Google Scholar]
- 44. den Boer ME, Dionisi‐Vici C, Chakrapani A, van Thuijl AO, Wanders RJ, Wijburg FA. Mitochondrial trifunctional protein deficiency: a severe fatty acid oxidation disorder with cardiac and neurologic involvement. J Pediatr. 2003;142(6):684‐689. doi: 10.1067/mpd.2003.231 [DOI] [PubMed] [Google Scholar]
- 45. Tyni T, Paetau A, Strauss AW, Middleton B, Kivela T. Mitochondrial fatty acid beta‐oxidation in the human eye and brain: implications for the retinopathy of long‐chain 3‐hydroxyacyl‐CoA dehydrogenase deficiency. Pediatr Res. 2004;56(5):744‐750. doi: 10.1203/01.PDR.0000141967.52759.83 [DOI] [PubMed] [Google Scholar]
- 46. Kahraman AB, Yildiz Y, Gokmen‐Ozel H, Kadayifcilar S, Sivri S. Successful management of rhabdomyolysis with triheptanoin in a child with severe long‐chain 3‐hydroxyacyl‐coenzyme a dehydrogenase (LCHAD) deficiency. Neuromuscul Disord. 2023;33(4):315‐318. doi: 10.1016/j.nmd.2023.02.008 [DOI] [PubMed] [Google Scholar]
- 47. Vockley J, Burton BK, Berry G, et al. Triheptanoin for the treatment of long‐chain fatty acid oxidation disorders: final results of an open‐label, long‐term extension study. J Inherit Metab Dis. 2023;46(5):943‐955. doi: 10.1002/jimd.12640 [DOI] [PubMed] [Google Scholar]
- 48. Vockley J, Marsden D, McCracken E, et al. Long‐term major clinical outcomes in patients with long chain fatty acid oxidation disorders before and after transition to triheptanoin treatment—a retrospective chart review. Mol Genet Metab. 2015;116(1–2):53‐60. doi: 10.1016/j.ymgme.2015.06.006 [DOI] [PMC free article] [PubMed] [Google Scholar]
- 49. Harding CO, Gillingham MB, van Calcar SC, Wolff JA, Verhoeve JN, Mills MD. Docosahexaenoic acid and retinal function in children with long‐chain 3‐hydroxyacyl‐CoA dehydrogenase deficiency. J Inherit Metab Dis. 1999;22(3):276‐280. doi: 10.1023/a:1005502626406 [DOI] [PMC free article] [PubMed] [Google Scholar]
- 50. Gillingham MB, Weleber RG, Neuringer M, et al. Effect of optimal dietary therapy upon visual function in children with long‐chain 3‐hydroxyacyl CoA dehydrogenase and trifunctional protein deficiency. Mol Genet Metab. 2005;86(1–2):124‐133. doi: 10.1016/j.ymgme.2005.06.001 [DOI] [PMC free article] [PubMed] [Google Scholar]