

Abstract
Objective
To investigate autonomic nervous system activity measured by brain–heart interactions in comatose patients after cardiac arrest in relation to the severity and prognosis of hypoxic–ischemic brain injury.
Methods
Strength and complexity of bidirectional interactions between EEG frequency bands (delta, theta, and alpha) and ECG heart rate variability frequency bands (low frequency, LF and high frequency, HF) were computed using a synthetic data generation model. Primary outcome was the severity of brain injury, assessed by (i) standardized qualitative EEG classification, (ii) somatosensory evoked potentials (N20), and (iii) neuron‐specific enolase levels. Secondary outcome was the 3‐month neurological status, assessed by the Cerebral Performance Category score [good (1–2) vs. poor outcome (3–4–5)].
Results
Between January 2007 and July 2021, 181 patients were admitted to ICU for a resuscitated cardiac arrest. Poor neurological outcome was observed in 134 patients (74%). Qualitative EEG patterns suggesting high severity were associated with decreased LF/HF. Severity of EEG changes were proportional to higher absolute values of brain‐to‐heart coupling strength (p < 0.02 for all brain‐to‐heart frequencies) and lower values of alpha‐to‐HF complexity (p = 0.049). Brain‐to‐heart coupling strength was significantly higher in patients with bilateral absent N20 and correlated with neuron‐specific enolase levels at Day 3. This aberrant brain‐to‐heart coupling (increased strength and decreased complexity) was also associated with 3‐month poor neurological outcome.
Interpretation
Our results suggest that autonomic dysfunctions may well represent hypoxic–ischemic brain injury post cardiac arrest pathophysiology. These results open avenues for integrative monitoring of autonomic functioning in critical care patients.
Introduction
After successful resuscitation and the return of spontaneous circulation (ROSC), approximately 50% of patients remain comatose 72 h following a cardiac arrest (CA). 1 These patients often suffer from poor neurological outcomes due to irreversible hypoxic–ischemic brain injury (HIBI), 2 , 3 which can result in a wide range of conditions, from minimal cognitive impairment with executive and memory deficits to severe and persistent loss of consciousness (such as minimally conscious state, vegetative state, or coma). The former are related to prefrontal cortex and limbic system lesions, while the latter are related to a disruption of key systems that support wakefulness and consciousness, such as the ascending reticular system and the hypothalamic and thalamic projections to the frontoparietal cortical network. 4 Two of the most used tools to assess HIBI severity after CA, somatosensory evoked potentials (SSEP) and EEG, 5 , 6 rely on the evaluation of information processing from the brainstem to the cortex and within thalamocortical loops. However, neuroprognosticaion remains challenging due to the diverse conditions in which HIBI presents itself, and our understanding of the multisystem physiological implications caused by severe brain damage is still limited.
Interestingly, all of the aforementioned regions are also crucial for the acute response to stress through the integration and modulation of the autonomic nervous system (ANS) activity. ANS is composed of the sympathetic nervous system (with preganglionic and postganglionic neurons in the thoracic and lumbar regions of the spinal cord) and the parasympathetic nervous systems 7 (with neurons in several cranial nerves nuclei in the brainstem—notably the dorsal motor nucleus of the vagus nerve—and sacral spinal cord nuclei). ANS is thus essential to maintain homeostasis and allostasis and regulate vital and immune functions.
ANS dysfunction seems to be a key feature of many critical illnesses, 8 both with 9 , 10 , 11 and without primary brain involvement. 12 Recently, ANS dysfunction was reported in post‐CA survivors and was associated with poor outcomes. 13 So far, these studies only relied on the assessment of cardiac autonomic dysfunction by measures of heart rate variability (HRV) and the bidirectional functional communication of the heart with the brain remains to be investigated. Recent theoretical developments and experimental results indicate that assessing the neural monitoring of visceral inputs, through measures of brain–heart interactions, can serve as a measure of conscious processing. 14 Furthermore, heartbeat‐evoked responses have been identified as effective measures to detect (un)consciousness after an acute comatose stage. 15 , 16 , 17 , 18
In this study, we assessed bilateral brain–heart interactions using a physiological model to describe causality and directionality between ongoing fluctuations in EEG and cardiac sympathetic–vagal oscillations 19 in CA survivors. Building upon previous evidence about the relationship between brain–heart biomarkers and the susceptibility to HIBI of key brain regions involved in autonomic control and consciousness, we hypothesized that altered brain–heart interactions would serve as biomarkers of the physiological state of the organism and thus scale with the severity of HIBI and with patients' neurological outcome at 3 months.
Material & Methods
Standard protocol approvals, registrations, and patient consents
Patients' next of kin were informed that data were collected for clinical research purposes. Data collection was approved by the Ethics Committee of the French Intensive Care Society (#CESRLF_12‐384 and 20–41) and conducted according to French health authorities' regulations (French Data Protection Authority #MR004_2209691) who waived the need for informed consent.
Population
This is a retrospective analysis performed on a prospectively collected database including all consecutive patients admitted in the single tertiary intensive care unit of hospital Cochin in Paris (France) following cardiopulmonary resuscitation and ROSC. For the present analysis, we included adult patients still comatose (as defined by a Glasgow Coma Scale ≤ 8 with a motor component <3 and a Richmond Agitation–Sedation Scale RASS ≤ −4) 48 h after sedation weaning, who undergone a standard EEG for neuroprognostication. We excluded patients investigated for brain death diagnosis, patients awake before EEG, and patients who died within 48 h after CA before a reliable neurological examination could be performed.
Data collection
Data regarding patients' characteristics, preadmission, and ICU management were collected following the Utstein style. In addition, pre‐exposure to beta blockers, ongoing sedation, and/or catecholamines at the time of EEG/ECG acquisition were also recorded, as well as length of stay in ICU, vital and neurological status at ICU discharge and cause of death. In a subset of patients, Day 3 NSE serum levels and SSEP recordings (at least 48 h after sedation discontinuation) were performed and collected.
ICU management and neurological prognostication
The management protocol for patients admitted to our ICU after CA has been previously described and did not change throughout the study period. Briefly, in the absence of contraindication, targeted temperature management was immediately started after ICU admission with a target temperature of 32–36°C adapted to hemodynamic tolerance and using an external cooling device for 24 h. A sedation protocol based on the RASS was used according to guidelines, with midazolam and sufentanil before 2014 and the short‐acting drugs propofol and remifentanil after, titrated to obtain a RASS level of −5 (no response to voice or physical stimulation) before cooling. Sedation was interrupted after rewarming. Neurological status was evaluated every 3 h by nurses, and daily by ICU physicians until death or ICU discharge. Awakening was defined as three consecutive RASS scores of at least −2 (patient briefly awakens with eye contact to voice), as previously reported. In patients who were still comatose 72 h after ROSC and 48 h after sedation discontinuation, a multimodal prognostication protocol was used, consistent with the 2015 international ERC/ESICM guidelines, 20 including clinical examination, standard EEG, N20/SSEP, and NSE at Day 3, unchanged during the study period.
EEG acquisition and qualitative analysis
Standard 20‐min EEG (using 13 scalp electrodes: Fp1, Fp2, F7, F8, T3, T4, T5, T6, C3, Cz, C4, O1, O2 in the 10–20 international system, one reference, 1 ground electrode, and 2 precordial ECG leads) were recorded, with a sample frequency of 256 Hz using Natus Deltamed recording device (Natus, Middleton, USA).
Qualitative analysis of the EEG traces was retrospectively performed by a board‐certified electroencephalographer (SB) blinded to the clinical outcome, and to others standard prognostic markers and brain–heart interplay measures. EEGs were analyzed according to the standardized criteria of the American Clinical Neurophysiology Society (ACNS). 21 Each EEG was classified as highly malignant pattern (suppressed background with or without burst or superimposed periodic pattern), malignant pattern (presence of at least one of the following: abundant generalized periodic or rhythmic discharges, electroencephalographic seizure, discontinuous or low‐amplitude background, absence of EEG reactivity), or benign pattern (continuous and reactive pattern, absence of any malignant feature) 6 reflecting the severity of HIBI. According to ongoing guidelines at the time of the study, only highly malignant patterns and bilaterally absent N20 on SSEP were used for poor neurological outcome prediction.
EEG and ECG quantitative analysis
ECG were band‐pass filtered between 0.5 and 20 Hz and EEG were band‐pass filtered between 0.5 and 45 Hz using Butterworth filters of order 6 and 8 respectively and notch filters were applied at 50 Hz and 100 Hz. EEG data were re‐referenced to an average reference. Independent component analysis (ICA) was applied to EEG (after 1 Hz high‐pass filtering) using Preconditioned ICA for Real Data (Picard) algorithm and resulting components were visually inspected. ICA components capturing large artifacts (notably eye movements and blinks and cardiac‐field artifacts) were subtracted if any and the resulting artifact‐free EEG was compared to the original recording to assess the quality of the reconstruction (adequate removal of artifacts and preservation of brain EEG signals). Reconstructed recordings were then visually inspected and periods with remaining artifacts were manually rejected. The first period of 5 min of consecutive data without EEG and ECG artifacts was retained in the analysis and further preprocessed as described above.
EEG power spectrum densities were computed using a short‐time Fourier transform with a Hamming taper using a sliding window procedure (2 s segments with 50% overlap) to obtain 1 Hz resolution time series of EEG power within the three background EEG frequency bands delta (1–4 Hz), theta (4–8 Hz), and alpha (8–12 Hz). Individual EEG channels were denoised using Wavelet thresholding method, with a threshold defined automatically, based on signal's length and variance. 22
Heart rate variability
Automatic QRS detection was performed using the algorithm described by Elgendi et al. 23 The accuracy of QRS detection was visually inspected and R‐peaks were manually corrected if needed to obtain a 5‐min time series of interbeat intervals (IBI) for each patient. Patients with atrial fibrillation were discarded from the analysis. Given that the computation of the brain–heart interaction relies on the precise timing of both the EEG and IBI time series, no interpolation of ectopic beats was performed. Moreover, the number of ectopic beats was low, with a median of 0 [0–3] beats, that is a proportion of ectopic beats of 0% [0–0.8]. IBI time series intervals were resampled to 4 Hz and interpolated using a cubic spline interpolation. Frequency–domain heart rate variability (HRV) was computed in the low frequency (LF, 0.04–0.15 Hz) and high frequency (HF, 0.15–0.4 Hz). Welch's method was used to compute HRV power for the whole recording. Welch's periodogram was computed using 64 s time windows and 50% overlap. The time‐resolved HRV power was computed using a smoothed pseudo‐Wigner‐Ville distribution, 24 which consists in a two‐dimensional Fourier transform and filtered in space and frequency domains, whose outputs were interpolated to obtain time‐varying LF and HF with the same resolution as EEG power series.
Heartbeat‐evoked potentials
Heartbeat‐evoked potentials (HEPs) aim to capture the transient neural responses triggered by each heartbeat. HEPs were computed by averaging EEG epochs locked to the heartbeat timings, up to 500 ms with respect to the R‐peak of the cardiac cycle. Epochs reaching an amplitude >300 μV were not considered for HEPs computation. Epochs in which the IBI lasted less than 500 ms were not included in the HEPs computation. If more than 20% of EEG epochs were discarded due to the IBI duration, the HEPs computation latency was redefined to preserve at least 80% of the epochs. The redefinition of the minimum IBI occurred in 7 out of 47 and 16 out of 134 patients from the groups of good and bad outcomes, respectively. The redefinition of the minimum IBI did not occur more in one group than the other (chi‐squared test, stat = 0.2736, p‐value = 0.6009).
Brain–heart interplay modeling
Bidirectional brain–heart interactions between EEG within the three frequencies bands of interest and heart rate variability within LF and HF bands were computed using a synthetic data generation model 19 , 25 (Fig. 1). Briefly, the quantification of the functional interplay from the brain to the heart relied on an integral pulse frequency modulation model. The framework aims to model the stimulations to the sinoatrial node that causes the heartbeat generation. Thus, the model considers the interactions between LF and HF, and their respective central control coefficients. The functional interplay from the heart to the brain was estimated through a Markovian synthetic EEG data generation model. The framework models the fluctuations on EEG power on time as an autoregressive process, with an external input (LF or HF).
Figure 1.
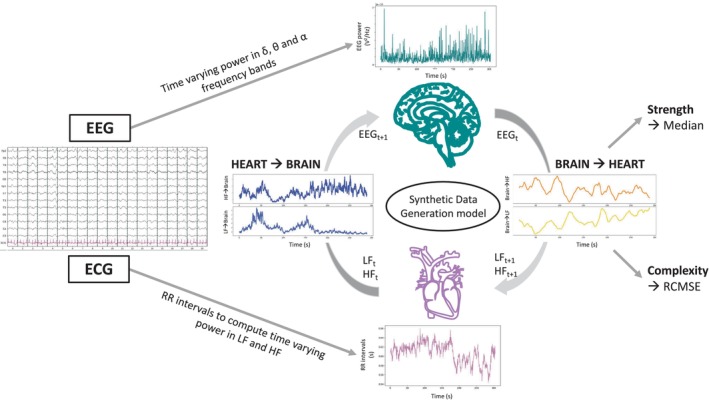
Computation of brain–heart interactions through a synthetic data generation model. Bidirectional brain–heart interactions between the brain within the EEG frequencies of interest (delta, theta, and alpha) and the heart within low‐frequency (LF) and high‐frequency (HF) bands were computed using a synthetic data generation model. The model estimates the functional interplay between the brain and the heart by assuming a communication loop in which ongoing EEG activity (EEGt) modulates autonomic activity (LFt+1 and HFt+1), while in turn, ongoing autonomic activity (LFt and HFt) modulates EEG activity (EEGt+1). For each EEG‐ECG frequency band pair, brain–heart coupling strength and complexity are expressed by the median and refined composite multiscale entropy (RCMSE) of the coupling coefficients over the 5 min recording.
The outputs of the model are time‐varying coefficients accounting for the brain–heart interplay for each combination of EEG frequency band, LF or HF, and ascending or descending directionality. The computation of brain–heart interplay coefficients was done over EEG and LF/HF power series sampled at 1 Hz, using a 15 s sliding time window. The resulting time‐varying coefficients were averaged among channels and on time using the median over the 5 min time series to quantify the overall strength of the brain–heart coupling (unitless metrics). Additionally, to better understand high or low coupling coefficients, we also assessed the complexity of the interactions using the refined composite multiscale entropy (RCMSE), an extension of the sample entropy to multiple time scales, with higher values indicating lower predictability and hence higher complexity of the fluctuations of the 5 min time series. Representative examples of patients with good and poor neurological outcome can be found in Fig. S1.
Surrogate analysis of isospectral power EEG and HRV series
To validate the specificity of brain–heart co‐fluctuations, we generated 100 surrogate datasets for both EEG and HRV series. We then compared the brain–heart interplay surrogates with those derived from the original time series. Surrogate p‐values were computed as the probability of observing the real data test statistic over the null distribution of test statistics constructed using 100 surrogates. For the EEG surrogates, we employed a process involving the multiplication of the Fourier transform of the initial EEG data by random phases. 26 The resultant data was then transformed back to the time domain through the Inverse Fast Fourier Transform. On the other hand, the HRV surrogates were created by constructing bimodal power spectra. These spectra consisted of the summation of two Gaussian distributions, centered at 0.10 and 0.25 Hz to correspond to the LF and HF components, respectively. 27 The power of these distributions matched that of the original HRV data. Subsequently, the data were transformed back to the time domain using the Inverse Fast Fourier Transform and adjusted to align the mean and standard deviations of the surrogate HRV series with those of the original data.
Study endpoints
The primary outcome of the study was the severity of the HIBI as assessed by (i) Westhall classification of the EEG according to standardized ACNS terminology (highly malignant, malignant, or benign pattern), (ii) absence or presence of the N20 SSEP component, and (iii) serum neuron‐specific enolase (NSE) 28 level at Day 3 following ROSC. The other study endpoint was neurological outcome at 3 months, assessed by the “best” Cerebral Performance Category (CPC) level (the most employed scale for assessment of neurological outcome after CA, ranging from 1 to 5). Good neurological outcome was defined as CPC level 1 (no or minimal disability) or 2 (moderate cerebral disability, that is independent for daily living activities), while poor neurological outcome was defined by a CPC of 3 (severe cerebral disability, that is dependent but conscious), 4 (comatose of vegetative state), or 5 (death). We used the “best” CPC observed at 3 months to avoid misclassifying patients reaching CPC 1–2 who subsequently died from non‐neurological causes as having a poor neurological outcome due to severe HIBI.
Statistical analyses
Descriptive statistics
Qualitative variables were described using median and interquartile range and compared using Wilcoxon and Kruskal–Wallis tests and categorical variables were described using proportion and compared using chi‐squared or Fisher's exact tests as appropriate. Correlations between brain–heart interactions markers and NSE levels were performed using the Spearman rho correlation coefficient. For the analyses with brain–heart metrics, we used a permutation‐based approach, relying on the resampling of the observations to build an empirical estimate of the null distribution from which the test statistic has been drawn, 29 to control for the false discovery rate. For each test, we computed the probability of observing the real data test statistic over the null distribution of test statistics constructed using 10,000 random Monte Carlo permutations. Reporting of the study followed the Standards of the STrengthening the Reporting of OBservational studies in Epidemiology (STROBE).
Softwares
EEG and ECG data were preprocessed using python and the MNE‐python package. Brain–heart coupling was computed using MATLAB R2018b (MathWorks) and Fieldtrip Toolbox and statistics were performed using R version 3.6.3 (2020‐02‐29) (R Core Team (2020). R: A language and environment for statistical computing. R Foundation for Statistical Computing, Vienna, Austria.) and MATLAB R2018b (MathWorks).
Results
Population description
Between January 2007 and July 2021, 240 patients were still comatose at Day 3 and underwent EEG for neuroprognostication among whom 181 were included in the analysis (27 patients were discarded due to atrial fibrillation and the remaining patients were not retained in the analysis because of insufficient data quality, see flowchart Fig. 2). Patients were mainly male (n = 116 (64%)) with a median age of 61 [49–72] years, admitted for out‐of‐hospital CA (n = 138 (69%)) with predominantly non‐shockable rhythm. Population characteristics and ICU management are described in Table 1.
Figure 2.
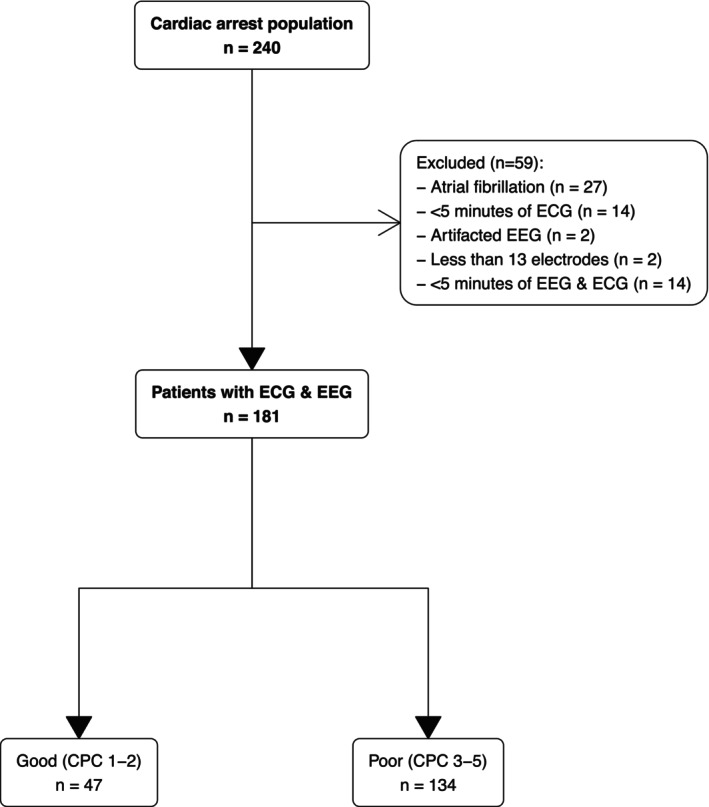
Flowchart.
Table 1.
Population characteristics according to the best CPC at 3 months.
| Best CPC at 3 months | p‐value b | |||
|---|---|---|---|---|
| Characteristic | Overall | Good | Poor | |
| N = 181 a | N = 47 a | N = 134 a | ||
| Sex (women) | 65 (36) | 16 (34) | 49 (37) | 0.756 |
| Age (years) | 61 [50–72] | 58 [45–66] | 63 [51–73] | 0.077 |
| Beta blockers before ICU admission (n = 178) | 41 (23) | 8 (17) | 33 (25) | 0.254 |
| Cardiac arrest location | 0.740 | |||
| In‐hospital | 43 (24) | 12 (26) | 31 (23) | |
| Out‐of‐hospital | 138 (76) | 35 (74) | 103 (77) | |
| Witnessed cardiac arrest (n = 174) | 120 (69) | 31 (69) | 89 (69) | 0.990 |
| Initial rhythm | 0.063 | |||
| Asystole | 94 (52) | 18 (38) | 76 (57) | |
| Ventricular tachycardia/fibrillation | 57 (31) | 22 (47) | 35 (26) | |
| Pulseless electrical activity | 14 (7.7) | 4 (8.5) | 10 (7.5) | |
| Unknown | 16 (8.8) | 3 (6.4) | 13 (9.7) | |
| No flow (min) | 3 [0–7] | 1.5 [0–5] | 3.0 [0–7] | 0.213 |
| Low flow (min) (n = 175) | 18 [10–25] | 15 [7–20] | 20 [12–27] | 0.005 |
| Hypothermia (n = 178) | 154 (87) | 43 (91) | 111 (85) | 0.245 |
| ICU mortality | 129 (71) | 2 (4.3) | 127 (95) | 4e‐32 |
| Delay of EEG (days) | 3 [2–4] | 2 [1–3] | 3 [2–4] | 0.027 |
| Sedation during EEG (n = 179) | 48 (27) | 16 (34) | 32 (24) | 0.193 |
| Ventilator mode (n = 176) | 0.460 | |||
| Volume control ventilation | 101 (57) | 27 (59) | 74 (57) | |
| Pressure support ventilation | 55 (31) | 16 (35) | 39 (30) | |
| Pressure control ventilation | 20 (11) | 3 (6.5) | 17 (13) | |
| Tidal volume (mL) (n = 173) | 440 [398–513] | 460 [410–525] | 440 [390–500] | 0.127 |
| PEEP (cmH2O) (n = 175) | 6 [5–8] | 6 [5–8] | 6 [5–8] | 0.087 |
| Respiratory rate (/min) (n = 172) | 22 [18–27] | 18 [15–22] | 23 [18–28] | 9e‐04 |
| EEG ACNS standardized classification | 2e‐20 | |||
| Highly malignant | 41 (23) | 0 (0) | 41 (31) | |
| Malignant | 92 (51) | 10 (21) | 82 (61) | |
| Benign | 48 (27) | 37 (79) | 11 (8.2) | |
| SSEP N20 presence (n = 112) | 80 (71) | 21 (100) | 59 (65) | 0.001 |
| NSE Day 3 (μg/L) (n = 66) | 93 [36–259] | 28 [18–41] | 160 [65–353] | 6e‐05 |
| EEG and ECG preprocessing | ||||
| Number of ectopic beats | 0 [0–3.0] | 0 [0–4.5] | 0 [0–3.0] | 0.715 |
| Proportions of ectopic beats (%) | 0 [0–0.83] | 0 [0–1.06] | 0 [0–0.73] | 0.723 |
| Cardiac artifacts removal | 58 (32) | 10 (21) | 48 (36) | 0.066 |
Bold indicates p‐values < 0.05.
n (%); Median [25%–75%].
Pearson's chi‐squared test; Wilcoxon rank sum test; Fisher's exact test.
Neurological outcome was unfavorable (CPC 3–4‐5) in 134 (74%). EEG recordings were obtained in all patients at a median time of 3 [2–4] days after CA (Table 1).
Standardized qualitative EEG pattern according to the ACNS classification was highly malignant in 41 (23%), malignant in 92 (51%), and benign in 48 (26%). SSEPs were assessed in 112 (62%) patients, among whom 32 (29%) had bilaterally absent N20. A highly malignant pattern was associated with poor outcomes in all cases, as was bilaterally absent N20 pattern. Blood NSE was available in 66 patients, with a median of 28 [18–41] μg/L and 160 [65–353] µg/L, p < 10−4) in good and poor outcome patients, respectively.
Post CA is characterized by an aberrant brain‐to‐heart coupling, scaling with HIBI severity
We first investigated the LF/HF ratio according to the severity of HIBI, assessed by the grade of the EEG ACNS classification. LF/HF diminished with EEG patterns of increasing severity, from 1.87 [0.68–3.99] in benign, to 1.24 [0.44–2.67] in malignant, and 0.74 [0.26–1.21] in highly malignant EEG patterns (p = 0.012). This seemed to be mainly driven by a decreased LF power although this difference did not reach statistical significance (p = 0.087).
We then found that the strength of the brain‐to‐heart coupling showed significant associations with the severity of HIBI, assessed by the grade of the EEG ACNS classification. Severity of EEG patterns were proportional to brain‐to‐heart absolute values of coupling strength (p < 0.02 for all couplings between EEG frequencies (i.e., delta, theta, or alpha) and ECG frequency activities (i.e., LF and HF). Post hoc pairwise group comparisons found that the significant differences in coupling strength were mostly differences between patients with highly malignant and either malignant patterns or benign patterns, rather than between malignant and benign patterns (Fig. 3A). Conversely, alpha‐to‐HF coupling complexity was higher with decreasing EEG severity (p = 0.0485), mainly driven by a difference between benign patterns and malignant patterns (Fig. 3B).
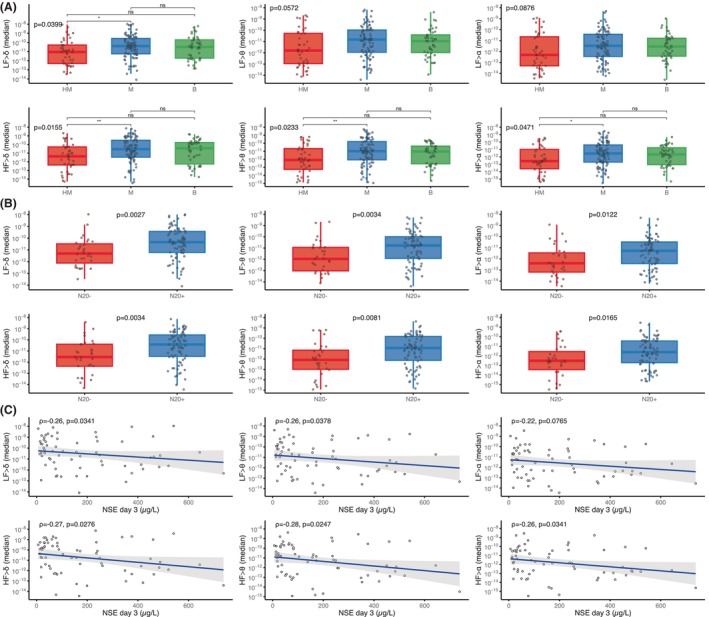
Figure 3.
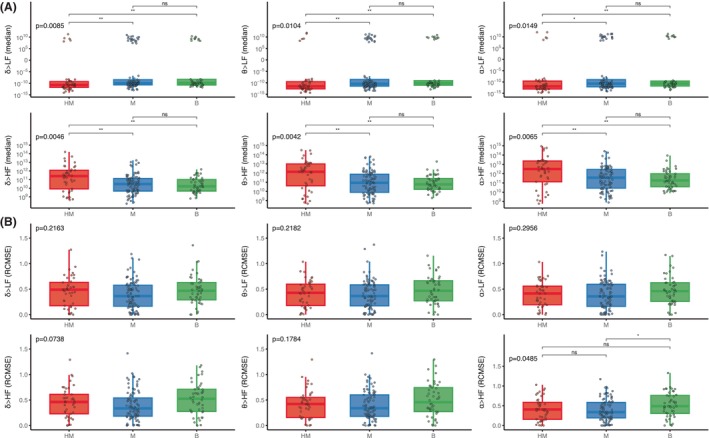
Brain‐to‐heart coupling strength and complexity according to EEG background ACNS classification. Brain‐to‐heart coupling strength (median) in (A) and complexity (RCMSE) in (B) according to EEG background activity following Westhall classification: highly malignant (HM), malignant (M), and benign (B). Overall comparisons were performed using permutation‐based Kruskal–Wallis tests with 10,000 random Monte Carlo permutations and post hoc two‐by‐two group comparisons using Wilcoxon tests. Y‐axes for the brain‐to‐heart coupling strength (median) are in logarithmic scales for ease of visualization, but statistics were performed on raw data. *p ≤ 0.05, **p ≤ 0.01.
Brain‐to‐heart coupling strength also scaled with HIBI severity as assessed by two other independent prognostic tools: SSEP and NSE blood levels. First, the median brain‐to‐heart coupling was higher in patients with bilaterally absent N20 as compared with patients with uni‐ or bilaterally present N20 (Fig. 4A). Second, median brain‐to‐heart coupling correlated with the NSE blood levels at Day 3 after CA, with significant correlations between NSE levels and delta‐, theta‐, and alpha‐to‐HF (rho between 0.34 and 0.36 with p < 0.006) and between NSE levels and absolute values of delta‐, theta‐, and alpha‐to‐LF (rho between 0.26 and 0.29 with p < 0.04, see Fig. 4B). No significant differences were observed for brain‐to‐heart coupling complexity and either SSEP or NSE levels.
Figure 4.
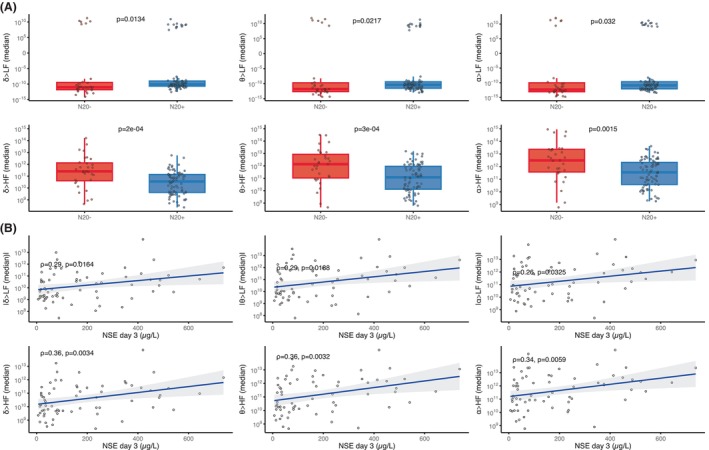
Brain‐to‐heart coupling strength according to SSEP and Day 3 NSE levels. (A) Brain‐to‐heart coupling strength according to the results of the somatosensory evoked potentials (SSEP): bilaterally absent N20 (N20‐) versus uni‐ or bilateral N20 presence (N20+). Groups were compared using permutation‐based Wilcoxon tests with 10,000 random Monte Carlo permutations. (B) Permutation‐based Spearman rho (ρ) correlations with 10,000 random Monte Carlo permutations between median brain‐to‐heart coupling indices and NSE levels at Day 3 after CA. All Y‐axes are in logarithmic scales for ease of visualization, but statistics were performed on raw data.
Severe HIBI is also associated with lower strength of the heart‐to‐brain coupling
To assess bidirectional brain–heart interplay, we also assessed heart‐to‐brain coupling. While heart‐to‐brain complexity did not differ according to HIBI severity, heart‐to‐brain coupling strength was lower in severe HIBI. Indeed, significantly lower values of all HF‐to‐brain (all p < 0.05) and LF‐to‐delta (p < 0.04) were observed with EEG patterns of increasing severity. Post hoc pairwise comparisons showed significant differences mainly between highly malignant patterns and malignant patterns (Fig. 5A). Lower values were also observed in patients with bilaterally absent N20 as compared with patients with uni‐ or bilateral N20 presence (all p < 0.02, Fig. 5B). Lastly, heart‐to‐brain coupling also correlated with the NSE levels at Day 3 with a lower median coupling coefficient being associated with higher NSE levels (all p < 0.05 except for the correlation between NSE levels and LF‐to alpha, Fig. 5C).
Figure 5.
Heart‐to‐brain coupling strength according to EEG patterns, SSEP, and NSE levels. (A) Heart‐to‐brain coupling strength (median) according to EEG background activity (following Westhall classification: highly malignant (HM), malignant (M) and benign (B)) and, (B) according to the results of the somatosensory evoked potentials (SSEP): uni‐ or bilateral N20 presence (N20+) or bilaterally absent N20 (N20‐). (C) Spearman rho (ρ) correlations between median heart‐to‐brain coupling and NSE levels at Day 3 after CA. All Y‐axes are in logarithmic scales for ease of visualization, but statistics were performed on raw data with permutation tests with 10,000 random Monte Carlo permutations. *p ≤ 0.05, **p ≤ 0.01.
Aberrant brain‐to‐heart coupling is associated with 3 months neurological outcome
Lastly, we tested if the aberrant brain–heart interactions described above were related to patients' neurological outcomes.
First, a lower LF/HF ratio was observed in patients with poor neurological outcomes as compared to patients with good outcome, 0.97 [0.30–2.44] versus 1.89 [0.76–3.99], p = 0.017, with an inversed modulation in patients with poor neurological outcome. Again, this seemed to be mainly driven by a lower power in the LF band although this difference did not reach statistical significance (0.05 ms2 [0.01–0.17] vs. 0.08 ms2 [0.02–0.41], p = 0.062).
Regarding brain–heart interactions, the strength of brain‐to‐heart coupling significantly differed between patients with poor and good neurological outcomes especially from delta, theta, and alpha frequency bands to LF (stronger negatives values of median brain‐to‐heart coupling coefficients in patients with a poor neurological outcome than in patients with a good outcome, all p < 0.03, Table 2). Brain‐to‐heart coupling strength also differed between theta‐, and alpha‐to‐HF (stronger positive median brain‐to‐heart coupling coefficient in patients with a poor neurological outcome than in patients with a good outcome, p < 0.04). As for brain‐to‐heart coupling complexity, we found that poor outcomes were associated with lower values of RCMSE in both alpha‐to‐LF (p = 0.045) and alpha‐to‐HF (p = 0.029). Importantly, these associations seemed to be specific of the time‐resolved covariations between EEG and heart activity, as evidenced by the probability of observing the real data test statistic over the null distribution of test statistics constructed using 100 surrogates of isospectral EEG and HRV power (p < 0.01 for brain‐to‐heart and p = 0.02 for both alpha‐to‐LF and alpha‐to‐HF). These brain‐to‐heart coupling strength and complexity metrics also significantly predicted poor neurological outcome, although their prognostic performances (i.e., specificity, sensitivity, PPV, NPV, and AUC) were poor to moderate and notably lower than NSE levels, SSEP and standardized ACNS classification. Highest AUC were achieved with theta‐to‐LF, 0.62 [0.53–0.71] and alpha‐to‐LF, 0.62 [0.52–0.71], as compared with alpha EEG power, 0.60 [0.51–0.68] or LF/HF ratio, 0.62 [0.52–0.71] (Table S1). Yet, adding alpha‐to‐heart strength and complexity metrics to NSE > 60 μg/L achieved the highest AUC (0.91 [0.82–0.97]) with a significantly improved poor outcome prediction compared to NSE alone (0.81 [0.69–0.91], p = 0.0075) or to NSE with EEG alpha power (0.75 [0.58–0.91], p = 0.0171, Fig. 6). In contrast, heartbeat evoked responses, another frequently used way of assessing ANS function, did not differ between patients with poor and good neurological outcomes (Figs. 7 and S2).
Table 2.
Brain‐to‐heart coupling strength and complexity according to patients' outcomes.
| Best CPC at 3 months | p‐perm b | p‐sur c | ||
|---|---|---|---|---|
| Good, N = 47 a | Poor, N = 134 a | |||
| Brain‐to‐heart coupling strength (median) | ||||
| δ → LF | −5.0 × 10⁹ [−4.6 × 10¹⁰ to 1.8 × 10⁸] | −1.7 × 10¹⁰ [−1.1 × 10¹¹ to −1.2 × 10⁹] | 0.029 | <0.01 |
| θ → LF | −1.1 × 10¹⁰ [−1.3 × 10¹¹ to 6.4 × 10⁸] | −4.3 × 10¹⁰ [−6.4 × 10¹¹ to −2.4 × 10⁹] | 0.017 | <0.01 |
| α → LF | −2.8e+10 [−5.9 × 10¹¹ to 1.0 × 10⁹] | −1.7e+11 [−2.2 × 10¹² to −4.8 × 10⁹] | 0.019 | <0.01 |
| δ → HF | 1.2 × 10¹⁰ [3.8 × 10⁹ to 1.0 × 10¹¹] | 4.9 × 10¹⁰ [5.4 × 10⁹ to 2.7 × 10¹¹] | 0.057 | – |
| θ → HF | 3.7 × 10¹⁰ [1.1 × 10¹⁰ to 3.9 × 10¹¹] | 1.6 × 10¹¹ [1.6 × 10¹⁰ to 1.6 × 10¹²] | 0.035 | <0.01 |
| α → HF | 9.9 × 10¹⁰ [2.2 × 10¹⁰ to 1.0 × 10¹²] | 5.3 × 10¹¹ [6.5 × 10¹⁰ to 4.6 × 10¹²] | 0.034 | <0.01 |
| Brain‐to‐heart coupling complexity (RCMSE) | ||||
| δ → LF | 0.49 [0.31–0.61] | 0.41 [0.17–0.58] | 0.113 | – |
| θ → LF | 0.48 [0.29–0.65] | 0.41 [0.18–0.58] | 0.074 | – |
| α → LF | 0.46 [0.25–0.63] | 0.36 [0.19–0.58] | 0.045 | 0.02 |
| α → HF | 0.49 [0.23–0.64] | 0.39 [0.19–0.63] | 0.276 | – |
| δ → HF | 0.41 [0.29–0.71] | 0.36 [0.18–0.60] | 0.254 | – |
| θ → HF | 0.49 [0.31–0.76] | 0.36 [0.20–0.59] | 0.029 | 0.02 |
Bold indicates p‐values < 0.05.
Median [25%–75%].
p‐values of permutation test using 10,000 random Monte Carlo permutations of Wilcoxon rank sum test.
p‐values of the 100 surrogates of isospectral EEG and HRV.
Figure 6.
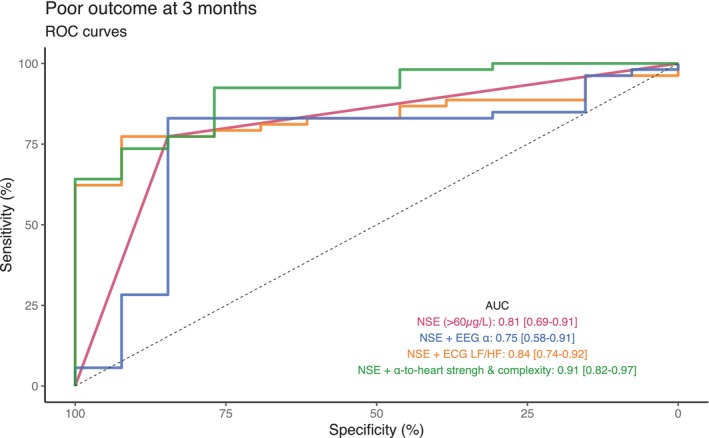
Poor outcome predictive performances of NSE, LF/HF, EEG alpha power and alpha‐to‐heart markers. Receiver Operating Channels curves and corresponding AUC (with 2000 bootstrap replicates confidence interval) for poor outcome prediction at 3 month (CPC 3 to 5) of the best clinical marker (NSE at day 3 > 60 μg/L) and its combination with the significant HRV marker (LF/HF ratio), the significant EEG power marker (alpha power), or the significant brain–heart metrics (alpha‐to‐LF and alpha‐to‐HF strength and complexity). The association of brain–heart metrics to NSE was significantly more performant that NSE alone (p = 0.0075) or than NSE combined with EEG alpha power (p = 0.0171), but not from NSE combined with LF/HF (p = 0.0789).
Figure 7.
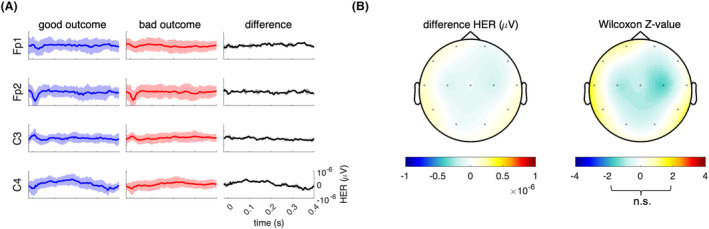
Heartbeat‐evoked potentials according to patients' neurological outcome. (A) Group median (and median absolute deviation) heartbeat‐evoked potential (HEP) time courses with respect to the R‐peak (0 sec) over the left and right central and prefrontal channels in the good and bad outcome groups and the difference between the two (good minus bad). (B) HEP scalp topography distribution in the interval 200–400 ms with respect to the R‐peak of the group median difference (left) and the corresponding statistics based on cluster permutation analyses of Wilcoxon rank sum test (right). No significant differences were found between the patients with good and bad neurological outcome (all z‐values within [−1.96; 1.96]).
Importantly, our results were probably not explained by the previous exposure to beta‐blockers (all p‐values > 0.3), nor by the infusion of sedation during recording (all p‐values > 0.4), both being not associated with the neurological outcomes either (p = 0.25 for beta‐blocker exposure and p = 0.19 for sedation exposure). Same was true for the number of ectopic beats and the proportions of cardiac artifact removal with ICA (Table 1).
Discussion
Building on existing evidence suggesting that markers on brain–heart interactions can reflect a multisystem dysfunction, we characterized bidirectional brain–heart interactions using a physiologically inspired model in comatose patients resuscitated from cardiac arrest. We found evidence of an ANS dysfunction scaling with HIBI severity and characterized by (i) an aberrant brain‐to‐heart coupling (high coupling strength, low coupling complexity), and (ii) a low heart‐to‐brain coupling strength. Lastly, we found that the aberrant brain‐to‐heart coupling was also associated with poor neurological outcomes at 3 months.
Cardiac dysautonomia can present itself as paroxysmal sympathetic hyperactivity 30 potentially involving arrhythmias and impaired myocardial contractility, as it is the case in stress‐induced cardiomyopathies 31 , 32 or result on the contrary in bradycardia and hypotension with diminished vasomotor tone. It is better described by measures of HRV and seems to be a key feature of many critical conditions, as it has been reported in various etiologies of brain injury such as brain death, 33 stroke, 11 subarachnoid hemorrhage, 34 or TBI 9 as well as in non‐brain‐injured critically ill patients. 12 In post‐CA patients, cardiac ANS dysfunction was only recently described and also associated with patient's outcome, with notably a decreased LF power and LF/HF ratio. 13 In this study, we reproduce those findings associated with the outcome, but also to loss of consciousness in patients with various neurological disorders. 35 This phenomenon suggests a decreased sympathetic modulation, although the direct interpretation of LF and HF as respective measures of sympathetic and parasympathetic tone has faced considerable criticism. 36 , 37 , 38
In addition to these difficulties of interpretation, the assessment of cardiac ANS dysfunction in CA patients has predominantly relied on unilateral assessments—either the cardiac side with the frequency content or complexity of HRV, 13 , 39 or the brain side with the cortical integration of heart signals using HEPs. 40 , 41 To the best of our knowledge, this study represents a pioneering attempt to investigate the bidirectional relationships between autonomic and cortical dynamics in individuals with HIBI, by using an innovative modeling approach. This model already proved relevant to unravel the physiological pathways of arousal in cold temperature sensing among healthy individuals, 19 , 42 where the information from skin receptors is transmitted to the brain through the spinal pathway, affecting sympathetic modulations of heartbeat dynamics, and then the delta and gamma cortical oscillations. This phenomenon was effectively captured in the model as LF‐to‐delta and gamma effects, which subsequently influenced brain‐to‐heart effects. Similarly, these effects have been observed during emotion elicitation. 25 Although our cohort of patients did not experience any form of stimulation, the model allows to describe the bidirectionality of brain–heart dynamics and provides a more comprehensive mechanistic insight on the cardiac ANS dysfunction associated with HIBI. We indeed show that both directions of the brain–heart interplay are impaired in CA survivors with a dose–effect relationship with the severity of HIBI (assessed by EEG background patterns, results of N20 on SSEP, and serum NSE levels).
In out results, the lower heart‐to‐brain coupling strength with increasing HIBI severity suggests a progressive impairment of bottom‐up signaling and cortical integration of visceral signals. This interoceptive integration is a key feature of conscious processing, as evidenced by a recently growing body of literature on perceptual awareness tasks in healthy subjects 14 , 43 as well as in studies of patients suffering from disorders of consciousness. 15 , 16 , 44
Conversely, when examining brain‐to‐heart direction, we found an aberrant coupling—stronger coupling strength over all frequencies with reduced complexity, predominantely in the alpha band. While it seemed reasonable to anticipate alterations in brain–heart coupling in such patients, one could have expected a mere disruption of the coupling with decreasing strength with increasing severity. Yet, this aberrant coupling is reminiscent of the pathological excessive and disproportionate brain‐to‐heart coupling observed in loss of consciousness following epilepsy 45 and general anesthesia. 46 , 47 This disproportionate activity has also been observed in a model of hypoxic CA in rats, 48 with a surge of cortico‐cardiac functional and effective connectivity following hypoxia and preceding the onset of ventricular fibrillation. Same could be true toward near‐death, in which baseline EEG and heart rate are reduced in parallel in animal models 49 and in human near‐death case reports. 40 , 50 Despite lacking data on ANS activity prior to the CA, the relation observed with the severity of HIBI suggests that ANS dysfunction is secondary to the CA rather than preceding it. Nevertheless, there are numerous possibilities for the interpretation of the underlying physiological phenomena. First, this aberrant coupling could reflect a trivial correlation stemming from the parallel reduction of power in both the central and autonomic nervous systems. However, analyses based on surrogates of isospectral EEG and HRV power demonstrated that our effect was specific to the time‐resolved co‐variations between EEG and heartbeat activity. Another potential explanation could be a disruption of the cortical and autonomic activity either due to direct lesions to the brainstem autonomic centers and their modulators (i.e., the pontine parabrachial nucleus, the nucleus of the solitary tract and the midbrain periaqueductal gray) and/or to high‐order cortical regions involved in autonomic control (i.e., the limbic system, the insula, and the medial prefrontal cortex). Indeed, the dose–effect relationship suggests that the degree of ANS dysfunction is related to the burden and location of HIBI lesions 51 which are not uniformly distributed within the brain. 1 , 52 Predominance of neuronal death in neocortical areas and hippocampus was found in a large postmortem study, while the brainstem seemed to be less sensitive to HIBI, in accordance with the usual preservation of brainstem auditory‐evoked potentials after CA. 53 We believe that the decrease complexity of the coupling might reflect lesions in neocortical regions involved in autonomic control as the differences of complexity were more prominent in highly malignant and malignant EEG patterns, characterized by a high level of neocortical and hippocampal neuronal death, as compared to benign patterns. 51 In contrast, increased strength of coupling is mostly observed in bilaterally absent N20 and in highly malignant EEG patterns as compared to malignant or benign patterns. This suggests a link with either direct lesion to the brainstem and/or with very severe cortical lesions which are systematic in these levels of HIBI severity. This kind of lesions could lead to a disinhibition of brainstem activity caused by the loss of corticothalamic top‐down inputs on autonomic centers, as observed in paroxysmal sympathetic storm. 30 This disinhibition phenomenon has been described in severe disorders of consciousness, in which some patients that exhibit reduced cortical activity lack the auditory startle habituation, that is the ability to inhibit a subcortical reflex in case of repeated stimulation. 54
One of the limitations of our study is that it is a retrospective analysis of a prospectively collected database, potentially biasing the follow‐up and prognostication of patients, notably with potential self‐fulfilling prophecy. Moreover, brain–heart metrics are computed on the same EEG data than the ones used to stratify the severity of HIBI using standardized qualitative ACNS classification. Yet, these analyses are radically different and were performed blindly from each other. The association of brain–heart metrics with HIBI severity was also found with two independent and complementary exams, SSEP and NSE, with a dose–effect relationship. 55 Lastly, following guidelines, we used a multimodal approach for poor outcome prediction, including validated tools with strong clinical and histopathological evidence, 51 , 56 while brain–heart metrics were not available in the clinical setting. Altogether, we assure that brain–heart metrics were not influenced by EEG qualitative analysis nor influenced patients' prognosis. Although scaling with HIBI severity and associated with 3‐month outcome, the prognostic performances of the brain–heart and HRV metrics were poor to moderate in comparison to the values of tools used in clinical practices (i.e., EEG, SSEP and NSE) in our cohort and as reported in different studies. 20 , 56 Prognostic performances are notably lower than recently published data of early HRV metrics in CA patient during hypothermia. Noteworthy, we focus on a more severe population and our recordings are not as early as the mentioned study (3 days vs. ours in the first 24 h). Furthermore, in our study we did not perform any type of stimulation to the patients. Earlier and longer recordings might thus lead to an improvement of the prognostic performances of brain–heart metrics.
It is important to stress that our main goal was to describe for the first time the bilateral brain–heart interactions in comatose patients after CA as an innovative way to describe ANS function to expand future fundamental and translational knowledge on HIBI. Importantly, our brain–heart interaction model seems to be more robust than HEPs. Indeed, in our study the latter were not associated with outcome, in apparent contradictions with recent findings. 41 However, we believe that the aforementioned study did not control for confounding factors, such as eliminating the cardiac‐field artifact and restricting the analysis to the duration of IBI, 44 , 57 while we made an effort to adhere to current guidelines for HEP computations. 58 Our findings imply that previously reported results regarding the HEP may stem from physiological disparities unrelated directly to brain–heart interactions, such as stroke volume. 57
Finally, it should be noted that HRV metrics and thus brain–heart metrics could also be influenced or confounded by several parameters. First, by data preprocessing choices. Yet it is unlikely, as the proportions of cardiac artifacts removal by ICA and the number and proportion of ectopic beats did not differ according to the outcome (see Supporting Information). Second, by breathing patterns which are well‐known to influence HRV metrics, notably in the LF. 59 , 60 , 61 Indeed, in our cohort, patients with worst outcome had higher respiratory rate but similar tidal volume. Respiratory rate was already associated with outcome in a large cohort of post‐CA patients, 62 but with undetermined significance, as it could be either due to worst respiratory severity and/or reflect higher HIBI severity, potentially involving the ANS itself. Unfortunately, as we do not have the continuous monitoring of respiratory rate, we are unable to include this potential confound in the model. Lastly, the potential confounding by sedation or beta‐blockers, although the results did not differ depending on the exposure to these drugs.
Conclusion
In this study, we investigated the autonomic nervous system function following cardiac arrest through an innovative modeling approach of the bidirectional brain–heart interplay. We showed that post cardiac arrest survivors exhibit an aberrant brain–heart interaction characterized by an excessive and disproportionate brain‐to‐heart coupling (increased strength, decreased complexity) and a decreased heart‐to‐brain coupling, scaling with the severity of HIBI and also associated with neurological outcome at 3 months. Our results contribute to a better understanding of HIBI pathophysiology and open avenue for an integrative monitoring of the cardiac autonomic system functioning in critically ill patients.
Author Contributions
Bertrand Hermann, Diego Candia‐Rivera, Sarah Benghanem, Alain Cariou, and Tarek Sharshar contributed to the conception and design of the study. Sarah Benghanem, Alain Cariou, and Martine Gavaret acquired the data. Bertrand Hermann, Sarah Benghanem, and Diego Candia‐Rivera contributed to data analysis and prepared the figures. Bertrand Hermann, Sarah Benghanem, Diego Candia‐Rivera, Tarek Sharshar, Alain Cariou, and Jean‐Luc Diehl drafted the manuscript.
Conflict of Interest Statement
Nothing to report.
Supporting information
Data S1 Supporting Information.
Acknowledgment
We thank the Département Médico‐Universitaire Urgences‐Réanimation of Assistance Publique ‐ Hôpitaux de Paris Centre‐Université de Paris and the Groupement Hospitalo‐Universitaire Paris Psychiatrie et Neurosciences, Sainte Anne for their support. No specific funding was received toward this work.
Contributor Information
Bertrand Hermann, Email: bertrand.hermann@aphp.fr.
Diego Candia‐Rivera, Email: diego.candia.r@ug.uchile.cl.
Data Availability Statement
Clinical and neurophysiological data analyzed in the current study are available from the corresponding author upon reasonable request.
References
- 1. Perkins GD, Callaway CW, Haywood K, et al. Brain injury after cardiac arrest. Lancet. 2021;398(10307):1269‐1278. [DOI] [PubMed] [Google Scholar]
- 2. Lemiale V, Dumas F, Mongardon N, et al. Intensive care unit mortality after cardiac arrest: the relative contribution of shock and brain injury in a large cohort. Intensive Care Med. 2013;39(11):1972‐1980. [DOI] [PubMed] [Google Scholar]
- 3. Elmer J, Torres C, Aufderheide TP, et al. Association of early withdrawal of life‐sustaining therapy for perceived neurological prognosis with mortality after cardiac arrest. Resuscitation. 2016;102:127‐135. [DOI] [PMC free article] [PubMed] [Google Scholar]
- 4. Edlow BL, Claassen J, Schiff ND, Greer DM. Recovery from disorders of consciousness: mechanisms, prognosis and emerging therapies. Nat Rev Neurol. 2021;17(3):135‐156. [DOI] [PMC free article] [PubMed] [Google Scholar]
- 5. Benghanem S, Pruvost‐Robieux E, Bouchereau E, Gavaret M, Cariou A. Prognostication after cardiac arrest: how EEG and evoked potentials may improve the challenge. Ann Intensive Care. 2022;12(1):111. [DOI] [PMC free article] [PubMed] [Google Scholar]
- 6. Westhall E, Rossetti AO, van Rootselaar A‐F, et al. Standardized EEG interpretation accurately predicts prognosis after cardiac arrest. Neurology. 2016;86(16):1482‐1490. [DOI] [PMC free article] [PubMed] [Google Scholar]
- 7. Wehrwein EA, Orer HS, Barman SM. Overview of the anatomy, physiology, and pharmacology of the autonomic nervous system. Compr Physiol. 2016;6(3):1239‐1278. [DOI] [PubMed] [Google Scholar]
- 8. Benghanem S, Mazeraud A, Azabou E, et al. Brainstem dysfunction in critically ill patients. Crit Care. 2020;24(1):5. [DOI] [PMC free article] [PubMed] [Google Scholar]
- 9. Mowery NT, Norris PR, Riordan W, Jenkins JM, Williams AE, Morris JA Jr. Cardiac uncoupling and heart rate variability are associated with intracranial hypertension and mortality: a study of 145 trauma patients with continuous monitoring. J Trauma. 2008;65(3):621‐627. [DOI] [PubMed] [Google Scholar]
- 10. Chouchou F, Mauguière F, Vallayer O, et al. How the insula speaks to the heart: cardiac responses to insular stimulation in humans. Hum Brain Mapp. 2019;40(9):2611‐2622. [DOI] [PMC free article] [PubMed] [Google Scholar]
- 11. Constantinescu V, Arsenescu‐Georgescu C, Matei D, Moscalu M, Corciova C, Cuciureanu D. Heart rate variability analysis and cardiac dysautonomia in ischemic stroke patients. Clin Neurol Neurosurg. 2019;186:105528. [DOI] [PubMed] [Google Scholar]
- 12. Carrara M, Ferrario M, Bollen Pinto B, Herpain A. The autonomic nervous system in septic shock and its role as a future therapeutic target: a narrative review. Ann Intensive Care. 2021;11(1):80. [DOI] [PMC free article] [PubMed] [Google Scholar]
- 13. Endoh H, Kamimura N, Honda H, Nitta M. Early prognostication of neurological outcome by heart rate variability in adult patients with out‐of‐hospital sudden cardiac arrest. Crit Care. 2019;23(1):323. [DOI] [PMC free article] [PubMed] [Google Scholar]
- 14. Candia‐Rivera D. Brain‐heart interactions in the neurobiology of consciousness. Curr Res Neurobiol. 2022;3:100050. [DOI] [PMC free article] [PubMed] [Google Scholar]
- 15. Candia‐Rivera D, Annen J, Gosseries O, et al. Neural responses to heartbeats detect residual signs of consciousness during resting state in postcomatose patients. J Neurosci. 2021;41(24):5251‐5262. [DOI] [PMC free article] [PubMed] [Google Scholar]
- 16. Raimondo F, Rohaut B, Demertzi A, et al. Brain–heart interactions reveal consciousness in noncommunicating patients. Ann Neurol. 2017;82(4):578‐591. [DOI] [PubMed] [Google Scholar]
- 17. Pérez P, Madsen J, Banellis L, et al. Conscious processing of narrative stimuli synchronizes heart rate between individuals. Cell Rep. 2021;36(11):109692. [DOI] [PubMed] [Google Scholar]
- 18. Candia‐Rivera D, Raimondo F, Pérez P, Naccache L, Tallon‐Baudry C, Sitt JD. Conscious processing of global and local auditory irregularities causes differentiated heartbeat‐evoked responses. eLife. 2023;12:e75352. [DOI] [PMC free article] [PubMed] [Google Scholar]
- 19. Catrambone V, Greco A, Vanello N, Scilingo EP, Valenza G. Time‐resolved directional brain‐heart interplay measurement through synthetic data generation models. Ann Biomed Eng. 2019;47(6):1479‐1489. [DOI] [PubMed] [Google Scholar]
- 20. Nolan JP, Sandroni C, Böttiger BW, et al. European Resuscitation Council and European Society of Intensive Care Medicine guidelines 2021: post‐resuscitation care. Intensive Care Med. 2021;47(4):369‐421. [DOI] [PMC free article] [PubMed] [Google Scholar]
- 21. Hirsch LJ, Fong MWK, Leitinger M, et al. American Clinical Neurophysiology Society's Standardized Critical Care EEG Terminology: 2021 Version. J Clin Neurophysiol. 2021;38(1):1‐29. [DOI] [PMC free article] [PubMed] [Google Scholar]
- 22. Gabard‐Durnam LJ, Mendez Leal AS, Wilkinson CL, Levin AR. The Harvard Automated Processing Pipeline for Electroencephalography (HAPPE): standardized processing software for developmental and high‐artifact data. Front Neurosci. 2018;12:97. [DOI] [PMC free article] [PubMed] [Google Scholar]
- 23. Elgendi M, Fast QRS. Detection with an optimized knowledge‐based method: evaluation on 11 standard ECG databases. PloS One. 2013;8(9):e73557. [DOI] [PMC free article] [PubMed] [Google Scholar]
- 24. Orini M, Bailón R, Mainardi LT, et al. Characterization of dynamic interactions between cardiovascular signals by time‐frequency coherence. IEEE Trans Biomed Eng. 2012;59(3):663‐673. [DOI] [PubMed] [Google Scholar]
- 25. Candia‐Rivera D, Catrambone V, Thayer JF, Gentili C, Valenza G. Cardiac sympathetic‐vagal activity initiates a functional brain–body response to emotional arousal. Proc Natl Acad Sci. 2022;119(21):e2119599119. [DOI] [PMC free article] [PubMed] [Google Scholar]
- 26. Schreiber T, Schmitz A. Surrogate time series. Phys D Nonlinear Phenom. 2000;142(3):346‐382. [Google Scholar]
- 27. McSharry PE, Clifford GD, Tarassenko L, Smith LA. A dynamical model for generating synthetic electrocardiogram signals. IEEE Trans Biomed Eng. 2003;50(3):289‐294. [DOI] [PubMed] [Google Scholar]
- 28. Moseby‐Knappe M, Mattsson N, Nielsen N, et al. Serum Neurofilament light chain for prognosis of outcome after cardiac arrest. JAMA Neurol. 2019;76(1):64‐71. [DOI] [PMC free article] [PubMed] [Google Scholar]
- 29. Kimmel G, Jordan MI, Halperin E, Shamir R, Karp RM. A randomization test for controlling population stratification in whole‐genome association studies. Am J Hum Genet. 2007;81(5):895‐905. [DOI] [PMC free article] [PubMed] [Google Scholar]
- 30. Meyfroidt G, Baguley IJ, Menon DK. Paroxysmal sympathetic hyperactivity: the storm after acute brain injury. Lancet Neurol. 2017;16(9):721‐729. [DOI] [PubMed] [Google Scholar]
- 31. Gili S, Cammann VL, Schlossbauer SA, et al. Cardiac arrest in takotsubo syndrome: results from the InterTAK registry. Eur Heart J. 2019;40(26):2142‐2151. [DOI] [PMC free article] [PubMed] [Google Scholar]
- 32. Brazdil V, Kala P, Hudec M, et al. The role of central autonomic nervous system dysfunction in Takotsubo syndrome: a systematic review. Clin Auton Res. 2022;32(1):9‐17. [DOI] [PMC free article] [PubMed] [Google Scholar]
- 33. Papaioannou V, Giannakou M, Maglaveras N, Sofianos E, Giala M. Investigation of heart rate and blood pressure variability, baroreflex sensitivity, and approximate entropy in acute brain injury patients. J Crit Care. 2008;23(3):380‐386. [DOI] [PubMed] [Google Scholar]
- 34. Megjhani M, Kaffashi F, Terilli K, et al. Heart rate variability as a biomarker of Neurocardiogenic injury after subarachnoid hemorrhage. Neurocrit Care. 2020;32(1):162‐171. [DOI] [PMC free article] [PubMed] [Google Scholar]
- 35. Vassilieva A, Olsen MH, Peinkhofer C, Knudsen GM, Kondziella D. Automated pupillometry to detect command following in neurological patients: a proof‐of‐concept study. PeerJ. 2019;7:e6929. [DOI] [PMC free article] [PubMed] [Google Scholar]
- 36. Goldstein DS, Bentho O, Park M‐Y, Sharabi Y. LF power of heart rate variability is not a measure of cardiac sympathetic tone but may be a measure of modulation of cardiac autonomic outflows by baroreflexes. Exp Physiol. 2011;96(12):1255‐1261. [DOI] [PMC free article] [PubMed] [Google Scholar]
- 37. Reyes del Paso GA, Langewitz W, Mulder LJM, et al. The utility of low frequency heart rate variability as an index of sympathetic cardiac tone: a review with emphasis on a reanalysis of previous studies. Psychophysiology. 2013;50(5):477‐487. [DOI] [PubMed] [Google Scholar]
- 38. Martelli D, Silvani A, McAllen RM, et al. The low frequency power of heart rate variability is neither a measure of cardiac sympathetic tone nor of baroreflex sensitivity. Am J Physiol Heart Circ Physiol. 2014;307(7):H1005‐H1012. [DOI] [PubMed] [Google Scholar]
- 39. Riganello F, Zubler F, Haenggi M, De Lucia M. Heart rate complexity: an early prognostic marker of patient outcome after cardiac arrest. Clin Neurophysiol. 2022;134:27‐33. [DOI] [PubMed] [Google Scholar]
- 40. Candia‐Rivera D, Machado C. Reduced heartbeat‐evoked responses in a near‐death case report. J Clin Neurol. 2023;19(6):581‐588. [DOI] [PMC free article] [PubMed] [Google Scholar]
- 41. Schulz A, Stammet P, Dierolf AM, et al. Late heartbeat‐evoked potentials are associated with survival after cardiac arrest. Resuscitation. 2018;126:7‐13. [DOI] [PubMed] [Google Scholar]
- 42. Candia‐Rivera D, Catrambone V, Barbieri R, Valenza G. Functional assessment of bidirectional cortical and peripheral neural control on heartbeat dynamics: a brain‐heart study on thermal stress. Neuroimage. 2022;251:119023. [DOI] [PubMed] [Google Scholar]
- 43. Azzalini D, Rebollo I, Tallon‐Baudry C. Visceral signals shape brain dynamics and cognition. Trends Cogn Sci. 2019;23(6):488‐509. [DOI] [PubMed] [Google Scholar]
- 44. Candia‐Rivera D, Machado C. Multidimensional assessment of heartbeat‐evoked responses in disorders of consciousness. Eur J Neurosci. 2023;58:3098‐3110. [DOI] [PubMed] [Google Scholar]
- 45. Arthuis M, Valton L, Régis J, et al. Impaired consciousness during temporal lobe seizures is related to increased long‐distance cortical‐subcortical synchronization. Brain. 2009;132(Pt 8):2091‐2101. [DOI] [PubMed] [Google Scholar]
- 46. Supp GG, Siegel M, Hipp JF, Engel AK. Cortical hypersynchrony predicts breakdown of sensory processing during loss of consciousness. Curr Biol. 2011;21(23):1988‐1993. [DOI] [PubMed] [Google Scholar]
- 47. Li D, Voss LJ, Sleigh JW, Li X. Effects of volatile anesthetic agents on cerebral cortical synchronization in sheep. Anesthesiology. 2013;119(1):81‐88. [DOI] [PubMed] [Google Scholar]
- 48. Borjigin J, Lee U, Liu T, et al. Surge of neurophysiological coherence and connectivity in the dying brain. Proc Natl Acad Sci U S A. 2013;110(35):14432‐14437. [DOI] [PMC free article] [PubMed] [Google Scholar]
- 49. Li D, Mabrouk OS, Liu T, et al. Asphyxia‐activated corticocardiac signaling accelerates onset of cardiac arrest. Proc Natl Acad Sci. 2015;112(16):E2073‐E2082. [DOI] [PMC free article] [PubMed] [Google Scholar]
- 50. Matory AL, Alkhachroum A, Chiu W‐T, et al. Electrocerebral signature of cardiac death. Neurocrit Care. 2021;35(3):853‐861. [DOI] [PMC free article] [PubMed] [Google Scholar]
- 51. Endisch C, Westhall E, Kenda M, et al. Hypoxic‐ischemic encephalopathy evaluated by brain autopsy and neuroprognostication after cardiac arrest. JAMA Neurol. 2020;77(11):1430‐1439. [DOI] [PMC free article] [PubMed] [Google Scholar]
- 52. Snider SB, Fischer D, McKeown ME, et al. Regional distribution of brain injury after cardiac arrest: clinical and electrographic correlates. Neurology. 2022;98(12):e1238‐e1247. [DOI] [PMC free article] [PubMed] [Google Scholar]
- 53. Fischer C, Luauté J, Némoz C, Morlet D, Kirkorian G, Mauguière F. Improved prediction of awakening or nonawakening from severe anoxic coma using tree‐based classification analysis. Crit Care Med. 2006;34(5):1520‐1524. [DOI] [PubMed] [Google Scholar]
- 54. Hermann B, Ben Salah A, Perlbarg V, et al. Habituation of auditory startle reflex is a new sign of minimally conscious state. Brain. 2020;143:2154‐2172. [DOI] [PMC free article] [PubMed] [Google Scholar]
- 55. Grindegård L, Cronberg T, Backman S, et al. Association between EEG patterns and serum neurofilament light after cardiac arrest: a post hoc analysis of the TTM trial. Neurology. 2022;98(24):e2487‐e2498. [DOI] [PMC free article] [PubMed] [Google Scholar]
- 56. Sandroni C, D'Arrigo S, Cacciola S, et al. Prediction of poor neurological outcome in comatose survivors of cardiac arrest: a systematic review. Intensive Care Med. 2020;46(10):1803‐1851. [DOI] [PMC free article] [PubMed] [Google Scholar]
- 57. Buot A, Azzalini D, Chaumon M, Tallon‐Baudry C. Does stroke volume influence heartbeat evoked responses? Biol Psychol. 2021;165:108165. [DOI] [PubMed] [Google Scholar]
- 58. Park H‐D, Blanke O. Heartbeat‐evoked cortical responses: underlying mechanisms, functional roles, and methodological considerations. Neuroimage. 2019;197:502‐511. [DOI] [PubMed] [Google Scholar]
- 59. Brown TE, Beightol LA, Koh J, Eckberg DL. Important influence of respiration on human R‐R interval power spectra is largely ignored. J Appl Physiol (1985). 1993;75(5):2310‐2317. [DOI] [PubMed] [Google Scholar]
- 60. Cooke WH, Cox JF, Diedrich AM, et al. Controlled breathing protocols probe human autonomic cardiovascular rhythms. Am J Physiol. 1998;274(2 Pt 2):H709‐H718. [DOI] [PubMed] [Google Scholar]
- 61. Gąsior JS, Sacha J, Jeleń PJ, et al. Heart rate and respiratory rate influence on heart rate variability repeatability: effects of the correction for the prevailing heart rate. Front Physiol. 2016;7:356. [DOI] [PMC free article] [PubMed] [Google Scholar]
- 62. Harmon MBA, van Meenen DMP, van der Veen ALIP, et al. Practice of mechanical ventilation in cardiac arrest patients and effects of targeted temperature management: a substudy of the targeted temperature management trial. Resuscitation. 2018;129:29‐36. [DOI] [PubMed] [Google Scholar]
Associated Data
This section collects any data citations, data availability statements, or supplementary materials included in this article.
Supplementary Materials
Data S1 Supporting Information.
Data Availability Statement
Clinical and neurophysiological data analyzed in the current study are available from the corresponding author upon reasonable request.