

Summary
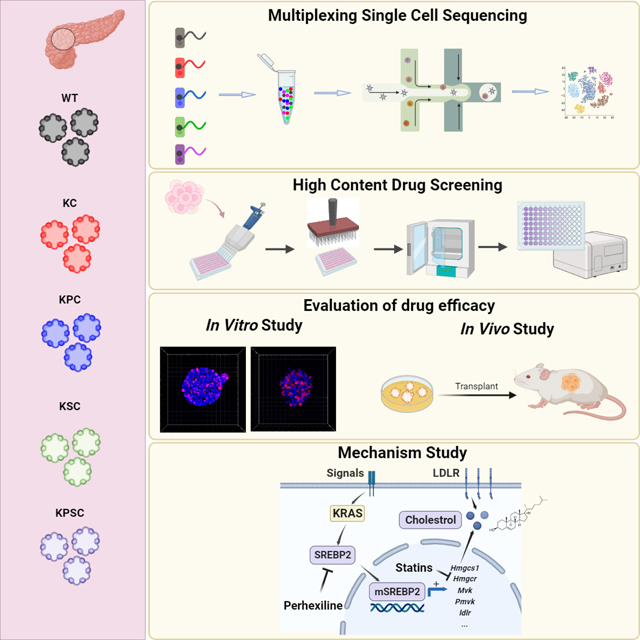
KRAS mutations, mainly G12D and G12V, are found in more than 90% of pancreatic ductal adenocarcinoma (PDAC) cases. The success of drugs targeting KRASG12C suggests the potential for drugs specifically targeting these alternative PDAC-associated KRAS mutations. Here, we report a high throughput drug screening platform using a series of isogenic murine pancreatic organoids that are wildtype (WT) or contain common PDAC driver mutations, representing both classical and basal PDAC phenotypes. We screened over 6000 compounds and identified Perhexiline maleate, which can inhibit the growth and induce cell death of pancreatic organoids carrying the KrasG12D mutation both in vitro and in vivo as well as primary human PDAC organoids. Single-cell RNA-seq analysis suggests that the cholesterol synthesis pathway is upregulated specifically in the KRAS mutant organoids, including the key cholesterol synthesis regulator SREBP2. Perhexiline maleate decreases SREBP2 expression levels and reverses the KRAS mutant-induced upregulation of the cholesterol synthesis pathway.
In brief
Duan et al. developed a panel of isogenic murine pancreatic organoids containing common PDAC driver mutations to screen for KRAS mutation inhibitors and identified that Perhexiline maleate can target KRAS mutation by downregulating the cholesterol biosynthesis pathway, which is specifically induced by KRAS mutation.
Graphical Abstract
Introduction
Cancer organoids that mimic tumor cellular heterogeneity and three-dimensional architecture have emerged as robust tools in pre-clinical and translational cancer research. Furthermore, the FDA has recently approved the use of organoid models in lieu of relying on in vivo mouse models further emphasizing its future importance for pharmaceutical drug discovery and development. During the past decade, cancer organoids have been derived from many distinct cancer types, including those of the gastrointestinal tract1–3, liver4, pancreas5, bile duct6, brain7, lung8, breast9, ovary10, endometrium11, kidney12, prostate13, and bladder14. Significant effort has been applied to biobank patient-derived cancer organoids15–19. Notably, combined with CRISPR/Cas9 technology to introduce multi-hit oncogenic mutations into an isogenic background, tumor progression can be mimicked from normal wild-type organoids to adenocarcinoma, as shown for pancreatic, colorectal, and gastric cancers20–22. Cancer organoids have been broadly utilized to evaluate drug sensitivity and predict therapeutic efficacy. They also provide opportunities for development of a screening platform to discover previously unknown oncological drug/drug targets23.
Pancreatic ductal adenocarcinoma (PDAC) is the fourth leading cause of cancer deaths in the United States24. Large-scale genomic studies identified KRAS driver mutations in over 90% of PDAC25–27. Numerous studies have shown that mutated KRAS plays an essential role in the initiation and progression of cancer, leading to stimulation of proliferation, migration, transformation, survival, evasion of tumor immunity, and reprogramming of cellular metabolism28–32. In PDAC, Glycine 12 is the hotspot mutation site, with KRASG12D representing the predominant substitution, followed by KRASG12V. KRAS had long been deemed an “undruggable” target until the identification of covalent drugs targeting KRASG12C 33,34. To date, several specific inhibitors targeting KRASG12C are described, including AMG510 (sotorasib), MRTX849 (adagrasib), MTRX1257, ARS-853, and ARS1620, which bind to the switch-II pocket in an inactive GDP state of KRASG12 35–39. Among these drugs, AMG510 and MRTX849 have moved into clinical trials showing improved results for non-small cell lung cancer patients, although with a limited response and eventual resistance with a median progression-free survival of approximately 6 to 11 months, respectively40,41. Compared to KRASG12C, few studies have reported drugs targeting KRASG12D or KRASG12V. Recently, two candidates were reported, including MRTX-EX185 targeting both KRASG12D and KRASG12V 39, and MRTX1133 that selectively targets KRASG12D42. More recently, covalent inhibitors for KRASmulti (RMC 6236)43, KRASG12C (RMC 6291)44, KRASG12D (RMC 9805)45 and KRASG13D (RMC-8839), have been developed to target the active state of KRAS and form a tri-complex with cyclophilin A. RMC 6236 (NCT05379985) and RMC 6291 (NCT05462717) have entered phase 1 clinic trials involving a multicenter, open-label, dose-escalation, and dose-expansion study for patients with advanced solid tumors. However, neither of these drug candidates have been validated using isogenic cancer models.
We developed a panel of isogenic murine pancreatic organoids containing common PDAC driver mutations, including KRASG12D, Tp53R172H, and loss of SMAD4. We screened ~6000 compounds using this panel of genetically defined PDAC organoids and identified Perhexiline maleate, which specifically inhibits the growth of PDAC organoids carrying KRASG12D mutations both in vitro and in vivo, including primary human metastatic PDAC organoids. Molecular mechanistic studies suggest that Perhexiline maleate targets the cholesterol metabolic pathway by down-regulating expression of SREBP2 to reverse metabolic changes in PDAC organoids carrying KRASG12D mutations. Chemical and genetic perturbation of SREBP2 can attenuate the growth of pancreatic organoids carrying KRASG12D mutations both in vitro and in vivo.
Results
Characterization of an isogenic genetically defined murine pancreatic cancer organoid platform.
As previously described5, three types of parental organoids were derived from wild type B6 strain fetal murine pancreas (WT), or pancreatic tissues from isogenic Pdx1-Cre; KrasLSL-G12D/+ mice (KC) and Pdx1-Cre; KrasLSL-G12D/+; Tp53LSL-R172H/+ mice (KPC), respectively. The KC and KPC pancreatic cancer organoids recapitulate low-grade murine PanIN and murine PDAC progression, respectively5. To further mimic tumor progression, Smad4, a tumor suppressor gene that is inactivated in ~50% of progressive PDAC46, was targeted using CRISPR/Cas9 and specific gRNAs in KC and KPC organoids to generate two advanced PDAC organoids with the genotypes of Pdx1-Cre; KrasLSL-G12D/+; Smad4−/− (KSC) and Pdx1-Cre; KrasLSL-G12D/+; Tp53LSL-R172H/+; Smad4−/− (KPSC) (Figure S1A). We monitored the growth curves of various organoids, with KPSC exhibiting the highest growth rate. Significantly, all organoids displayed a consistent logarithmic growth phase up to 72 hours (Figure S1B). Considering factors such as efficiency and workload, and given that this was our primary drug screening phase, we opted for a 48-hour observation period. Furthermore, whole exome sequence data confirmed the mutations within the isogenic organoid platform (Figures S1C–S1E).
We next characterized the transcriptomes of the WT, KC, KPC, KSC, KPSC organoids. Recently, a scalable multiplexing approach for single cell RNA-seq (scRNA-seq) was developed, enabling multiple pooled samples in a single experiment with minimal sample processing, reduced cost and improved data quality by identifying and excluding cell doublets47. We adopted this strategy for our organoid platform and multiplexed WT, KC, KPC, KSC, and KPSC organoids. Before preparing droplet microfluidic-emulsion with the 10x Genomics Chromium system, organoids were dissociated, barcoded with commercial modified oligos and pooled (Figure 1A). After data pre-processing, we analyzed the scRNA-seq dataset containing 15,865 cells. The WT, KC, KPC, KSC, and KPSC organoids were analyzed to examine the transcriptional changes caused by pancreatic cancer driver mutations. Unsupervised data analysis identified 5 clusters (Figure 1B). Next, the barcode information was projected onto the UMAP to demultiplex each sample (Figure 1C). The cell clusters identified by unsupervised data analysis and barcode projection matched well, in which cluster 0 represents WT organoids; cluster 1 represents KC organoids; cluster 2 represents KSC organoids; cluster 3 represents KPC organoids; and cluster 4 represents KPSC organoids. The transcription profiles of clusters are correlated to the gene signatures of their intended sample classifications (Figure 1D), which suggests that gene signatures of cell clusters are mainly affected by genotypes. Next, we investigated the transcription factor profiles of pancreatic cell lineages, including ductal, exocrine (acinar) and endocrine lineages. Regardless of genotype, the pancreatic organoids express relatively high levels of Sox9, Foxa2, Hnf1β, and Gata6, but with relatively low expression of Pdx1 (Figure 1E). The expression levels of acinar cell-specific transcription factors, such as Ptf1a and Gata448, and endocrine cell-specific transcription factors, such as Neurog3, Nkx2.2 and Nkx6.1, are relatively low (Figure S1F). These profiles indicate that the pancreatic cancer organoids represent primarily ductal and pancreatic progenitor identities. Previous studies demonstrated that organoids expressing oncogenic mutant Kras recapitulate features of PanINs5,49. Consistently, the expression levels of PanIN state associated genes, including Klf4, Muc5ac and Muc6, is higher in KC organoids than in WT organoids (Figure S2A).
Figure 1. Multiplexed single-cell RNA-seq of pancreatic cancer organoids.

(A) A scheme of multiplexed single-cell RNA-seq approach. Five samples were barcoded with CMOs, and then cells were pooled together before scRNA-seq. Next-generation sequencing produces two UMI count matrices corresponding to gene expression and barcode abundance.
(B) Uniform manifold approximation and projection (UMAP) plot based on the unsupervised analysis.
(C) UMAP plot of sample classifications for CMO-labeled cells based on barcoding.
(D) Correlation analysis of cell clusters based on unsupervised analysis and barcoding.
(E) UMAP showing the expression of pancreatic progenitor pattern genes, including Sox9, Foxa2, Hnf1β, Gata6 and Pdx1.
(F) Heatmap showing the master regulators of KSC, KPC and KPSC organoids.
(G) Dot plot comparing the relative expression levels for Gata6 of KPC, KSC and KPSC organoids.
(H) Representative immunohistochemistry staining of GATA6 in KPC and KPSC xenografts at day 28 post-transplantation.
See also Figures S1–S2
Previous transcriptomic analyses of human PDAC samples resulted in several subtype classification schemes, suggesting that PDAC can be divided into two distinct subtypes, “classical” and “basal-like” tumors or four distinct subtypes, “classical-A”, “classical-B”, “basal-like A” and “basal-like B” tumors27,50–53. Therefore, we examined the “classical” and “basal-like” markers in our set of pancreatic cancer organoids based on the two analysis method51,53. To accurately match the human gene set with the mouse homolog counterparts, we modified the 50 “Moffitt” gene set51 and basal-like (signatures 2 and 10) and classical signatures (signatures 1 and 6)53, and then filtered out those genes that are expressed in less than 1% of organoid cells to obtain a murine gene set as subtype classification standard. Since this analysis focuses on the cancer subtype classification, WT and KC organoids were excluded from this analysis. To elucidate subtypes at the single-cell level, cell clustering by sample barcodes, excluding WT and KC organoids, was profiled based on the expression of the murine gene set signature. Cells were scored for the subtype signatures derived from different studies. For the Moffit gene set, KSC organoids showed a higher score in “classical” signatures, while KPC and KPSC organoids did not show significant differences between the two gene signature groups (Figures S2C–S2D). However, heatmaps did not reveal any obvious gene signature patterns among KSC, KPC and KPSC organoids (Figure S2E). Using another study from Chang-Seng-Yue et al., cells were scored for the four subtype signatures. KSC, KPC and KPSC did not show differences among 4 signatures (Figures S2F–S2G). To gain deeper insight into the present subtypes, we employed SCENIC to simultaneously reconstruct gene regulatory networks and identify KSC, KPC and KPSC cell states54. Heatmaps showed significant regulons among KSC, KPC and KPSC organoids (Figure 1F). Basal-like regulons, including Myc, Est1, Hmga2 and Zeb1, were identified in KSC organoids, while classical/progenitor genes, Gata6, Sox9, Hnf1b and Onecut2, were the master network regulators in KPC and KPSC organoids55 (Figure 1F). A previous study has shown that Gata6 expression is associated with the classical subtype in advanced PDAC56. The average expression levels of Gata6 and percentage of Gata6 positive cells were higher in KPC and KPSC than KSC organoids (Figure 1G). Furthermore, Gata6 was highly expressed in xenografts of KPC and KPSC organoids after transplantation in vivo (Figure 1H). However, some basal-like regulators, including Nr3c1, Mxi1, Taf1, Klf7, Fosl1, can co-exist in the KPC and KPSC organoids. The xenografts of KPC and KPSC organoids exhibit an aggressive progression pattern, reflecting a basal-like subtype of PDAC55. Therefore, the “basal-like” and “classical” expression signatures can co-exist in KPC and KPSC organoids, endowing them with potential cell plasticity.
A high throughput screen using the cancer organoid platform.
To identify potential inhibitors that target the KRASG12D mutation, KC, KPC, KSC, and KPSC organoids were seeded into 384 well plates, followed by addition of compounds from libraries containing ~6000 FDA approved drugs, signaling pathway inhibitors, and natural products (Figure S3A). After 48 hours treatment, the cell viability was measured using an alamarBlue cell viability assay (Figure 2A). Compounds from wells in which the Z score was more than 3 were chosen as primary hit compounds (Figure 2B). The primary hits from KC, KPC, KSC, and KPSC organoid screens were overlapped to identify the inhibitors targeting the common KRAS mutation across the platform. This identified 49 compounds (Figures 2A and 2C) that were chosen for a secondary test using a CellTiter-Glo assay to monitor cell survival. 23 of these compounds blocked the growth of KC, KPC, KSC, and KPSC organoids, and they were used to generate full effective 10-point dose curves, with WT organoids as a control to validate inhibitors that are specific for the KRAS mutation (Figure S3B). From this assay, four compounds, namely Perhexiline maleate, gentian violet, clotrimazole, and lestaurtinib, were found to inhibit the growth of KC, KPC, KSC, and KPSC organoids in a dose-dependent manner, and with comparatively low cytotoxicity for WT organoids (Figures 2D–G). Gentian violet and clotrimazole are not suitable for in vivo assays due to a lack of essential pharmacokinetic (PK) and pharmacodynamic (PD) data. Lestaurtinib, an inhibitor of tyrosine kinases including Flt-3, TRK-A/B and JCK-2, has failed in clinical trials for PDAC treatment57. Thus, we focused on Perhexiline maleate that significantly inhibits viability of KC, KPC, KSC, and KPSC organoids compared with WT organoids.
Figure 2. An isogenic pancreatic cancer organoid-based high-throughput drug screen.

(A) Scheme of high-throughput drug screening.
(B) Primary screening results. The x-axis is the compound number. The y-axis is the Z score. Black line indicates Z score = 3.
(C) Venn diagram plot of overlapped primary screening results. 49 compounds were selected for the subsequent confirmation assay.
(D-G) Efficacy curve of perhexiline maleate (D), gentian violet (E), clotrimazole (F) and lestaurtinib (G) on WT, KC, KPC, KSC, KPSC organoids. Data are presented as mean ± SEM. n = 3 biological replicates.
See also Figure S3.
Perhexiline maleate blocks growth and induces cell apoptosis in pancreatic cancer organoids both in vitro and in vivo.
The full panel of organoids was treated with 4 μM Perhexiline maleate (as this was an effective dose in the curves for all four organoids) for 48 hours; KC, KPC, KSC and KPSC organoids showed obvious cell death, while the Perhexiline maleate treated WT organoids grew normally (Figure 3A). To determine whether some organoids develop drug resistance, we subjected KPSC organoids to 4 μM Perhexiline maleate treatment for 48 hours, followed by a switch to Perhexiline maleate-free medium for an additional 48 hours. At 96 hours, all organoids were dead (Figure S4A). In addition, we treated the KPSC organoids for 96 hours uninterruptedly. All the organoids were found to be nonviable at 96 hours (Figure S4B). Therefore, these organoids do not develop drug resistance under the current culture conditions. Immunohistochemistry confirmed a significant reduction of Ki67+ cells in the treated KC, KPC, KSC and KPSC organoids, but not WT organoids (Figures 3B, 3C, Figure S4C). In addition, Perhexiline maleate treatment induced cell apoptosis in KC, KPC, KSC and KPSC organoids, but not WT, as indicated by cleaved caspase 3+ (CLC3) staining (Figures 3B, 3D, Figure S4C).
Figure 3. Perhexiline maleate inhibits cell proliferation and induces cell apoptosis in KC, KPC, KSC, KPSC organoids both in vitro and in vivo.
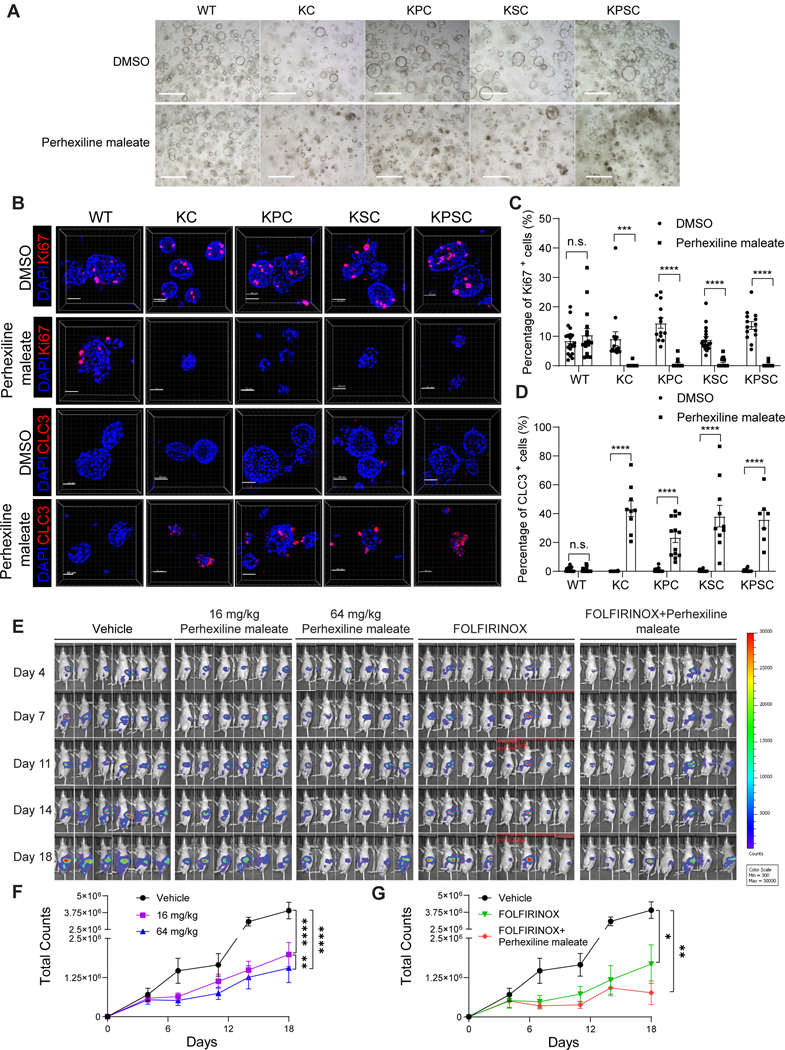
(A) Brightfield images of pancreatic organoids following treatment with 4 μM Perhexiline maleate or DMSO for 48 hours. Scale bar =500 μm.
(B) Representative whole mount immunostaining images of pancreatic organoids following treatment with 4 μM Perhexiline maleate or DMSO for 48 hours. Scale bar =50 μm. Nuclei were stained by DAPI. CLC3: cleaved caspase 3.
(C and D) Quantification results of percentage of Ki67+ or CLC3+ cells in pancreatic organoids after Perhexiline maleate or DMSO treatment. Data are presented as mean ± SEM, n = 4 biological replicates.
(E) Representative luminescence images of mice orthotopically transplanted with KPSC organoids treated with vehicle, high (64 mg/kg), low (16 mg/kg) doses of Perhexiline maleate, FOLFIRINOX or 64 mg/kg Perhexiline maleate plus FOLFIRINOX.
(F and G) The quantification of the total counts of luminescence signals of (F) Perhexiline maleate or vehicle treated mice and (G) FOLFIRINOX or Perhexiline maleate +FOLFIRINOX or vehicle treated mice. Data are presented as mean± SEM. N=6 mice. For panels F and G, the same vehicle treated group was used for the quantification and statistics.
The P values were calculated by unpaired two-tailed Student’s t test. For tumor growth curve, the P values were calculated by two-way ANOVA with mix model. *P < 0.05; **P < 0.01; ***P < 0.001 and ****P < 0.0001.
See also Figures S4–S5.
To evaluate Perhexiline maleate activity in vivo, KPSC organoids were transplanted subcutaneously in nude mice. After transplantation, the mice were treated with 16 mg/kg Perhexiline maleate via intraperitoneal (IP) injection every other day for 4 weeks (Figure S5A). The growth of KPSC xenografts in Perhexiline maleate-treated mice was significantly impaired compared to vehicle treated mice (Figure S5B), and this was reflected by decreased tumor volume and weight (Figures S5C, S5D). The weight of mice treated with Perhexiline maleate or vehicle was not significantly different (Figure S5E). Immunofluorescence staining confirmed the relative decreased percentage of Ki67+ cells and increased percentage of TUNEL+ apoptotic cells in the tumor xenografts of Perhexiline maleate treated mice (Figures S5F–S5H).
Next, orthotopic transplantation models were used to further validate the in vivo activity of Perhexiline maleate. To determine the appropriate dosage of Perhexiline maleate for the orthotopic transplantation model, we conducted a preliminary pharmacokinetics (PK) study. The mice transplanted with KPSC organoids were treated with 400 mg/kg by oral gavage administration, a dose previously used in other studies58, or 16 mg/kg, 32 mg/kg, 64 mg/kg, 128 mg/kg by IP administration. Tumor samples were collected at 1 hour post-drug administration, the peak of plasma drug concentration based on previous studies59. The drug concentration in the xenografts with 400 mg/kg via oral gavage administration was comparable to that achieved in tumor with 64 mg/kg via IP administration (Figure S5I). Thus, we selected two doses of 64 mg/kg and 16 mg/kg via IP administration for Perhexiline maleate in the orthotopic transplantation model. Both the high (64 mg/kg) and low (16 mg/kg) doses of Perhexiline maleate blocked tumor growth (Figure 3E). High dose Perhexiline maleate exhibited stronger inhibitory activity than low dose Perhexiline maleate (Figures 3E, 3F). Next, we tested the combination therapy effect of Perhexiline maleate with FOLFIRINOX, a combination treatment used to treat pancreatic cancer. The combination treatment showed higher inhibitory efficiency than either Perhexiline maleate or FOLFIRINOX single treatment group (Figures 3E, 3G). In terms of tumor growth dependency, we treated the mice orthotopically transplanted with KPSC organoids with Perhexiline maleate from day 4 to day 11 as an early treatment group and day 15–25 as a late treatment group. In the early treatment group, Perhexiline maleate strongly inhibited tumor growth. After we removed Perhexiline maleate at day 11, the tumors continue to grow, but the tumor burdens in mice that received early treatment with Perhexiline maleate were much lower than those in the control group (Figures S5J, S5L). In the late treatment group, robust tumor formation was detected in all mice on day 15 post-transplantation. Perhexiline maleate treatment initiated on day 15 post-transplantation still significantly inhibited tumor growth (Figures S5K, S5M). We euthanized the mice at day 28 and analyzed the metastatic tumors in livers and lungs of Perhexiline maleate or vehicle treated mice carrying KPSC xenografts. Fewer metastatic tumors were detected in Perhexiline maleate treatment group (1/5) than control group (4/5) (Figure S5N). Hematoxylin and eosin staining of heart, lung and liver did not reveal significant toxicity following Perhexiline maleate treatment (Figure S5O). Additionally, Perhexiline maleate treatment did not affect Gata6 expression (Figure S5P). In summary, Perhexiline maleate blocks cell growth and induces apoptosis of pancreatic cancer organoids and tumors carrying a KrasG12D mutation both in vitro and in vivo.
Perhexiline maleate inhibits the growth of human PDAC organoids.
The anti-tumor effects of Perhexiline maleate were also tested using primary human PDAC organoids, WCM744 and WCM773, that were collected from metastatic tumors of two PDAC patients, with histologic origins of abdominal ascites fluid and liver, respectively. Both WCM744 and WCM773 showed typical cancer organoid morphology (Figure 4A and Table S1). Perhexiline maleate reduced viability of WCM744 (IC50=2.88 μM) and WCM773 (IC50=3.14 μM) in a dose dependent manner (Figure 4B), with growth inhibition seen in bright field images (Figure 4C). Perhexiline maleate significantly decreased the percentage of Ki67+ cells and increased the percentage of CLC3+ cells in WCM744 and WCM773 organoids (Figures 4D–4F). The Sanger sequencing data indicated that both WCM744 and WCM773 PDAC organoids carry KRASG12V mutations (Figure S6A). To assess the activity of Perhexiline maleate on human PDAC organoids from diverse genetic backgrounds, we introduced two WCM2326 and WCM2171 PDAC organoids, which carry KRASG12D mutations (Figure S6A). The dose-response curves demonstrated that Perhexiline maleate exhibits similar inhibitory activities on PDAC organoids harboring KRASG12V or KRASG12D mutations (Figures 4B and 4G). Subsequently, we explored the impact of Perhexiline maleate on colon cancer organoids with different KRAS statuses, including KRASWT (WCM392), KRASG12D (WCM1403) and KRASG12C (WCM1050) (Figures 4H, S6B and Table S1). Similarly, we assessed its effects on lung cancer organoids carrying KRASG12C (WCM1712), KRASG12D (WCM2332) and KRASG12V (WCM2363) mutations (Figures 4I, S6C and Table S1). Perhexiline maleate consistently demonstrated inhibitory effects across multiple cancer organoids with varying KRAS mutations. Furthermore, Perhexiline maleate exhibited a lower IC50 on KRASG12D and KRASG12C cancer organoids compared to KRASWT organoids (Figure 4H). These results suggest that Perhexiline maleate is note only effective against diverse KRAS mutations, but also indicate its KRASmut-specific activity. To eliminate the potential influence of non-standard components in the culture medium on the activity of Perhexiline maleate, we cultured PDAC organoids using a basal medium and tested 5 μM and 10 μM Perhexiline maleate. Perhexiline maleate continued to exhibit dose-dependent inhibitory activity (Figure S6D). Thus, the additional non-standard components do not affect the activity of Perhexiline maleate.
Figure 4: Perhexiline maleate inhibits cell growth and induces cell apoptosis of human PDAC organoids.

(A) Brightfield images of human PDAC organoids WCM744 and WCM773. Scale bar =500 μm.
(B) Inhibitory curve of Perhexiline maleate on human PDAC organoids WCM744 and WCM773. Data are presented as mean ± SEM. N = 3 biological replicates.
(C) Brightfield images following treatment with 4 μM Perhexiline maleate or DMSO on human PDAC organoids WCM744 and WCM773 for 72 hours. Scale bar =500 μm.
(D) Representative whole mount immunostaining images of human PDAC organoids WCM744 and WCM773 treated with 10 μM Perhexiline maleate or DMSO for 72 hours. Scale bar =50 μm. Nuclei were stained by DAPI.
(E and F) Quantification of the percentage of Ki67+ or CLC3+ cells in pancreatic organoids treated with Perhexiline maleate or DMSO. Data are presented as mean ± SEM. N = 6 biological replicates.
(G) Inhibitory curve of Perhexiline maleate on human PDAC organoids WCM2171 and WCM2363. Data are presented as mean ± SEM. N = 3 biological replicates.
(H) Dose curve of Perhexiline maleate on human colon cancer organoids WCM1403, WCM1050, and WCM392. Data are presented as mean ± SEM. N = 3 biological replicates.
(I) Dose curve of Perhexiline maleate on human lung cancer organoids WCM1712, WCM2332 and WCM2363. Data are presented as mean ± SEM. N = 3 biological replicates.
The P values were calculated by unpaired two-tailed Mann Whitney test. *P < 0.05; **P < 0.01; ***P < 0.001 and ****P < 0.0001.
Perhexiline maleate induces tumor regression through attenuating the KRASG12D-mediating dysregulation of the cholesterol biosynthesis pathway in PDAC.
We next sought to examine the tumor inhibition mechanism of action for Perhexiline maleate. Since the cancer organoids are differentially sensitive to Perhexiline maleate, we first carried out differential expression (DE) analysis to generate the DE gene list of KC, KPC, KSC, and KPSC versus WT, respectively. Overall, 588 up-regulated genes were shared among the four compared groups (Figure 5A and Table S2). Over-representation analysis (ORA) was performed using these 588 differentially regulated genes. The cholesterol homeostasis and mTORC1 signaling pathways were enriched (Figure 5B). Previous studies showed that mutant KRAS enables its downstream PI3K/AKT/mTOR to activate the cholesterol biosynthesis pathway and promote oncogenic signaling and tumor progression60–62. The cluster of genes related to cholesterol biosynthesis forms a KRAS-regulated network linked to transformation by oncogenic KRAS63,64. Therefore, we focused our attention on the cholesterol biosynthesis pathway as a potential downstream target of oncogenic KRAS. Anabolism of cholesterol constitutes a series of enzyme regulated biosynthesis steps. Dot plots showed that a group of genes encoding the enzymes involved in the cholesterol biosynthesis pathway are upregulated in each of the pancreatic cancer organoids carrying the KRAS mutation (Figure 5C). qRT-PCR analysis confirmed the upregulation of the cholesterol synthesis pathway genes in KC, KPC, KSC, and KPSC cells in 2D culture (Figure S7B). To assess the activity of the cholesterol biosynthesis pathway in patient samples, we examined the expression of genes related to cholesterol biosynthesis in KRASmut and KRASWT PDAC, colon adenocarcinoma (COAD), and lung adenocarcinoma (LUAD) cohorts within the TCGA database. In PDAC samples, we observed a significant upregulation of the genes related to the cholesterol biosynthesis pathway, including HMGCS1, MVD, FDFT1, SQLE, MSMO1, DHCR24, DHCR7, CYP51a1, NSDHL, GGPS1, LDLR, and DHCR7, in KRASG12D/V samples compared to KRASWT samples (Figure S6E). Additionally, in COAD samples, genes such as IDI1, IDI2, LDLR, MVK, and FDFT1, were significantly upregulated in KRASMUT samples compared to KRASWT samples (Figure S6F). Finally, in LUAD samples, genes like LDLR, IDI2, GGPS1 showed increased expression levels in KRASMUT samples compared to KRASWT samples (Figure S6G). Notably, SREBF1, a regulator of genes involved in lipid and cholesterol production, and its downstream target FASN, were also upregulated in KRASMUT samples compared to KRASWT LUAD samples (Figure S6H). Taken together, these finding suggest that the cholesterol biosynthesis pathway is upregulated in KRASMUT PDAC, COAD, and LUAD samples.
Figure 5. Perhexiline maleate induces tumor regression through attenuating the cholesterol biosynthesis pathway caused by KRAS mutant in PDAC.

(A) Venn plot shows overlapped upregulated genes from KC, KPC, KSC, and KPSC organoids compared with WT organoids. 588 genes were selected for the following (Over-Representation Analysis (ORA) or Gene Set Enrichment Analysis (GSEA).
(B) ORA results indicated that cholesterol biosynthesis pathway was the top enriched pathway.
(C) Dot plots describing the relative expression levels for genes of the cholesterol biosynthesis pathway in WT, KC, KPC, KSC, and KPSC organoids.
(D-H) GSEA of Perhexiline maleate or control treated WT (D), KC (E), KPC (F), KSC (G) and KPSC (H) organoids. P: Perhexiline maleate; C: control.
(I-L) Dot plots comparing the relative expression levels for genes of the cholesterol biosynthesis pathway of Perhexiline maleate or DMSO treated KC (I), KPC (J), KSC (K) and KPSC (L) organoids. P: Perhexiline maleate; C: control.
See also Figures S6–S7.
Tp53R172H mutation is a hotspot mutation in human tumors and is associated with Li-Fraumeni Syndrome65,66. This particular hot spot mutation in the p53 DNA-binding domain results in a protein that is transcriptionally inactive and has both dominant negative and gain-of-function67 activity. Tp53R172H/+ mice developed allele-specific tumor spectra distinct from Tp53+/− mice. This mutation has enhanced oncogenic potential beyond the simple loss of Tp53 function68. Consistent with Tp53R172H/+ mice, GSEA found that p53 pathway signaling was downregulated in KPC organoids.
To probe the impact of Perhexiline maleate on these profiles, we repeated the multiplexing scRNA-seq strategy described above, following treatment of the WT and cancer organoids with Perhexiline maleate at 4 μM for 48 hours, and analyzed the data comparing Perhexiline maleate and control treated groups. 10 sample barcode information was projected with UMAP, which shows that sample barcodes successfully demultiplexed both treated and untreated samples (Figure S7A). To identify the Perhexiline maleate mechanism of action, a DE list of genes for Perhexiline maleate (P) and control (C) treated samples (WT-P versus WT-C; KC-P versus KC-C; KPC-P versus KPC-C; KSC-P versus KSC-C; and KPSC-P versus KPSC-C) were used for GSEA. Interestingly, the cholesterol biosynthesis and metabolism pathways are downregulated in Perhexiline maleate treated KC, KPC, KSC, and KPSC organoids, but not for the WT group (Figures 5D–5H). Consistent with this analysis, the genes encoding enzymes involved in the cholesterol biosynthesis pathway are downregulated in Perhexiline maleate treated KC, KPC, KSC, and KPSC organoids (Figures 5I–5L). Together, the analysis suggests that Perhexiline maleate might block growth of KRAS mutant organoids by inhibiting upregulation of the cholesterol biosynthesis pathway caused by the KRAS mutation.
Perhexiline maleate reverses the cholesterol biosynthesis pathway by down-regulating the expression level of SREBP2.
Sterol-regulatory-element-binding protein 2 (SREBP2) encoded by the Srebf2 gene is a transcription factor that regulates cholesterol homeostasis by controlling enzymes involved in cholesterol synthesis and uptake69. SREBP2 enhances expression of cholesterol biosynthetic genes, providing a growth advantage to cancer cells, acting as a major driver of cancers including glioblastoma, colon cancer, and hepatocellular carcinoma70–73. Therefore, we examined whether Perhexiline maleate regulates expression of the genes involved in cholesterol biosynthesis by modulating SREBP2-mediated cholesterol biosynthesis. Indeed, the expression level of Srebf2 is relatively high in KRAS mutant organoids compared to WT organoids, associated with the upregulation of cholesterol uptake related target genes Ldlr (Figures 6A–6B). Based on qRT-PCR results, Perhexiline maleate suppresses the transcript levels of Srebf2 in the KPSC organoids (P<0.001), associated with inhibition of cholesterol synthesis and uptake related genes, including Ldlr, Hmgcs1, Hmgcr, Mvd, Fdps, among others (Figures 6C–6E, Table S3). Cholesterol abundance levels are higher in KC and KPC organoids than WT organoids (Figure 6F). The cholesterol abundance of KC and KPC organoids is not significantly different, suggesting that KRAS mutation is the primary driver of the activation of the cholesterol biosynthesis pathway in KC and KPC organoids. In addition, we added cholesterol to the medium. Cholesterol supplementation partially blocked the anti-tumor activity of Perhexiline maleate (Figure 6G).
Figure 6. Perhexiline maleate downregulates genes of the cholesterol biosynthesis pathway through decreasing SREBP2 expression levels.

(A-B) Relative expression levels for the cholesterol biosynthesis pathway regulator Srebf2 (A) and its downstream targets Ldlr (B)in WT and KC, KPC, KSC and KPSC organoids.
(C and D) qRT-PCR analysis for Srebf2 and Ldlr expression in KPSC organoids treated with 4 μM Perhexiline maleate or DMSO control. Data are presented as mean ± SEM. N = 3 biological replicates.
(E) Heatmap showing qRT-PCR results for the relative expression levels of the genes in the cholesterol biosynthesis pathway KPSC organoids treated with 4 μM Perhexiline maleate or DMSO control. N = 3 biological replicates.
(F) Cholesterol abundance for WT, KC and KPC organoids treated with 4 μM Perhexiline maleate or DMSO control. N = 4 biological replicates.
(G) Cell viability of KPSC organoids treated with DMSO, Perhexiline maleate or Perhexiline maleate+ cholesterol. N = 6 biological replicates.
(H) qRT-PCR analysis for the relative expression levels of the cholesterol biosynthesis pathway genes in KPSC organoids treated with 10 μM Betulin or control for 72 hours. Data are presented as mean ± SEM. N = 3 biological replicates.
(I) Efficacy curve of Betulin on KPSC organoids. Data are presented as mean ± SEM. N = 3 biological replicates.
(J) A schematic for the organoid xenograft model and in vivo drug treatment with betulinic acid. The mice transplanted with KPSC organoids were treated with 40mg/kg betulinic acid or vehicle control every other day by oral administration, for 4 weeks.
(K) Tumor growth curve of mice harboring KPSC xenografts treated with betulinic acid or vehicle control. Data are presented as mean ± SEM. N = 5 mice.
(L and M) Image (L) and tumor weight (M) of mice harboring KPSC xenografts treated with betulinic acid or vehicle control. Data are presented as mean ± SEM. N = 5 mice.
For Figure 6C, 6D, 6M, the P values were calculated by unpaired two-tailed Student’s t test. For Figure 6A, 6B, 6F, 6G, the P values were calculated by One-Way ANOVA firstly, and multiple comparisons test for further analysis. For Figure 6K, the P values were calculated by two-way ANOVA. * P < 0.05; **P < 0.01; ***P < 0.001 and ****P < 0.0001.
See also Figure S7.
Next, we performed chemical perturbation to examine the role of SREBP2 in KRAS mutation-driven tumor growth. The precursor of SREBP2 is synthesized as an endoplasmic reticulum (ER) membrane-bound protein. Its activation requires the SCAP-SREBP2 complex to undergo an ER-to-Golgi translocation and the cleavage of precursor to release the mature form of SREBP2 (mSREBP2). mSREBP2 can then translocate into the nucleus to activate cholesterol metabolism related genes (Figure S7C). Betulin is a natural product that can bind to SCAP and block the maturation of SREBP2 74. Betulin treatment significantly decreased the transcript levels of cholesterol metabolism related genes in KPSC cancer organoids (Figure 6H), and inhibited cell viability in a dose dependent manner (IC50=10.3 μM) (Figure 6I). Furthermore, when xenografted mice carrying KPSC organoids were treated with 40 mg/kg betulinic acid administrated via oral gavage every other day for 4 weeks (Figure 6J), tumor growth rate was significantly decreased (Figure 6K). At day 28, the tumor weight for mice treated with betulinic acid is significantly lower than that for vehicle treated mice (Figures 6L, 6M). Betulinic acid shows no obvious toxic side effects, since the body weight of betulinic acid-treated mice was not significantly different from vehicle treated mice (Figure S7D). The hematoxylin and eosin staining of heart, lung, and liver did not reveal significant toxicity after betulinic acid treatment (Figure S7E).
Finally, to confirm the dependence of Srebf2 in PDAC growth, two small hairpin RNAs (shRNAs) targeting Srebf2 were used to deplete expression levels in KPSC organoids. The knockdown efficiency was confirmed by qRT-PCR (P<0.0001) and western blotting assays (Figures 7A, S7F, Table S3 and S4). Consistent with results observed following Betulin treatment, there was a significant downregulation of cholesterol synthesis-associated genes in KPSC organoids expressing each shSrebf2 compared to those expressing a control scrambled shRNA (Figure 7B), and the cell viabilities were significantly reduced (Figure 7C). The cholesterol levels were consistently decreased in KPSC organoids carrying shSrebf2 (Figure 7D). Furthermore, the addition of cholesterol fully rescued the decreased viabilities of KPSC organoids expressing shSrebf2 (Figure 7E). Subsequently, KPSC organoids carrying scrambled shRNA or shSrebf2 were subcutaneously transplanted into nude mice, and tumor growth was monitored. Mice transplanted with KPSC organoids carrying shSrebf2 exhibited significantly slower tumor growth rates compared to those with KPSC organoids carrying scrambled shRNA (P<0.0001), as evidenced by reduced tumor weight (P<0.05) (Figures 7G–7H). To further validate the role of cholesterol in the growth of pancreatic cancer organoids, Simvastatin, a widely used statin in clinical practice, was used to perturb cholesterol synthesis by HMG-CoA reductase inhibition. Dose-response curves demonstrated that Simvastatin inhibited the growth of KC, KPC, KSC and KPSC organoids (KC, IC50=3.3 μM; KPC, IC50=1.6 μM; KSC, IC50=1.7 μM; KPSC, IC50=9.6 μM) (Figure S7G). Simultaneously, Simvastatin effectively reduced cholesterol abundance in KC and KPC organoids (Figure S7H). Finally, cholesterol supplementation was able to block the anti-tumor effect of Simvastatin (Figure S7I). Collectively, these data support a model in which oncogenic KRAS mutations activate SREBP2, leading to a reprogramming of cholesterol metabolism through increased biosynthesis and uptake. The accumulated cholesterol, in turn, promotes tumor growth by providing energy and resisting apoptosis. Perhexiline maleate, by reducing SREBP2 expression levels, reverses the metabolic reprogramming induced by oncogenic KRAS, and ultimately inhibits the growth of pancreatic organoids carrying KRAS mutations.
Figure 7. Genetic perturbation of Srebf2 blocks KPSC organoid growth both in vitro and in vivo.

(A) qRT-PCR analysis confirmed the knockdown efficiency of shRNAs in KPSC organoids carrying shSrebf2. Data are presented as mean ± SEM. N = 3 biological replicates.
(B) qRT-PCR analysis for the relative expression levels of genes encoding enzymes involved in the cholesterol biosynthesis pathway in KPSC organoids carrying shSrebf2 or scrambled shRNA. Data are presented as mean ± SEM. N = 3 biological replicates.
(C) Cell viability of KPSC organoids carrying shSrebf2 or scrambled shRNA.
(D) Cholesterol abundance of KPSC organoids carrying shSrebf2 or scrambled shRNA.
(E) Cell viability of KPSC organoids carrying shSrebf2, shSrebf2 + Cholesterol or scrambled shRNA.
(G) Tumor growth curve of mice harboring KPSC organoids carrying shSrebf2 or scrambled shRNA. Data are presented as mean ± SEM. N = 4 mice.
(F and H) Image (F) and tumor weight (H) of mice harboring KPSC organoids carrying shSrebf2 or scrambled shRNA. Data are presented as mean ± SEM. N = 4 mice.
The P values were calculated by One-Way ANOVA firstly, and multiple comparisons test for further analysis. For Figure7G, Two-Way ANOVA were performed. *P < 0.05; **P < 0.01; ***P < 0.001 and ****P < 0.0001.
See also Figure S7.
Discussion
Genetic studies have identified driver mutations of PDAC, including mutations of KRASG12D, TP53, SMAD4, and CDKN2A75. Progress has been made developing drugs for “undruggable” KRAS mutations, most of which focused on G12C, which are common in lung cancer, but not PDAC and colon cancer. Here, we describe an isogenic primary pancreatic organoid-based screen to identify drugs that target KRAS mutations. In this culture system, both normal and cancer pancreatic organoids of defined genotypes can be passaged, cryopreserved, and expanded for large scale chemical screens. Compared to primary human cancer organoids, typically carrying many passenger mutations and even large genomic alterations, this isogenic platform allows the screening for drugs targeting specific mutations for precision medicine.
Using this high throughput screening platform, we identified Perhexiline maleate that blocks cell growth and induces cell death in organoids with various defined genotypes, but all carrying a KRAS mutation, both in vitro and in vivo. Perhexiline maleate also showed anti-tumor activity against human cancer organoids. Perhexiline maleate was developed and marketed in the 1960–70s, as an antianginal agent, and reported to be an inhibitor of carnitine palmitoyltransferase 1 (CPT-1)76. However, recent studies have called into question the primary target and mechanism of action. In silico and genetic approaches identified FYN proto-oncogene (FYN) as a probable target, and Perhexiline maleate showed FYN-dependent antitumor activity in glioblastoma77. In a drug-repurposing screen Perhexiline maleate was found to reversibly inhibit mTORC1 and stimulate autophagy78. Consistent with this observation, NCT-503 in combination with Perhexiline maleate, but not the specific CPT-1 inhibitor etomoxir, had cytostatic or cytotoxic effects on osteosarcoma through inhibition of mTORC179. However, standard binding assays were not performed in these studies to definitively establish a direct interaction between Perhexiline maleate and FYN or mTORC1, so that the direct target of Perhexiline maleate as an anti-tumor agent remains uncertain.
Multiplex scRNA-seq analysis of the organoid platform showed that transcript profiles are significantly different among WT, KC, KPC, KSC and KPSC pancreatic organoids. The GSEA results indicate that oncogenic KRAS enhances cholesterol biosynthesis which facilitates tumor growth and protects from apoptosis. Importantly, expression levels for the cholesterol biosynthesis regulator SREBP2 are significantly upregulated among all organoids carrying the KRAS mutation, while Perhexiline maleate causes downregulation of SREBP2 transcription to reverse the KRAS-dependent cholesterol de novo synthesis. Previous studies have shown that SREBP2 can be activated by mTORC1 60,80, so it is possible that Perhexiline maleate down-regulates SREBP2 through inhibition of mTORC1. On the other hand, FYN phosphorylates the RNA-binding protein, quaking, KH domain containing RNA binding (QKI) 81, which could modulate the activity of SREBP2mediated cholesterol biosynthesis82.The data suggest that Perhexiline maleate targets these or other pathways upstream of SREBP2 in order to inhibit oncogenic KRAS, by limiting metabolic reprogramming.
Indeed, targeting metabolic reprogramming has emerged recently as a promising therapeutic approach to treat cancer. SREBP2 and its downstream target genes encoding enzymes in cholesterol biosynthesis participate in the progression of various cancers, including prostate, breast, lung, and hepatocellular cancer83. Preclinical and clinical research demonstrated that fatostatin and statins targeting SREBP2 and HMGCR, respectively, have been used for the treatment of different cancers84. Here, we identified a previously unknown role for SREBP2 in pancreatic cancer. Both chemical and genetic perturbation of SREBP2 could inhibit PDAC organoid growth in vitro and in vivo, suggesting that SREBP2-mediated metabolic reprogramming is a potential target for drug development against mutant KRAS.
We carried out an extensive literature search on the relationship between the cholesterol/cholesterol synthesis pathway and the prognosis of PDAC patient with KRAS mutation. Guillaumond et al reported that high Low-Density Lipoprotein Receptor (LDLR) expression was significantly associated with an increased risk of primary tumor and metastasis recurrence (shown by a reduction of disease-free survival, P = 0.008)63. Consistently, evidence from meta-analysis and population studies show that cholesterol levels are statistically significant positively correlated with pancreatic cancer mortality in the US and Spain85–87. Furthermore, Huang et al, reported that statin usage was associated with lower mortality risk in patients with pancreatic cancer88. A study from the Chan School of Public Health suggested that high total cholesterol in the recent past may indicate a lower pancreatic cancer incidence, while a recent decrease in total cholesterol may suggest an elevated incidence of pancreatic cancer. Large scale studies are needed to further explore the association between cholesterol metabolism and PDAC patients with KRAS mutations.
In summary, we performed an isogenic pancreatic cancer organoid-based high throughput chemical screen and identified Perhexiline maleate that blocks growth of both mouse and human pancreatic cancer organoids carrying KRAS mutations. Through mechanistic studies, we found the SREBP2/cholesterol biosynthesis pathway as a potential target for drug development for precision medicine of PDAC.
Limitations of the Study.
In this study, we developed an isogenic pancreatic cancer organoid platform for high throughput screening and used it to identify Perhexiline maleate for targeted therapy against Kras mutations. For practical considerations, the primary screening was performed in 2D culture and all follow-up studies were performed in 3D culture. Primary screening using 3D organoids might identify additional drug candidates. In addition, although we performed extensive studies to validate the activity of Perhexiline maleate using orthotopic transplantation models, multiple doses, combination treatment, and early/late treatments, we were unable to validate the activity of Perhexiline maleate’s on KPC mice or mice transplanted with human PDAC organoids. Additional work is needed to further validate the in vivo anti-tumor activity of Perhexiline maleate. Finally, Perhexiline maleate showed partial inhibitory activities in vivo, without completely blocking Krasmut_ driven tumor growth, which might be due in part to its low solubility for in vivo assays. Additional efforts are needed to develop more potent improved in vivo bioavailability drug candidates.
STAR*METHODS
Lead contact
Further information and requests for resources and reagents should be directed to and will be fulfilled by the Lead Contact: Shuibing Chen shc2034@med.cornell.edu
Materials availability
KSC and KPSC organoids can be available with a fully executed MTA.
Data and code availability
scRNA-seq data is available from the GEO repository database, accession number GSE207352.
The code for scRNA-seq analysis is available at https://https://github.com/shuibingchen/PDAC_KRAS DOI:10.5281/zenodo.10141439
Any additional information required to reanalyze the data reported in this paper is available from the lead contact upon request.
EXPERIMENTAL MODEL AND SUBJECT DETAILS
Mouse models
Xenograft studies have been approved by the Institutional Animal Care and Use Committee (IACUC) at Weill Cornell Medicine (Protocol #2011–0024). NU/NU nude mice (immunocompromised) model was purchased from Charles River Laboratory. KP and KPC mice work has been approved by IACUC at Memorial Sloan Kettering Cancer Center (Protocol #14–03-005). KC and KPC mice were gifts from Dr. Dafna Bar-Sagi laboratory. Mice were maintained in Specific Pathogen-free animal research facilities with a standard dark/light cycle, temperature (22 +/− 2°C) and humidity (55 +/− 5%). For xenograft studies, male nude mice (~6–8 weeks old) were randomly divided into experimental groups. Surgical procedures were performed under anesthesia using Ketamine/Xylazine (90–120 mg/kg ketamine/body weight; 10 mg/kg xylazine/body weight). Mice were placed on a reactivated gel heating pad (~37°C) during the surgery/recovery period to aid in the rapid recovery of mice following anesthesia. Post surgery animals were given a dose of 5 mg/kg carprofen and visually inspected for signs of distress and discomfort. Wound clips were removed 14 days after surgery. Mice with tumor xenografts were treated with drugs or vehicle according to the experiment design. Mice were euthanized 28 days after drug administration with CO2 overdose.
The Culture conditions for in vitro systems.
Murine pancreatic organoid generation and culture.
The KC (PDX1-Cre; KRASG12D) rarely form PDAC. KC organoids were derived from 10 months old mice (Pdx1-Cre; LSL-KRASG12D). We initially tried to hand pick pancreatic ducts of these mice after collagenase digestion as reported by the Tuveson lab, but the yield is pretty low and technically challenging. At later time, we induced acute pancreatitis (2 days of 6x hourly injection of Cerulein) to facilitate the duct enrichment and isolation, followed by hand picking the pancreatic duct after collagenase/dispase digestion. KPC (PDX1-Cre; KRASG12D; TP53R172H) parental pancreatic organoids were derived from tumor-bearing PDX1-Cre; KRASG12D; TP53R172H mice with visible PDAC morphology of 8 months old KPC mice. The KSC (KRASG12D; SMAD4−/−) and KPSC (KRASG12D; TP53R172H; SMAD4−/−) lines were generated using CRISPR-cas9 with sgRNAs targeting exon 2 of SMAD4 gene in KC and KPC organoids. The WT parental pancreatic organoids were generated from fetal mice around E18.5. Detailed procedures to isolate and culture pancreatic organoids have been described previously5. In brief, tumors were minced and digested with 0.012% collagenase XI (Sigma) and 0.012% dispase (Gibco) in DMEM media containing 1% FBS (Gibco), and were seeded in growth factor-reduced (GFR) Matrigel (BD). For the WT organoids, normal fetal pancreas tissue was minced and digested with ACCUMAX (Stem Cell Technology) in a 37°C water bath for 30 min, followed by seeding in GFR Matrigel.
The organoids were cultured in mouse complete culture medium, which includes Advanced DMEM/F12 medium supplemented with HEPES (1x, Invitrogen), Glutamax (1x, Invitrogen), penicillin/streptomycin (1x, Invitrogen), B27 (1x, Invitrogen), N-acetyl-L-cysteine (1.25 mM, Sigma), 10% R-Spondin1-Conditioned Medium, mouse Noggin recombinant protein (mNoggin) (0.1 μg/mL, Peprotech), mouse epidermal growth factor (EGF, 50 ng/ml, Peprotech), human Gastrin (10 nM, Sigma), fibroblast growth factor 10 (FGF10, 100 ng/ml, Prepotech), nicotinamide (10 mM, Sigma), A83–01 (0.5 μM, Tocris) and Y-27632 (10 μM). KSC and KPSC organoids can be cultured in mouse complete culture medium without mNoggin and A83–01, because of loss of a functional TGF-β signaling pathway. Organoids were passaged about every 5 days when the cultures reached complete confluency. Organoids were dissociated into single cells or small clusters by enzymatic dissociation with 0.05% Trypsin-EDTA (Thermo Fisher) for 9 minutes in a 37° water bath. The basial medium, Advanced DMEM/F12 medium supplemented with HEPES, Glutamax and penicillin/streptomycin, was used to neutralize trypsin. The cells were pelleted and resuspended in GFR Matrigel with a 1:6–1:8 passage ratio to re-seed. For Smad4 knockout, sgRNAs of mouse SMAD4 were synthesized from IDT and subcloned into the lentiCRISPRv2 puro vector (Addgene). Briefly, the lentiCRISPRv2 vector was digested and linearized by FastDigest Esp3I (Thermo Fisher). The SMAD4 sgRNA oligos were annealed and cloned into the linearized lentiCRISPRv2 vector. T4 DNA ligase was utilized for the ligation of the linearized vectors and the annealed sgRNA oligos were at 25°C overnight. Ligation reactions were transformed into Stbl3 bacteria. After confirmation by Sanger sequencing, the efficacy of gene editing was confirmed by surveyor assay on HEK293T. The sequences of sgRNAs are shown in Table S4. For lentivirus production, HEK293T cells were co-transfected by calcium phosphate with 30 μg pLKO.1 shRNA plasmid, 22.5 μg psPAX2 packaging plasmid, 7.5 μg pMD2.G envelope plasmid in a 15 cm dish. On the second day, the supernatant was replaced with fresh medium. The supernatant was collected at 48 and 72 hours after transfection. The viral particles were concentrated with Ultra-15 Centrifugal Filters (Millipore). For generation of clonal organoid lines, KC and KPC pancreas organoids were dissociated into single cells and seeded into 6 well plates. 10 μL concentrated viral particles and 8 μg/mL polybrene were added into 1m fresh medium. After 30 minutes incubation, the organoid cells were spin down infection with 2300 g for 1 hour. After 24 hours lentiviral infection, cells were replated into a 96-well plate precoated by 10% Matrigel in 100 μL organoid culture media with a 1–2 cells/100 μL. Next day, organoids were selected by adding 1 μg/mL puromycin in culture medium 48 hours. After one week, the single organoids were dissociated and replated for clonal expansion and genotyping by Sanger sequencing.
Authentication of Mouse Pancreatic Organoids.
Whole exome sequencing was used to validate the mutations in isogenic mouse pancreatic organoids.
Patient PDAC organoids generation and culture.
Patient-derived fresh tissue samples were collected with written informed patient consent with the approval of the Institutional Review Board (IRB #1305013903) at Weill Cornell Medicine (Table S1). Organoid lines were developed as per89 with modifications. Fresh tissue samples were washed three times with transport media [CO2 Independent Medium (Gibco) with 1x Glutamax (Gibco), 100 U/mL penicillin, 100 μg/mL streptomycin (Gibco), 100 μg/mL Primocin (InvivoGen), and 10 μmol/L Rock inhibitor Y-27632 (Selleck Chemical Inc.)] and placed in a sterile 3-cm petri dish (Falcon) for mechanical dissection into smaller pieces (2mm diameter) prior to enzymatic digestion. Enzymatic digestion was done with collagenase media [DMEM (Gibco), 100 U/mL penicillin, 100 μg/mL streptomycin (Gibco), 250 U/mL collagenase IV (Life Technologies), 100μg/mL Primocin (InvivoGen), and 10μmol/L Rock inhibitor Y-27632 (Selleck Chemical Inc.) in a volume of at least 20 times the tissue volume and incubated on a shaker at 200 rpm at 37°C until the digestion solution turned cloudy, typically 30–45 minutes. The suspension was centrifuged at 300XG for 3 minutes and the cell pellet was washed once with washing media [Advanced DMEM (Gibco), 100 U/mL penicillin, 100 ug/mL streptomycin (Gibco), 1x Glutamax (Invitrogen), and 1x Hepes (Invitrogen)]. The cells were resuspended in a small volume of tissue-type specific culture media, which includes basal media, [Advanced DMEM (Gibco) with glutamax (1×, Invitrogen), HEPES (Invitrogen), B27 (Gibco), 100 U/mL penicillin, 100 μg/mL streptomycin (Gibco), 100 μg/mL Primocin (InvivoGen), and components, 10% noggin conditioned media, 10 mM Nicotinamide (Sigma-Aldrich), 1.25 mM N-acetylcysteine (Sigma-Aldrich), 1ng/mL Recombinant Human FGF-b (Peprotech), 20ng/mL Recombinant Human FGF-10 (Peprotech), 1μM PGE2 (R&D Systems), 10 μM SB202190 (Sigma-Aldrich), 50ng/mL Mouse Recombinant EGF (Invitrogen), 10 μM Y-27632 (Selleck Chemicals), 10ng/mL Heregulin Beta-1 (Peprotech), and 500nM A-83–01 (Tocris), 10mM [Leu15]-Gastrin I Human (Sigma-Aldrich)]. Up to ten 100 μL drops of Matrigel/cell suspension were distributed into a 6-well cell suspension culture plate (Gibco). The drops were allowed to polymerize for 30 min inside the incubator at 37°C and 5% CO2 and afterwards, 3-mL tumor type–specific primary culture media were added per well. Fresh culture media was replaced every 3 to 4 days. PDOs at approximately 300 to 500 μm were passaged using TrypLE Express (Gibco) for 10–12 minutes in the water bath at 37°C. Single cells and small cell clusters were replated according to the procedure described above. Monthly mycoplasma screening was performed using the PCR Mycoplasma Detection Kit (abm). Organoids were cryopreserved in Recovery Cell Culture Freezing Medium (Gibco) in liquid nitrogen. Organoid histopathology was verified by comparing sections from fixed, passage 5 organoid cell blocks to parent tumor sections using our developed cytology and histology platforms90. Briefly, PDOs were released from Matrigel droplets using cell recovery solution (Corning), suspended in a fibrin gel pellet, fixed with 4% paraformaldehyde in PBS (Thermo), and embedded in paraffin to create formalin-fixed paraffin-embedded (FFPE) blocks. Hematoxylin and eosin (H&E) stained sections of the FFPE blocks were verified as tumor cells and compared to H&E-stained sections from the corresponding tumors to verify matching cellular morphology by a WCM pathologist. Whole exome sequencing (WES) and/or Oncomine targeted sequencing was performed on organoid cell pellets from passage 5 and matching tumors to confirm identity and similar mutational profile. Single nucleotide variants found in tumor and organoid samples via WES or Oncomine were compared in order to verify concordance of driving mutations in matching samples. PDOs were passaged in Matrigel (Corning) every 1 to 4 weeks in tissue typespecific primary culture media.
METHOD DETAILS
Cell Lines and R-Spondin1-Conditioned Medium.
HEK293T cells were maintained in high glucose DMEM (Corning) with FBS (Gibco) and Penicillin/Streptomycin. The HA-R-Spondin1-Fc 293T Cells (Trevigen) were cultured in the same medium with additional final concentration 300 μg/mL Zeocin Selection Reagent in 175 cm2 flasks. Cells were incubated in a tissue culture incubator until reaching confluency, followed by passaging into 6 × 175 cm2 flasks. When the cells reach confluency again, 50 mL basal medium is added to each flask and cells are cultured for one week in the tissue culture incubator. After one week, the supernatant is collected, spun down and filtered with medium 0.2 μm sterile filters. The conditioned medium is aliquoted and stored at −20°C.
Constructs, lentivirus production and infection.
shRNA sequences against srebf2 were constructed into the lentivirus vector pLKO.1-blast (Addgene). The scrambled negative control was purchased from Addgene. The sequences of sgRNAs are shown in Table S3. For lentivirus production, HEK293T cells were co-transfected by calcium phosphate with 30 μg pLKO.1 shRNA plasmid, 22.5 μg psPAX2 packaging plasmid, 7.5 μg pMD2.G envelope plasmid in a 15 cm dish. On the second day, the supernatant was replaced with fresh medium. The supernatant was collected at 48 and 72 hours after transfection. The viral particles were concentrated with Ultra-15 Centrifugal Filters (Millipore).
Pancreas organoids were dissociated into single cells and seeded into 6 well plates. 10 μL concentrated viral particles and 8 μg/mL polybrene were added into 1m fresh medium. After 30 minutes incubation, the organoid cells were spin down infection with 2300 g for 1 hour. After 24 hours lentiviral infection, stable lines were selected by adding 1 μg/mL puromycin or 25 μg/mL blasticidin in culture medium 48 hours. When the cells were dead in non-infected control wells, selection was stopped and cells re-seeded into GFR.
Sanger sequencing based KRAS genotyping of mouse and human organoids.
Organoids were harvested and centrifuged at 4,000 rpm for 5 min at 4°C. Genomic DNA from freshly isolated tumor cells or organoids was extracted with DNEasy Blood & Tissue Kit (Qiagen) following the protocol for cultured cells. Each PCR reaction for KRAS genotyping was performed in a 20-μl mixture containing 1× AmpliTaq Gold 360 master mix (Thermo Fisher Scientific), 0.5 μM each primer, and 40 ng template DNA. The following primers were used for genotyping: KRAS G12/13 Forward: 5’- CTG GTG GAG TAT TTG ATA GTG −3’ KRAS G12/13 Reverse: 5’- CTG TAT CAA AGA ATG GTC CTG −3’. The PCR cycling conditions were 95°C for 5 min, followed by 20 cycles at 95°C for 30 s, 56°C for 30 s, and 72°C for 30 s, with a final extension step at 72°C for 5 min. PCR products were sequenced by Geneviz company.
High throughput chemical screening.
Primary screening
The pancreatic organoids were dissociated using Accutase (Innovative Cell Technologies) for 15–30 minutes in a 37°C incubator and replated into black with clear bottom 384-well plates at 2500 cells/ 50 μL medium/well. After overnight plating, compounds from libraries were added at 10 μM. The chemical library details are shown in Supplementary Figure S1B. DMSO treatment was used as a negative control. After 44 hours treatment, 1x alamarBlue cell viability assay reagent was added into each well and incubated for another 4 hours. Fluorescence was read at excitation 560 nm, emission 590 nm. To calculate percent difference in reduction between treated and control cells in 883 cytotoxicity/proliferation assays, the following formula was adopted:
Where: FI 590 = Fluorescent Intensity at 590nm emission (560nm excitation).
To select the first-round hits, the Z score was calculated with the formula shown below. The list of Z scores related to drug number was generated with Prism GraphPad. We set 888 Z scores more than 3 as the cutoff.
Secondary pancreatic cancer organoid proliferation and viability assays
For secondary screen and dose curve confirmation, the hits were tested upon 3D organoid culture system in a 96-well format. Briefly, organoids grown in 50 μL Matrigel domes in a 24-well plate were harvested as described for passaging and re-suspended at a concentration of 1000 cells/μL in ice-cold 10% GFR Matrigel diluted with complete culture medium. 50 μL/well of the cells/Matrigel mixture was dispensed into a pre-coated 96-well plate with 10% GFR Matrigel using a multi-channel pipette. The plates were incubated for 30 minutes in a cell culture incubator to allow Matrigel solidification. 50 μL culture medium containing each lead hit was dispensed into the wells. The organoids were incubated for 48 hours, followed by determining viability using the CellTiter-Glo assay (Promega). Briefly, 100 μL of CellTiter-Glo reagent was added to each well in 96-well plates using an electronic pipette. After shaking 5 minutes at 500 rpm and incubating at room temperature for another 25 minutes, the luminescent signal was detected by a SpectraMax M3 Multi-Mode Microplate Reader. To calculate the inhibition rate in 3D organoid culture system, the following formula was adopted:
Where: LI = Luminescent Intensity.
To calculate IC50, the viability was normalized to the average of DMSO-treated and the highest concentration drug-treated conditions. The efficacy curves were calculated using Prism GraphPad.
Imaging and quantification.
Phase contrast Imaging
The KPSC organoids were dissociated into single cells. A total of 20,000 cells were resuspended into 50 μL Matrigel and plated in a well of a 24-well plate. Perhexiline maleate (Cayman Chemicals) was dissolved in DMSO and then added into culture medium with a final concentration at 4 μM. Control wells were treated with the same volume of DMSO. Organoid growth was recorded daily by bright-field microscopy.
Immunofluorescence
For organoid staining, a whole mount immunofluorescence strategy was used. After 48 hours treatment, organoids were fixed for 30 minutes directly in 2% PFA. Fixed organoids were washed 3 times with 1xPBS/Glycine (0.75%) solution with gentle rocking and then permeabilized with 0.5% TritonX100/PBS for 10 minutes. Organoids were then blocked for 1–1.5 hours and incubated in primary antibody overnight at 4°C on a rocking platform. They were then washed 3 times with wash solution for 10 minutes each and incubated in secondary antibody for 1 hour with gentle rocking at room temperature. The organoids were then washed 2 times with wash solution for 20 minutes each and incubated with DAPI for 15 minutes. Finally, the organoids were washed at least 1x with PBS for 10 minutes on a gently rocking platform. Images were captured on a ZEISS 800 confocal microscope using Z-correction and analyzed using Imaris Imaging Software (Bitplane).
Immunohistochemistry on tissues sections
Tumor xenografts were fixed for 1–3 hours in 4% PFA depending on the size of the tissue and then frozen in OCT. OCT sections were permeabilized, blocked using donkey serum for 1 hour and then incubated with primary antibody overnight at 4°C. Slides were washed with PBS 3 times and incubated in secondary antibody for 1 hour at room temperature. For TUNEL assays, after section permeabilization, TUNEL reaction buffer and reaction cocktails were added to incubate sections successively. The slides were washed with PBS, incubated with DAPI for 15 minutes followed by washing with PBS 3 times. Coverslips were then mounted using ProLong Gold Antifade Mountant (Invitrogen). Images were obtained with a ZEISS 800 confocal microscope and analyzed using MetaMorph Software.
Hematoxylin and eosin staining on tissues sections.
OCT sections were prepared as description above. OCT was removed through dipping the OCT slices in PBS for 1 min. And then dip in Hematoxylin for 1 min. Washing the slices through dipping twice in water. And then dip once in in lithium carbonate, the nuclei turned blue. Wash the slices once in water. The cytoplasm was stained by Eosin for 5 seconds. Dehydrate through twice of 95% EtOH and 100% EtOH for 15 seconds each. Finally, clearing tissue through twice of Xylene for 5 seconds each and then coverslip.
Tumor organoid xenograft model.
Nude immunodeficient mice were obtained from the Charles River Laboratories. For xenograft studies, male nude mice (~6–8 weeks old) were randomly divided into experimental groups. Organoids were transplanted subcutaneously with ~1×10⁶ cells in 50 μL 50% Matrigel per injection in advanced DMEM. After 2–3 days, mice with tumor xenografts were treated with drugs or vehicle. Perhexiline maleate was administrated at 16 mg/kg via intraperitoneal injection every other day. Since Betulinic acid has higher solubility than Betulin, Betulinic acid was utilized for in vivo assay. Betulinic acid was administrated at 40 mg/kg via oral gavage every other day. Tumor volume was measured with calipers. Mice were sacrificed 28 days after drug administration. All animal work was conducted in agreement with NIH guidelines and approved by the Weill Cornell Medicine Institutional Animal Care and Use Committee and the Institutional Biosafety Committee.
Orthotopic transplantation tumor models.
Luciferase-labelled KPSC organoids were transplanted to nude mice pancreas (3 wells/mice). To verify KRAS mutant dependency and KRAS mutant inhibition effect in vivo, at day 4 after transplantation, mice were randomly separated into 4 groups. For KRAS mutant dependency, one group of mice were treated with vehicle solvent (Control), while the other group of mice were treated with Perhexiline maleate (64 mg/kg bodyweight) at day 4 and then vehicle solvent after day 11. For KRAS mutant inhibition effect, the other two groups of mice were treated with vehicle solvent (Control) or Perhexiline maleate (64 mg/kg bodyweight) at day 15. The total treatment cycle was 25 days. To verify combination therapy of Perhexiline maleate with FOLFIRINOX (50mg/mL 5-Fluorouracil, 50mg/mL Irinotecan hydrochloride, 5mg/mL Oxaliplatin, 100mg/mL Folinic acid calcium) and escalation effect of Perhexiline maleate, the orthotopic transplanted mice were separated into 5 groups. The 5 groups of mice were treated with vehicle solvent (Control), Perhexiline maleate (16 mg/kg), Perhexiline maleate (64 mg/kg), FOLFIRINOX, or FOLFIRINOX+ Perhexiline maleate (64 mg/kg) every other day via intraperitoneal injection. Luciferin live image acquisition was performed twice weekly with Pre-Clinical IVIS spectrum optical CT imaging system. Luciferin potassium salt was diluted in PBS to a final concentration of 15mg/mL Luciferin is administered intraperitoneally with 10 μL of Luciferin stock solution per gram of body weight.
Multiplexing single cell library preparation for scRNA-seq.
Cell multiplexing oligo labeling was performed for library preparation. Briefly, organoids were treated with Accutase for 30 minutes at 37 °C to obtain single cell suspensions. Cells were transferred to 2 mL microcentrifuge tubes, adding 1 mL chilled PBS + 0.04% BSA and gently mixing with a pipette. The tubes were centrifuged at 150 rcf for 5–10 min at 4°C. The supernatant was discarded without disturbing the cell pellet. 100 μL Cell Multiplexing Oligos in the 3’ CellPlex Kit Set A (PN-1000261) were added, gently pipetted to resuspend, and incubated for 5 min at room temperature. Following incubation, labeled cells were washed 3 times with chilled PBS + 1% BSA. Cell concentration and viability was determined by a Bio-Rad TC20 Cell Counter and a hemocytometer. We pooled ten samples to obtain a 30,000-cell suspension and again determined pooled cell concentration and viability. The live single-cell suspension was processed with the Chromium Single Cell 3′ Reagent Kit v3 (10x Genomics) using a 10x Genomics Chromium Controller. Standard Single Cell 3’ v3.1 (Dual Index) protocols with Feature Barcode technology for Cell Multiplexing of 10x Genomics was performed.
scRNA-seq data analysis.
The 10X Libraries were sequenced on the Illumina NovaSeq6000 sequencer with pair-end reads (28 bp for read 1 and 90 bp for read 2). The sequencing data were primarily analyzed by the 10X cellranger pipeline (v6.1.1) in two steps. In the first step, cellranger mkfastq demultiplexed samples and generated fastq files; and in the second step, cellranger multi separated reads from each individual sample according to the cell multiplexing oligo (CMO) tagged to it, aligned the reads to the 10X pre-built mouse reference (mm10–2020-A) and generated gene expression UMI counts matrix for each sample.
Cells with less than 1000 or more than 6000 genes detected, cells with less than 2000 or more than 40000 UMIs detected, as well as cells with mitochondrial gene content greater than 5% were discarded. The remaining cells (2300 cells for WT-C; 2507 cells for KC-C, 1646 cells for KPC-C, 1586 cells for KSC-C, 1055 cells for KPSC-C, 2124 cells for WT-P, 893 cells for KC-P, 1243 cells for KPC-P, 1492 cells for KSC-P, 1019 cells for KPSC-P) were used for downstream analysis.
The gene expression UMI counts were normalized using the sctransform function implemented in the R Seurat package (v3.1.0)91. Principal component analysis was performed using the top 3000 variable genes after excluding mitochondrial genes and ribosomal genes using the RunPCA function, and the top 30 PCs were selected for downstream visualization and clustering analysis.
Uniform Manifold Approximation and Projection (UMAP) dimensionality reduction was performed using the RunUMAP function in the R Seurat package with the number of neighboring points setting to 30 and training epochs setting to 1000. Cells were clustered into six clusters by constructing a shared nearest neighbor graph and then grouping cells of similar transcriptome profiles using the FindNeighbors and FindClusters functions with resolution set to 0.1 in the R Seurat package.
Gene expression levels were evaluated among KC, KPC, KSC, KPSC and WT organoids, and between perhexiline maleate and control treated organoids. Differentially expressed genes were identified by performing Wilcoxon rank-sum test using the FindMarkers function in the R Seurat package.
UMAP plots were generated for highlighting expressions of selected genes using the R ggplot2 package. Dot plots were generated to present the differences in gene expressions among KC, KPC, KSC, KPSC and WT organoids, and between perhexiline maleate and control treated organoids, using the DotPlot function in the Seurat package.
To assess whether cells were clustered by organoid samples, a correlation analysis was performed by comparing the cluster and sample labeling. In particular, the fraction of cells per cluster was calculated for each organoid sample, and a heatmap plot was generated using the R pheatmap package.
Tumor subtype analysis.
To determine whether specific mutations in pancreatic organoids lead to tumors corresponding to recognized cancer subtypes, two sets of signature genes were compiled. The first set, encompassing classical and basal-like cells was derived from a previous study51, and the other set of signature genes for classical-A, classical-B, basal-like-A and basal-like-B cells was obtained from another independent study92. These signature genes, initially identified in human samples, were converted to mouse ortholog genes using Ensembl BioMart.
For each cell, multiple scores were assigned, one for each tumor subtype, based on the expressions of their signature genes. This was accomplished using the AddModuleScore function in the R Seurat package. A positive score indicates higher expression of signature genes than expected, while a negative score suggests the opposite. Subsequently, a violin plot was generated using the R ggplot2 package to illustrate the distribution of scores across different organoid samples. Additionally, heatmap plots were generated to depict scores in each cell across different organoid samples using the R pheatmap package.
To delve more deeply into the existing subtypes, we employed SCENIC93 to discern intricate cell states within KSC, KPC, and KPSC organoids. This involved reconstructing gene regulatory networks based on co-expression patterns, creating regulons derived from interactions between transcription factors and target genes, and quantifying and binarizing regulon activities at a cellular resolution, adhering to the SCENIC standard workflow94. The activity of a specific set of regulons was shown in a heatmap plot using the R pheatmap package.
WES data analysis.
The sequencing reads underwent cleaning steps, including the removal of adapter sequences and low-quality bases using Cutadapt v3.595. Subsequently, the cleaned reads were aligned to the mouse reference genome (GRCm38) using BWA-MEM v0.7.1796. The resulting aligned BAM files underwent additional refinement, with duplicate reads removed using the Picard toolkit v 2.26.10 and base quality recalibration implemented through the Genome Analysis Toolkit (GATK) v4.2.5.097. The Integrative Genomics Viewer (IGV) was employed to confirm PDAC driver mutations in the cancer organoids98.
Pathway Enrichment Analysis.
For gene set analysis, WEB-based GEne SeT AnaLysis Toolkit 201999, a widely used functional enrichment analysis web tool, was employed. The differentially expressed genes were uploaded to the gene list. Basic parameters were set to Over-Representation Analysis (ORA) or Gene Set Enrichment Analysis (GSEA). The Wikipathway database was chosen as the reference dataset for pathway enrichment analysis.
TCGA.
To provide unbiased comparison of the cholesterol biosynthesis pathway gene expression in KRAS mutant and KRAS wild-type pancreatic, colorectal and lung cancer in TCGA cohort. Three TCGA cohorts, Pancreatic Adenocarcinoma, Lung Adenocarcinoma, Colorectal Adenocarcinoma of TCGA PanCancer data, in cBioPortal dataset were included in this study. KRAS and cholesterol biosynthesis pathway genes were input into the dataset. The mutation data information of KRAS and mRNA expression data of RSEM (Batch normalized from Illumina HiSeq_RNASeqV2) of those genes were downloaded locally. The violin plots and statistics analysis were generated by Prism software.
Real-Time Quantitative PCR.
Total RNA from organoids was isolated with the RNeasy kit (Qiagen). A total of 0.5–1 μg RNA was used to synthesize complementary DNA using the High-Capacity RNA-to-cDNA Kit (Applied Biosystems). Quantitative PCR was performed with LightCycler 480 SYBR Green I Master and detected on the LightCycler 480 System (Roche). The primers used for quantitative PCR are listed in Table S2.
Cholesterol assay.
Total cholesterol was measured using the manufacturer’s protocol of a Cholesterol Quantitation kit (MAK043, Sigma-Aldrich) and normalized to the total protein level measured by BCA Assay.
Western blot analysis.
KPSC organoids were harvested by centrifuge 2000g, 5min at 4°C. Protein was extracted from KPSC organoids in RIPA lysis buffer containing complete protease inhibitor. Samples were analyzed by SDS–polyacrylamide gel electrophoresis and transferred onto nitrocellulose membranes. β-Actin Antibody and SREBP2 antibody were used to detect the target proteins. Fluorophore-conjugated IRDye 680RD goat anti-rabbit IgG secondary antibody (9926–68071, 1:25,000) were used to target the primary antibodies. The protein bands were detected on a LI-COR Odyssey CLx imaging system and analyzed using Image Studio software (LI-COR).
Statistical Analyses.
Quantification of data are presented as mean ± SEM. n = 3 independent biological replicates was used for all experiments unless otherwise indicated. The P values were calculated by unpaired two-tailed Student’s t-tests unless otherwise indicated. For the comparison of more than two groups, the P values were calculated by One-Way ANOVA firstly, and multiple comparisons test for further analysis. For Figure 4E and 4F, the P values were calculated by an unpaired two-tailed Mann Whitney test. For Figure 3F and 3G, Figure S5B, S5L and S5M, Figure 6K and Figure 7G two-way ANOVA analyses were performed. NS indicates a non-significant difference. *P < 0.05; **P < 0.01; ***P < 0.001; ****P < 0.0001.
Supplementary Material
Table S2: DE list of scRNA-seq analysis. Related to Figure 5.
Key resources table
| REAGENT or RESOURCE | SOURCE | IDENTIFIER |
|---|---|---|
| Antibodies | ||
| Ki-67 Recombinant Rabbit Monoclonal Antibody | Thermo Fisher Scientific | Catalog: #MA5-14520 RRID: AB_10979488 |
| Cleaved Caspase-3 (Asp175) (5A1E) Rabbit mAb | Cell Signaling Technology | Catalog: #9664 RRID: AB_2070042 |
| Donkey anti-Rabbit IgG (H+L) Secondary Antibody, Alexa Fluor 594 conjugate | Thermo Fisher Scientific | Catalog: #A-21207 RRID: AB_141637 |
| GATA-6 (D61E4) XP Rabbit mAb | Cell Signaling Technology | Catalog: #5851 RRID: AB_10705521 |
| SREBP2 Polyclonal Antibody | Thermo Fisher Scientific | Catalog: # PA1-338 RRID: AB_2194237 |
| β-Actin (13E5) Rabbit mAb | Cell Signaling Technology | Catalog: # 4970 RRID: AB_2223172 |
| Biological samples | ||
| Human patient material | Weill Cornell Medicine | N/A |
| Chemicals, peptides, and recombinant proteins | ||
| A83-01 | Tocris Bioscience | Catalog: #2939 |
| Y-27632 | MedchemExpress | Catalog: #HY-10583 |
| N-Acetyl-L-cysteine | Sigma-Aldrich | Catalog: #A7250 |
| Nicotinamide | Sigma-Aldrich | Catalog: #72340 |
| Gastrin I human | Sigma-Aldrich | Catalog: #G9020-1MG |
| Recombinant Murine Noggin | Peprotech | Catalog: #250-38-500UG |
| Recombinant Human FGF-10 Protein | Peprotech | Catalog: #100-26-500UG |
| Recombinant Human bFGF Protein | Peprotech | Catalog:#100-18B-500UG |
| Mouse EGF Recombinant Protein | Thermo Fisher Scientific | Catalog: # PMG8043 |
| Recombinant Human Heregulinβ−1 | Peprotech | Catalog: #100-03-500UG |
| Prostaglandin E2 | MedchemExpress | Catalog: #HY-101952 |
| SB202190 | MedchemExpress | Catalog: #HY-10295 |
| Chelerythrine chloride | MedchemExpress | Catalog: # HY-12048 |
| Bay 11-7085 | MedchemExpress | Catalog: # HY-10257 |
| BNTX maleate salt hydrate | Sigma-Aldrich | Catalog: # B8312-5MG |
| Emetine dihydrochloride hydrate | MedchemExpress | Catalog: # HY-B1479B |
| Wiskostatin | Cayman Chemical | Catalog: # 253449-04-6 |
| BIX01294 | Cayman Chemical | Catalog: # 1808255-64-2 |
| Bay 11-7082 | Cayman Chemical | Catalog: # 19542-67-7 |
| Sanguinarine chloride | Cayman Chemical | Catalog: # 5578-73-4 |
| Perhexiline maleate | Cayman Chemical | Catalog: # 6724-53-4 |
| Perhexiline maleate | R&D Systems | Catalog: # 5166 |
| Astemizole | Tocris Bioscience | Catalog: # 3489 |
| Tomatine | Santa Cruz | Catalog: # sc-296548 |
| Quinacrine dihydrochloride dihydrate | Santa Cruz | Catalog: # sc-391946 |
| Emetine dihydrochloride | MedchemExpress | Catalog: # HY-121241 |
| Alexidine dihydrochloride | Sigma-Aldrich | Catalog: # A8986-10MG |
| Nortriptyline hydrochloride | Cayman Chemical | Catalog: # 894-71-3 |
| Gentian violet | Sigma-Aldrich | Catalog: # G2039-25G |
| Clotrimazole | Tocris Bioscience | Catalog: # 4096 |
| Gramicidin | Santa Cruz | Catalog: # sc-203061 |
| Aminacrine | MedchemExpress | Catalog: # HY-B1422 |
| Tetramizole hydrochloride | Sigma-Aldrich | Catalog: # L9756-5G |
| Pristimerin | Cayman Chemical | Catalog: # 1258-84-0 |
| Gambogic acid | MedchemExpress | Catalog: # HY-N0087 |
| Digitonin | Cayman Chemical | Catalog: # 14952 |
| Celastrol | Cayman Chemical | Catalog: # 34157-83-0 |
| Lestaurtinib | Cayman Chemical | Catalog: # 111358-88-4 |
| Betulin | MedchemExpress | Catalog: # HY-N0083 |
| Betulinic acid | MedchemExpress | Catalog: # HY-10529 |
| Tamoxifen | MedchemExpress | Catalog: # HY-13757A |
| 5-Fluorouracil | MedchemExpress | Catalog: # HY-90006 |
| Irinotecan hydrochloride | MedchemExpress | Catalog: # HY-16562A |
| Oxaliplatin | MedchemExpress | Catalog: # HY-17371 |
| Folinic acid calcium | MedchemExpress | Catalog: # HY-13664 |
| Cholesterol | MedchemExpress | Catalog: # HY-N0322 |
| Simvastatin | MedchemExpress | Catalog: # HY-17502 |
| Critical commercial assays | ||
| Advanced DMEM/F-12 | Gibco Thermo Fisher | Catalog: # 12-634-028 |
| DMEM/F12 | Thermo Fisher Scientific | Catalog: # 10565018 |
| Matrigel | Corning | Catalog: #354234 |
| B27 | Thermo Fisher Scientific | Catalog: # A3582801 |
| GlutaMAX Supplement | Thermo Fisher Scientific | Catalog: #35050079 |
| Penicillin-Streptomycin (5,000 U/mL) | Gibco Thermo Fisher | Catalog: #15070063 |
| HEPES (1 M) | Gibco Thermo Fisher | Catalog: #15630080 |
| TrypLE™ Express Enzyme | Gibco Thermo Fisher | Catalog: #12605028 |
| Trypsin-EDTA | Gibco Thermo Fisher | Catalog: # 25300054 |
| Accutase | Stemcell Technologies | Catalog: # 07920 |
| RNeasy Mini Kit | QIAGEN | Catalog: # 74104 |
| DNeasy Blood & Tissue Kits | QIAGEN | Catalog: # 69516 |
| QIAprep Spin Miniprep Kit | QIAGEN | Catalog: # 27106 |
| 3’ CellPlex Kit Set A | 10X Genomics | Catalog: # PN-1000261 |
| Chromium Next GEM Single Cell 3’ Kit v3.1 | 10X Genomics | Catalog: # PN- 1000268 |
| Dual Index Kit TT Set A | 10X Genomics | Catalog: # PN- 1000215 |
| Dual Index Kit NN Set A | 10X Genomics | Catalog: # PN- 1000243 |
| Deposited data | ||
| scRNA-seq | This study | GSE207352 |
| Experimental models: Cell lines | ||
| 293T | ATCC | #CRL-11268 |
| Software and algorithms | ||
| Cell Ranger v6.1.1 | 10X Genomics | https://support.10xgenomics.com/single-cell-gene-expression/software/overview/welcome |
| Rstudio | Rstudio | https://rstudio.com |
| Seurat R package v3.1.0 | Butler, A. et al.91 | https://satijalab.org/seurat/ |
| DAVID6.8 | LHRI | https://david.ncifcrf.gov/home.jsp |
| Adobe illustrator CC2017 | Adobe | https://www.adobe.com/product/photoshop.html |
| Graphpad Prism 9 | Graphpad software | https://www.graphpad.com |
| ZEN Image Acquisition Software | Zeiss Microscope | https://www.zeiss.com/microscopy/us/products/microscope-software/zen-lite.html |
| MetaMorph | Molecular Devices | https://www.moleculardevices.com/products/cellular-imaging-systems/acquisition-and-analysis-software/metamorph-microscopy |
| Imaris 7.4.2 | Oxford Instrument | https://imaris.oxinst.com/ |
Highlights.
A series of pancreas organoids carrying common mutations in pancreatic cancer.
A high throughput screen to identify Perhexiline maleate targeting KRAS mutations.
KRAS mutation activates cholesterol biosynthesis pathway.
Perhexiline maleate downregulates SREBP2/cholesterol biosynthesis.
Acknowledgements
This work was supported by the Weill Cornell Medicine, Department of Surgery Pancreatic Cancer Initiative, National Institute of Diabetes, Digestive and Kidney Diseases (NIDDK, R01DK130454, R01DK119667, R01DK119667-02S1, and U01 DK127777, S.C.), National Cancer Institute (NCI R01CA204228, S.D.L, R.C.; R01CA204228, R.C.), Tri-Institutional Stem Cell Initiative (Tri-Sci 202005), Department of Surgery, Weill Cornell Medicine (T.E., S.C.). S.C is supported as an Irma Hirschl Trust Research Award Scholar.
Footnotes
Declaration of Interests
S.C. and T.E. are the co- founders of OncoBeat, LLC. S.C is a consultant for Vesalius Therapeutics. F.C.P is currently employed by Exelixis.
Publisher's Disclaimer: This is a PDF file of an unedited manuscript that has been accepted for publication. As a service to our customers we are providing this early version of the manuscript. The manuscript will undergo copyediting, typesetting, and review of the resulting proof before it is published in its final form. Please note that during the production process errors may be discovered which could affect the content, and all legal disclaimers that apply to the journal pertain.
REFERENCES
- 1.Sato T, Stange DE, Ferrante M, Vries RG, Van Es JH, Van den Brink S, Van Houdt WJ, Pronk A, Van Gorp J, Siersema PD, and Clevers H. (2011). Long-term expansion of epithelial organoids from human colon, adenoma, adenocarcinoma, and Barrett’s epithelium. Gastroenterology 141, 1762–1772. 10.1053/j.gastro.2011.07.050. [DOI] [PubMed] [Google Scholar]
- 2.Li X, Francies HE, Secrier M, Perner J, Miremadi A, Galeano-Dalmau N, Barendt WJ, Letchford L, Leyden GM, Goffin EK, et al. (2018). Organoid cultures recapitulate esophageal adenocarcinoma heterogeneity providing a model for clonality studies and precision therapeutics. Nat Commun 9, 2983. 10.1038/s41467-018-05190-9. [DOI] [PMC free article] [PubMed] [Google Scholar]
- 3.Bartfeld S, Bayram T, van de Wetering M, Huch M, Begthel H, Kujala P, Vries R, Peters PJ, and Clevers H. (2015). In vitro expansion of human gastric epithelial stem cells and their responses to bacterial infection. Gastroenterology 148, 126–136 e126. 10.1053/j.gastro.2014.09.042. [DOI] [PMC free article] [PubMed] [Google Scholar]
- 4.Broutier L, Mastrogiovanni G, Verstegen MM, Francies HE, Gavarro LM, Bradshaw CR, Allen GE, Arnes-Benito R, Sidorova O, Gaspersz MP, et al. (2017). Human primary liver cancer-derived organoid cultures for disease modeling and drug screening. Nat Med 23, 1424–1435. 10.1038/nm.4438. [DOI] [PMC free article] [PubMed] [Google Scholar]
- 5.Boj SF, Hwang CI, Baker LA, Chio II, Engle DD, Corbo V, Jager M, Ponz-Sarvise M, Tiriac H, Spector MS, et al. (2015). Organoid models of human and mouse ductal pancreatic cancer. Cell 160, 324–338. 10.1016/j.cell.2014.12.021. [DOI] [PMC free article] [PubMed] [Google Scholar]
- 6.Saito Y, Muramatsu T, Kanai Y, Ojima H, Sukeda A, Hiraoka N, Arai E, Sugiyama Y, Matsuzaki J, Uchida R, et al. (2019). Establishment of Patient-Derived Organoids and Drug Screening for Biliary Tract Carcinoma. Cell Rep 27, 1265–1276 e1264. 10.1016/j.celrep.2019.03.088. [DOI] [PubMed] [Google Scholar]
- 7.Ogawa J, Pao GM, Shokhirev MN, and Verma IM (2018). Glioblastoma Model Using Human Cerebral Organoids. Cell Rep 23, 1220–1229. 10.1016/j.celrep.2018.03.105. [DOI] [PMC free article] [PubMed] [Google Scholar]
- 8.Kim M, Mun H, Sung CO, Cho EJ, Jeon HJ, Chun SM, Jung DJ, Shin TH, Jeong GS, Kim DK, et al. (2019). Patient-derived lung cancer organoids as in vitro cancer models for therapeutic screening. Nat Commun 10, 3991. 10.1038/s41467-019-11867-6. [DOI] [PMC free article] [PubMed] [Google Scholar]
- 9.Walsh AJ, Cook RS, Sanders ME, Aurisicchio L, Ciliberto G, Arteaga CL, and Skala MC (2014). Quantitative optical imaging of primary tumor organoid metabolism predicts drug response in breast cancer. Cancer Res 74, 5184–5194. 10.1158/0008-5472.CAN-14-0663. [DOI] [PMC free article] [PubMed] [Google Scholar]
- 10.Hill SJ, Decker B, Roberts EA, Horowitz NS, Muto MG, Worley MJ Jr., Feltmate CM, Nucci MR, Swisher EM, Nguyen H, et al. (2018). Prediction of DNA Repair Inhibitor Response in Short-Term Patient-Derived Ovarian Cancer Organoids. Cancer Discov 8, 1404–1421. 10.1158/2159-8290.CD-18-0474. [DOI] [PMC free article] [PubMed] [Google Scholar]
- 11.Turco MY, Gardner L, Hughes J, Cindrova-Davies T, Gomez MJ, Farrell L, Hollinshead M, Marsh SGE, Brosens JJ, Critchley HO, et al. (2017). Long-term, hormone-responsive organoid cultures of human endometrium in a chemically defined medium. Nat Cell Biol 19, 568–577. 10.1038/ncb3516. [DOI] [PMC free article] [PubMed] [Google Scholar]
- 12.Grassi L, Alfonsi R, Francescangeli F, Signore M, De Angelis ML, Addario A, Costantini M, Flex E, Ciolfi A, Pizzi S, et al. (2019). Organoids as a new model for improving regenerative medicine and cancer personalized therapy in renal diseases. Cell Death Dis 10, 201. 10.1038/s41419-019-1453-0. [DOI] [PMC free article] [PubMed] [Google Scholar]
- 13.Drost J, Karthaus WR, Gao D, Driehuis E, Sawyers CL, Chen Y, and Clevers H. (2016). Organoid culture systems for prostate epithelial and cancer tissue. Nat Protoc 11, 347–358. 10.1038/nprot.2016.006. [DOI] [PMC free article] [PubMed] [Google Scholar]
- 14.Lee SH, Hu W, Matulay JT, Silva MV, Owczarek TB, Kim K, Chua CW, Barlow LJ, Kandoth C, Williams AB, et al. (2018). Tumor Evolution and Drug Response in Patient-Derived Organoid Models of Bladder Cancer. Cell 173, 515–528 e517. 10.1016/j.cell.2018.03.017. [DOI] [PMC free article] [PubMed] [Google Scholar]
- 15.van de Wetering M, Francies HE, Francis JM, Bounova G, Iorio F, Pronk A, van Houdt W, van Gorp J, Taylor-Weiner A, Kester L, et al. (2015). Prospective derivation of a living organoid biobank of colorectal cancer patients. Cell 161, 933–945. 10.1016/j.cell.2015.03.053. [DOI] [PMC free article] [PubMed] [Google Scholar]
- 16.Calandrini C, Schutgens F, Oka R, Margaritis T, Candelli T, Mathijsen L, Ammerlaan C, van Ineveld RL, Derakhshan S, de Haan S, et al. (2020). An organoid biobank for childhood kidney cancers that captures disease and tissue heterogeneity. Nat Commun 11, 1310. 10.1038/s41467-020-15155-6. [DOI] [PMC free article] [PubMed] [Google Scholar]
- 17.Sachs N, de Ligt J, Kopper O, Gogola E, Bounova G, Weeber F, Balgobind AV, Wind K, Gracanin A, Begthel H, et al. (2018). A Living Biobank of Breast Cancer Organoids Captures Disease Heterogeneity. Cell 172, 373–386 e310. 10.1016/j.cell.2017.11.010. [DOI] [PubMed] [Google Scholar]
- 18.Beshiri ML, Tice CM, Tran C, Nguyen HM, Sowalsky AG, Agarwal S, Jansson KH, Yang Q, McGowen KM, Yin J, et al. (2018). A PDX/Organoid Biobank of Advanced Prostate Cancers Captures Genomic and Phenotypic Heterogeneity for Disease Modeling and Therapeutic Screening. Clin Cancer Res 24, 4332–4345. 10.1158/1078-0432.CCR-18-0409. [DOI] [PMC free article] [PubMed] [Google Scholar]
- 19.Yan HHN, Siu HC, Law S, Ho SL, Yue SSK, Tsui WY, Chan D, Chan AS, Ma S, Lam KO, et al. (2018). A Comprehensive Human Gastric Cancer Organoid Biobank Captures Tumor Subtype Heterogeneity and Enables Therapeutic Screening. Cell Stem Cell 23, 882–897 e811. 10.1016/j.stem.2018.09.016. [DOI] [PubMed] [Google Scholar]
- 20.Drost J, van Jaarsveld RH, Ponsioen B, Zimberlin C, van Boxtel R, Buijs A, Sachs N, Overmeer RM, Offerhaus GJ, Begthel H, et al. (2015). Sequential cancer mutations in cultured human intestinal stem cells. Nature 521, 43–47. 10.1038/nature14415. [DOI] [PubMed] [Google Scholar]
- 21.Matano M, Date S, Shimokawa M, Takano A, Fujii M, Ohta Y, Watanabe T, Kanai T, and Sato T. (2015). Modeling colorectal cancer using CRISPR-Cas9-mediated engineering of human intestinal organoids. Nat Med 21, 256–262. 10.1038/nm.3802. [DOI] [PubMed] [Google Scholar]
- 22.Nanki K, Toshimitsu K, Takano A, Fujii M, Shimokawa M, Ohta Y, Matano M, Seino T, Nishikori S, Ishikawa K, et al. (2018). Divergent Routes toward Wnt and R-spondin Niche Independency during Human Gastric Carcinogenesis. Cell 174, 856–869 e817. 10.1016/j.cell.2018.07.027. [DOI] [PubMed] [Google Scholar]
- 23.Fernandez-Vega V, Hou S, Plenker D, Tiriac H, Baillargeon P, Shumate J, Scampavia L, Seldin J, Souza GR, Tuveson DA, and Spicer TP (2022). Lead identification using 3D models of pancreatic cancer. SLAS Discov 27, 159–166. 10.1016/j.slasd.2022.03.002. [DOI] [PMC free article] [PubMed] [Google Scholar]
- 24.Siegel RL, Miller KD, Fuchs HE, and Jemal A. (2022). Cancer statistics, 2022. CA Cancer J Clin 72, 7–33. 10.3322/caac.21708. [DOI] [PubMed] [Google Scholar]
- 25.Witkiewicz AK, McMillan EA, Balaji U, Baek G, Lin WC, Mansour J, Mollaee M, Wagner KU, Koduru P, Yopp A, et al. (2015). Whole-exome sequencing of pancreatic cancer defines genetic diversity and therapeutic targets. Nat Commun 6, 6744. 10.1038/ncomms7744. [DOI] [PMC free article] [PubMed] [Google Scholar]
- 26.Waddell N, Pajic M, Patch AM, Chang DK, Kassahn KS, Bailey P, Johns AL, Miller D, Nones K, Quek K, et al. (2015). Whole genomes redefine the mutational landscape of pancreatic cancer. Nature 518, 495–501. 10.1038/nature14169. [DOI] [PMC free article] [PubMed] [Google Scholar]
- 27.Bailey P, Chang DK, Nones K, Johns AL, Patch AM, Gingras MC, Miller DK, Christ AN, Bruxner TJ, Quinn MC, et al. (2016). Genomic analyses identify molecular subtypes of pancreatic cancer. Nature 531, 47–52. 10.1038/nature16965. [DOI] [PubMed] [Google Scholar]
- 28.Shankar S, Pitchiaya S, Malik R, Kothari V, Hosono Y, Yocum AK, Gundlapalli H, White Y, Firestone A, Cao X, et al. (2016). KRAS Engages AGO2 to Enhance Cellular Transformation. Cell Rep 14, 1448–1461. 10.1016/j.celrep.2016.01.034. [DOI] [PMC free article] [PubMed] [Google Scholar]
- 29.Makrodouli E, Oikonomou E, Koc M, Andera L, Sasazuki T, Shirasawa S, and Pintzas A. (2011). BRAF and RAS oncogenes regulate Rho GTPase pathways to mediate migration and invasion properties in human colon cancer cells: a comparative study. Mol Cancer 10, 118. 10.1186/1476-4598-10-118. [DOI] [PMC free article] [PubMed] [Google Scholar]
- 30.Kimmelman AC (2015). Metabolic Dependencies in RAS-Driven Cancers. Clin Cancer Res 21, 1828–1834. 10.1158/1078-0432.CCR-14-2425. [DOI] [PMC free article] [PubMed] [Google Scholar]
- 31.Ischenko I, D’Amico S, Rao M, Li J, Hayman MJ, Powers S, Petrenko O, and Reich NC (2021). KRAS drives immune evasion in a genetic model of pancreatic cancer. Nat Commun 12, 1482. 10.1038/s41467-021-21736-w. [DOI] [PMC free article] [PubMed] [Google Scholar]
- 32.Sessa F, Solcia E, Capella C, Bonato M, Scarpa A, Zamboni G, Pellegata NS, Ranzani GN, Rickaert F, and Kloppel G. (1994). Intraductal papillary-mucinous tumours represent a distinct group of pancreatic neoplasms: an investigation of tumour cell differentiation and K-ras, p53 and c-erbB-2 abnormalities in 26 patients. Virchows Arch 425, 357–367. 10.1007/BF00189573. [DOI] [PubMed] [Google Scholar]
- 33.Ostrem JM, and Shokat KM (2016). Direct small-molecule inhibitors of KRAS: from structural insights to mechanism-based design. Nat Rev Drug Discov 15, 771–785. 10.1038/nrd.2016.139. [DOI] [PubMed] [Google Scholar]
- 34.Moore AR, Rosenberg SC, McCormick F, and Malek S. (2020). RAS-targeted therapies: is the undruggable drugged? Nat Rev Drug Discov 19, 533–552. 10.1038/s41573-020-0068-6. [DOI] [PMC free article] [PubMed] [Google Scholar]
- 35.Janes MR, Zhang J, Li LS, Hansen R, Peters U, Guo X, Chen Y, Babbar A, Firdaus SJ, Darjania L, et al. (2018). Targeting KRAS Mutant Cancers with a Covalent G12C-Specific Inhibitor. Cell 172, 578–589 e517. 10.1016/j.cell.2018.01.006. [DOI] [PubMed] [Google Scholar]
- 36.Patricelli MP, Janes MR, Li LS, Hansen R, Peters U, Kessler LV, Chen Y, Kucharski JM, Feng J, Ely T, et al. (2016). Selective Inhibition of Oncogenic KRAS Output with Small Molecules Targeting the Inactive State. Cancer Discov 6, 316–329. 10.1158/2159-8290.CD-15-1105. [DOI] [PubMed] [Google Scholar]
- 37.Fell JB, Fischer JP, Baer BR, Blake JF, Bouhana K, Briere DM, Brown KD, Burgess LE, Burns AC, Burkard MR, et al. (2020). Identification of the Clinical Development Candidate MRTX849, a Covalent KRAS(G12C) Inhibitor for the Treatment of Cancer. J Med Chem 63, 6679–6693. 10.1021/acs.jmedchem.9b02052. [DOI] [PubMed] [Google Scholar]
- 38.Canon J, Rex K, Saiki AY, Mohr C, Cooke K, Bagal D, Gaida K, Holt T, Knutson CG, Koppada N, et al. (2019). The clinical KRAS(G12C) inhibitor AMG 510 drives anti-tumour immunity. Nature 575, 217–223. 10.1038/s41586-019-1694-1. [DOI] [PubMed] [Google Scholar]
- 39.Vasta JD, Peacock DM, Zheng Q, Walker JA, Zhang Z, Zimprich CA, Thomas MR, Beck MT, Binkowski BF, Corona CR, et al. (2022). KRAS is vulnerable to reversible switch-II pocket engagement in cells. Nat Chem Biol 18, 596–604. 10.1038/s41589-022-00985-w. [DOI] [PMC free article] [PubMed] [Google Scholar]
- 40.Ou SI, Janne PA, Leal TA, Rybkin II, Sabari JK, Barve MA, Bazhenova L, Johnson ML, Velastegui KL, Cilliers C, et al. (2022). First-in-Human Phase I/IB Dose-Finding Study of Adagrasib (MRTX849) in Patients With Advanced KRAS(G12C) Solid Tumors (KRYSTAL-1). J Clin Oncol, JCO2102752. 10.1200/JCO.21.02752. [DOI] [PMC free article] [PubMed] [Google Scholar]
- 41.Hong DS, Fakih MG, Strickler JH, Desai J, Durm GA, Shapiro GI, Falchook GS, Price TJ, Sacher A, Denlinger CS, et al. (2020). KRAS(G12C) Inhibition with Sotorasib in Advanced Solid Tumors. N Engl J Med 383, 1207–1217. 10.1056/NEJMoa1917239. [DOI] [PMC free article] [PubMed] [Google Scholar]
- 42.Wang X, Allen S, Blake JF, Bowcut V, Briere DM, Calinisan A, Dahlke JR, Fell JB, Fischer JP, Gunn RJ, et al. (2022). Identification of MRTX1133, a Noncovalent, Potent, and Selective KRAS(G12D) Inhibitor. J Med Chem 65, 3123–3133. 10.1021/acs.jmedchem.1c01688. [DOI] [PubMed] [Google Scholar]
- 43.Koltun ES, Rice MA, Gustafson WC, Wilds D, Jiang J, Lee BJ, Wang Z, Chang S, Flagella M, Mu Y, et al. (2022). Abstract 3597: Direct targeting of KRASG12X mutant cancers with RMC-6236, a first-in-class, RAS-selective, orally bioavailable, tri-complex RASMULTI(ON) inhibitor. Cancer Research 82, 3597–3597. 10.1158/1538-7445.Am2022-3597. [DOI] [Google Scholar]
- 44.Nichols RJ, Yang YC, Cregg J, Schulze CJ, Wang Z, Dua R, Jiang J, Garrenton LS, Nasholm N, Bermingham A, et al. (2022). Abstract 3595: RMC-6291, a next-generation tri-complex KRASG12C(ON) inhibitor, outperforms KRASG12C(OFF) inhibitors in preclinical models of KRASG12C cancers. Cancer Research 82, 3595–3595. 10.1158/1538-7445.Am2022-3595. [DOI] [Google Scholar]
- 45.Menard MJ, Chow C, Chen K, Blaj C, Shifrin NT, Courtney H, Nasholm NM, Pham A, Kumamoto A, Ganesh S, et al. (2023). Abstract 3475: RMC-9805, a first-in-class, mutant-selective, covalent and orally bioavailable KRASG12D(ON) inhibitor, promotes cancer-associated neoantigen recognition and synergizes with immunotherapy in preclinical models. Cancer Research 83, 3475–3475. 10.1158/1538-7445.Am2023-3475. [DOI] [Google Scholar]
- 46.Yonezawa S, Higashi M, Yamada N, and Goto M. (2008). Precursor lesions of pancreatic cancer. Gut Liver 2, 137–154. 10.5009/gnl.2008.2.3.137. [DOI] [PMC free article] [PubMed] [Google Scholar]
- 47.McGinnis CS, Patterson DM, Winkler J, Conrad DN, Hein MY, Srivastava V, Hu JL, Murrow LM, Weissman JS, Werb Z, et al. (2019). MULTI-seq: sample multiplexing for single-cell RNA sequencing using lipid-tagged indices. Nat Methods 16, 619–626. 10.1038/s41592-019-0433-8. [DOI] [PMC free article] [PubMed] [Google Scholar]
- 48.Ketola I, Otonkoski T, Pulkkinen MA, Niemi H, Palgi J, Jacobsen CM, Wilson DB, and Heikinheimo M. (2004). Transcription factor GATA-6 is expressed in the endocrine and GATA-4 in the exocrine pancreas. Mol Cell Endocrinol 226, 51–57. 10.1016/j.mce.2004.06.007. [DOI] [PubMed] [Google Scholar]
- 49.Hingorani SR, Petricoin EF, Maitra A, Rajapakse V, King C, Jacobetz MA, Ross S, Conrads TP, Veenstra TD, Hitt BA, et al. (2003). Preinvasive and invasive ductal pancreatic cancer and its early detection in the mouse. Cancer Cell 4, 437–450. 10.1016/s1535-6108(03)00309-x. [DOI] [PubMed] [Google Scholar]
- 50.Dreyer SB, Upstill-Goddard R, Legrini A, Biankin AV, Glasgow Precision Oncology L, Jamieson NB, Chang DK, Australian Pancreatic Genome I, Jamieson NB, and Chang DK (2022). Genomic and Molecular Analyses Identify Molecular Subtypes of Pancreatic Cancer Recurrence. Gastroenterology 162, 320–324 e324. 10.1053/j.gastro.2021.09.022. [DOI] [PMC free article] [PubMed] [Google Scholar]
- 51.Moffitt RA, Marayati R, Flate EL, Volmar KE, Loeza SG, Hoadley KA, Rashid NU, Williams LA, Eaton SC, Chung AH, et al. (2015). Virtual microdissection identifies distinct tumor- and stroma-specific subtypes of pancreatic ductal adenocarcinoma. Nat Genet 47, 1168–1178. 10.1038/ng.3398. [DOI] [PMC free article] [PubMed] [Google Scholar]
- 52.Collisson EA, Sadanandam A, Olson P, Gibb WJ, Truitt M, Gu S, Cooc J, Weinkle J, Kim GE, Jakkula L, et al. (2011). Subtypes of pancreatic ductal adenocarcinoma and their differing responses to therapy. Nat Med 17, 500–503. 10.1038/nm.2344. [DOI] [PMC free article] [PubMed] [Google Scholar]
- 53.Chan-Seng-Yue M, Kim JC, Wilson GW, Ng K, Figueroa EF, O’Kane GM, Connor AA, Denroche RE, Grant RC, McLeod J, et al. (2020). Transcription phenotypes of pancreatic cancer are driven by genomic events during tumor evolution. Nat Genet 52, 231–240. 10.1038/s41588-019-0566-9. [DOI] [PubMed] [Google Scholar]
- 54.Aibar S, Gonzalez-Blas CB, Moerman T, Huynh-Thu VA, Imrichova H, Hulselmans G, Rambow F, Marine JC, Geurts P, Aerts J, et al. (2017). SCENIC: single-cell regulatory network inference and clustering. Nat Methods 14, 1083–1086. 10.1038/nmeth.4463. [DOI] [PMC free article] [PubMed] [Google Scholar]
- 55.Miyabayashi K, Baker LA, Deschenes A, Traub B, Caligiuri G, Plenker D, Alagesan B, Belleau P, Li S, Kendall J, et al. (2020). Intraductal Transplantation Models of Human Pancreatic Ductal Adenocarcinoma Reveal Progressive Transition of Molecular Subtypes. Cancer Discov 10, 1566–1589. 10.1158/2159-8290.CD-20-0133. [DOI] [PMC free article] [PubMed] [Google Scholar]
- 56.O’Kane GM, Grunwald BT, Jang GH, Masoomian M, Picardo S, Grant RC, Denroche RE, Zhang A, Wang Y, Lam B, et al. (2020). GATA6 Expression Distinguishes Classical and Basal-like Subtypes in Advanced Pancreatic Cancer. Clin Cancer Res 26, 4901–4910. 10.1158/1078-0432.CCR19-3724. [DOI] [PubMed] [Google Scholar]
- 57.Chan E, Mulkerin D, Rothenberg M, Holen KD, Lockhart AC, Thomas J, and Berlin J. (2008). A phase I trial of CEP-701 + gemcitabine in patients with advanced adenocarcinoma of the pancreas. Invest New Drugs 26, 241–247. 10.1007/s10637-008-9118-3. [DOI] [PubMed] [Google Scholar]
- 58.Ren X-R, Wang J, Osada T, Mook RA, Morse MA, Barak LS, Lyerly HK, and Chen W. (2015). Perhexiline promotes HER3 ablation through receptor internalization and inhibits tumor growth. Breast Cancer Research 17, 20. 10.1186/s13058-015-0528-9. [DOI] [PMC free article] [PubMed] [Google Scholar]
- 59.Tseng CC, Noordali H, Sani M, Madhani M, Grant DM, Frenneaux MP, Zanda M, and Greig IR (2017). Development of Fluorinated Analogues of Perhexiline with Improved Pharmacokinetic Properties and Retained Efficacy. J Med Chem 60, 2780–2789. 10.1021/acs.jmedchem.6b01592. [DOI] [PubMed] [Google Scholar]
- 60.Eid W, Dauner K, Courtney KC, Gagnon A, Parks RJ, Sorisky A, and Zha X. (2017). mTORC1 activates SREBP-2 by suppressing cholesterol trafficking to lysosomes in mammalian cells. Proc Natl Acad Sci U S A 114, 7999–8004. 10.1073/pnas.1705304114. [DOI] [PMC free article] [PubMed] [Google Scholar]
- 61.Ricoult SJ, Yecies JL, Ben-Sahra I, and Manning BD (2016). Oncogenic PI3K and K-Ras stimulate de novo lipid synthesis through mTORC1 and SREBP. Oncogene 35, 1250–1260. 10.1038/onc.2015.179. [DOI] [PMC free article] [PubMed] [Google Scholar]
- 62.Zhang B, Wu J, Guo P, Wang Y, Fang Z, Tian J, Yu Y, Teng W, Luo Y, and Li Y. (2020). Down-Regulation of SREBP via PI3K/AKT/mTOR Pathway Inhibits the Proliferation and Invasion of Non-Small-Cell Lung Cancer Cells. Onco Targets Ther 13, 8951–8961. 10.2147/OTT.S266073. [DOI] [PMC free article] [PubMed] [Google Scholar] [Retracted]
- 63.Guillaumond F, Bidaut G, Ouaissi M, Servais S, Gouirand V, Olivares O, Lac S, Borge L, Roques J, Gayet O, et al. (2015). Cholesterol uptake disruption, in association with chemotherapy, is a promising combined metabolic therapy for pancreatic adenocarcinoma. Proc Natl Acad Sci U S A 112, 2473-2478. 10.1073/pnas.1421601112. [DOI] [PMC free article] [PubMed] [Google Scholar]
- 64.Gunda V, Genaro-Mattos TC, Kaushal JB, Chirravuri-Venkata R, Natarajan G, Mallya K, Grandgenett PM, Mirnics K, Batra SK, Korade Z, and Rachagani S. (2022). Ubiquitous Aberration in Cholesterol Metabolism across Pancreatic Ductal Adenocarcinoma. Metabolites 12. 10.3390/metabo12010047. [DOI] [PMC free article] [PubMed] [Google Scholar]
- 65.Birch JM, Hartley AL, Tricker KJ, Prosser J, Condie A, Kelsey AM, Harris M, Jones PH, Binchy A, Crowther D, and et al. (1994). Prevalence and diversity of constitutional mutations in the p53 gene among 21 Li-Fraumeni families. Cancer Res 54, 1298–1304. [PubMed] [Google Scholar]
- 66.Lang GA, Iwakuma T, Suh YA, Liu G, Rao VA, Parant JM, Valentin Vega YA, Terzian T, Caldwell LC, Strong LC, et al. (2004). Gain of function of a p53 hot spot mutation in a mouse model of Li-Fraumeni syndrome. Cell 119, 861–872. 10.1016/j.cell.2004.11.006. [DOI] [PubMed] [Google Scholar]
- 67.Goh AM, Coffill CR, and Lane DP (2011). The role of mutant p53 in human cancer. J Pathol 223, 116–126. 10.1002/path.2784. [DOI] [PubMed] [Google Scholar]
- 68.Olive KP, Tuveson DA, Ruhe ZC, Yin B, Willis NA, Bronson RT, Crowley D, and Jacks T. (2004). Mutant p53 gain of function in two mouse models of Li-Fraumeni syndrome. Cell 119, 847–860. 10.1016/j.cell.2004.11.004. [DOI] [PubMed] [Google Scholar]
- 69.Brown MS, and Goldstein JL (1997). The SREBP pathway: regulation of cholesterol metabolism by proteolysis of a membrane-bound transcription factor. Cell 89, 331–340. 10.1016/s0092-8674(00)80213-5. [DOI] [PubMed] [Google Scholar]
- 70.Wen YA, Xiong X, Zaytseva YY, Napier DL, Vallee E, Li AT, Wang C, Weiss HL, Evers BM, and Gao T. (2018). Downregulation of SREBP inhibits tumor growth and initiation by altering cellular metabolism in colon cancer. Cell Death Dis 9, 265. 10.1038/s41419-018-0330-6. [DOI] [PMC free article] [PubMed] [Google Scholar]
- 71.Kondo A, Yamamoto S, Nakaki R, Shimamura T, Hamakubo T, Sakai J, Kodama T, Yoshida T, Aburatani H, and Osawa T. (2017). Extracellular Acidic pH Activates the Sterol Regulatory Element-Binding Protein 2 to Promote Tumor Progression. Cell Rep 18, 2228–2242. 10.1016/j.celrep.2017.02.006. [DOI] [PubMed] [Google Scholar]
- 72.Aylon Y, Gershoni A, Rotkopf R, Biton IE, Porat Z, Koh AP, Sun X, Lee Y, Fiel MI, Hoshida Y, et al. (2016). The LATS2 tumor suppressor inhibits SREBP and suppresses hepatic cholesterol accumulation. Genes Dev 30, 786–797. 10.1101/gad.274167.115. [DOI] [PMC free article] [PubMed] [Google Scholar]
- 73.Lewis CA, Brault C, Peck B, Bensaad K, Griffiths B, Mitter R, Chakravarty P, East P, Dankworth B, Alibhai D, et al. (2015). SREBP maintains lipid biosynthesis and viability of cancer cells under lipid- and oxygen-deprived conditions and defines a gene signature associated with poor survival in glioblastoma multiforme. Oncogene 34, 5128–5140. 10.1038/onc.2014.439. [DOI] [PubMed] [Google Scholar]
- 74.Tang JJ, Li JG, Qi W, Qiu WW, Li PS, Li BL, and Song BL (2011). Inhibition of SREBP by a small molecule, betulin, improves hyperlipidemia and insulin resistance and reduces atherosclerotic plaques. Cell Metab 13, 44–56. 10.1016/j.cmet.2010.12.004. [DOI] [PubMed] [Google Scholar]
- 75.Venkat S, Alahmari AA, and Feigin ME (2021). Drivers of Gene Expression Dysregulation in Pancreatic Cancer. Trends Cancer 7, 594–605. 10.1016/j.trecan.2021.01.008. [DOI] [PMC free article] [PubMed] [Google Scholar]
- 76.Kennedy JA, Unger SA, and Horowitz JD (1996). Inhibition of carnitine palmitoyltransferase-1 in rat heart and liver by perhexiline and amiodarone. Biochem Pharmacol 52, 273–280. 10.1016/0006-2952(96)00204-3. [DOI] [PubMed] [Google Scholar]
- 77.Kant S, Kesarwani P, Guastella AR, Kumar P, Graham SF, Buelow KL, Nakano I, and Chinnaiyan P. (2020). Perhexiline Demonstrates FYN-mediated Antitumor Activity in Glioblastoma. Mol Cancer Ther 19, 1415–1422. 10.1158/1535-7163.MCT-19-1047. [DOI] [PMC free article] [PubMed] [Google Scholar]
- 78.Balgi AD, Fonseca BD, Donohue E, Tsang TC, Lajoie P, Proud CG, Nabi IR, and Roberge M. (2009). Screen for chemical modulators of autophagy reveals novel therapeutic inhibitors of mTORC1 signaling. PLoS One 4, e7124. 10.1371/journal.pone.0007124. [DOI] [PMC free article] [PubMed] [Google Scholar]
- 79.Rathore R, Caldwell KE, Schutt C, Brashears CB, Prudner BC, Ehrhardt WR, Leung CH, Lin H, Daw NC, Beird HC, et al. (2021). Metabolic compensation activates pro-survival mTORC1 signaling upon 3-phosphoglycerate dehydrogenase inhibition in osteosarcoma. Cell Rep 34, 108678. 10.1016/j.celrep.2020.108678. [DOI] [PMC free article] [PubMed] [Google Scholar]
- 80.Wang BT, Ducker GS, Barczak AJ, Barbeau R, Erle DJ, and Shokat KM (2011). The mammalian target of rapamycin regulates cholesterol biosynthetic gene expression and exhibits a rapamycin-resistant transcriptional profile. Proc Natl Acad Sci U S A 108, 15201–15206. 10.1073/pnas.1103746108. [DOI] [PMC free article] [PubMed] [Google Scholar]
- 81.Lu Z, Ku L, Chen Y, and Feng Y. (2005). Developmental abnormalities of myelin basic protein expression in fyn knock-out brain reveal a role of Fyn in posttranscriptional regulation. J Biol Chem 280, 389–395. 10.1074/jbc.M405973200. [DOI] [PubMed] [Google Scholar]
- 82.Shin S, Zhou H, He C, Wei Y, Wang Y, Shingu T, Zeng A, Wang S, Zhou X, Li H, et al. (2021). Qki activates Srebp2-mediated cholesterol biosynthesis for maintenance of eye lens transparency. Nat Commun 12, 3005. 10.1038/s41467-021-22782-0. [DOI] [PMC free article] [PubMed] [Google Scholar]
- 83.Bathaie SZ, Ashrafi M, Azizian M, and Tamanoi F. (2017). Mevalonate Pathway and Human Cancers. Curr Mol Pharmacol 10, 77–85. 10.2174/1874467209666160112123205. [DOI] [PubMed] [Google Scholar]
- 84.Mullen PJ, Yu R, Longo J, Archer MC, and Penn LZ (2016). The interplay between cell signalling and the mevalonate pathway in cancer. Nat Rev Cancer 16, 718–731. 10.1038/nrc.2016.76. [DOI] [PubMed] [Google Scholar]
- 85.Chen H, Qin S, Wang M, Zhang T, and Zhang S. (2015). Association between cholesterol intake and pancreatic cancer risk: evidence from a meta-analysis. Sci Rep 5, 8243. 10.1038/srep08243. [DOI] [PMC free article] [PubMed] [Google Scholar]
- 86.Corella Piquer D, Cortina Greus P, and Coltell Simon O. (1994). [Nutritional factors and geographic differences in pancreatic cancer mortality in Spain]. Rev Sanid Hig Publica (Madr) 68, 361–376. [PubMed] [Google Scholar]
- 87.Wang J, Wang WJ, Zhai L, and Zhang DF (2015). Association of cholesterol with risk of pancreatic cancer: a meta-analysis. World J Gastroenterol 21, 3711–3719. 10.3748/wjg.v21.i12.3711. [DOI] [PMC free article] [PubMed] [Google Scholar]
- 88.Huang BZ, Chang JI, Li E, Xiang AH, and Wu BU (2017). Influence of Statins and Cholesterol on Mortality Among Patients With Pancreatic Cancer. J Natl Cancer Inst 109. 10.1093/jnci/djw275. [DOI] [PubMed] [Google Scholar]
- 89.Pauli C, Hopkins BD, Prandi D, Shaw R, Fedrizzi T, Sboner A, Sailer V, Augello M, Puca L, Rosati R, et al. (2017). Personalized In Vitro and In Vivo Cancer Models to Guide Precision Medicine. Cancer Discov 7, 462–477. 10.1158/2159-8290.Cd-16-1154. [DOI] [PMC free article] [PubMed] [Google Scholar]
- 90.Pauli C, Puca L, Mosquera JM, Robinson BD, Beltran H, Rubin MA, and Rao RA (2016). An emerging role for cytopathology in precision oncology. Cancer Cytopathol 124, 167–173. 10.1002/cncy.21647. [DOI] [PubMed] [Google Scholar]
- 91.Butler A, Hoffman P, Smibert P, Papalexi E, and Satija R. (2018). Integrating single-cell transcriptomic data across different conditions, technologies, and species. Nat Biotechnol 36, 411–420. 10.1038/nbt.4096. [DOI] [PMC free article] [PubMed] [Google Scholar]
- 92.Chan-Seng-Yue M, Kim JC, Wilson GW, Ng K, Figueroa EF, O’Kane GM, Connor AA, Denroche RE, Grant RC, McLeod J, et al. (2020). Transcription phenotypes of pancreatic cancer are driven by genomic events during tumor evolution. Nature Genetics 52, 231–240. 10.1038/s41588-019-0566-9. [DOI] [PubMed] [Google Scholar]
- 93.Aibar S, González-Blas CB, Moerman T, Huynh-Thu VA, Imrichova H, Hulselmans G, Rambow F, Marine J-C, Geurts P, Aerts J, et al. (2017). SCENIC: single-cell regulatory network inference and clustering. Nature Methods 14, 1083–1086. 10.1038/nmeth.4463. [DOI] [PMC free article] [PubMed] [Google Scholar]
- 94.Van de Sande B, Flerin C, Davie K, De Waegeneer M, Hulselmans G, Aibar S, Seurinck R, Saelens W, Cannoodt R, Rouchon Q, et al. (2020). A scalable SCENIC workflow for single-cell gene regulatory network analysis. Nature Protocols 15, 2247–2276. 10.1038/s41596-020-0336-2. [DOI] [PubMed] [Google Scholar]
- 95.Martin M. (2011). Cutadapt removes adapter sequences from high-throughput sequencing reads. 2011 17, 3. 10.14806/ej.17.1.200. [DOI] [Google Scholar]
- 96.Li H. (2013). Aligning sequence reads, clone sequences and assembly contigs with BWA-MEM. arXiv: Genomics. [Google Scholar]
- 97.Van der Auwera GAOC, B. D. (2020). Genomics in the cloud : using Docker, GATK, and WDL in Terra, First edition Edition ( O’Reilly Media; ). [Google Scholar]
- 98.Robinson JT, Thorvaldsdóttir H, Wenger AM, Zehir A, and Mesirov JP (2017). Variant Review with the Integrative Genomics Viewer. Cancer Res 77, e31–e34. 10.1158/0008-5472.Can-17-0337. [DOI] [PMC free article] [PubMed] [Google Scholar]
- 99.Liao Y, Wang J, Jaehnig EJ, Shi Z, and Zhang B. (2019). WebGestalt 2019: gene set analysis toolkit with revamped UIs and APIs. Nucleic Acids Res 47, W199–W205. 10.1093/nar/gkz401. [DOI] [PMC free article] [PubMed] [Google Scholar]
Associated Data
This section collects any data citations, data availability statements, or supplementary materials included in this article.
Supplementary Materials
Table S2: DE list of scRNA-seq analysis. Related to Figure 5.
Data Availability Statement
scRNA-seq data is available from the GEO repository database, accession number GSE207352.
The code for scRNA-seq analysis is available at https://https://github.com/shuibingchen/PDAC_KRAS DOI:10.5281/zenodo.10141439
Any additional information required to reanalyze the data reported in this paper is available from the lead contact upon request.