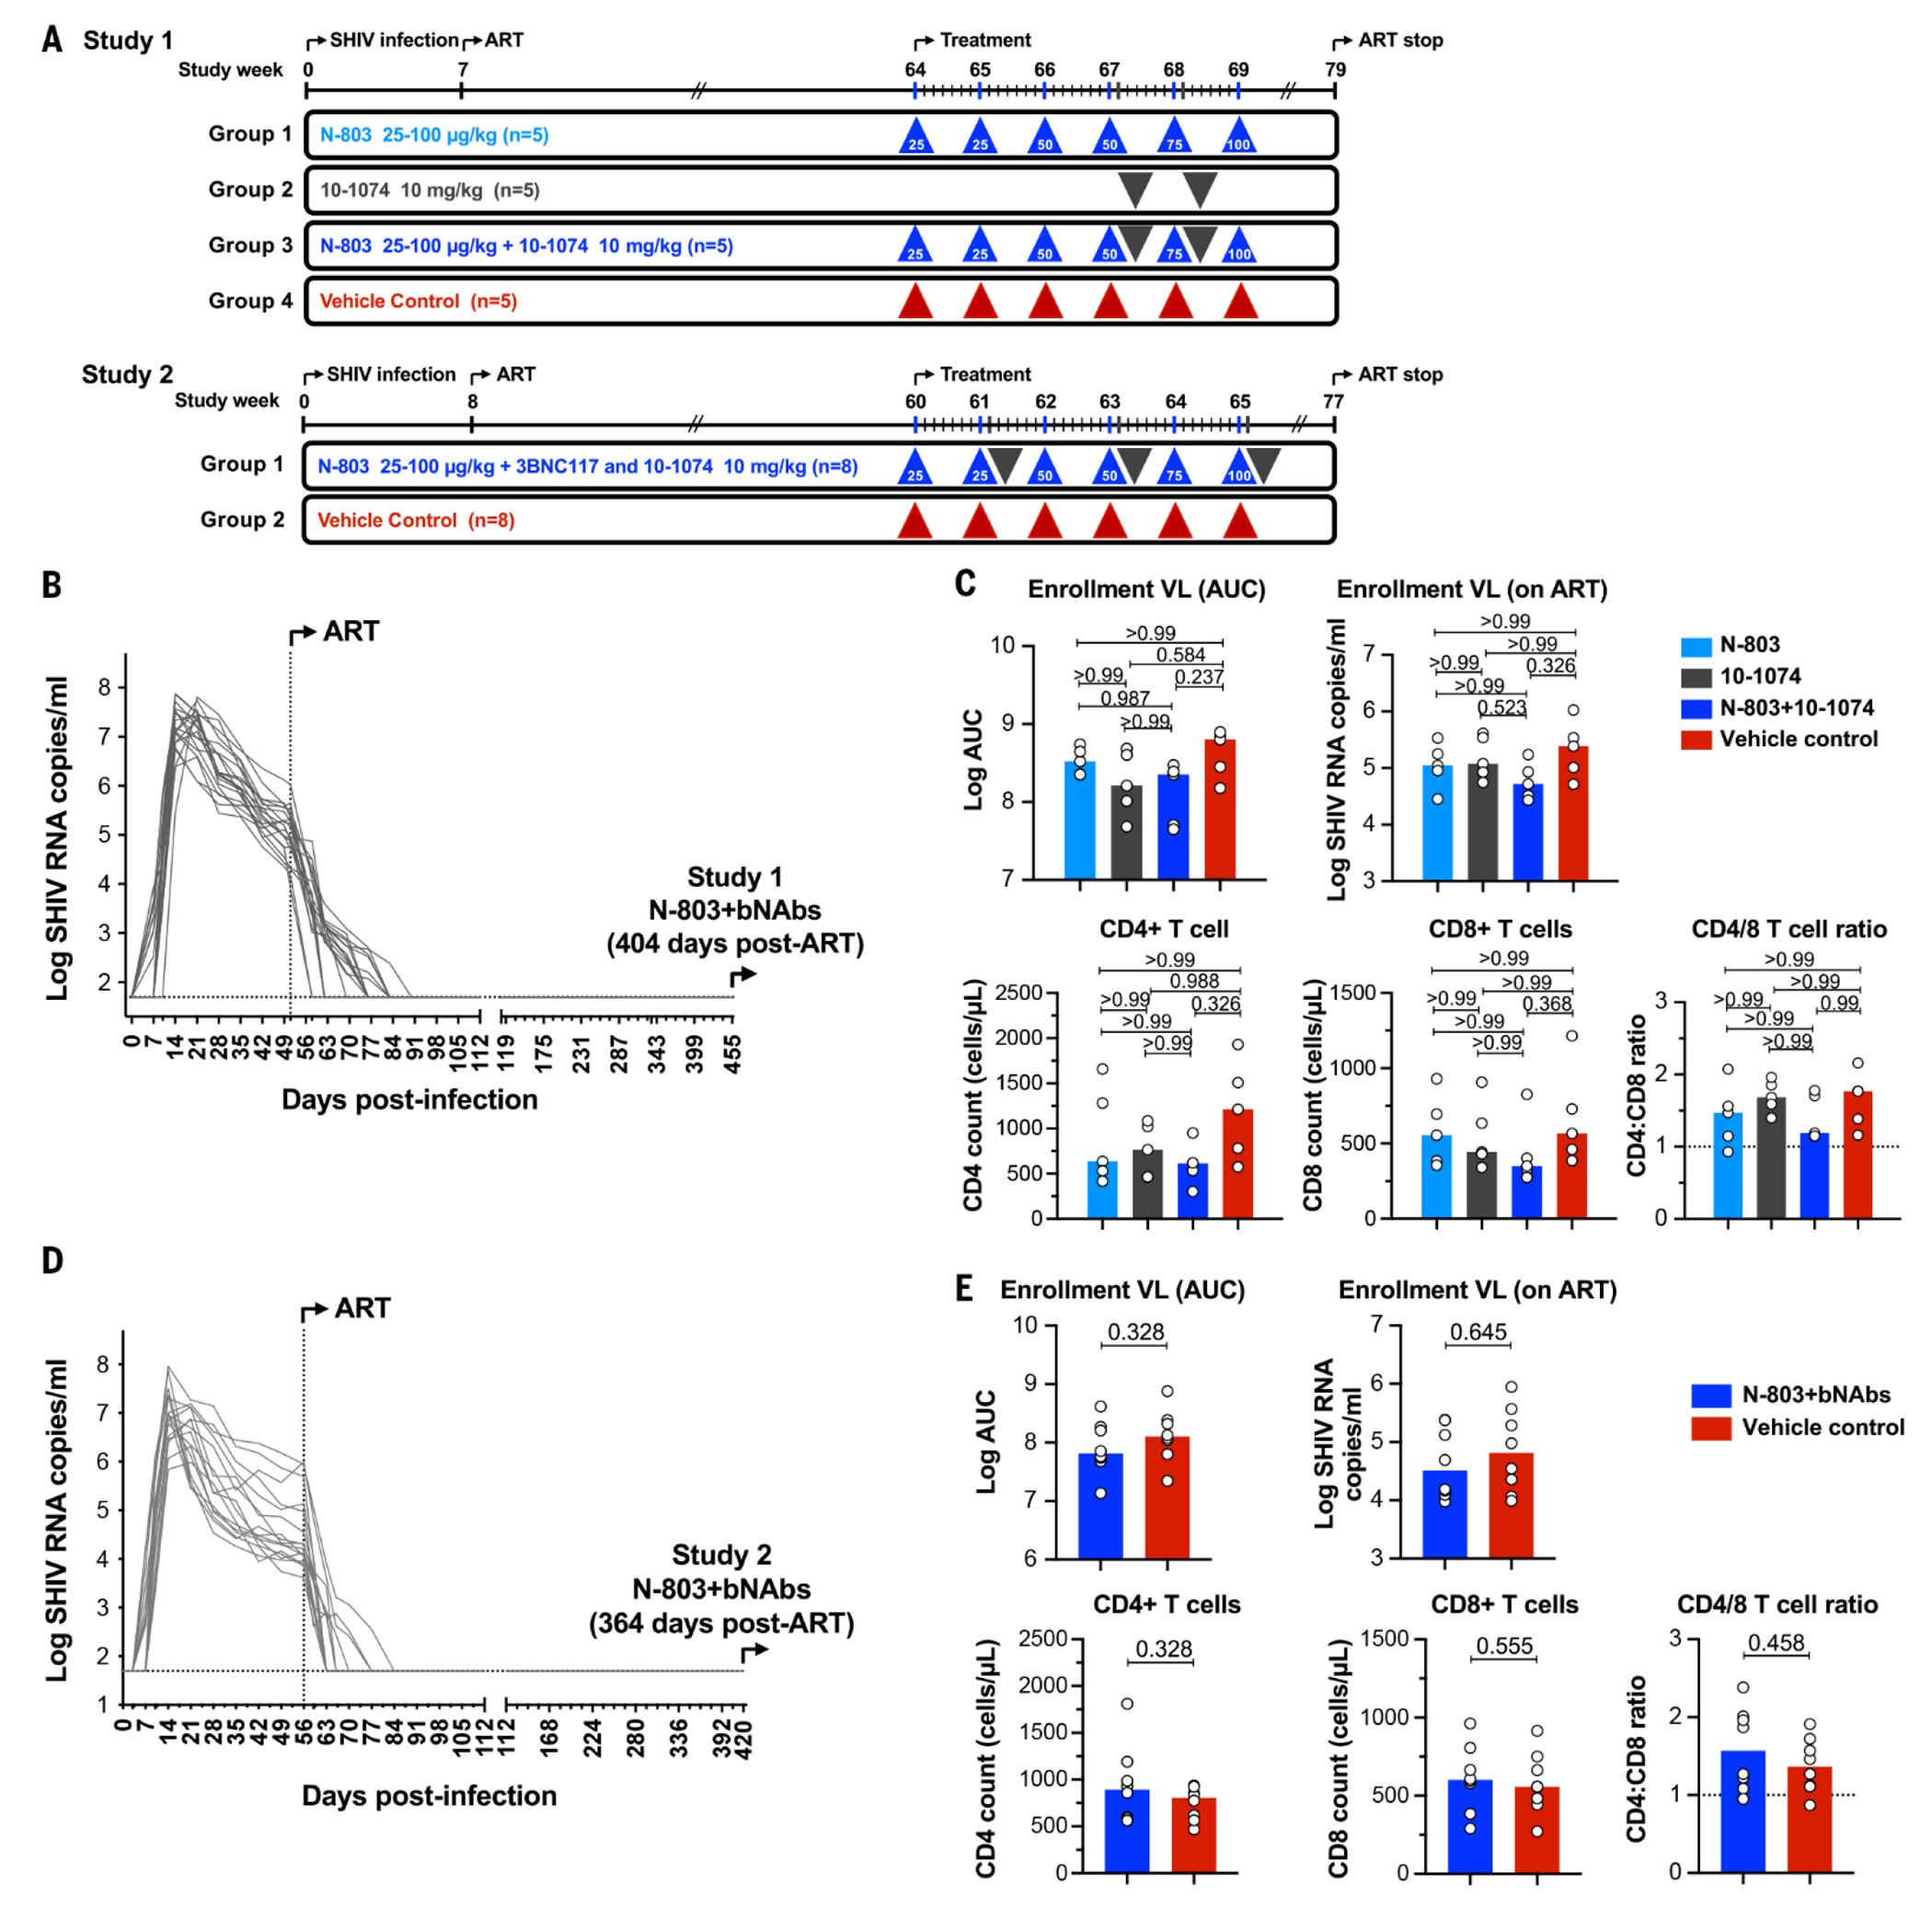
Fig. 1. Study schema of N-803 and bNAb dosing.

Diagrammatic overview of each study is shown. In Study 1, Groups 1, 2, and 3 (n=5 per group) received N-803 alone, 10-1074 alone, or N-803+10-1074, respectively. Group 4 (n=5) received vehicle alone as a control. N-803 was dose-escalated in Groups 1 and 3 with weekly SC administration. Two doses of 10-1074 at 10 mg per kilogram of body weight were administered IV in groups 2 and 3, 1 week apart. In Study 2, the treatment group (n=8) received N-803 in combination with 10-1074+3BNC117. N-803 was dosed at the same concentration and frequency as used in Study 1. Three doses of 10-1074+3BNC117 were administered EOW starting 24 hours after the second N-803 dose. Control group (n=8) received formulation vehicle only. (A) The schedule for SHIV-AD8 infection, ART initiation, therapeutic treatment and discontinuation of ART are shown as vertical lines (in weeks). (B) In Study 1, viral RNA was monitored in longitudinally from the day of SHIV-AD8 infection to the initiation of N-803+bNAb therapy. Twenty SHIV-infected ART-suppressed animals were then distributed into three experimental groups and one control group (n=5 per group). (C) Animals were distributed among groups by balancing virologic and immunologic metrics. Plots show the median values The comparison between groups was determined using a Kruskal–Wallis H test. P-values are adjusted for multiple comparisons. (D). In Study 2, viral RNA was monitored in RMs from the day of SHIV-AD8 infection to the initiation of N-803 and bNAb therapy. Sixteen SHIV-infected ART-suppressed RMs were then assigned to experimental and control groups (n=8 per group). (E) Animals were distributed among groups by balancing viral and immunologic parameters. Plots show the median with all values. Comparisons between groups were determined using a Mann–Whitney U test.
