Abstract
Background:
Existing measures of frailty developed in community dwelling older adults may misclassify frailty in lung transplant candidates. We aimed to develop a novel frailty scale for lung transplantation with improved performance characteristics.
Methods:
We measured the Short Physical Performance Battery (SPPB), Fried Frailty Phenotype (FFP), body composition, and serum biomarkers representative of putative frailty mechanisms. We applied a four-step established approach (identify frailty domain variable bivariate associations with the outcome of waitlist delisting or death; build models sequentially incorporating variables from each frailty domain cluster; retain variables that improved model performance ability by c-statistic or AIC) to develop three candidate “Lung Transplant Frailty Scale (LT-FS)” measures: one incorporating readily available clinical data; one adding muscle mass, and one adding muscle mass and research-grade biomarkers. We compared construct and predictive validity of LT-FS models to the SPPB and FFP by ANOVA, ANCOVA, and Cox proportional-hazard modeling.
Results:
In 342 lung transplant candidates, LT-FS models exhibited superior construct and predictive validity compared to the SPPB and FFP. The addition of muscle mass and biomarkers improved model performance. Frailty by all measures was associated with waitlist disability, poorer HRQL, and waitlist delisting/death. LT-FS models exhibited stronger associations with waitlist delisting/death than SPPB or FFP (C-statistic range: 0.73-0.78 versus 0.57 and 0.55 for SPPB and FFP, respectively). Compared to SPPB and FFP, LT-FS models were generally more strongly associated with delisting/death and improved delisting/death net reclassification, with greater improvements with increasing LT-FS model complexity (range: 0.11-0.34). For example, LT-FS-Body Composition Hazard Ratio for delisting/death: 6.0 (95%CI: 2.5, 14.2), SPPB HR: 2.5 (95%CI: 1.1, 5.8), FFP HR: 4.3 (95%CI: 1.8, 10.1). Pre-transplant LT-FS frailty, but not SPPB or FFP, was associated with mortality after transplant.
Conclusions:
The LT-FS is a disease-specific physical frailty measure with face and construct validity that has superior predictive validity over established measures.
Introduction:
In recent years, frailty has emerged as clinically relevant predictor of disability, poor health-related quality of life (HRQL), peri-operative complications, and death before and after lung and other solid organ transplantation.1–8 Interest in applying frailty in the candidacy evaluation process is growing and, the most recent international consensus document on the selection of lung transplant candidates notes that a full candidacy evaluation should include an assessment of frailty.9
Despite the rapid integration of frailty assessment into transplant evaluation, at least six different operational measures of frailty are used across solid organ transplant groups.10 This inconsistency reflects the broader frailty literature in which a conceptual definition of frailty is agreed upon but a consensus regarding the best operational measure of frailty does not exist.11–14 Importantly, existing measures were developed decades ago in community-dwelling older adults and their generalizability to those with advanced lung disease is incompletely defined, particularly as disability from end stage lung disease may impact frailty metrics.11,12
The implications of including frailty assessments as part of the evaluation process for lung transplantation are profound and, at minimum, require a measure with acceptable face, construct, and predictive validity. Consensus statements and opinion leaders in geriatrics and solid organ transplantation recognize that measures of frailty will evolve and suggest that biomarkers and anthropomorphic measures that reflect the underlying pathobiology of frailty could further improve measurement validity.10,15–17 Herein, we report a novel physical Frailty Scale designed for advanced lung disease and transplantation. The online supplement contains additional details on Methods, Results, and Discussion.
Methods:
Study design
We analyzed participants in the multicenter observational Lung Transplant Body Composition (LTBC) cohort study. LTBC focuses on physical frailty, a specific, more circumscribed subtype of frailty.15 This analysis included candidates for lung transplant age ≥18 years at the UCSF, Columbia University Medical Center (CUMC), and the University of Pennsylvania (Penn) enrolled between June 2017 and May 2021. Center Institutional Review Boards approved this study.
Conceptual approach to Lung Transplant-Frailty Scale (LT-FS) measure development:
Existing frailty measures were developed by first defining relevant conceptual domains and then selecting operational measures that reflected these domains. Advances in geroscience have identified multiple potential mechanisms causing frailty including chronic inflammation, immune senescence, endocrine dysregulation, sarcopenia, and adiposity.18,19 For this study and before enrollment began, we first defined the conceptual domains of frailty—including biomarkers that reflect contemporary putative mechanisms—and then identified candidate operational domain measures based on the extant literature. When faced with more than one candidate measure, we favored the one most feasible to collect clinically. For example, we quantified body composition by bioelectrical impedance based on our prior work that identified cost, availability, transportation, and repeatability barriers to methods such as CT, dual x-ray absorptiometry (DXA), or MRI.1,20–22 We did not include measures of cognitive or social frailty as they are not generally considered to be components of physical frailty15 and clinical criteria for transplant generally exclude patients with significant cognitive impairments or who are socially isolated. Although frailty is, by definition, multidimensional, we did not a priori set a minimum (beyond one) number of domains for our index. In frailty, the term “index” is commonly associated with Rockwood’s Frailty Index.23 “Index”, however, refers simply to a composite measure and existing frailty indices include as few as three domains.24 Supplemental Table 1 lays out the conceptual frailty domains and candidate operational measures collected.
Established measures of frailty:
To test whether we could improve physical frailty quantification, we collected commonly studied measures in lung disease. These included the Short Physical Performance Battery (SPPB) and the Fried Frailty Phenotype (FFP).25–27 In LTBC, we use the FFP-DASI, a modification we developed with superior validity in lung transplantation compared to the original.28 We defined frailty as SPPB scores ≤9 and FFP scores ≥3.
Measurement of candidate novel operational measures of frailty domains
Body composition:
We quantified skeletal muscle mass (Appendicular Skeletal Muscle Index [ASMI]) and percent body fat by bioelectrical impedance analysis using the InBody S10 (InBody USA, Cerritos, CA).20,29–31 We measured grip strength using a handheld dynamometer (Stoelting, Wood Dale, IL).
Serum biomarkers:
Recent work reviewed 44 candidate biomarkers of frailty that are associated with “hallmarks of aging pathways”.32 We narrowed this list to 12 biomarkers representative of key pathophysiologic pathways and plausible factors in lung disease and transplant (Table 1). Selected pathways included systemic inflammation, innate immune activation, epithelial mesenchymal transition and mitochondrial stress, cytoskeletal hormones/mitochondrial activity, and adipokines/exerkines.
Table 1.
Baseline characteristics
| No. of subjects | 342 |
| Female | 159 (46.5) |
| Age, IQR | 61.0 [52.0, 67.0] |
| Race | |
| White | 226 (66.1) |
| Black | 25 (7.3) |
| Hispanic | 56 (16.4) |
| Other | 35 (10.2) |
| Diagnosis category | |
| A (e.g. Obstructive lung disease) | 60 (17.5) |
| B (e.g. Pulmonary Hypertension) | 23 (6.7) |
| C (e.g. Suppurative lung disease) | 24 (7.0) |
| D (e.g. Pulmonary Fibrosis) | 235 (68.7) |
| Hemoglobin (g/dL) | 12.8 ± 2.0 |
| Creatinine (mg/dL) | 0.8 ± 0.2 |
| Albumin (g/dL) | 3.9 ± 0.6 |
| FVC % predicted | 51.4 ± 17.9 |
| 6MWD (m) | 256.5 ± 116.2 |
| LAS at frailty evaluation | 43.0 ± 13.0 |
| Pre-transplant SPPB | 9.3 ± 3.1 |
| Pre-transplant FFP | 2.0 [1.0, 3.0] |
| Body composition measures | |
| BMI (kg/m2) | 26.1 ± 4.5 |
| ASMI, female | 6.5 ± 1.2 |
| ASMI, male | 8.1 ± 1.2 |
| Grip strength, female (kg) | 20.1 ± 7.3 |
| Grip strength, male (kg) | 32.4 ± 9.3 |
| Percent body fat, female | 34.9 ± 10.4 |
| Percent body fat, male | 27.8 ± 8.3 |
| Biomarkers | |
| IL-6 (pg/ml) | 2.3 [1.4, 4.1] |
| TNF-alpha (pg/ml) | 1.5 [1.2, 2.0] |
| TNF-R1 (pg/ml) | 1412.8 [1142.2, 1788.7] |
| PTX-3 (pg/ml) | 2558.5 [1624.6, 3972.6] |
| CRP (mg/l) | 8.7 [3.6, 21.9] |
| IL-1 RA (pg/ml) | 351.0 [242.0, 514.2] |
| IP-10 (pg/ml) | 386.0 [252.4, 576.2] |
| GDF-15 (pg/ml) | 2447.5 [1519.0, 3499.9] |
| FGF-21 (pg/ml) | 920.4 [477.0,1724.9] |
| FGF-23 (pg/ml) | 48.1 [32.5, 86.6] |
| IGF-1 (pg/ml) | 35.9 [2.7, 421.9] |
| Vimentin (pg/ml) | 1608.5 [1138.0, 2105.0] |
| Leptin (pg/ml) | 11235.9 [3375.6, 25037.6] |
| Apelin (pg/ml) | 477.8 [315.8, 763.3] |
Diagnostic indication for transplantation was groupings in the Lung Allocation Score 33. Data presented as mean ± SD, n (%), or median [interquartile range]. SPPB = Short Physical Performance Battery, FFP= Fried Frailty Phenotype, IL-6 = Interleukin 6, IP-10 = interferon-inducible protein 10, TNFa = Tumor necrosis factor alpha; TNF-R1 = TNF receptor-1; IL-1Ra = Interleukin-1 receptor antagonist; PTX-3 = Pentraxin-3; CRP = C-reactive protein; GDF-15 = Growth differentiation factor 15, vimentin, FGF-21 = Fibroblast growth factor 21; FGF-23 = Fibroblast growth factor-23; IGF-1 = Insulin like Growth Factor-1
Serum concentrations of these biomarkers were determined using the Meso-Scale Discovery (MSD) platform assays (Meso-Scale Diagnostics, LLC, Rockville, MD) with single samples. Serum albumin (malnutrition/inflammation), hemoglobin (anemia), and creatinine (multiple pathways) were abstracted from the electronic medical record.
Frailty assessments, measures of body composition, and venous blood collection were performed during the evaluation process near the time of placement on the waitlist for transplant. Assessments were repeated, as possible, every three months while participants were listed. Those assessments most proximal to the time of transplant were used for this analysis.
Baseline demographics and clinical variables were extracted from the electronic medical record at the time of frailty assessment. These variables included age, race, body mass index, pulmonary diagnosis category used for Lung Allocation Score (LAS) calculation33, serum hemoglobin, creatinine, and albumin, lung function, six minute walk distance, and LAS at the time of frailty assessment.
Outcome measures:
Delisting for becoming too ill to safely undergo transplant as determined by the clinical transplant team or death before transplant was considered as a composite outcome consistent with our previous work.1
Disability was quantified with the Lung Transplant Valued Life Activities Scale (LT-VLA).34 The LT-VLA has a range of 0-3; higher scores reflect worse disability.
Health-related Quality of Life (HRQL) was assessed by Medical Outcomes Study Short Form-12 Physical Component Summary Scale (SF12-PCS). Higher scores denote better HRQL.35,36
Early post-operative outcomes included hospital length of stay (LOS), and death within the first post-operative year.
Statistical approach:
Frailty is, by definition, multidimensional. Thus, a novel instrument should include items from at least two frailty domains (i.e., a composite measure or index). After defining our candidate operational measures (referred to now as “variables”) of frailty domains, we applied an established approach to index development.37
Step 1: To maximize precision with the number of events available, we used a composite outcome of waitlist delisting or death before or after transplant to identify threshold (cut-point) levels for non-binary variables. Where available, we used established clinical thresholds (e.g., albumin ≤3.5 g/dL39,40, CRP ≥10 mg/L). We applied receiver operating curve (ROC) analysis to existing scored components (e.g., SPPB and FFP domains such as gait speed, chair stands, grip strength) to determine the best cut-points balancing sensitivity and specificity. For laboratory and body composition variables, where clinical thresholds were lacking, we used the upper/lower quartile of the distribution. For variables with different distributions by sex (e.g., grip strength, body composition), the upper/lower quartile by sex was used. After defining cut-points, we examined the univariate association between each variable and waitlist delisting/death. Variables with potentially meaningful associations moved to the next step (e.g., p 0.10)
Step 2: We developed candidate multivariable Lung Transplant Frailty Scales (LT-FSs). While our primary aim was accuracy of frailty measurement, an unwieldy instrument will have limited clinical utility. Findings from Step 1 suggested we had the potential to test three candidate LT-FSs: one that could be captured from routine clinical encounter data, including clinical labs (deemed LT-FS-Base); one that included measures of body composition (LT-FS-Body Composition); and a comprehensive index that included novel biomarkers to be leveraged for advancing frailty research (LT-FS-Biomarker).
Building operational models of syndromic concepts is not solely driven by quantitative methods. First, to begin constructing the “base” model, we began by retaining variables representing core physical frailty domains clusters that have consensus in geriatrics and are represented across existing instruments (i.e., measures of muscle strength, gait speed). Next, we considered variables from each of the other clusters (clinical labs, body composition, and novel blood-based biomarkers) were added to the base model sequentially. We computed logistic regression analyses for each model using delisting/death as the outcome. Variables in each cluster that did not make a meaningful contribution to the model were dropped from further consideration. Meaningful contributions were defined by increasing c-statistics and/or decreasing Akaiki Information Criteria [AIC]. Clusters were added cumulatively (e.g., body composition variables were tested and added to the base model that included frailty core variables and standard labs). All modeling followed this a priori defined method; algorithmic approaches such as backward or forward stepwise regression were not used.
Step 3: We followed established methods to develop frailty scores for each LT-FS model by multiplying the value of the retained variable by its adjusted beta estimate. We examined performance characteristics of each frailty score (e.g., mean scores, ranges, associations with delisting/death by logistic regression models, and model AUC for delisting/death).24
Step 4: Binary cut-points for each LT-FS model to define “frailty” were determined using ROC analyses. We determined sensitivity, specificity, as well as the % frail by each criterion; the % of frail and % of non-frail delisted/died and AUC.
After defining the final LT-FS measures, we compared convergent, divergent, and predictive validity of the measures with SPPB and FFP-DASI. We tested LT-FS, SPPB, and FFP measures’ concurrent validity with pre-operative disability and HRQL by one-way analysis of variance (ANOVA) or analysis of covariance (ANCOVA) and predictive validity with pre-operative delisting/death and post-operative hospital length of stay, and one-year post-transplant mortality by one–way ANOVA or ANCOVA and Cox proportional hazards modeling. For Cox proportional hazard models, the assumption of non-proportionality was tested using Schoenfeld residuals.38 We did not have sufficient events to evaluate the association between FFP and 1-year mortality after transplant by Cox modeling nor test model assumptions. For delisting/death, we also calculated the overall Net Reclassification Index by LT-FS models compared to the SPPB and FFP.39 For disability, HRQL and hospital LOS, we adjusted for age, sex, race, diagnosis, and center. Given the limited number of events, for delisting/death and death after transplant, we adjusted for age, sex, and center.
Although some participants underwent more than one frailty assessment, we only quantified biomarkers in the visit most proximal to the date of transplant. To assess whether traditional frailty scores remained stable over time, in a post-hoc analysis, we used mixed-effects models among participants who underwent >1 frailty assessment before transplant. We used random intercepts to account for correlation among serial frailty assessments within the same participant. Analyses were performed using SAS (version 9.4, SAS Institute), and R (version 4.2.2, R Foundation).
Results:
Among the 551 LTBC participants who were listed for transplant during the study period during the study period, 342 had measures of frailty, body composition, and venous blood samples and made up the cohort for this analysis (Figure 1). Of the 342 participants, 159 (47%) were female, with a median age of 61 years (interquartile range [IQR], 52, 67) (Table 1); 265 (77%) underwent transplantation with a median follow-up time of 25.5 months [IQR: 15, 34.6 months]. The median time from frailty assessment to transplant surgery was 3.7 months (IQR: 1.3, 9.2). Frailty was prevalent by established measures (SPPB: 39% and FFP-DASI: 30%). 28 participants died or were delisted before transplant and 9 (3.4%) died within 1-year after transplant. During the waitlist period, 59 participants (17%) underwent >1 frailty assessment (range: 2-5). Amongst these participants, frailty scores remained relatively stable during the pre-operative period (change in SPPB: −0.03 (95% CI: −0.07, 0.01), p value: 0.19; change in FFP: 0.03, (95% CI: 0.01, 0.05), p value: <0.01 per month additional time on the waitlist)
Figure 1:
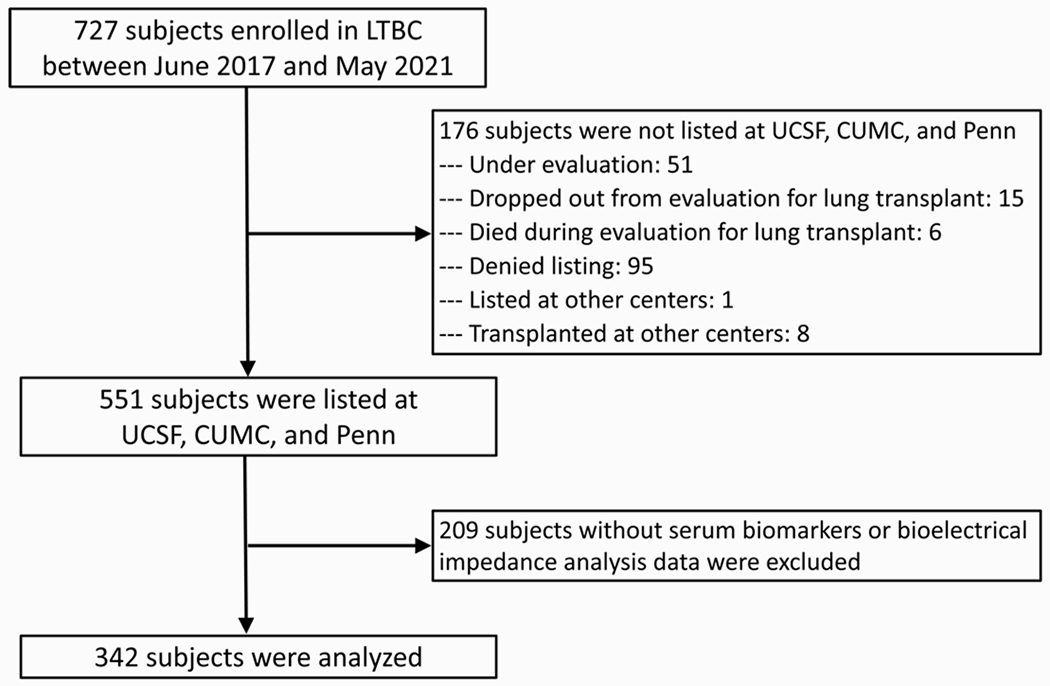
Study Flow
Bivariate analyses in Step 1 identified the relevance of multiple conceptual domains of frailty including traditional SPPB and FFP-DASI components, as well as measures of sarcopenia, adiposity, and multiple biomarkers reflecting key frailty pathophysiologic pathways. Table 2 details each candidate variable, its assigned cut point, and unadjusted association with death or delisting. Asterisks denote which variables were selected for the building of candidate multivariate indices.
Table 2.
Step 1: Bivariate results
| Cut point | OR (95% CI) | P | Moved to next step | |
|---|---|---|---|---|
| SPPB components | ||||
| Balance score | <3 | 2.73 (1.14, 6.54) | 0.02 | * |
| Gait score | <3 | 2.23 (1.06, 4,72) | 0.04 | * |
| Chair stand score | <3 | 1.31 (0.66, 2.60) | 0.44 | |
| FFP components | ||||
| Weight loss | 1 | 0.76 (0.31, 1.84) | 0.54 | |
| Inactive (DASI) | 1 | 0.83 (0.38, 1.81) | 0.64 | |
| Exhausted | 1 | 1.12 (0.49, 2.54) | 0.79 | |
| Weak grip | 1 | 1.94 (0.98, 3.87) | 0.06 | * |
| Slow gait | 1 | 2.11 (0.94, 4.72) | 0.07 | (Used SPPB gait because of higher OR) |
|
| ||||
| Standard labs | ||||
| Low hemoglobin | M<13.5; F<12 | 1.46 (0.74, 2.89) | 0.28 | |
| Low albumin | <3.5 | 2.09 (0.95, 4.60) | 0.07 | * |
| High CRP | ≥10 | 4.42 (2.02, 9.69) | <0.01 | * |
|
| ||||
| Body composition | ||||
| Obese, BMI | ≥30 | 0.69 (0.28, 1.72) | 0.42 | |
| Low BMI | <22.5 | 1.40 (0.66, 2.96) | 0.39 | |
| High % body fat | M>33.1; F>43.1 | 1.23 (0.58, 2.61) | 0.59 | |
| Low ASMI | M≤7.3; F≤5.8 | 2.41 (1.16, 5.02) | 0.02 | * |
|
| ||||
| Novel biomarkers | ||||
| High IGF-1 | ≥438.2 | 1.35 (0.63, 2.85) | 0.44 | |
| High FGF-21 | ≥1724.7 | 1.12 (0.52, 2.41) | 0.78 | |
| High FGF-23 | ≥86.6 | 1.47 (0.71, 3.07) | 0.30 | |
| High IL-1RA | ≥524.8 | 2.12 (1.04, 4.35) | 0.04 | * |
| High IL-6 | ≥4.17 | 3.64 (1.80, 7.34) | <0.01 | * |
| High IP-10 | ≥576.2 | 1.30 (0.61, 2.75) | 0.50 | |
| High TNFa | ≥2.0 | 0.90 (0.41, 2.00) | 0.80 | |
| High TNF R1 | ≥1805.9 | 2.42 (1.19, 4.93) | 0.01 | * |
| High pentraxin | ≥3989.6 | 1.53 (0.73, 3.19) | 0.26 | |
| High GDF-15 | ≥3492.2 | 2.17 (1.07, 4.39) | 0.03 | * |
| High vimentin | ≥2.1 | 0.69 (0.29, 1.64) | 0.40 | |
| High apelin | ≥757.2 | 0.80 (0.35, 1.83) | 0.60 | |
| Low Vimentin | ≤1.1 | 0.86 (0.38, 1.97) | 0.72 | |
| Low apelin | ≤319.3 | 2.51 (1.24, 5.07) | 0.01 | * |
The univariate association between each candidate Frailty Scale variable and waitlist death or delisting by logistic regression. Variables with potentially meaningful associations with the outcome were moved on to the next step (denoted by an asterisk)
In Step 2, we evaluated the three candidate LT-FS models. Table 3 presents the three models that moved forward to Step 3 along with their constituent individual variable associations with delisting/death when combined in the multivariate model. As the models increased in complexity, c-statistics increased and the AIC decreased.
Table 3.
Step 2: Logistic models for total scores
| Model | Variable | OR (95% CI) | C-statistic | AIC |
|---|---|---|---|---|
| LT-FS-Base | SPPB balance | 1.67 (0.57, 4.90) | 0.731 | 223.9 |
| FFP weak grip | 1.64 (0.80, 3.35) | |||
| SPPB gait | 1.27 (0.50, 3.23) | |||
| High CRP | 3.85 (1.73, 8.57) | |||
|
| ||||
| LT-FS-Body Composition | SPPB balance | 1.68 (0.57, 5.01) | 0.743 | 222.3 |
| FFP weak grip | 1.59 (0.78, 3.28) | |||
| SPPB gait | 1.11 (0.42, 2.90) | |||
| High CRP | 3.96 (1.77, 8.86) | |||
| Low ASMI | 2.15 (0.99, 4.68) | |||
|
| ||||
| LT-FS-Biomarker | SPPB balance | 1.24 (0.36, 4.23) | 0.777 | 221.1 |
| FFP weak grip | 1.35 (0.64, 3.34) | |||
| SPPB gait | 1.24 (0.46, 3.34) | |||
| High CRP | 3.15 (1.32, 7.54) | |||
| Low ASMI | 1.89 (0.83, 4.28) | |||
| High IL1RA | 1.53 (0.69, 3.41) | |||
| High IL-6 | 1.62 (0.69, 3.85) | |||
| High TNFr1 | 1.24 (0.54, 2.88) | |||
| High GDF-15 | 1.57 (0.69, 3.60) | |||
| Low apelin | 2.58 (1.19, 5.58) | |||
|
| ||||
| SPPB | N/A | 1.79 (0.90, 3.56) | 0.572 | 235.6 |
|
| ||||
| FFP | N/A | 1.60 (0.74, 3.45) | 0.552 | 204.2 |
Logistic models present the individual odds ratio in the setting of multivariate testing for final variables included in each LT-FS model. The c-statistic and Akaiki Information Criteria (AIC) are presented for each multivariate LT-FS model and, for comparison, frailty by SPPB (score ≤9) and FFP (score ≥3).
In Step 3, we developed unidimensional frailty scores for each LT-FS model and evaluated their performance characteristics (Table 4; Supplemental Table 3 provides the scoring formula for each model). As the models became increasingly complex with the addition muscle mass and novel biomarkers, the range of frailty scores naturally increased. Each one-unit increase in frailty scores across models was associated with an 11% increased risk of delisting/death (all p <0.0001). These point-estimates were similar those for the SPPB and FFP-DASI, however, the association between FFP-DASI and delisting/death was not statistically significant. The AUCs for delisting/death for LT-FS were generally higher than those for SPPB or FFP-DASI (Table 4).
Table 4.
Step 3: Weighted model scores
| Model | Mean ± SD | Score range | OR (95% CI) per point increase in score | AUC (95% CI) |
|---|---|---|---|---|
| LT-FS-Base | 19.2 ± 8.2 | 10 – 36.0 | 1.11 (1.06, 1.16) | 0.73 (0.66, 0.81) |
| LT-FS-Body Composition | 20.5 ± 8.9 | 10 – 42.4 | 1.11 (1.06, 1.15) | 0.74 (0.66, 0.82) |
| LT-FS-Biomarker | 24.6 ± 10.7 | 10 – 60.3 | 1.11 (1.07, 1.15) | 0.78 (0.69, 0.86) |
| Model | Mean ± SD | Score range | OR (95% CI) per point increase in score | AUC (95% CI) |
| SPPB | 9.3 ± 3.1 | 0 – 12 | 1.08 (0.98, 1.19) | 0.58 (0.48, 0.67) |
| FFP | 1.9 ± 1.2 | 0 – 5 | 1.12 (0.82, 1.53) | 0.55 (0.44, 0.66) |
Each variable in Step 2 models were multiplied by their parameter estimates estimated by logistic regression and combined to create an index score range. This table demonstrates the performance characteristic of each model score (e.g., mean scores, ranges, score associations with death and delisting by linear regression, and model area under the curves (AUC) for waitlist death and delisting. The same characteristics of the existing SPPB and FFP measures are presented for comparison. See http://lungtransplantfrailtyscale.ucsf.edu for an online calculator
In the final Step 4, we established cut-points for defining frailty and broadly evaluated their performance characteristics (Tables 5 and 6). All LT-FS models as well as SPPB and FFP were correlated with conceptually related factors in the directions expected (Supplemental Table 4). The magnitude of the correlations was weak, suggesting measures of frailty provide information distinct from what is routinely collected for clinical lung transplant candidacy.
Table 5.
Step 4. Cut-points, frailty criterion evaluation
| % (n) who were delisted/died | |||||||||
|---|---|---|---|---|---|---|---|---|---|
| Model | Cut-point | Sensitivity | Specificity | % frail | Not frail | Frail | AUC (95% CI) | NRI vs SPPB (95% CI) | NRI vs FFP (95% CI) |
| LT-FS-Base: most clinically scalable (frailty measures + routinely available labs) | |||||||||
| 23.5 | 0.54 | 0.76 | 27.5 | 6.9 (17) | 21.3 (20) | 0.65 (0.56, 0.73) | 0.16 (−0.02,0.33) p = 0.08 | 0.11 (−0.08,0.30) p = 0.25 | |
| LT-FS-Body Composition: Model 1 plus body composition: low ASMI | |||||||||
| 23.9 | 0.65 | 0.71 | 32.8 | 5.7 (13) | 21.4 (24) | 0.68 (0.60, 0.76)*, ** | 0.22 (0.02, 0.41) p = 0.03 | 0.20 (−0.02,0.42) p = 0.08 | |
| LT-FS-Biomarker: Model 2 plus research-based novel biomarkers | |||||||||
| 28.2 | 0.78 | 0.70 | 35.4 | 3.6 (8) | 24.0 (29) | 0.74 (0.67, 0.81)*** | 0.34 (0.12, 0.56) p = 0.005 | 0.34 (0.12,0.56) p = 0.008 | |
| % (n) who were delisted/died | |||||||||
| Model | Cut point | Sensitivity | Specificity | % frail | Not frail | Frail | AUC (95% CI) | ||
|
| |||||||||
| SPPB | <=9 | 0.51 | 0.63 | 38.6 | 8.6 (18) | 14.4 (19) | 0.57 (0.49, 0.66) | ||
| FFP | >=3 | 0.39 | 0.72 | 29.4 | 8.7 (19) | 13.2 (12) | 0.55 (0.46, 0.64) | ||
SPPB = Short Physical Performance Battery; FFP = Fried Frailty Phenotype; AUC = area under the curve; NRI = Net Reclassification Index Binary cut-points for each model to define “frailty” were determined using ROC analyses. Youden, Distance to Perfect, and Balance criteria were used to define frailty cut-points. Based on cut-points, this Table demonstrates sensitivity, specificity, as well as the % frail by each criterion, % of frail and not frail that were delisted before transplant or died before or within 1 year after transplant and the area under the curve (AUC) of frailty models.
p-value for AUC comparison with SPPB = 0.07;
p-value for AUC comparison with FFP = 0.04;
p-value for AUC comparison with SPPB and FFP <= 0.003.
Table 6.
Association between LT-FS, SPPB, and FFP frailty measures and outcomes before and after lung transplantation
| Pre-transplant outcomes | Post-transplant outcomes | ||||
|---|---|---|---|---|---|
| Model | Difference in LT-VLA disability | Difference in SF12-PCS HRQL | Hazard ratio for delisting/death | Difference in hospital LOS (days) | Hazard ratio for 1-year mortality |
| LT-FS-Base | 0.22 (0.06, 0.39) (p = 0.01) | −1.9 (−4.4, 0.6) (p = 0.14) | 4.2 (1.9, 9.5) (p < 0.01) | 4.4 (−5.0, 13.7) (p = 0.36) | 5.9 (1.5, 23.5) (p = 0.01) |
| LT-FS-Base adjusted | 0.25 (0.08, 0.41) (p < 0.01) | −1.9 (−4.5, 0.6) (p = 0.14) | 4.5 (2.0, 10.1) (p < 0.01) | 4.7 (−4.9, 14.2) (p = 0.34) | 5.7 (1.4, 23.0) (p = 0.01) |
|
| |||||
| LT-FS-Body Composition | 0.24 (0.09, 0.40) (p < 0.01) | −2.5 (−4.9, −0.1) (p = 0.04) | 5.6 (2.4, 13.0) (p < 0.01) | 4.2 (−4.7, 13.2) (p = 0.35) | 4.7 (1.2, 18.8) (p = 0.03) |
| LT-FS-Body Composition adjusted | 0.26 (0.11, 0.42) (p < 0.01) | −2.5 (−4.9, 0.01) (p = 0.05) | 6.0 (2.5, 14.2) (p < 0.01) | 4.8 (−4.4, 14.0) (p = 0.31) | 4.6 (1.1, 18.4) (p = 0.03) |
|
| |||||
| LT-FS-Biomarker | 0.27 (0.12, 0.42) (p < 0.01) | −2.7 (−5.0, −0.4) (p = 0.02) | 10.7 (4.0, 28.7) (p < 0.01) | 3.4 (−5.2, 12.1) (p = 0.44) | 6.9 (1.4, 33.3) (p = 0.02) |
| LT-FS-Biomarker adjusted | 0.29 (0.13, 0.44) (p < 0.01) | −2.4 (−4.8, 0.04) (p = 0.05) | 11.0 (4.1, 29.8) (p < 0.01) | 3.9 (−5.2, 13.1) (p = 0.40) | 6.8 (1.4, 32.9) (p = 0.02) |
|
| |||||
| SPPB | 0.43 (0.29, 0.57) (p < 0.01) | −4.7 (−6.9, −2.4) (p < 0.01) | 2.6 (1.2, 5.9) (p = 0.02) | 5.5 (−3.0, 14.0) (p = 0.20) | 1.4 (0.4, 5.0) (p = 0.65) |
| SPPB adjusted | 0.41 (0.26, 0.55) (p < 0.01) | −4.5 (−6.8, −2.3) (p < 0.01) | 2.5 (1.1, 5.8) (p = 0.03) | 6.5 (−2.4, 15.4) (p = 0.15) | 1.5 (0.4, 6.0) (p = 0.58) |
|
| |||||
| FFP | 0.65 (0.51, 0.79) (p < 0.01) | −5.6 (−7.9, −3.3) (p < 0.01) | 4.2 (1.8, 10.0) (p < 0.01) | 6.3 (−3.4, 16.0) (p = 0.20) | Inadequate events to analyze |
| FFP adjusted | 0.61 (0.47, 0.76) (p < 0.01) | −5.0 (−7.4, −2.6) (p < 0.01) | 4.3 (1.8, 10.1) (p < 0.01) | 8.4 (−1.8, 18.5) (p = 0.11) | Inadequate events to analyze |
LT-FS = Lung Transplant Frailty Scale, SPPB = Short Physical Performance Battery, FFP = Fried Frailty Phenotype; LT-VLA = Lung Transplant Valued Life Activities scale, SF12-PCS = Medical Outcomes Survey Short Form 12-Physical Component Summary Scale, LOS = length of stay
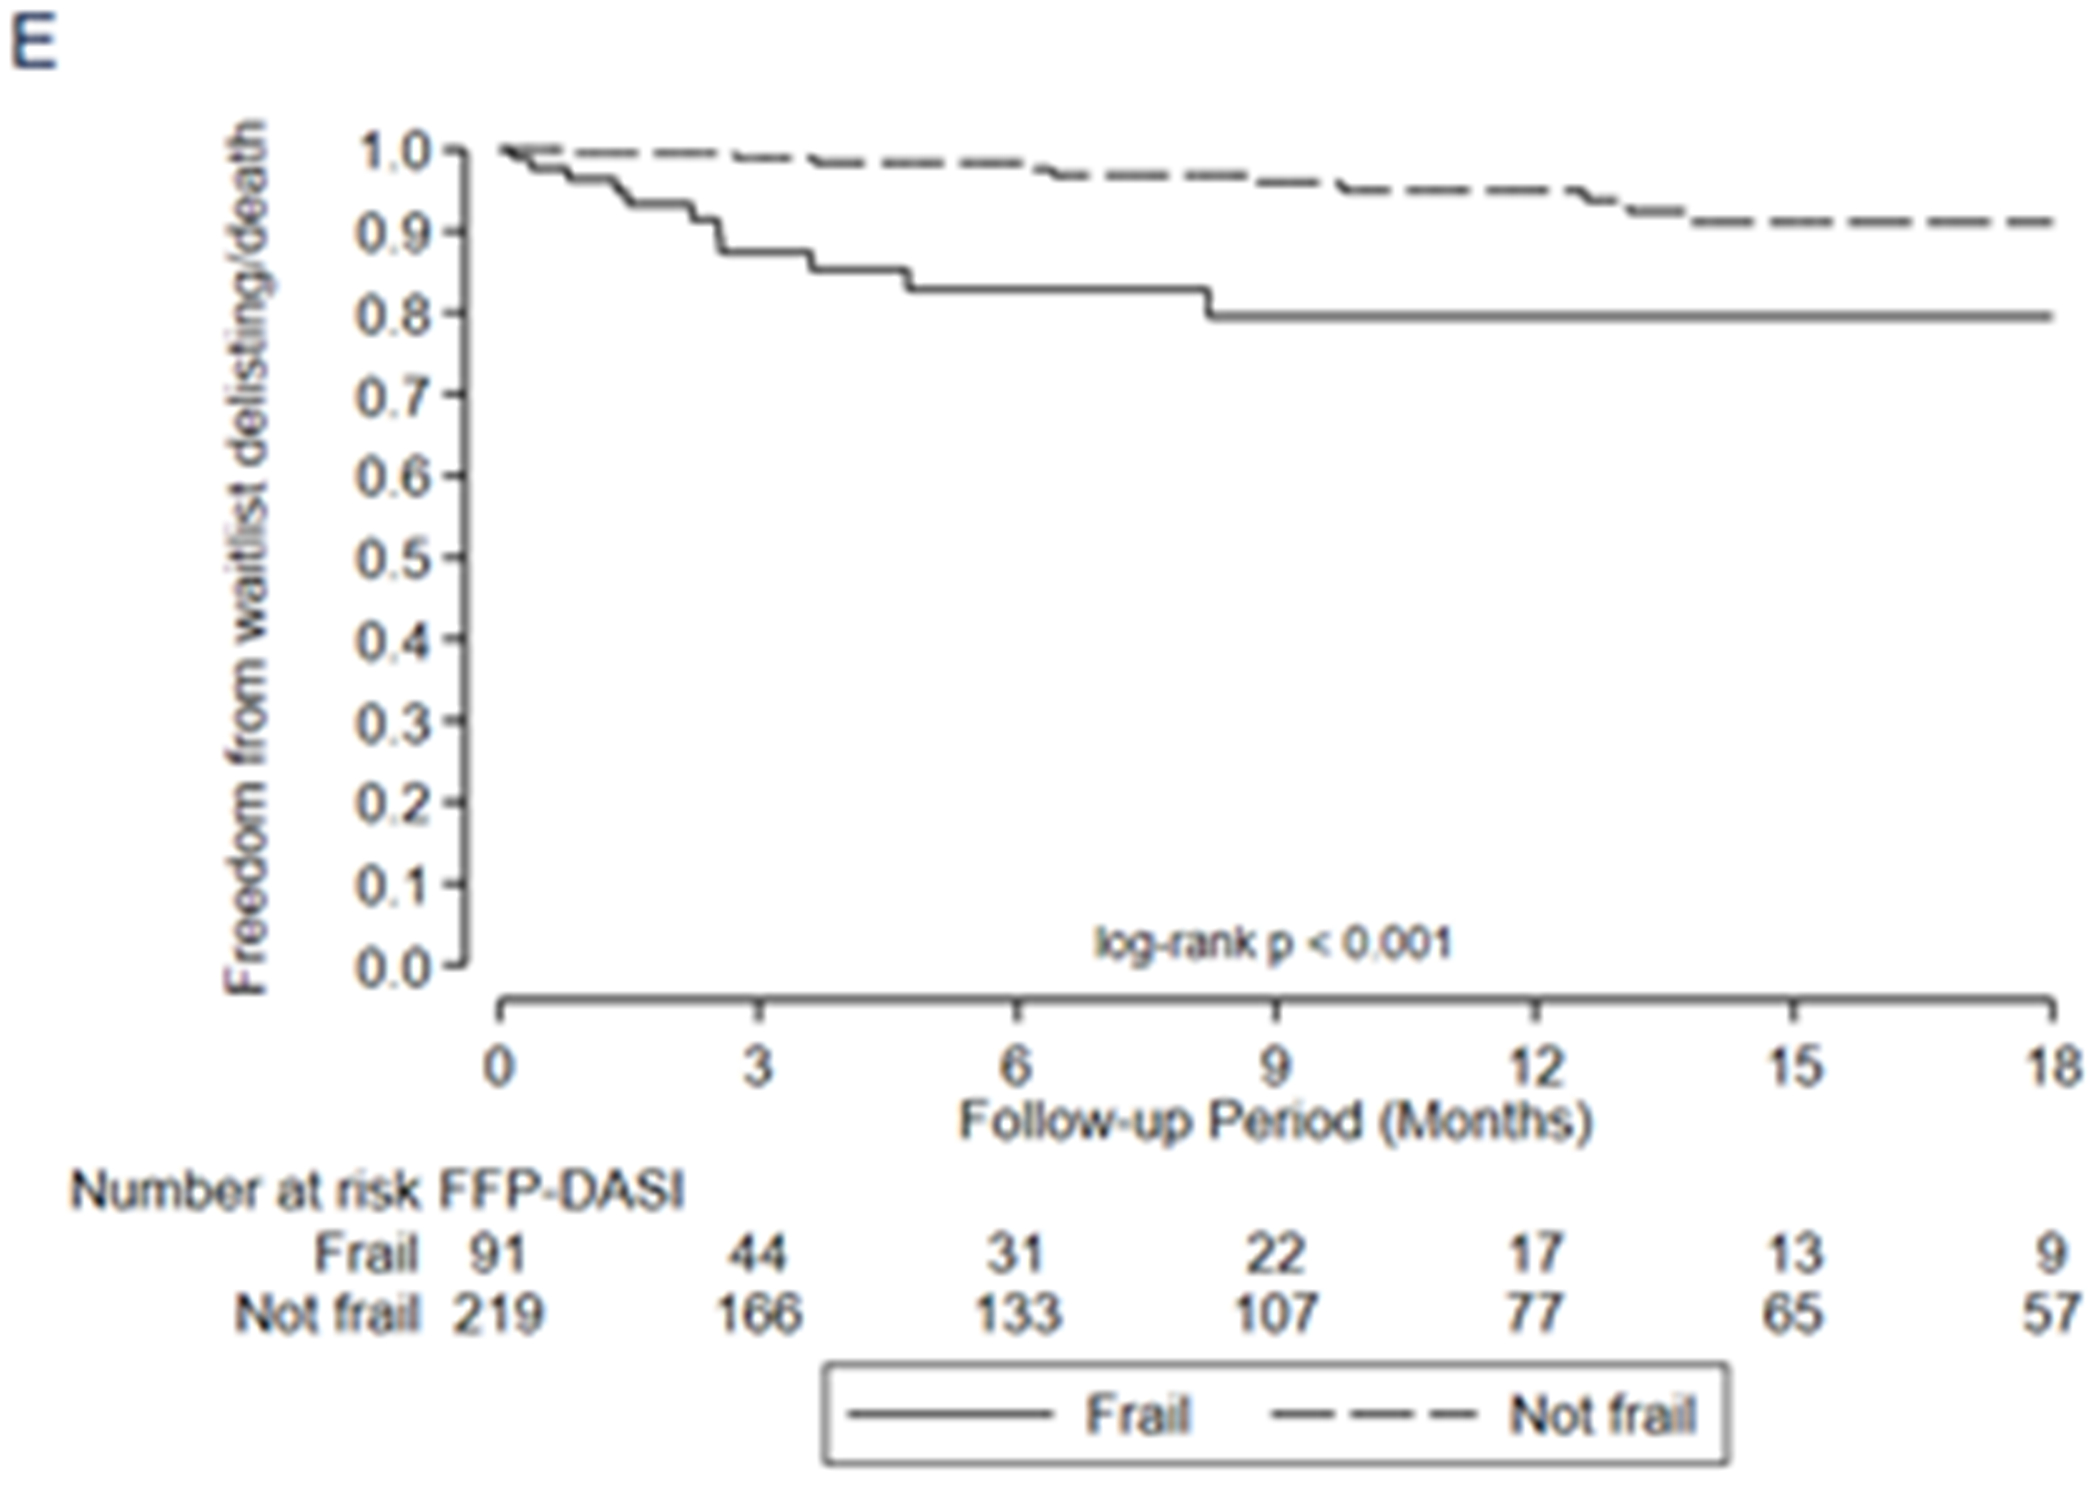
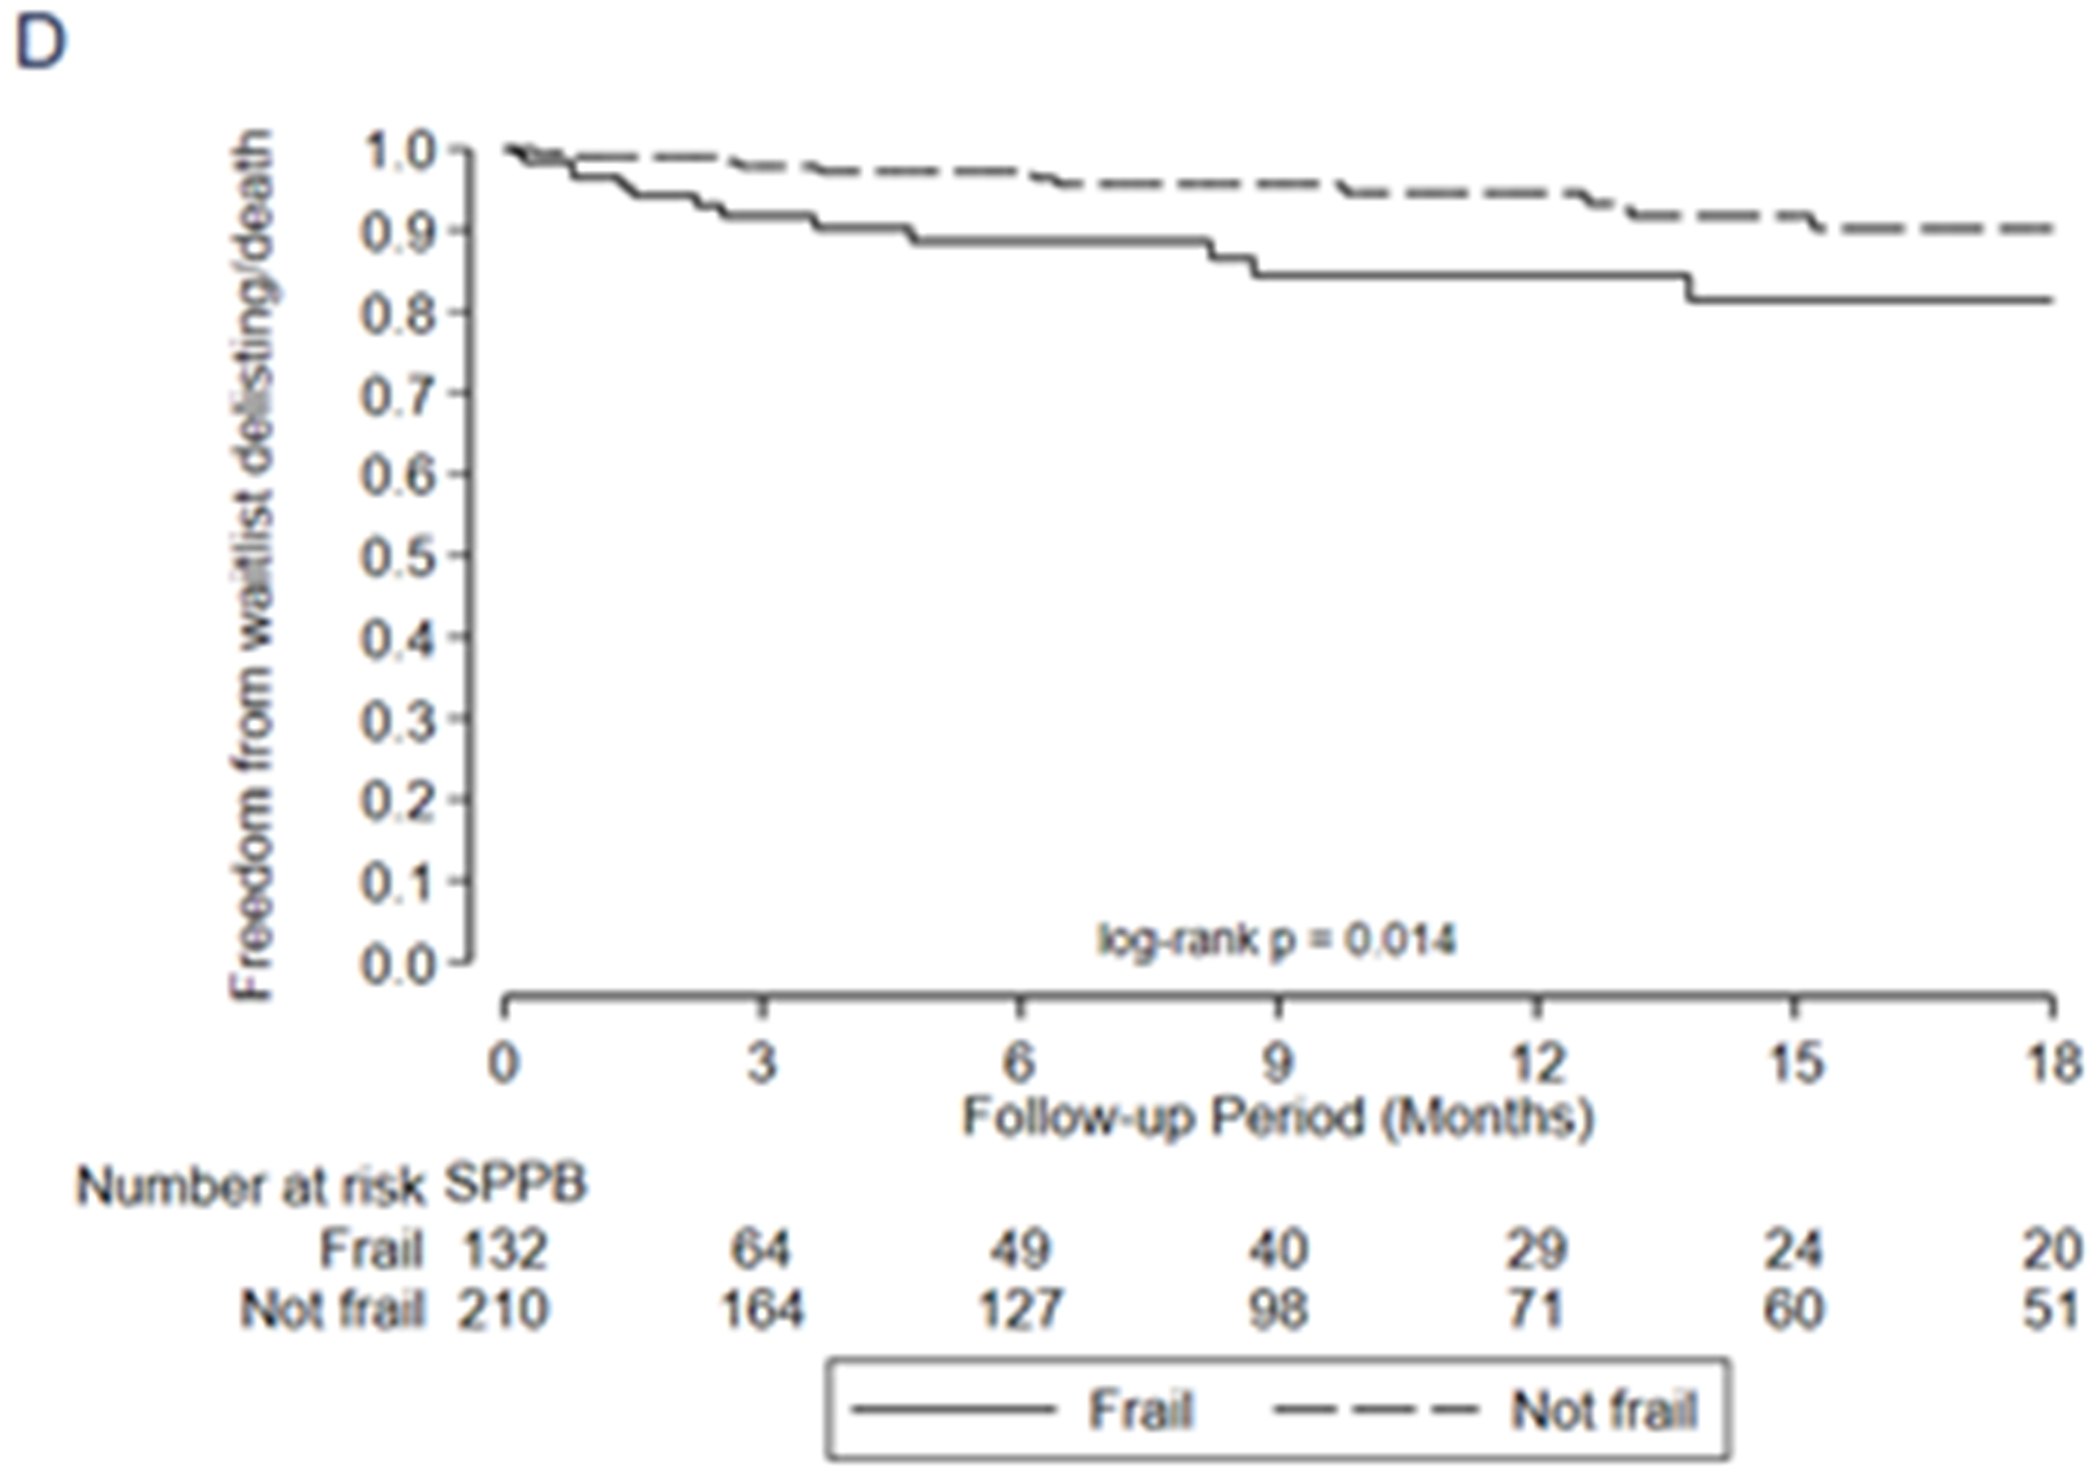
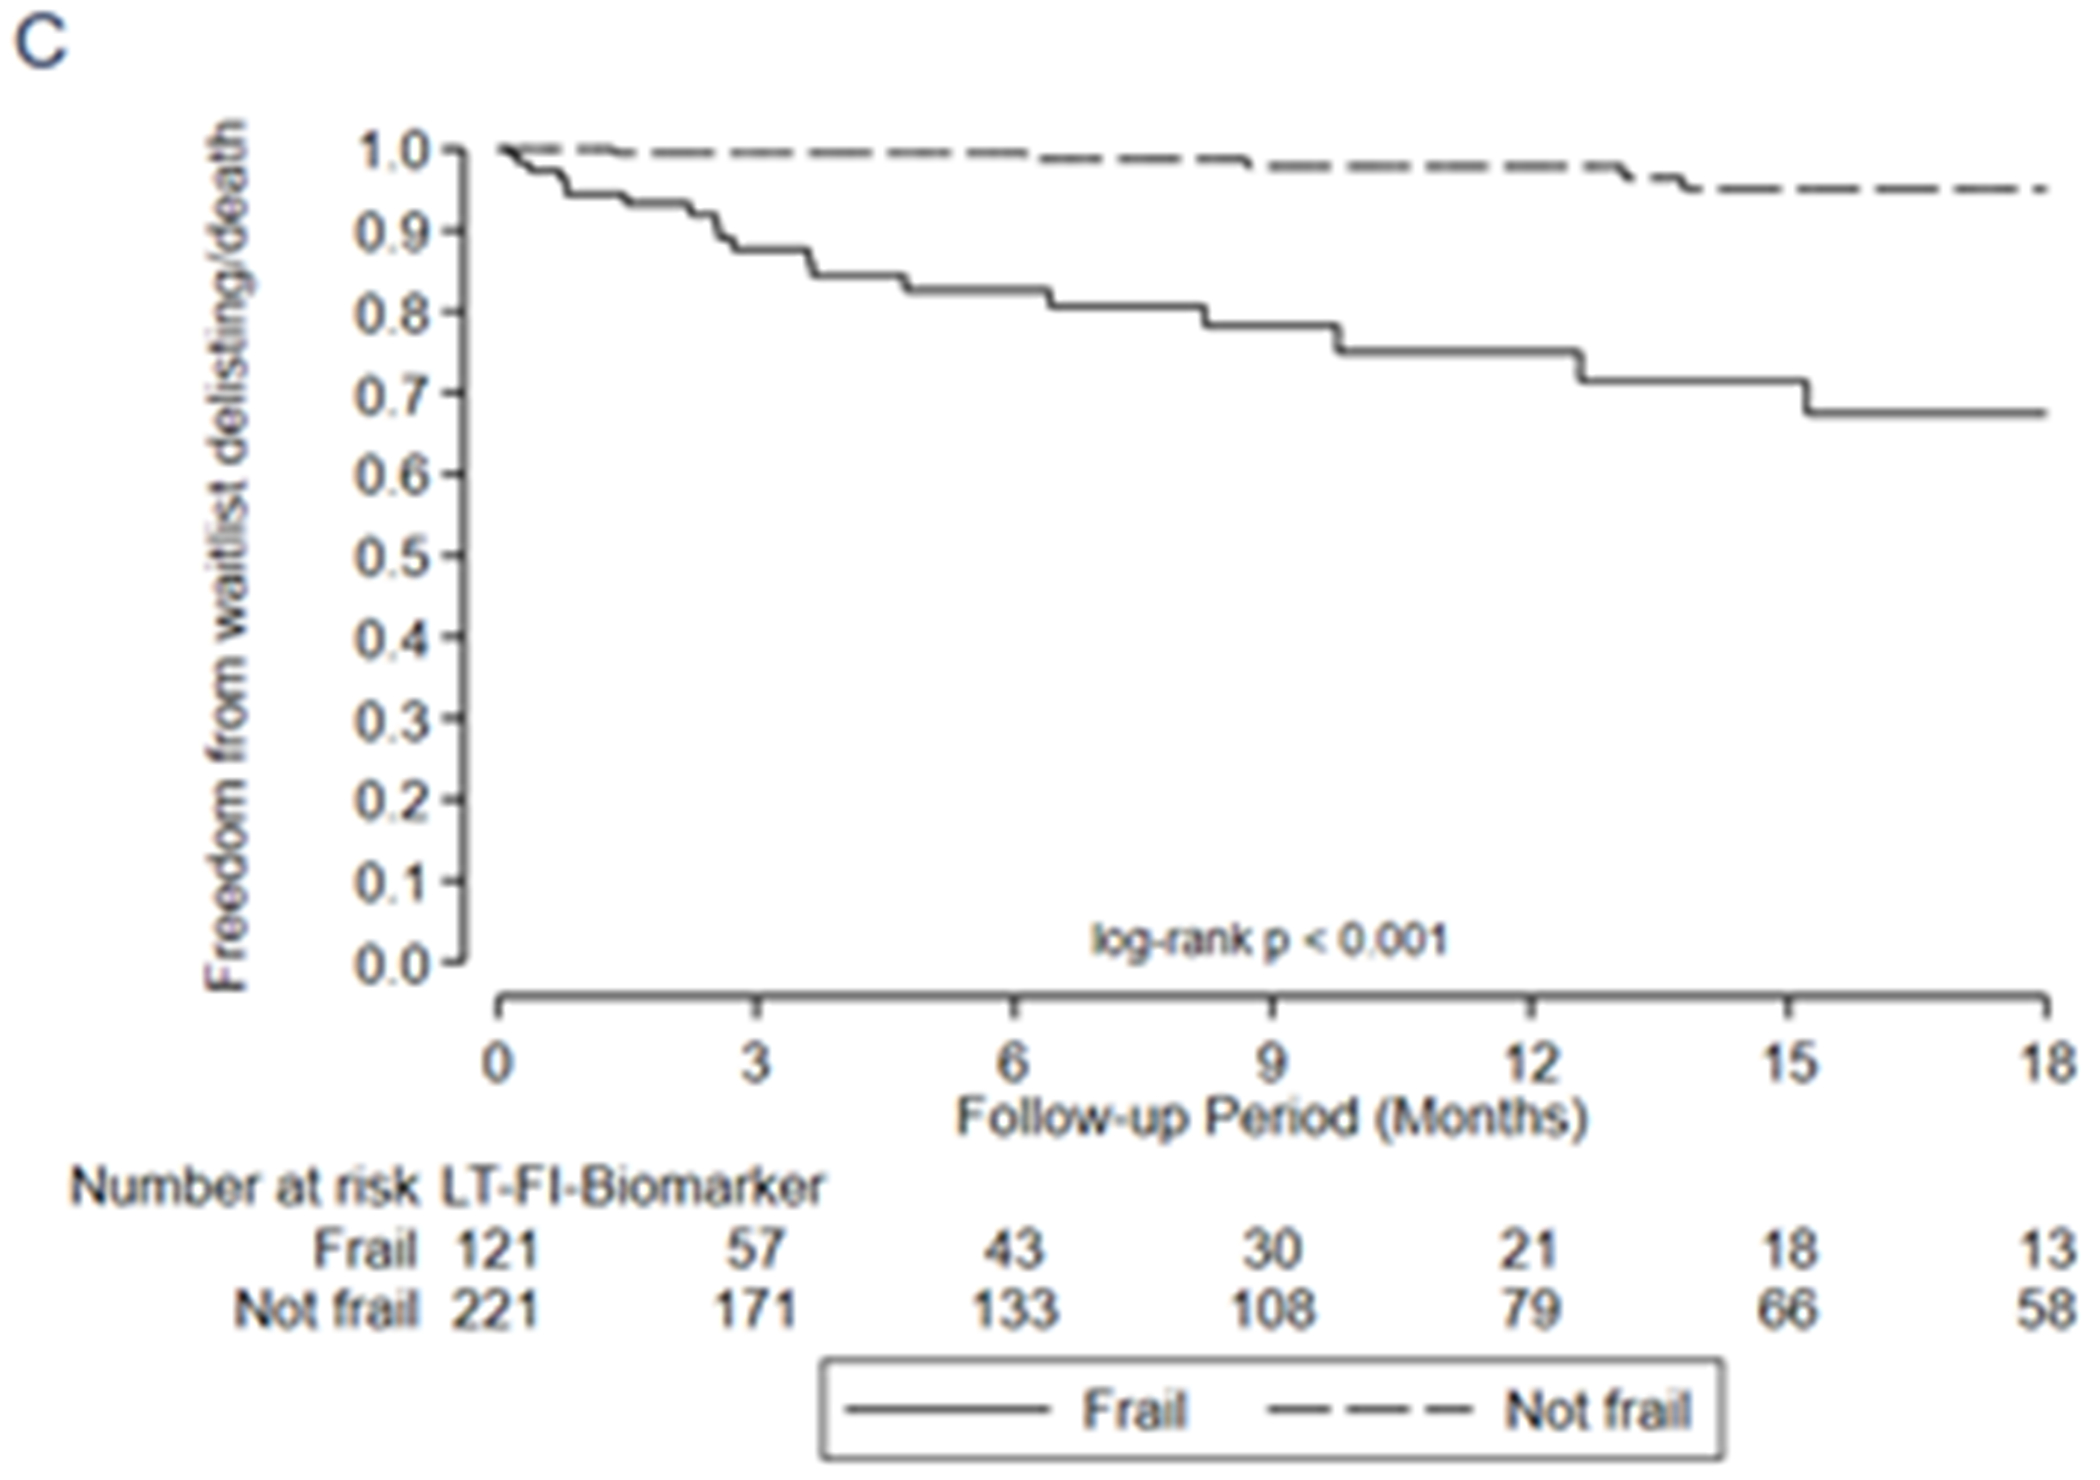
In general, all three LT-FS models exhibited stronger predictive validity than the SPPB and FFP. For example, frailty by LT-FS-Body Composition (includes low muscle mass) was associated with a 6-fold higher adjusted risk of delisting/death (HR 6.0, 95%CI: 2.5, 14.2) compared to 2.5 (95%CI: 1.1, 5.8) for SPPB and 4.3 (1.8, 10.1) for FFP-DASI (Table 6, Figure 2). LT-FS-Base and LT-FS-Biomarker had slightly weaker and slightly stronger associations for delisting/death compared to LT-FS-Body Composition, respectively, but all were larger than the SPPB and FFP (Table 6). The overall Net Reclassification Index ranged from 0.11 to 0.34 by LT-FS model compared to SPPB or FFP (Table 5, Supplemental Table 5). Frailty by LT-FS models, SPPB, and FFP were all associated with disability and worse HRQL (Table 6, Supplemental Table 6).
Figure 2:
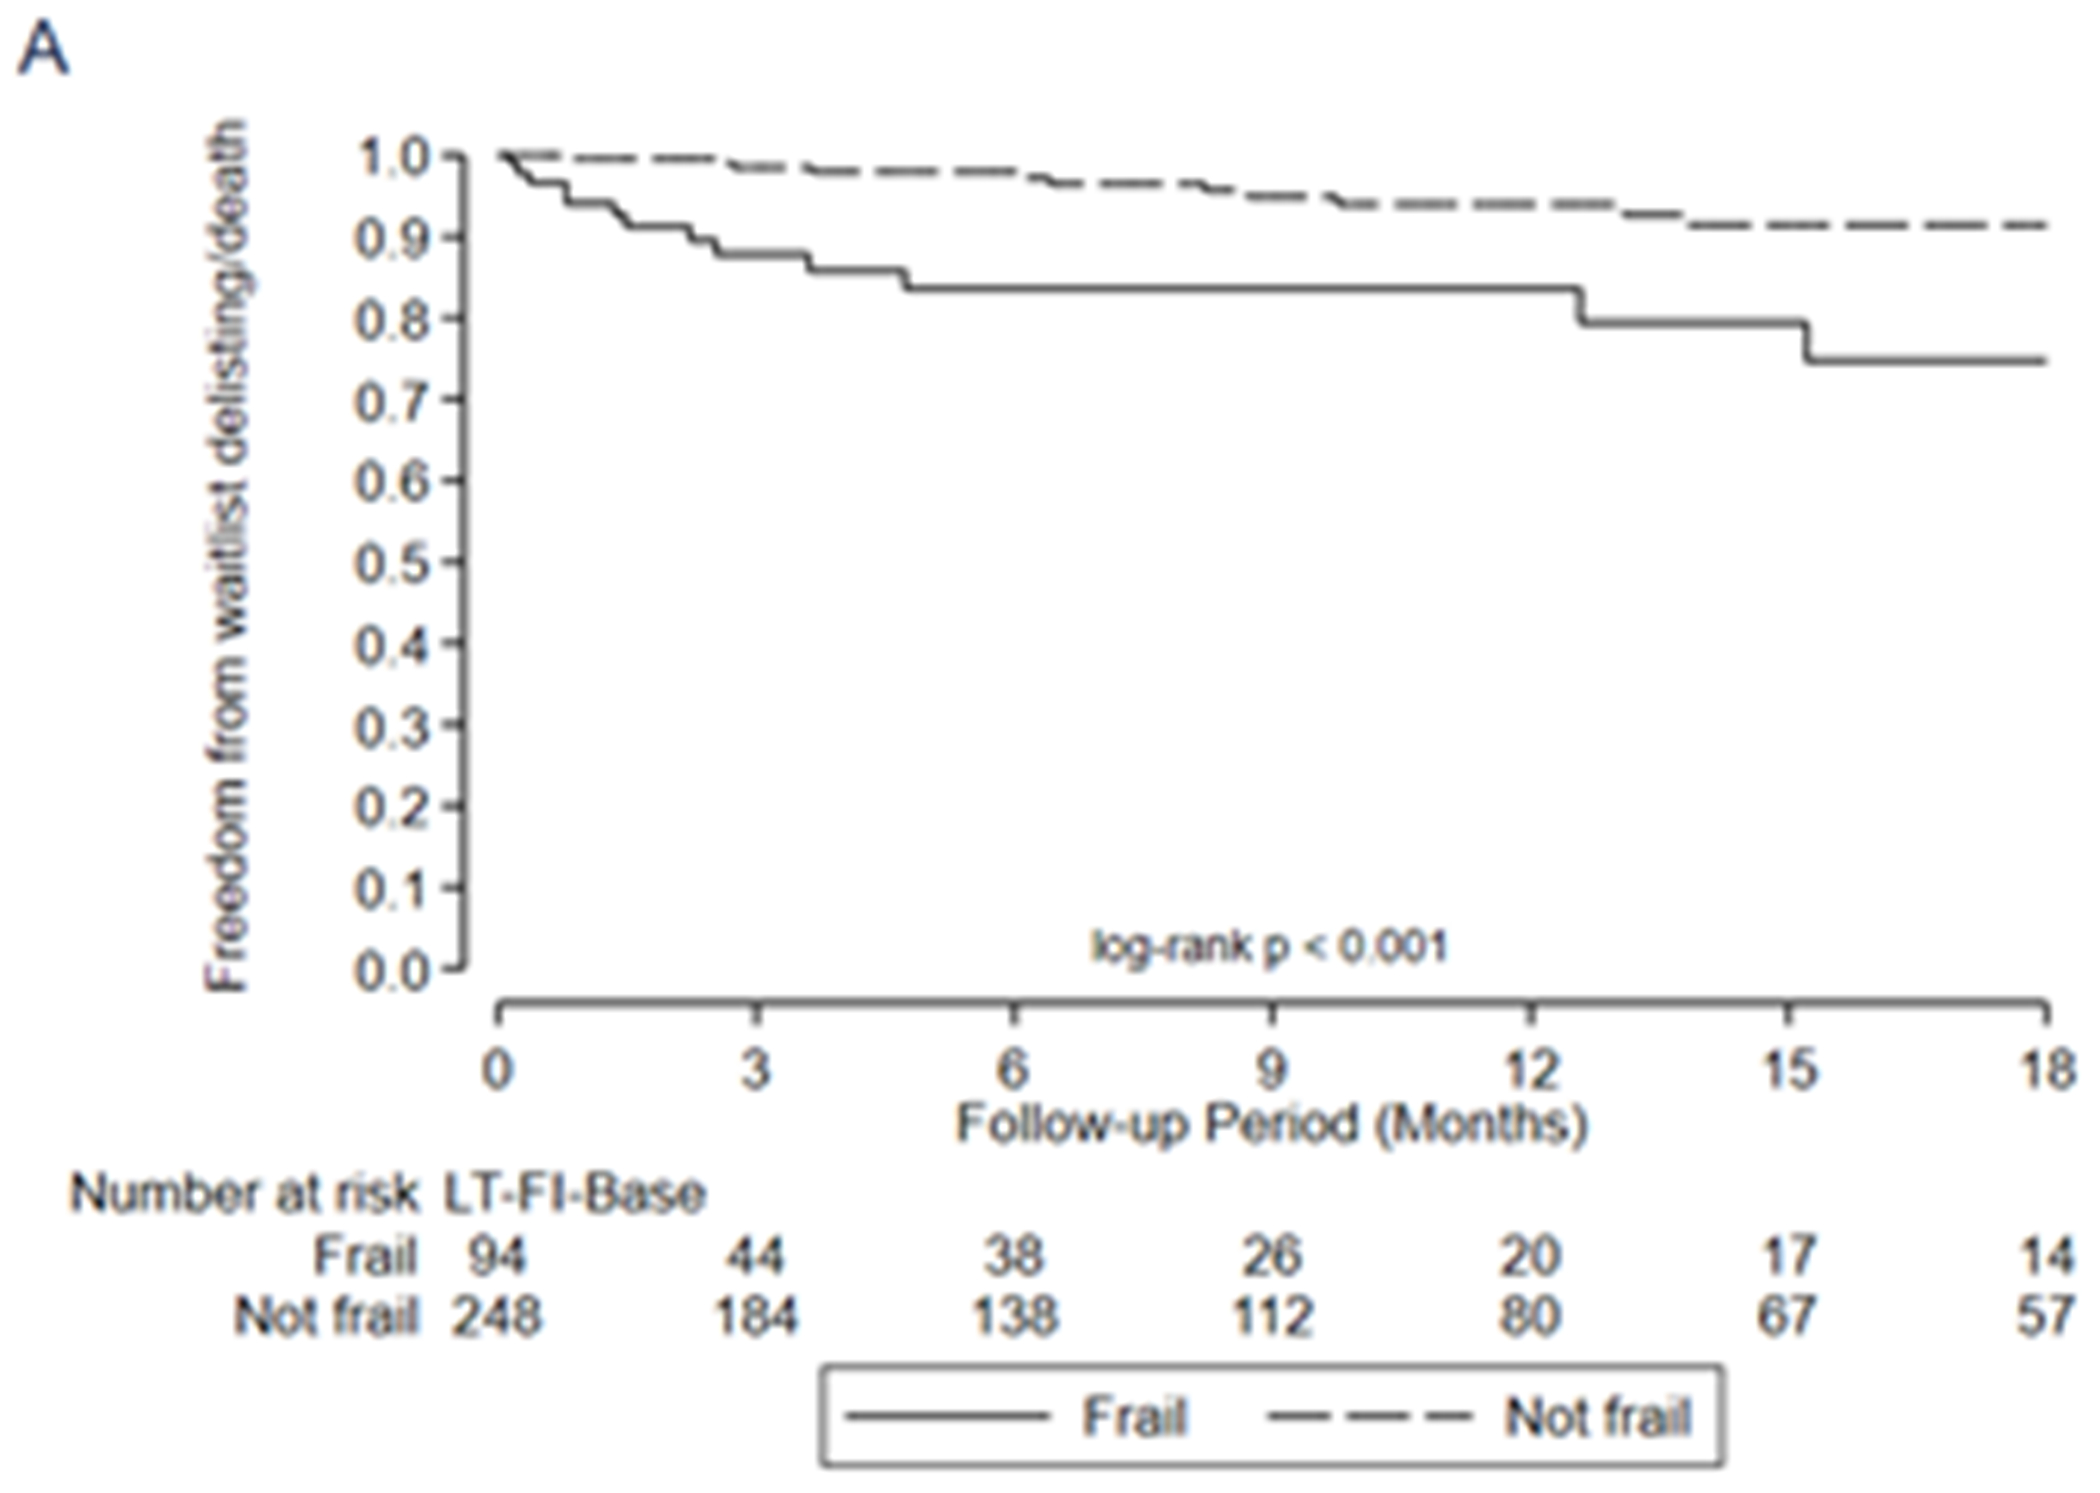
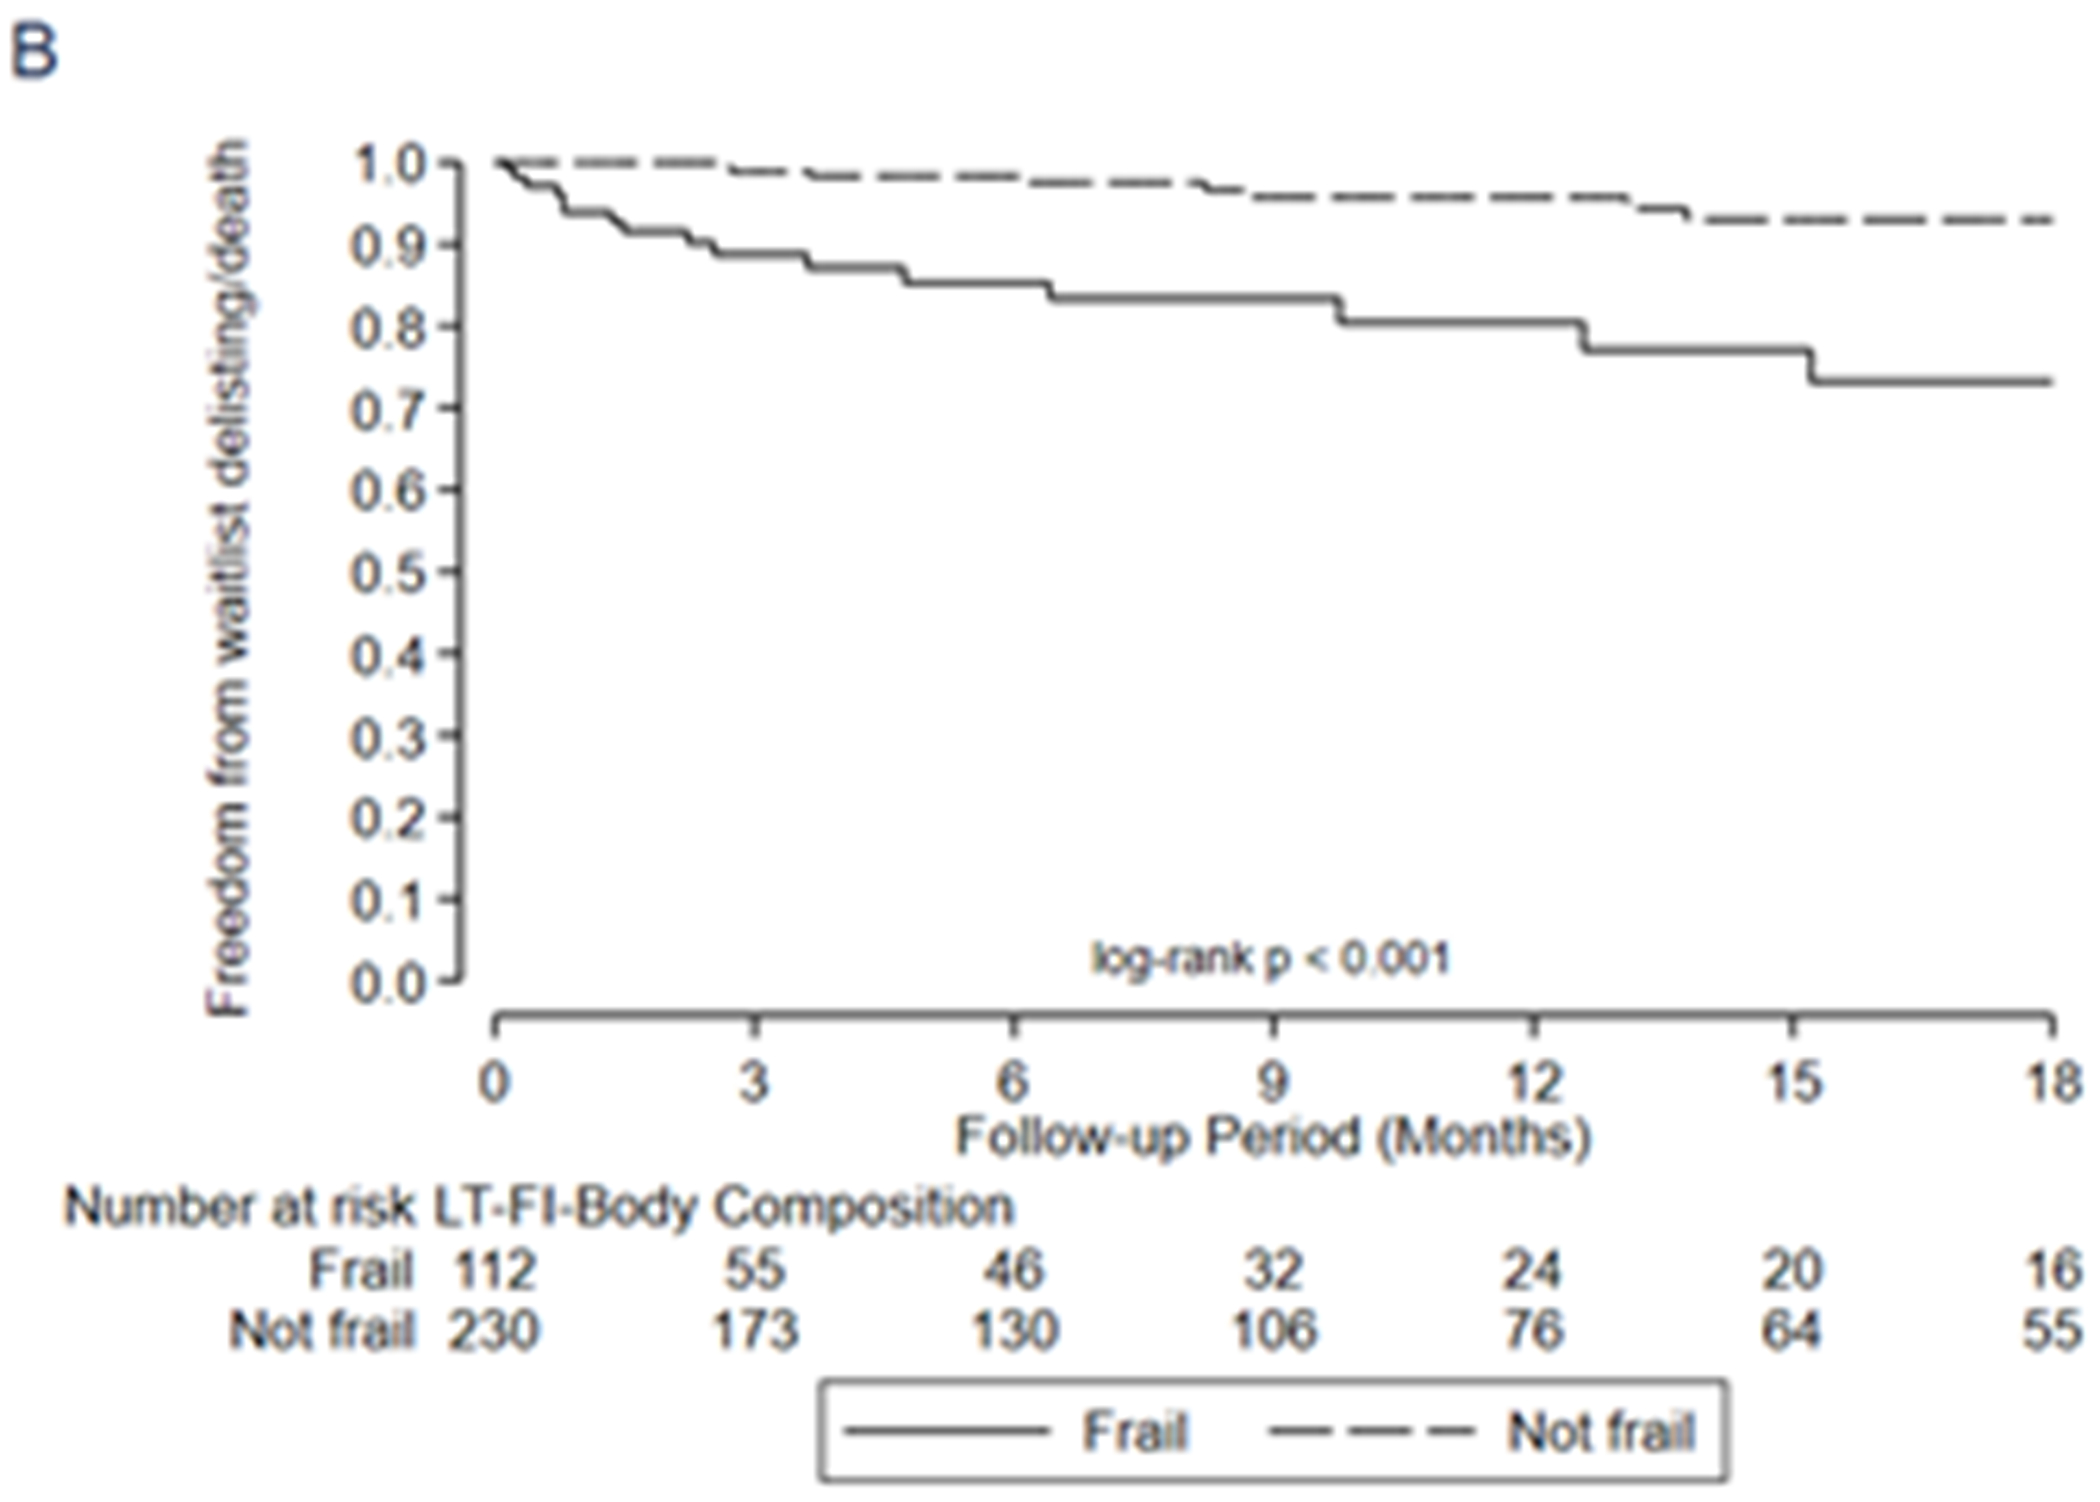
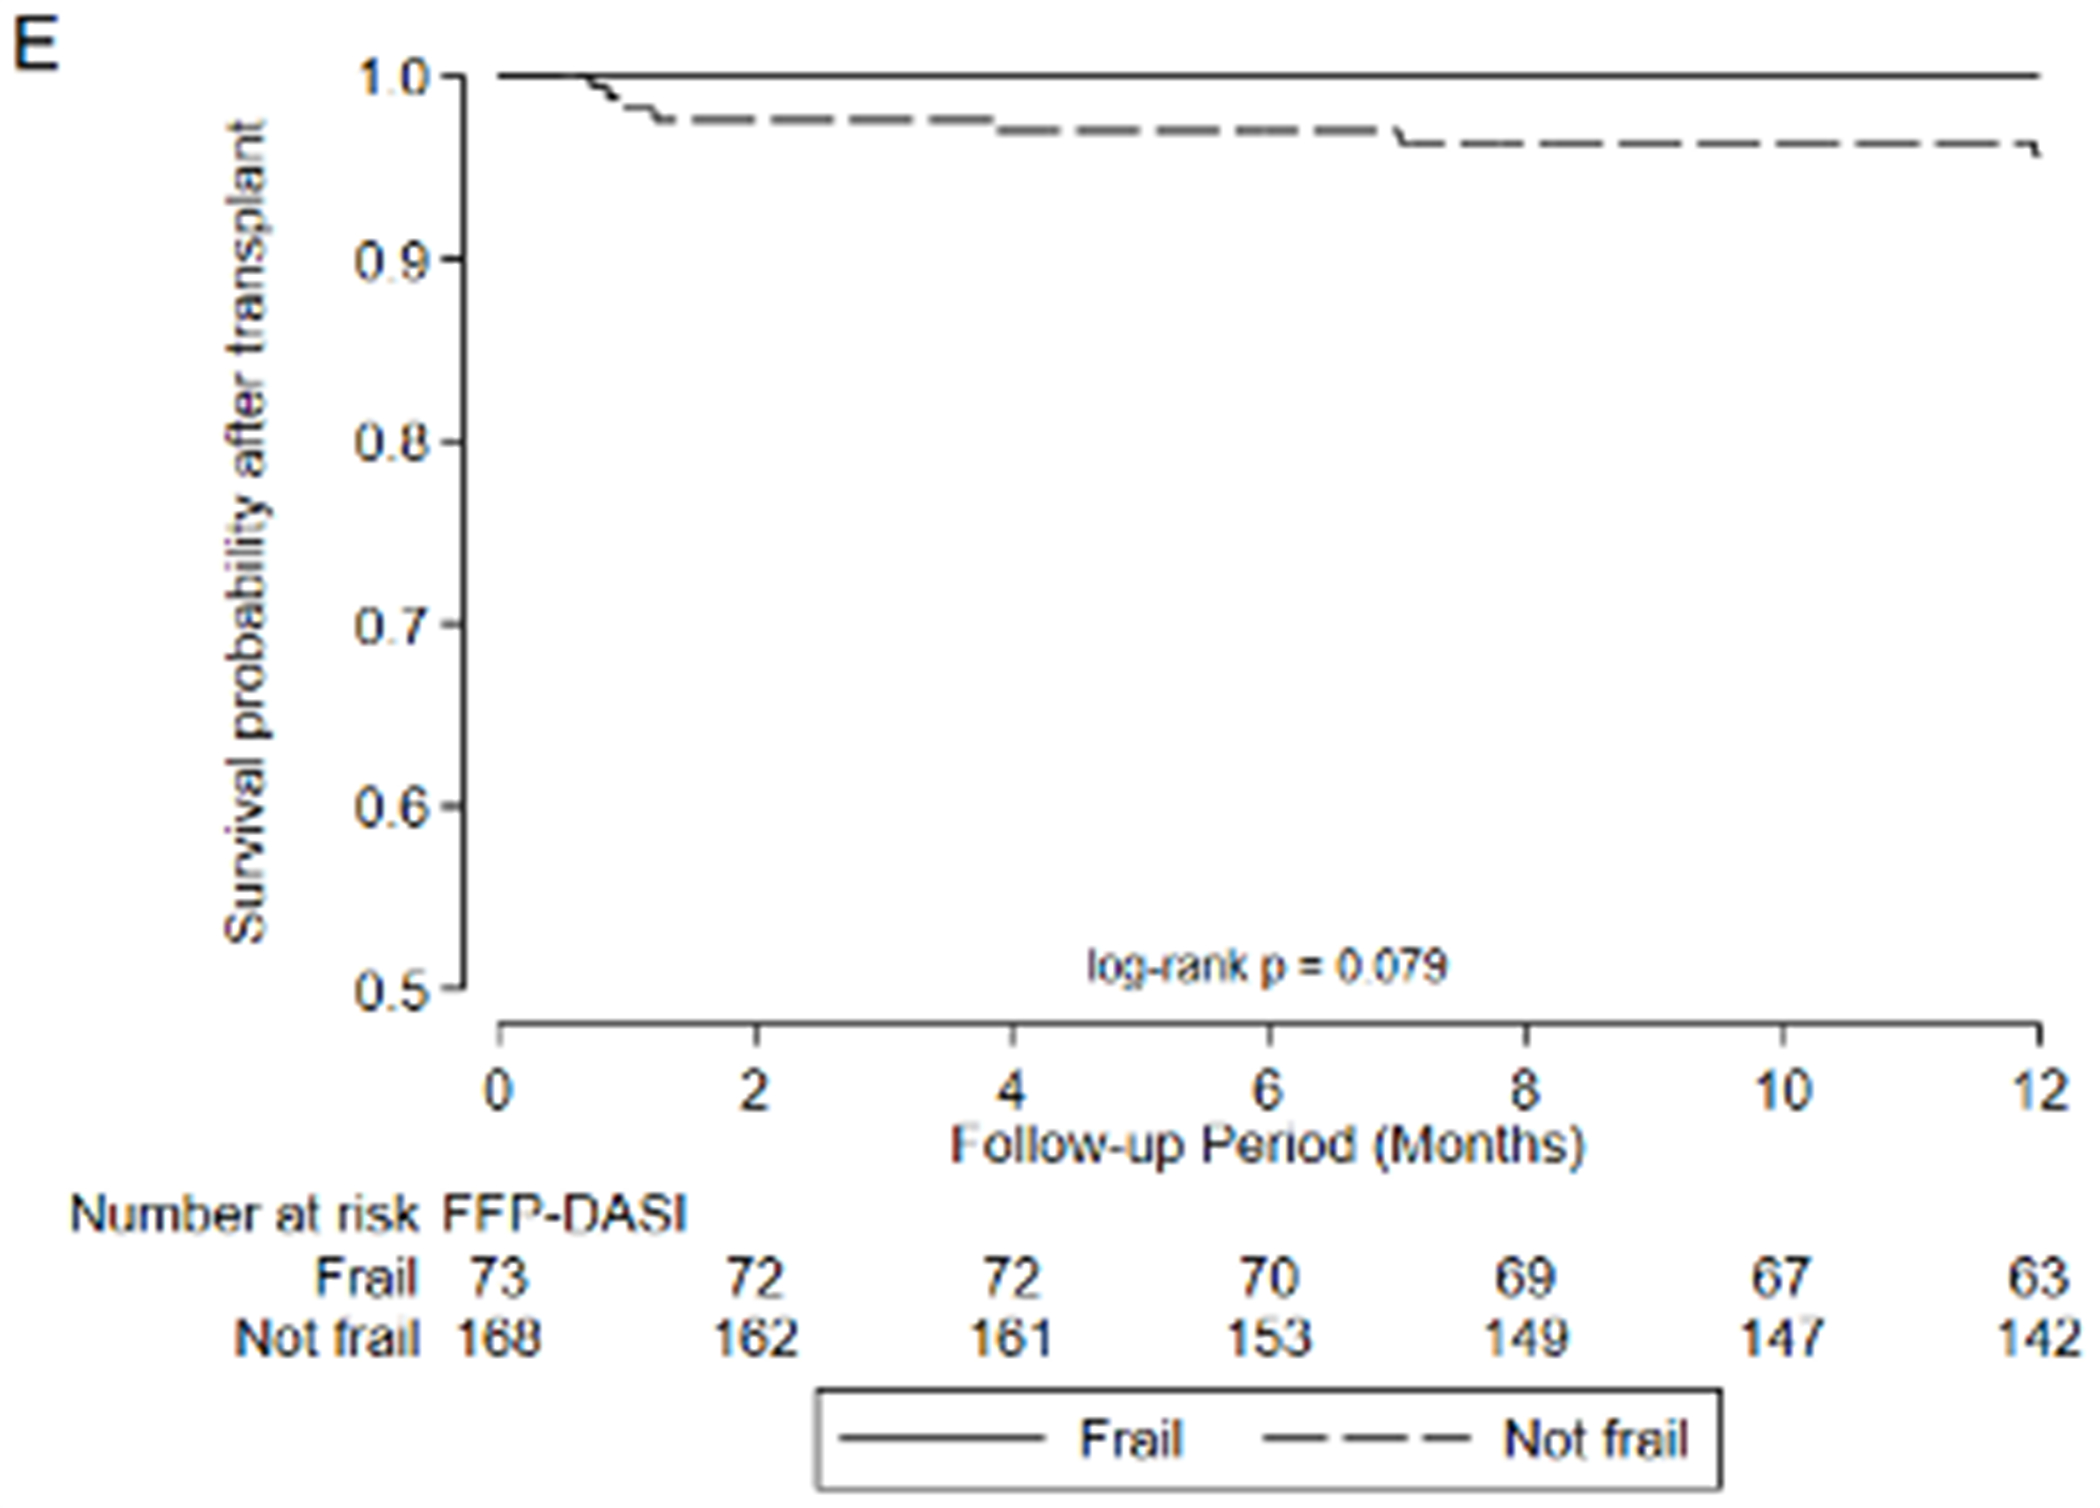
Association between frailty and waitlist delisting or death by A) LT-FS-Base, B) LT-FS-Body Composition, C) LT-FS-Biomarker, D) SPPB, and E) FFP-DASI
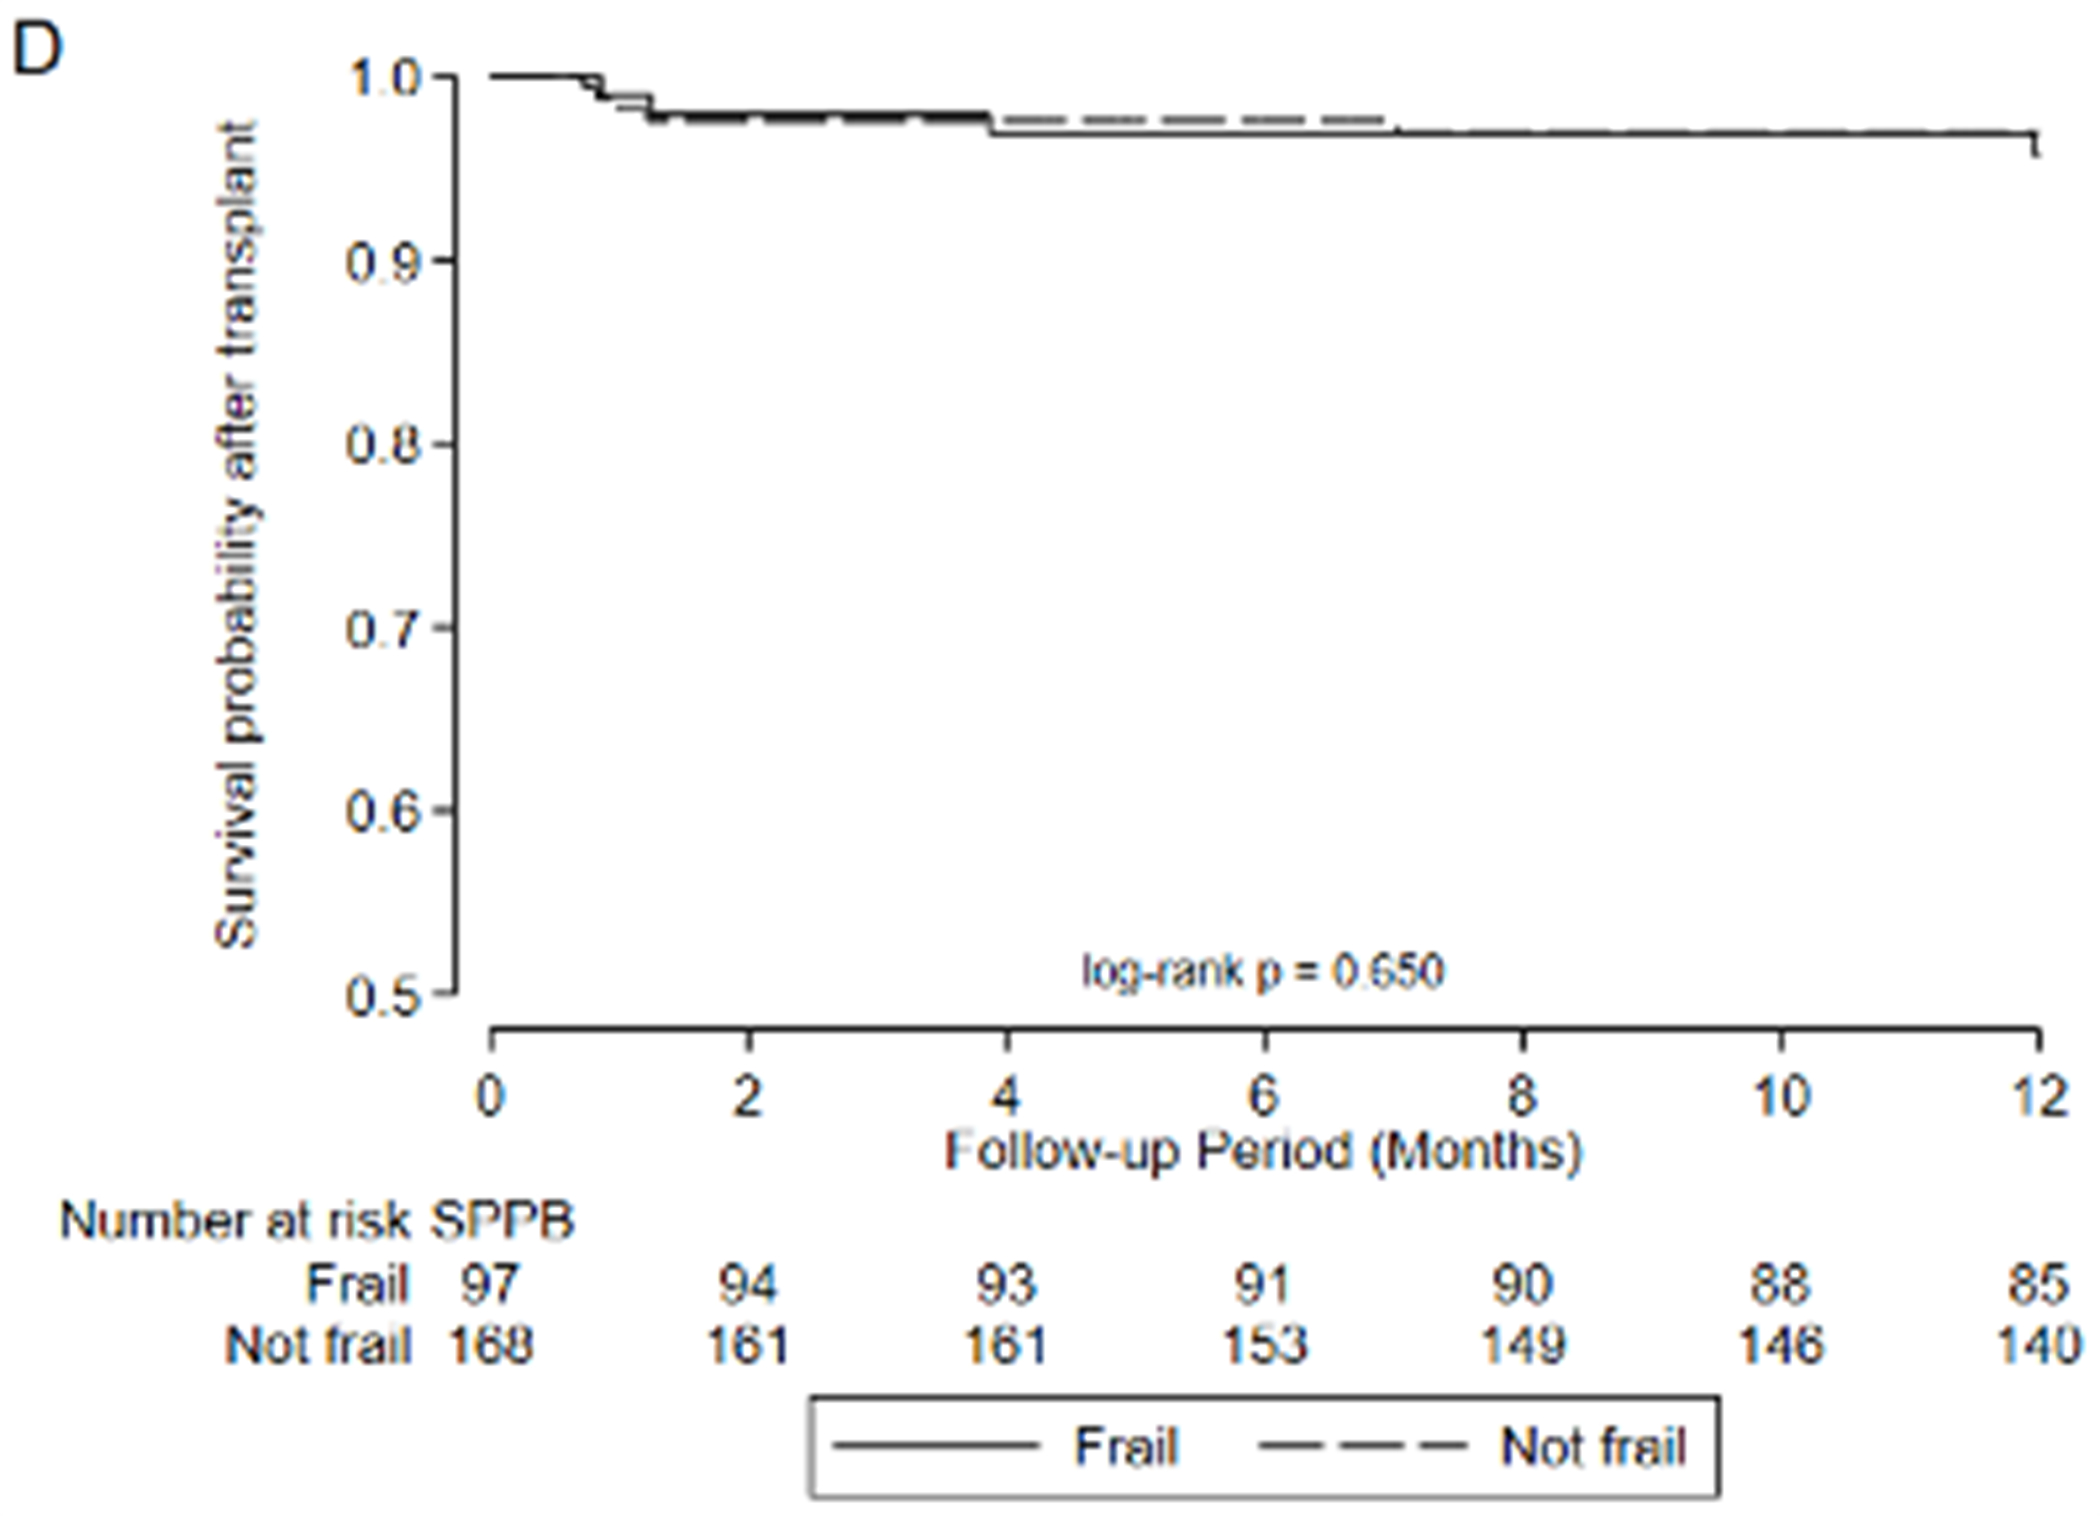
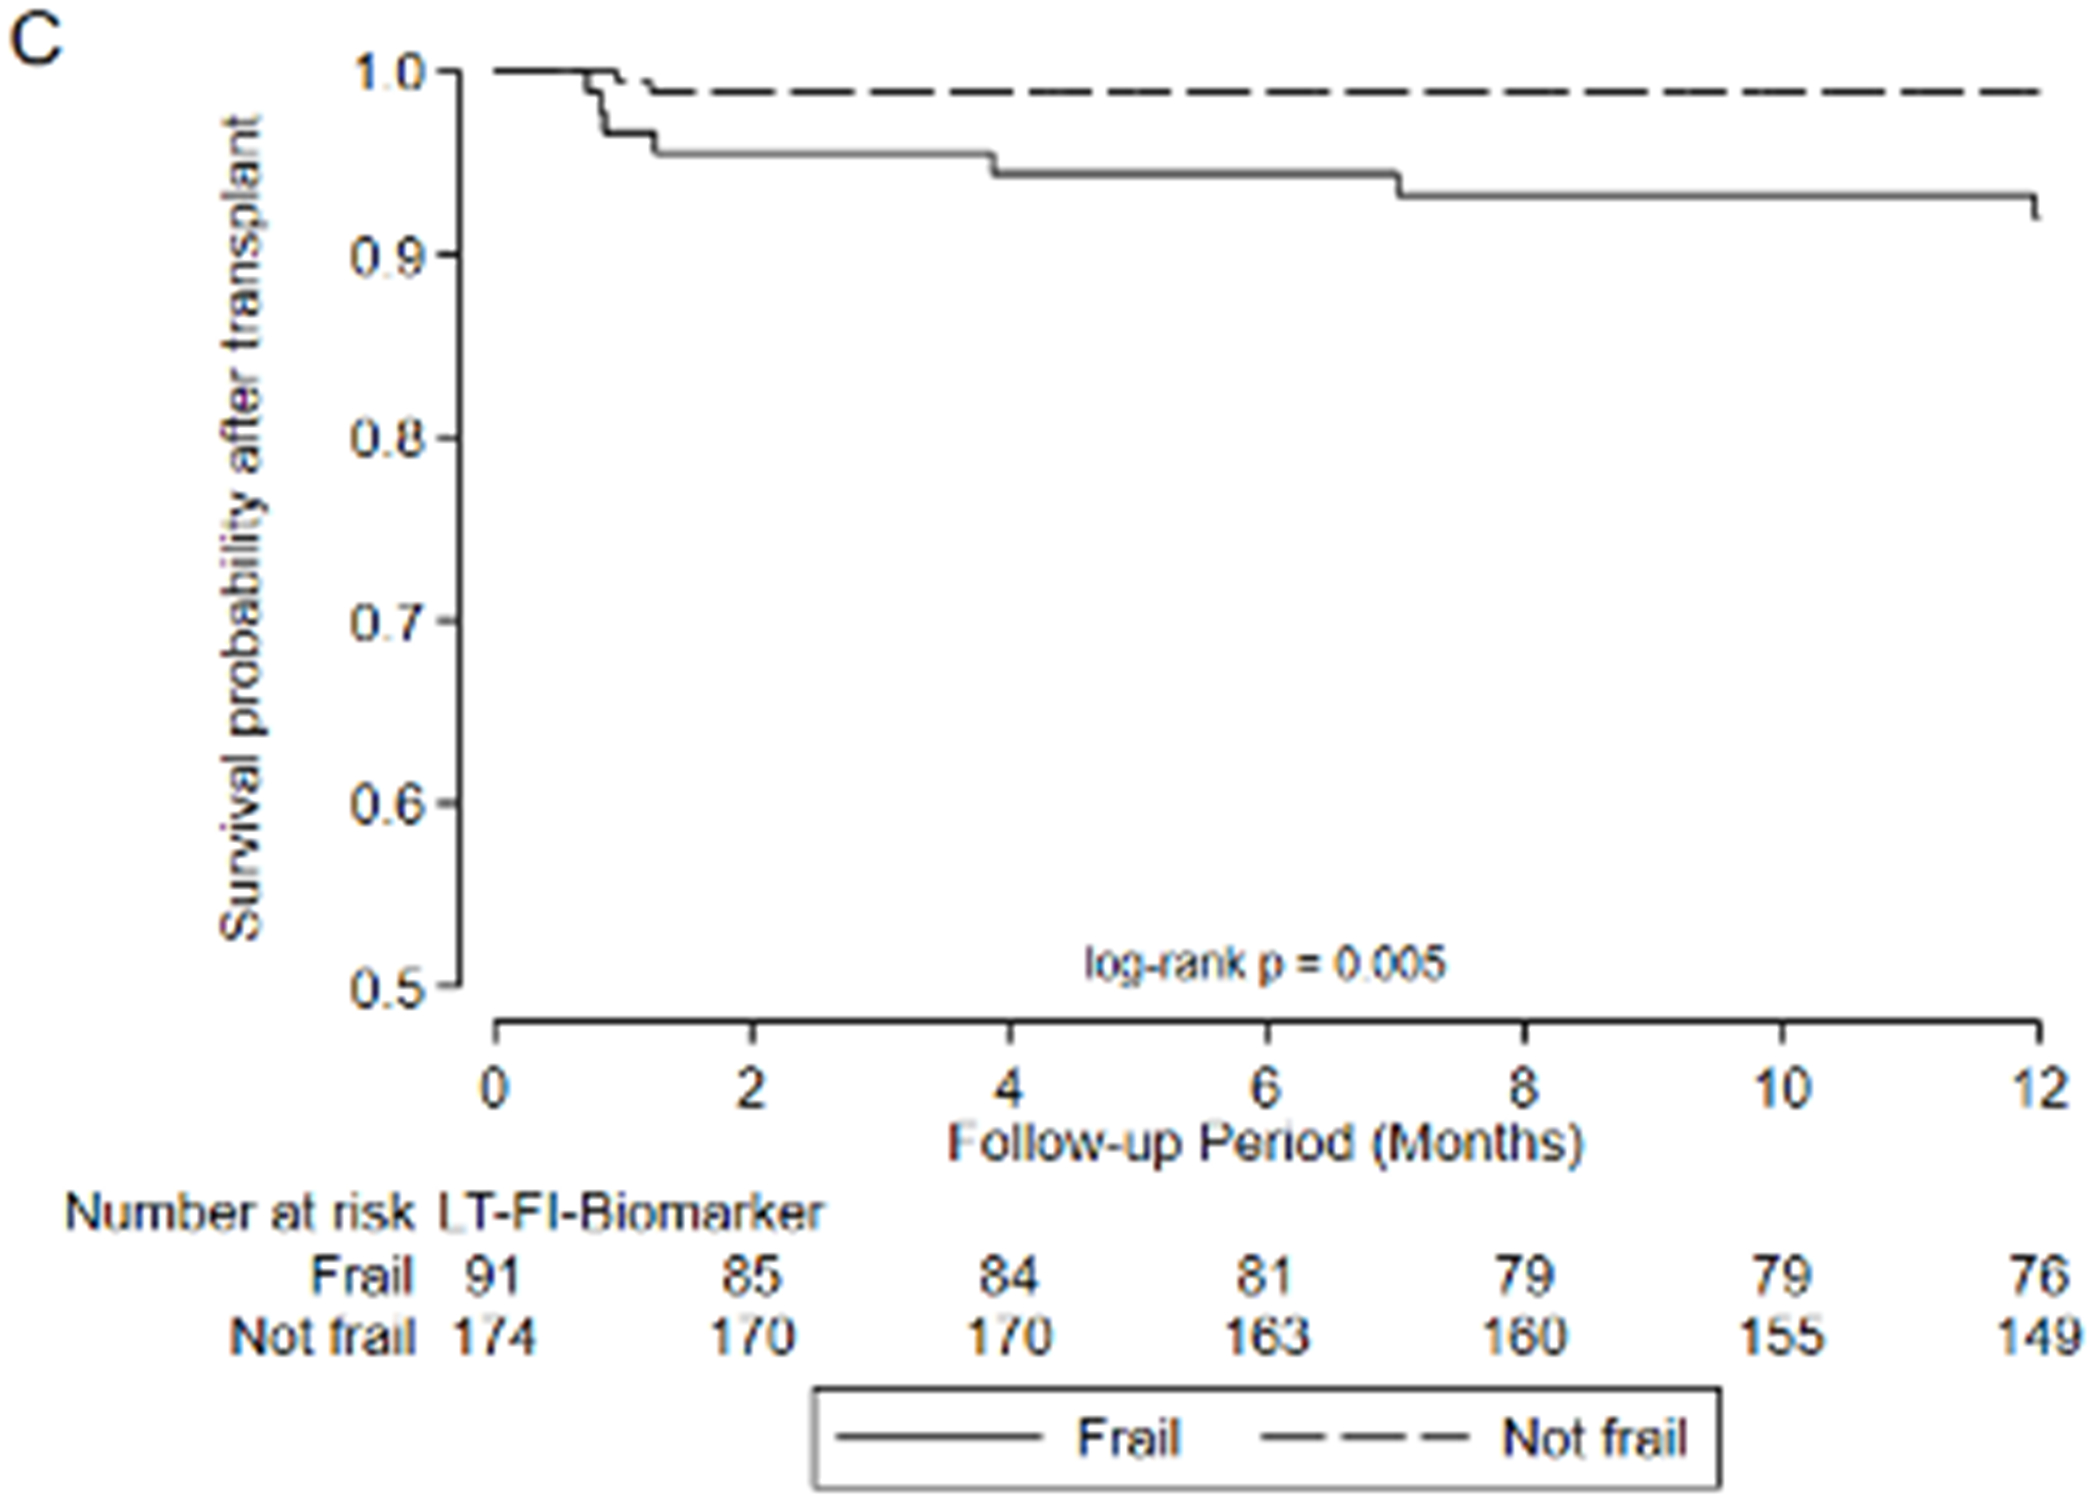
After transplant, pre-operative frailty by LT-FS models, SPPB, and FFP was associated with non-significant trends towards longer hospital LOS (Table 6). Finally, pre-operative frailty by all LT-FS models was associated with death within the first year. For example, frailty by LT-FS-Body Composition was associated with a 4.6-fold higher adjusted risk of death within the first post-operative year (95%CI: 1.1, 18.4) (Table 6, Figure 3).
Figure 3.
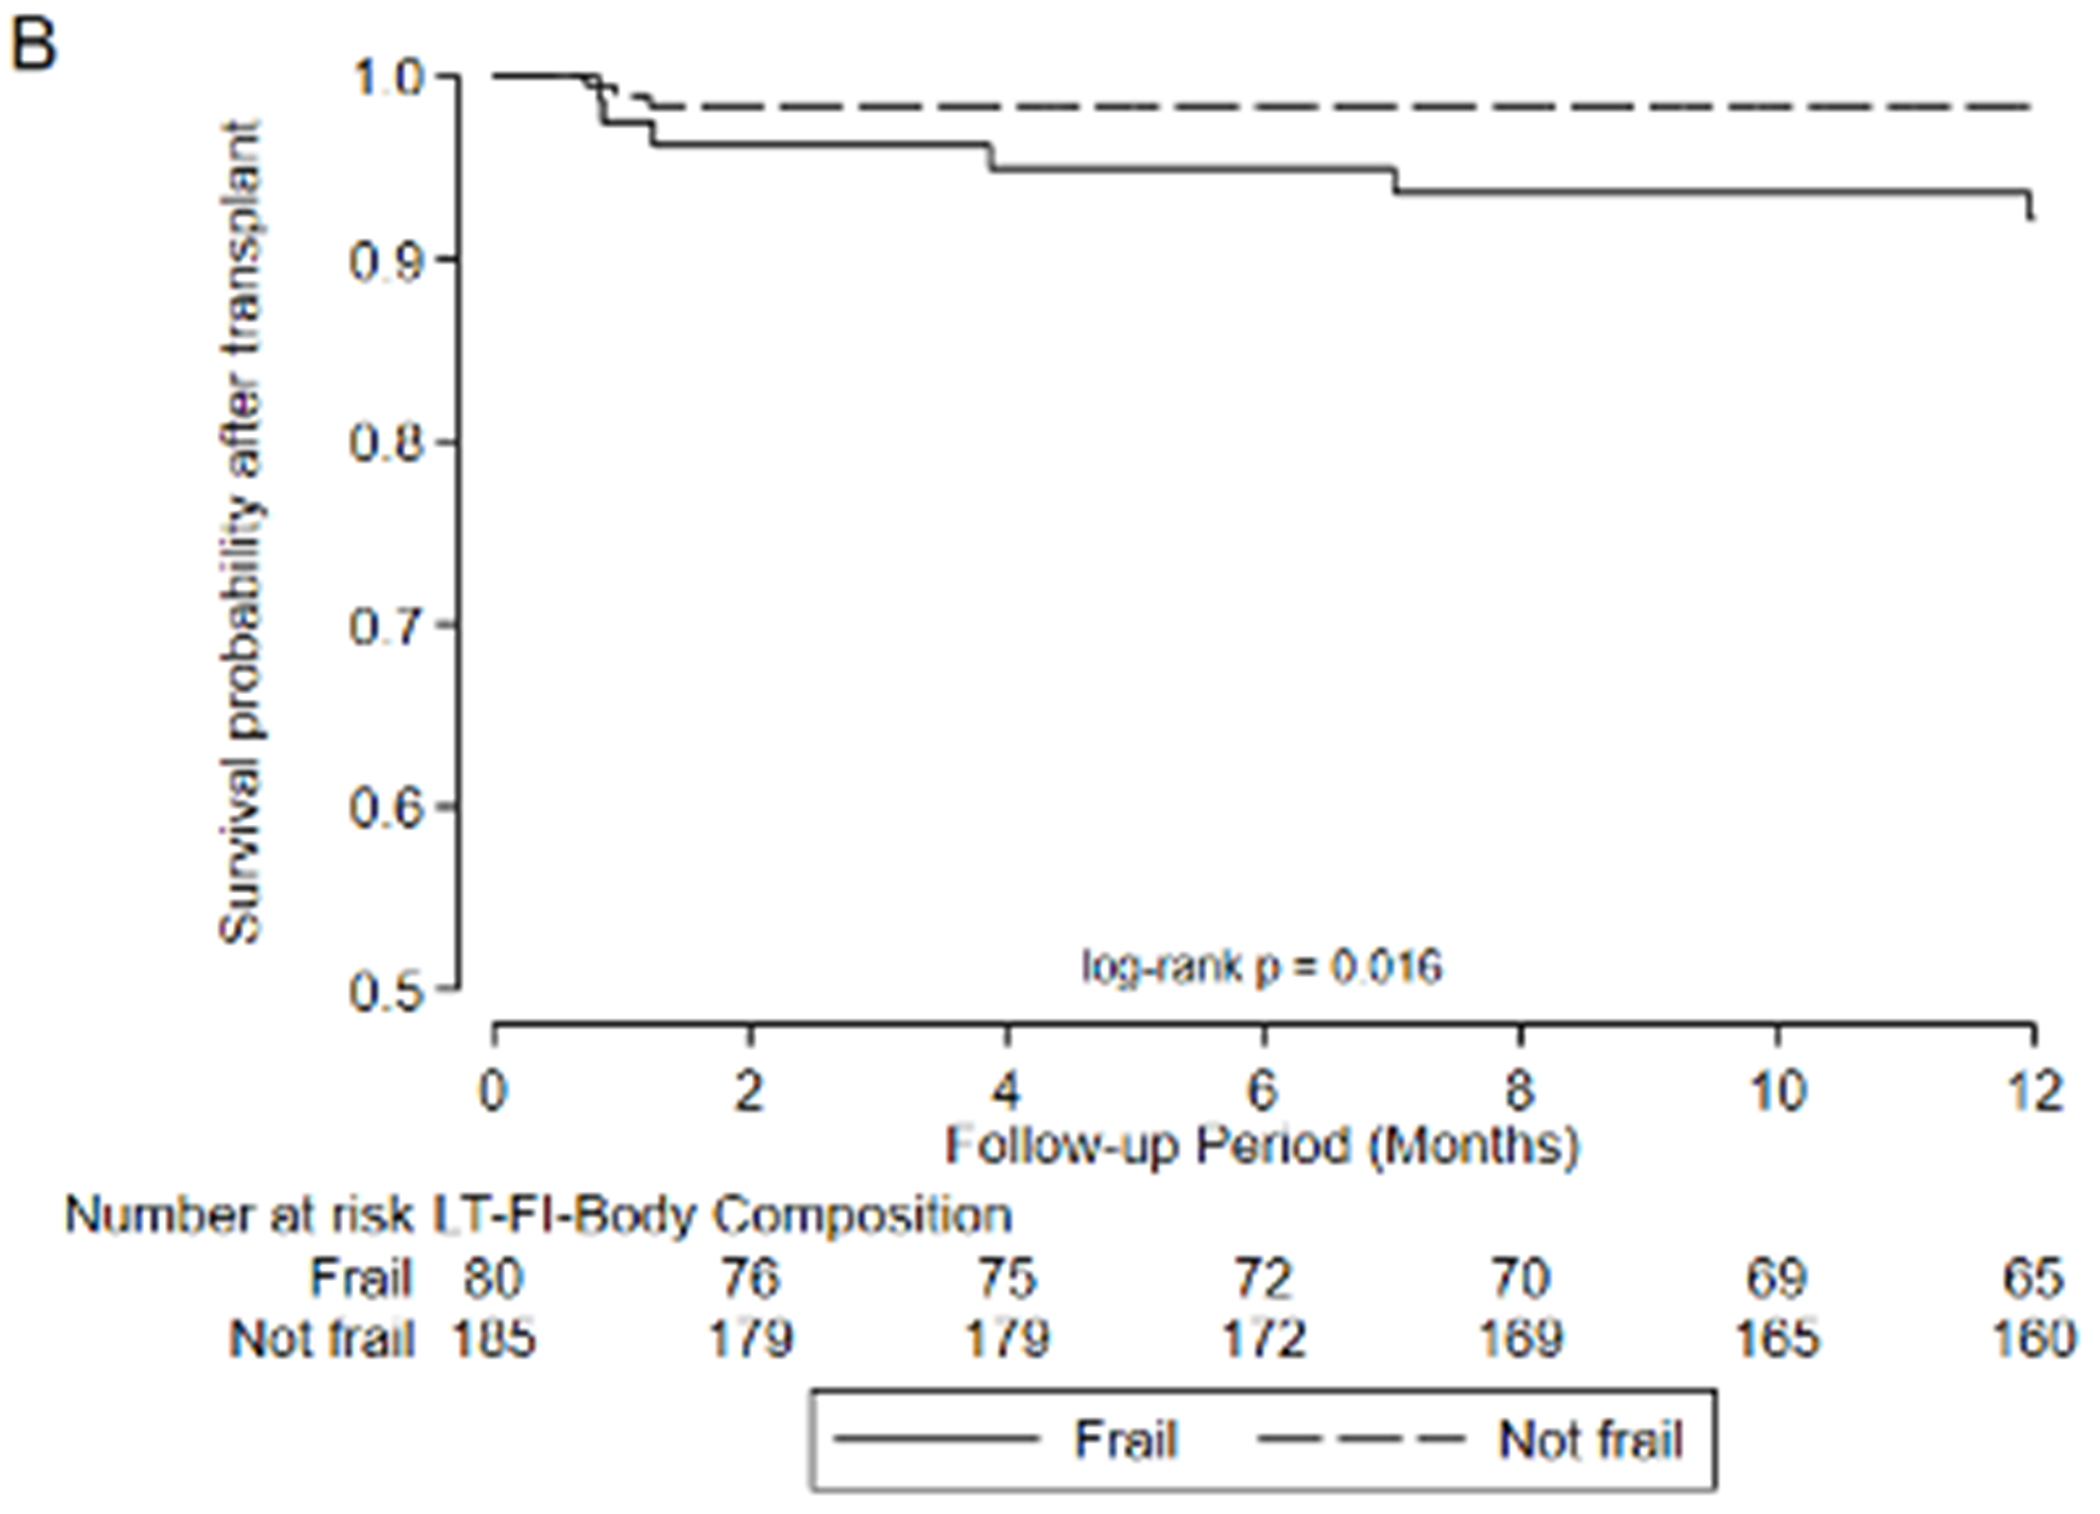
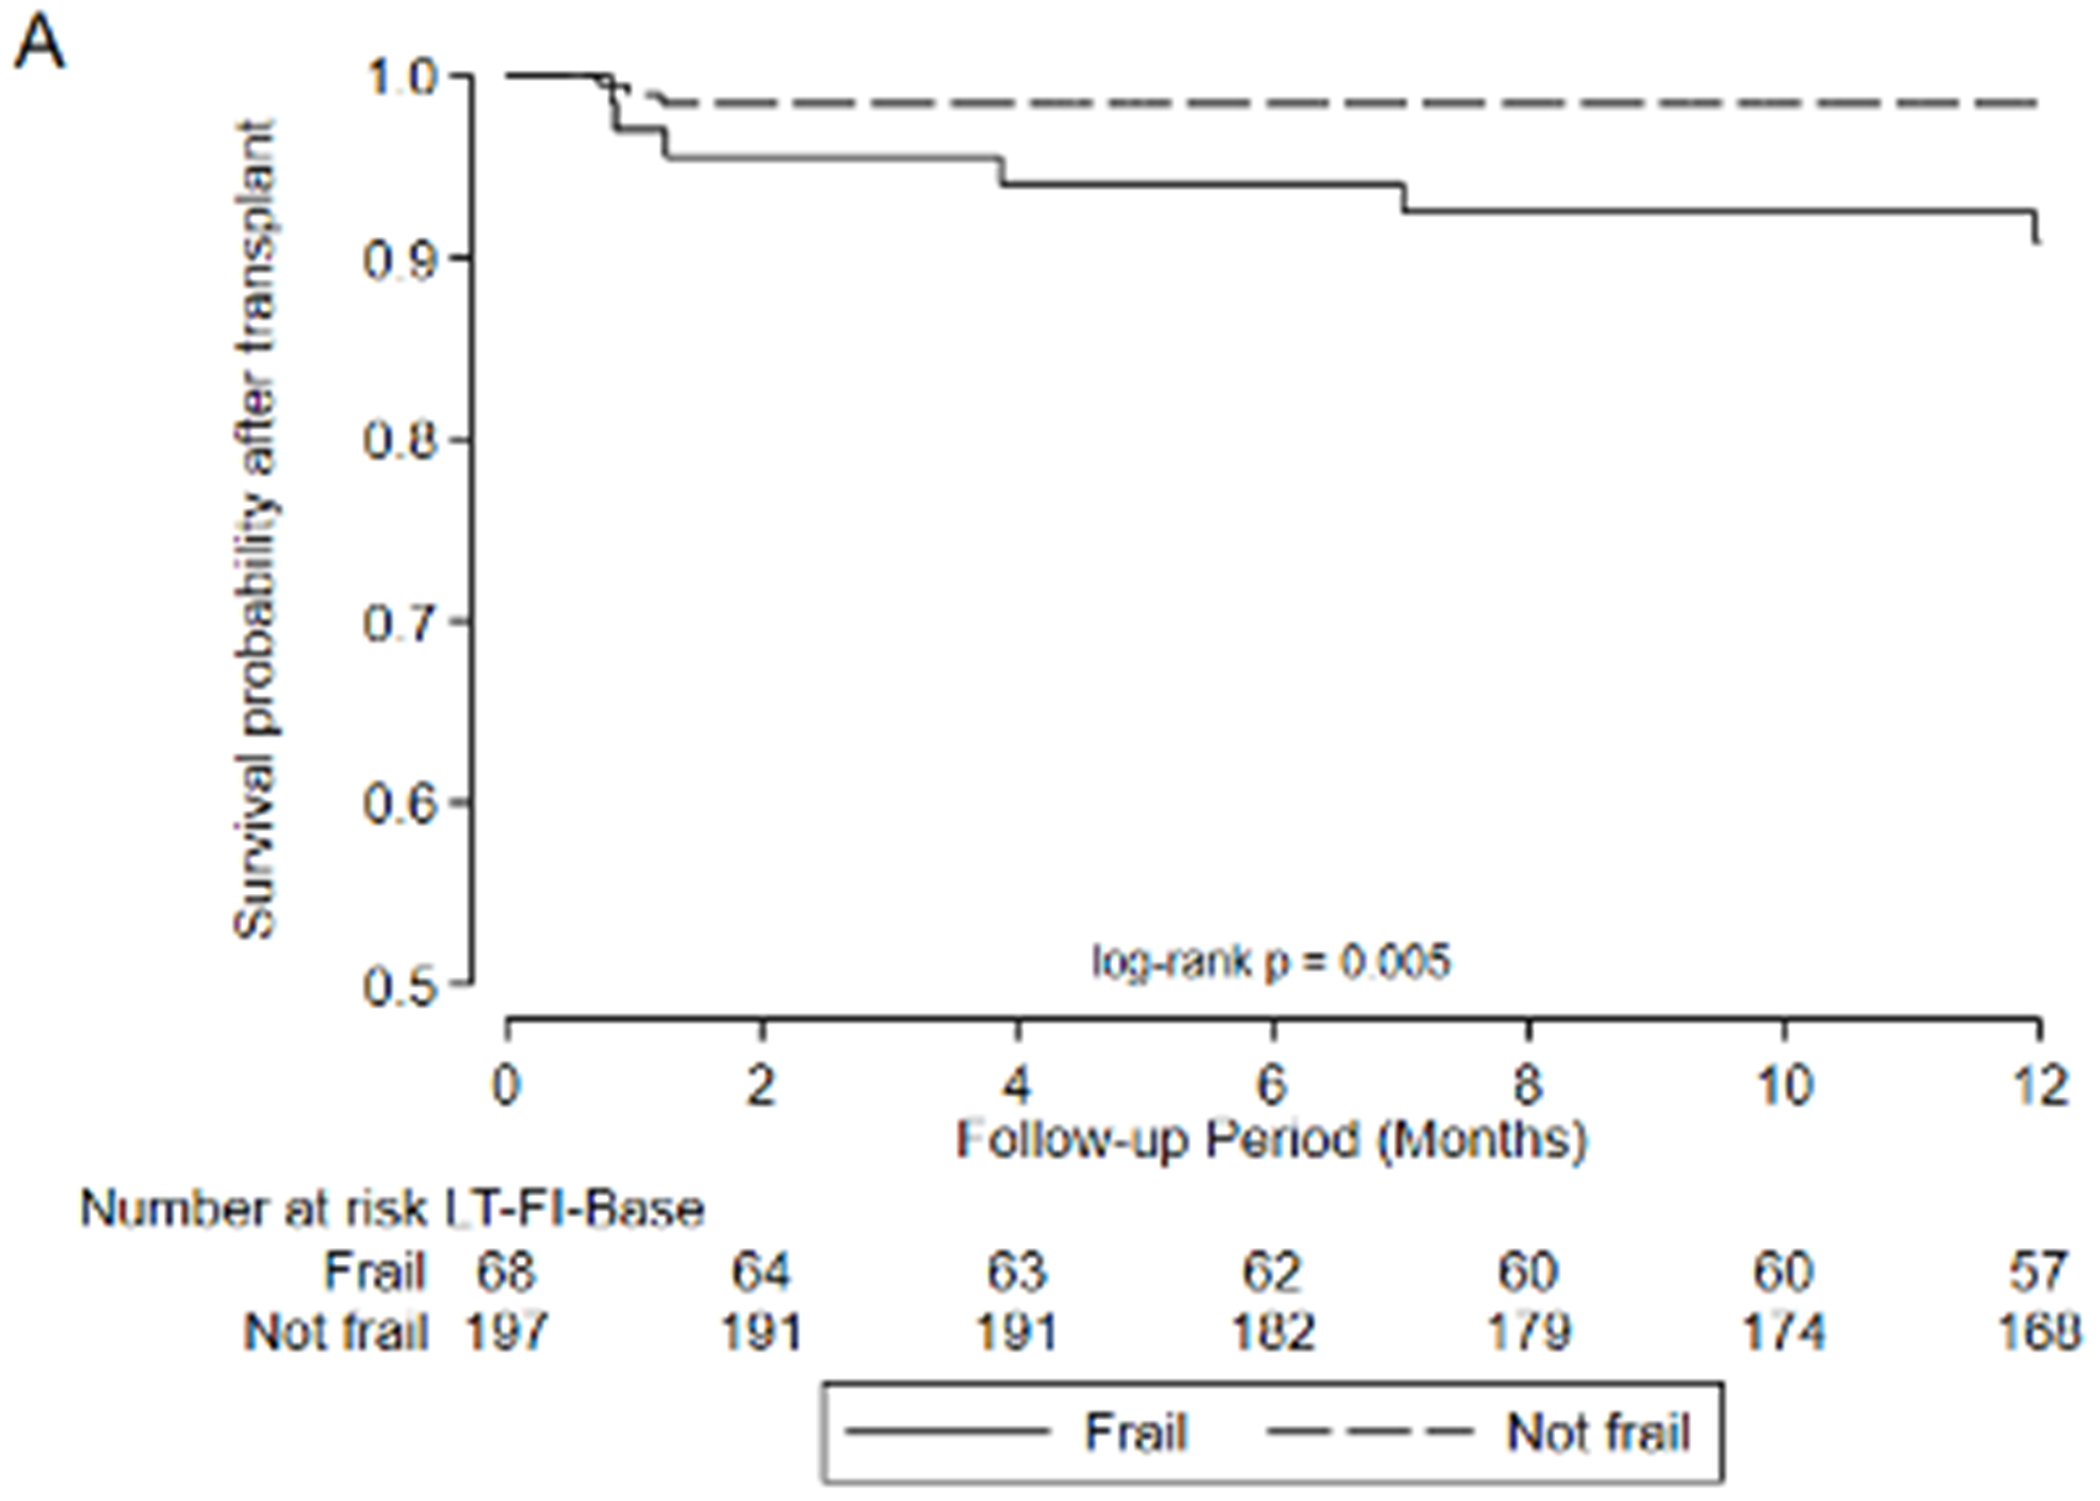
Association between frailty and one-year mortality after transplant by A) LT-FS-Base, B) LT-FS-Body Composition, C) LT-FS-Biomarker, D) SPPB, and E) FFP-DASI
Discussion:
Over a short period of time, frailty has emerged as a prevalent and strong risk factor for poor outcomes before and after solid organ transplantation. These associations have informed the International Society of Heart and Lung Transplantation 2021 consensus statement on the selection of lung transplant candidates which now includes the assessment of frailty as part of a complete transplant evaluation.9 To date, physical frailty assessment has been based on measures developed decades ago in community dwelling older adults. Using an established process for index development, we developed and preliminarily validated the “Lung Transplant Frailty Scale” measures or “LT-FS”. LT-FS has superior face, construct, and predictive validity compared to either the Fried Frailty Phenotype (FFP) or the Short Physical Performance Battery (SPPB). LT-FS is a refined measure of physical frailty designed for the needs of the advanced lung disease and transplant community and that reflects our contemporary understanding of physical frailty pathobiology.
To develop LT-FS, we tested the relevance of candidate operational measures of conceptual frailty domains based on the extant frailty and transplant literature. We intentionally developed three versions of the index, each of which serves a purpose. The simplest (LT-FS-Base) maximizes clinical scalability by using physical measurements and CRP that can be readily collected in all clinical environments. A consequence of its ease of use, however, is modestly worse performance characteristics relative to the other versions. The most expansive version (LT-FS-Biomarker) incorporates novel biomarkers available only in research laboratories. Although LT-FS-Biomarker is unlikely to be applied clinically, it illustrates the potential for combining multidimensional measures of frailty constructs and may inform future research efforts. Striking a middle ground, the LT-FS-Body Composition incorporates advanced measures of body composition. The barriers to measuring body composition may be relatively low for many transplant programs and including it improves model performance. An online resource to calculate LT-FS scores is available at http://lungtransplantfrailtyscale.ucsf.edu.
Regardless of which LT-FS version is used, all exhibit generally superior performance characteristics compared to the SPPB and FFP. For example, amongst those defined as frail by LT-FS-Body Composition, 21.4% were delisted/died compared to 5.7% of those deemed not frail. By comparison, by SPPB, 14.4% deemed frail were delisted/died compared to 8.6% deemed not frail and by FFP, 13.2% deemed frail were delisted/died compared to 8.7% deemed not frail. Compared to LT-FS-Body Composition, the specificity and strength of associations with delisting /death was slightly less for LT-FS-Base and slightly greater for LT-FS-Biomarker.
Important limitations need to be considered. Most notably, the COVID19 pandemic interrupted our ability to recruit and complete all study measures on our target number of participants. The smaller sample size precluded us from developing separate derivation and validation cohorts. Although some other transplant centers collect the SPPB and FFP, none have banked serum paired with frailty assessments or routinely collect CRP. We also only included first-time lung transplant candidates. Many of the putative causes of frailty may be triggered by organ transplantation where off-target side effects of immunosuppression can cause sarcopenia, adiposity, and comorbidities including diabetes mellitus, hypertension, kidney disease, and osteoporosis.40–45 Understanding how frailty assessment may inform risk stratification in candidates for re-transplantation—a group with generally poorer outcomes compared to first-time transplant recipients—remains an important knowledge gap. Although the time-related nature of our data missingness appears random, whether this missingness and smaller sample size impacted which specific biomarkers were included or excluded is unknown. Thus, our findings should be considered preliminary until they can be confirmed in another population. In addition, during the time approaching waitlisting or while listed, participants likely engaged in various amounts of formal and informal exercise, including pulmonary rehabilitation programs or inpatient rehabilitation, that could have impacted their degree of frailty or the values of some of the biomarkers and body composition measures that made up the LT-FS measures. Further, after transplant differing doses of rehabilitation could have mitigated some of the mortality risk attributable to pre-transplant frailty. Since we did not have access to reliable records of the amount and type of exercises participants performed across the transplant journey, the impact of rehabilitation cannot be determined. Although not explicitly a limitation, the method we followed for index development sought to maximize overall model performance (e.g., maximizing AUC by balancing sensitivity and specificity). For clinicians considering applying the LT-FS—or any measure of frailty, for that matter— clinically, it is important to be cognizant of these different index features. Future research could consider evaluating a range of cut points to provide options for defining frailty based on study needs (e.g., screening programs, testing interventions, etc.). We carefully reviewed the literature and tested all conceptual domains of physical frailty with precedent in the literature of frailty and lung transplantation or that had biologic plausibility. It is possible that conceptual domains of frailty we did include not could have been informative. Because this study is ongoing and the cohort has not accrued the full planned post-operative follow-up time, a robust understanding of the association between LT-FS and longer term post-operative outcomes will remain unknown for some time. Our sample size and 3.4% first-year mortality rate may have impacted our power to detect a statistically significant association between SPPB and FFP and mortality after transplant. Relatedly, the limited number of deaths after transplant precluded us from performing analyses stratified by age group or diagnosis and the wide confidence intervals around mortality risk emphasize that the point estimates of risk should be interpreted cautiously.
Despite these limitations, our study has important strengths. First, the LT-FS is a novel measure of physical frailty designed for advanced lung disease and lung transplantation. It emerged from a prospective, multicenter cohort study explicitly designed for this purpose. As a result, the candidate measures considered for the LT-FS reflected the consideration of decades of research into the pathobiology of frailty; the prospective consideration and collection of candidate operational measures of frailty domains unlikely to be confounded by lung disease; and a large cohort of participants from multiple centers. We followed a validated, stepwise approach to index development. The LT-FS joins the Liver Frailty Index, a 66-item Cystic Fibrosis-specific, and a 40-item pan-solid organ transplant cumulative deficit index as contemporary measures of frailty designed for use in organ transplant populations.3,24 The concurrent collection of the FFP-DASI and SPPB allowed us to also compare the performance of the LT-FS to commonly used measures of physical frailty in lung transplantation. In 2017 we improved the validity original FFP by refining the “low activity” domain (the FFP-DASI).28 At that time, we hypothesized that refinements beyond a single domain might further improve the measurement of frailty in advanced lung disease and transplant. The LT-FS confirms this hypothesis. Lastly, we consider the development of three versions of the LT-FS to be a strength. The needs of clinicians and researchers interested in frailty in lung transplantation—and ageing, more generally—incompletely overlap.
The different versions of the LT-FS provide groups of users with measures tailored to their needs. For clinicians, the LT-FS-Body Composition (or LT-FS-Base) could be considered as a new option to address international recommendations to include frailty assessment in the consideration of candidates for lung transplantation.9 For researchers, the LT-FS-Biomarker demonstrates the relevance of novel constructs in physical frailty.
Measuring biomarkers of frailty may provide insights into how frailty develops in advanced lung disease and transplant, identify whether heterogenous pathobiology might explain why pre-transplant frailty contributes to poor outcomes such as mortality in some yet resolves after transplant in many others, and inform the design of interventions to prevent or reverse frailty. This is timely as the NIH and international transplant societies have identified the development of interventions to treat frailty in solid organ transplant candidates as a priority. Group-level analyses of randomized controlled trials of exercise with or without dietary modification in community dwelling older adults and single-arm interventions in adults with lung and heart disease and in lung transplantation show that frailty is reversible.46–52 These same trials, however, show that frailty fails to improve in roughly 30-40% of individual intervention participants for unknown and unexamined reasons. It is possible that responsiveness might be a reflection of heterogenous underlying pathobiology. Measuring biomarkers and their responsiveness to treatment may identify subgroups of frailty more likely to respond to treatment or subgroups who might benefit from therapies to supplement a base intervention of exercise and diet modification. Lastly, some of the biomarkers we identified have the potential to serve as surrogate measures for future adaptive trials.
Although the LT-FS represents a step forward in frailty assessment, it—nor any other current measure of frailty—should not be used as a sole determinant for restricting access to life-saving therapies such as lung transplantation. A substantial proportion of frailty by SPPB and FFP in lung transplant candidates seem to be attributable to end-stage lung disease and resolves after transplant.53,54 Rather than restricting access to transplant, frailty screening may identify lung transplant candidates who can benefit from targeted interventions. Frailty screening may also inform patient-facing and internal transplant team discussions of risks for poorer outcomes after transplant. Although the causes of frailty are multifactorial, exercise and diet remain the gold-standard treatments for frailty as they target many frailty driving mechanisms. As noted above, there is strong evidence that frailty can be both prevented and ameliorated by physical activity with or without dietary modification. Although not all frailty resolves with exercise and nutrition optimization, absent more data, it would be appropriate to prescribe these to frail lung transplant candidates, where feasible. Notably, barriers to accessing hospital-based rehabilitation in a timely fashion are substantial.55–57 Reflecting these barriers, the NHLBI and professional societies have also deemed the development of novel intervention strategies, include remote-based interventions, to treat frailty in lung and other solid organ transplant populations a priority.10,17
In sum, the Lung Transplant Frailty Scale is a novel, multidimensional measure of physical frailty designed for advanced lung disease and transplantation. We hope that the LT-FS can aid efforts to define the role of frailty in the transplant evaluation process and advance efforts to study its development and treatment.
Supplementary Material
Acknowledgments
The authors would like to acknowledge our patients for participating in this study. Without their involvement this research would not be possible.
Funding:
NHLBI R01 HL134851 (JPS) & HL151552 (JRG). VA CDA IK2CX002011 (JRG), U01HL145435 (JPS, JDC), K24HL115354 (JDC)
Abbreviations:
- SPPB
Short Physical Performance Battery
- FFP
Fried Frailty Phenotype
- FFP-DASI
Fried Frailty Phenotype with Duke Activity Status Index modification
- LT-FS
Lung Transplant Frailty Scale
- UCSF
University of California, San Francisco
- CUMC
Columbia University Medical Center
- Penn
University of Pennsylvania
- DXA
dual x-ray absorptiometry
- LTBC
Lung Transplant Body Composition Study
- ASMI
Appendicular Skeletal Muscle Index
- LAS
Lung Allocation Score
- HRQL
Health-related quality of life
- SF12-PCS
Medical Outcomes Study Short Form-12 Physical Component Summary Scale
- LOS
length of stay
- ROC
receiver operating curve
- AIC
Akaiki Information Criteria
- AUC
area under the curve
- IL-6
Interleukin 6
- IP-10
interferon-inducible protein 10
- TNFa
Tumor necrosis factor alpha
- TNF-R1
TNF receptor-1
- IL-1Ra
Interleukin-1 receptor antagonist
- PTX-3
Pentraxin-3
- CRP
C-reactive protein
- GDF-15
Growth differentiation factor 15, vimentin
- FGF-21
Fibroblast growth factor 21
- FGF-23
Fibroblast growth factor-23
- IGF-1
Insulin like Growth Factor-1
Footnotes
Financial Conflict of Interest
The authors have no relevant conflicts of interest to disclose.
References:
- 1.Singer JP, Diamond JM, Gries C, et al. Frailty phenotypies, disability, and outcomes in adult candidates for lung transplantation. Am J Respir Crit Care Med. 2015;192(11):1325–34. doi: 10.1164/rccm.201506-1150OC [DOI] [PMC free article] [PubMed] [Google Scholar]
- 2.Singer JP, Diamond JM, Anderson MR, et al. Frailty phenotypes and mortality after lung transplantation: A prospective cohort study. Am J Transplant. Aug 2018;18(8):1995–2004. doi: 10.1111/ajt.14873 [DOI] [PMC free article] [PubMed] [Google Scholar]
- 3.Varughese RA, Theou O, Li Y, et al. Cumulative Deficits Frailty Index Predicts Outcomes for Solid Organ Transplant Candidates. Transplant Direct. Mar 2021;7(3):e677. doi: 10.1097/txd.0000000000001094 [DOI] [PMC free article] [PubMed] [Google Scholar]
- 4.Wilson ME, Vakil AP, Kandel P, Undavalli C, Dunlay SM, Kennedy CC. Pretransplant frailty is associated with decreased survival after lung transplantation. The Journal of heart and lung transplantation : the official publication of the International Society for Heart Transplantation. Feb 2016;35(2):173–8. doi: 10.1016/j.healun.2015.10.014 [DOI] [PubMed] [Google Scholar]
- 5.Montgomery E, Macdonald PS, Newton PJ, et al. Frailty as a Predictor of Mortality in Patients With Interstitial Lung Disease Referred for Lung Transplantation. Transplantation. Apr 2020;104(4):864–872. doi: 10.1097/tp.0000000000002901 [DOI] [PubMed] [Google Scholar]
- 6.Montgomery E, Macdonald PS, Newton PJ, Jha SR, Malouf M. Frailty in lung transplantation: a systematic review. Expert review of respiratory medicine. Feb 2020;14(2):219–227. doi: 10.1080/17476348.2020.1702527 [DOI] [PubMed] [Google Scholar]
- 7.Schaenman JM, Diamond JM, Greenland JR, et al. Frailty and aging-associated syndromes in lung transplant candidates and recipients. Am J Transplant. Jun 2021;21(6):2018–2024. doi: 10.1111/ajt.16439 [DOI] [PMC free article] [PubMed] [Google Scholar]
- 8.Montgomery E, Newton PJ, Chang S, et al. Frailty Measures in Patients Listed for Lung Transplantation. Transplantation. May 1 2022;106(5):1084–1092. doi: 10.1097/tp.0000000000003823 [DOI] [PubMed] [Google Scholar]
- 9.Leard LE, Holm AM, Valapour M, et al. Consensus document for the selection of lung transplant candidates: An update from the International Society for Heart and Lung Transplantation. The Journal of heart and lung transplantation : the official publication of the International Society for Heart Transplantation. Nov 2021;40(11):1349–1379. doi: 10.1016/j.healun.2021.07.005 [DOI] [PMC free article] [PubMed] [Google Scholar]
- 10.Kobashigawa J, Dadhania D, Bhorade S, et al. Report from the American Society of Transplantation on frailty in solid organ transplantation. Am J Transplant. Apr 2019;19(4):984–994. doi: 10.1111/ajt.15198 [DOI] [PMC free article] [PubMed] [Google Scholar]
- 11.Rockwood K What would make a definition of frailty successful? Age and ageing. Sep 2005;34(5):432–4. doi: 10.1093/ageing/afi146 [DOI] [PubMed] [Google Scholar]
- 12.Theou O, Brothers TD, Mitnitski A, Rockwood K. Operationalization of frailty using eight commonly used scales and comparison of their ability to predict all-cause mortality. J Am Geriatr Soc. Sep 2013;61(9):1537–51. doi: 10.1111/jgs.12420 [DOI] [PubMed] [Google Scholar]
- 13.de Vries NM, Staal JB, van Ravensberg CD, Hobbelen JS, Olde Rikkert MG, Nijhuis-van der Sanden MW. Outcome instruments to measure frailty: a systematic review. Ageing research reviews. Jan 2011;10(1):104–14. doi: 10.1016/j.arr.2010.09.001 [DOI] [PubMed] [Google Scholar]
- 14.Theou O, Brothers TD, Pena FG, Mitnitski A, Rockwood K. Identifying common characteristics of frailty across seven scales. J Am Geriatr Soc. May 2014;62(5):901–6. doi: 10.1111/jgs.12773 [DOI] [PubMed] [Google Scholar]
- 15.Morley JE, Vellas B, Abellan van Kan G, et al. Frailty consensus: a call to action. Journal of the American Medical Directors Association. Jun 2013;14(6):392–7. doi: 10.1016/j.jamda.2013.03.022 [DOI] [PMC free article] [PubMed] [Google Scholar]
- 16.Rodriguez-Manas L, Feart C, Mann G, et al. Searching for an operational definition of frailty: a Delphi method based consensus statement: the frailty operative definition-consensus conference project. The journals of gerontology Series A, Biological sciences and medical sciences. Jan 2013;68(1):62–7. doi: 10.1093/gerona/gls119 [DOI] [PMC free article] [PubMed] [Google Scholar]
- 17.Mulligan MS, Weill D, Davis RD, et al. National Heart, Lung, and Blood Institute and American Association for Thoracic Surgery Workshop Report: Identifying collaborative clinical research priorities in lung transplantation. The Journal of thoracic and cardiovascular surgery. Aug 18 2018;doi: 10.1016/j.jtcvs.2018.08.010 [DOI] [PMC free article] [PubMed] [Google Scholar]
- 18.Lopez-Otin C, Blasco MA, Partridge L, Serrano M, Kroemer G. The hallmarks of aging. Cell. Jun 6 2013;153(6):1194–217. doi: 10.1016/j.cell.2013.05.039 [DOI] [PMC free article] [PubMed] [Google Scholar]
- 19.Walston J, Hadley EC, Ferrucci L, et al. Research agenda for frailty in older adults: toward a better understanding of physiology and etiology: summary from the American Geriatrics Society/National Institute on Aging Research Conference on Frailty in Older Adults. Journal of the American Geriatrics Society. Jun 2006;54(6):991–1001. doi: 10.1111/j.1532-5415.2006.00745.x [DOI] [PubMed] [Google Scholar]
- 20.Maheshwari JA, Kolaitis NA, Anderson MR, et al. Construct and Predictive Validity of Sarcopenia in Lung Transplant Candidates. Ann Am Thorac Soc. Feb 10 2021;doi: 10.1513/AnnalsATS.202007-796OC [DOI] [PMC free article] [PubMed] [Google Scholar]
- 21.Anderson MR, Easthausen I, Gallagher G, et al. Skeletal muscle adiposity and outcomes in candidates for lung transplantation: a lung transplant body composition cohort study. Thorax. Jun 1 2020;doi: 10.1136/thoraxjnl-2019-214461 [DOI] [PMC free article] [PubMed] [Google Scholar]
- 22.Anderson MR, Udupa JK, Edwin E, et al. Adipose tissue quantification and primary graft dysfunction after lung transplantation: The Lung Transplant Body Composition study. The Journal of heart and lung transplantation : the official publication of the International Society for Heart Transplantation. Dec 2019;38(12):1246–1256. doi: 10.1016/j.healun.2019.08.013 [DOI] [PMC free article] [PubMed] [Google Scholar]
- 23.Mitnitski AB, Mogilner AJ, Rockwood K. Accumulation of deficits as a proxy measure of aging. ScientificWorldJournal. Aug 8 2001;1:323–36. doi: 10.1100/tsw.2001.58 [DOI] [PMC free article] [PubMed] [Google Scholar]
- 24.Lai JC, Covinsky KE, Dodge JL, et al. Development of a novel frailty index to predict mortality in patients with end-stage liver disease. Hepatology. Aug 2017;66(2):564–574. doi: 10.1002/hep.29219 [DOI] [PMC free article] [PubMed] [Google Scholar]
- 25.Guralnik JM, Simonsick EM, Ferrucci L, et al. A short physical performance battery assessing lower extremity function: association with self-reported disability and prediction of mortality and nursing home admission. J Gerontol. Mar 1994;49(2):M85–94. [DOI] [PubMed] [Google Scholar]
- 26.Guralnik JM, Ferrucci L, Simonsick EM, Salive ME, Wallace RB. Lower-extremity function in persons over the age of 70 years as a predictor of subsequent disability. The New England journal of medicine. Mar 2 1995;332(9):556–61. doi: 10.1056/NEJM199503023320902 [DOI] [PMC free article] [PubMed] [Google Scholar]
- 27.Fried LP, Tangen CM, Walston J, et al. Frailty in older adults: evidence for a phenotype. The journals of gerontology Series A, Biological sciences and medical sciences. Mar 2001;56(3):M146–56. [DOI] [PubMed] [Google Scholar]
- 28.Baldwin MR, Singer JP, Huang D, et al. Refining Low Physical Activity Measurement Improves Frailty Assessment in Advanced Lung Disease and Survivors of Critical Illness. Ann Am Thorac Soc. Apr 11 2017;doi: 10.1513/AnnalsATS.201612-1008OC [DOI] [PMC free article] [PubMed] [Google Scholar]
- 29.Anderson MR, Kolaitis NA, Gao Y, et al. A nonlinear relationship between visceral adipose tissue and frailty in adult lung transplant candidates. Am J Transplant. Jul 6 2019;doi: 10.1111/ajt.15525 [DOI] [PMC free article] [PubMed] [Google Scholar]
- 30.Faria SL, Faria OP, Cardeal MD, Ito MK. Validation study of multi-frequency bioelectrical impedance with dual-energy X-ray absorptiometry among obese patients. Obes Surg. Sep 2014;24(9):1476–80. doi: 10.1007/s11695-014-1190-5 [DOI] [PubMed] [Google Scholar]
- 31.Ling CH, de Craen AJ, Slagboom PE, et al. Accuracy of direct segmental multi-frequency bioimpedance analysis in the assessment of total body and segmental body composition in middle-aged adult population. Clin Nutr. Oct 2011;30(5):610–5. doi: 10.1016/j.clnu.2011.04.001 [DOI] [PubMed] [Google Scholar]
- 32.Cardoso AL, Fernandes A, Aguilar-Pimentel JA, et al. Towards frailty biomarkers: Candidates from genes and pathways regulated in aging and age-related diseases. Ageing research reviews. Nov 2018;47:214–277. doi: 10.1016/j.arr.2018.07.004 [DOI] [PubMed] [Google Scholar]
- 33.Egan TM, Murray S, Bustami RT, et al. Development of the new lung allocation system in the United States. Am J Transplant. 2006;6(5 Pt 2):1212–27. [DOI] [PubMed] [Google Scholar]
- 34.Singer JP, Blanc PD, Dean YM, et al. Development and validation of a lung transplant-specific disability questionnaire. Thorax. May 2014;69(5):445–50. doi: 10.1136/thoraxjnl-2013-204557 [DOI] [PMC free article] [PubMed] [Google Scholar]
- 35.Ware JE, Kosinski M, Keller SD. A 12-item short-form health survey - Construction of scales and preliminary tests of reliability and validity. Med Care. Mar 1996;34(3):220–233. doi:Doi 10.1097/00005650-199603000-00003 [DOI] [PubMed] [Google Scholar]
- 36.Beaton DE, Boers M, Wells GA. Many faces of the minimal clinically important difference (MCID): a literature review and directions for future research. Curr Opin Rheumatol. Mar 2002;14(2):109–114. doi:Doi 10.1097/00002281-200203000-00006 [DOI] [PubMed] [Google Scholar]
- 37.Streiner DL, Norman GR. Health measurement scales : a practical guide to their development and use. 3rd ed. Oxford medical publications. Oxford University Press; 2003:xii, 283 p. [Google Scholar]
- 38.GRAMBSCH PM THERNEAU TM. Proportional hazards tests and diagnostics based on weighted residuals. Biometrika. 1994;81(3):515–526. doi: 10.1093/biomet/81.3.515 [DOI] [Google Scholar]
- 39.Leening MJ, Vedder MM, Witteman JC, Pencina MJ, Steyerberg EW. Net reclassification improvement: computation, interpretation, and controversies: a literature review and clinician’s guide. Ann Intern Med. Jan 21 2014;160(2):122–31. doi: 10.7326/m13-1522 [DOI] [PubMed] [Google Scholar]
- 40.Brito-Costa A, Pereira-da-Silva L, Papoila AL, et al. Factors Associated With Changes in Body Composition Shortly After Orthotopic Liver Transplantation: The Potential Influence of Immunosuppressive Agents. Transplantation. Aug 2016;100(8):1714–22. doi: 10.1097/TP.0000000000001202 [DOI] [PubMed] [Google Scholar]
- 41.Simon N, Morin C, Urien S, Tillement JP, Bruguerolle B. Tacrolimus and sirolimus decrease oxidative phosphorylation of isolated rat kidney mitochondria. Br J Pharmacol. Jan 2003;138(2):369–76. doi: 10.1038/sj.bjp.0705038 [DOI] [PMC free article] [PubMed] [Google Scholar]
- 42.Choudhary NS, Saigal S, Saraf N, et al. Sarcopenic obesity with metabolic syndrome: a newly recognized entity following living donor liver transplantation. Clin Transplant. Mar 2015;29(3):211–5. doi: 10.1111/ctr.12505 [DOI] [PubMed] [Google Scholar]
- 43.Hackman KL, Bailey MJ, Snell GI, Bach LA. Diabetes is a major risk factor for mortality after lung transplantation. Am J Transplant. Feb 2014;14(2):438–45. doi: 10.1111/ajt.12561 [DOI] [PubMed] [Google Scholar]
- 44.Sithamparanathan S, Thirugnanasothy L, Clark S, et al. Observational study of lung transplant recipients surviving 20 years. Respir Med. Aug 2016;117:103–8. doi: 10.1016/j.rmed.2016.06.008 [DOI] [PubMed] [Google Scholar]
- 45.Ferrari SL, Nicod LP, Hamacher J, et al. Osteoporosis in patients undergoing lung transplantation. Eur Respir J. Nov 1996;9(11):2378–82. [DOI] [PubMed] [Google Scholar]
- 46.Apóstolo J, Cooke R, Bobrowicz-Campos E, et al. Effectiveness of interventions to prevent pre-frailty and frailty progression in older adults: a systematic review. JBI database of systematic reviews and implementation reports. 2018;16(1):140–232. doi: 10.11124/JBISRIR-2017-003382 [DOI] [PMC free article] [PubMed] [Google Scholar]
- 47.Singer JP, Soong A, Bruun A, et al. A mobile health technology enabled home-based intervention to treat frailty in adult lung transplant candidates: A pilot study. Clinical transplantation. Jun 2018;32(6):e13274. doi: 10.1111/ctr.13274 [DOI] [PMC free article] [PubMed] [Google Scholar]
- 48.Diamond JM, Courtwright AM, Balar P, et al. Mobile health technology to improve emergent frailty after lung transplantation. Clinical transplantation. Feb 2 2021:e14236. doi: 10.1111/ctr.14236 [DOI] [PubMed] [Google Scholar]
- 49.de Labra C, Guimaraes-Pinheiro C, Maseda A, Lorenzo T, Millán-Calenti JC. Effects of physical exercise interventions in frail older adults: a systematic review of randomized controlled trials. BMC Geriatrics. 2015/12/February 2015;15(1):154. doi: 10.1186/s12877-015-0155-4 [DOI] [PMC free article] [PubMed] [Google Scholar]
- 50.Investigators LS, Pahor M, Blair SN, et al. Effects of a physical activity intervention on measures of physical performance: Results of the lifestyle interventions and independence for Elders Pilot (LIFE-P) study. The journals of gerontology Series A, Biological sciences and medical sciences. Nov 2006;61(11):1157–65. doi: 10.1093/gerona/61.11.1157 [DOI] [PubMed] [Google Scholar]
- 51.Ng TP, Feng L, Nyunt MSZ, et al. Nutritional, Physical, Cognitive, and Combination Interventions and Frailty Reversal Among Older Adults: A Randomized Controlled Trial. Am J Med. 2015;128(11):1225–1236.e1. [DOI] [PubMed] [Google Scholar]
- 52.Maddocks M, Kon SS, Canavan JL, et al. Physical frailty and pulmonary rehabilitation in COPD: a prospective cohort study. Thorax. Nov 2016;71(11):988–995. doi: 10.1136/thoraxjnl-2016-208460 [DOI] [PMC free article] [PubMed] [Google Scholar]
- 53.Venado A, McCulloch C, Greenland JR, et al. Frailty trajectories in adult lung transplantation: A cohort study. The Journal of heart and lung transplantation : the official publication of the International Society for Heart Transplantation. Jul 2019;38(7):699–707. doi: 10.1016/j.healun.2019.03.006 [DOI] [PMC free article] [PubMed] [Google Scholar]
- 54.Montgomery E, Macdonald PS, Newton PJ, et al. Reversibility of Frailty after Lung Transplantation. J Transplant. 2020;2020:3239495. doi: 10.1155/2020/3239495 [DOI] [PMC free article] [PubMed] [Google Scholar]
- 55.Keating A, Lee A, Holland AE. What prevents people with chronic obstructive pulmonary disease from attending pulmonary rehabilitation? A systematic review. Chron Respir Dis. 2011;8(2):89–99. doi: 10.1177/1479972310393756 [DOI] [PubMed] [Google Scholar]
- 56.Selzler AM, Simmonds L, Rodgers WM, Wong EY, Stickland MK. Pulmonary rehabilitation in chronic obstructive pulmonary disease: predictors of program completion and success. Copd. Aug 2012;9(5):538–45. doi: 10.3109/15412555.2012.705365 [DOI] [PubMed] [Google Scholar]
- 57.Vogiatzis I, Rochester CL, Spruit MA, Troosters T, Clini EM. Increasing implementation and delivery of pulmonary rehabilitation: key messages from the new ATS/ERS policy statement. Eur Respir J. May 2016;47(5):1336–41. doi: 10.1183/13993003.02151-2015 [DOI] [PubMed] [Google Scholar]
Associated Data
This section collects any data citations, data availability statements, or supplementary materials included in this article.


