Abstract
In atherosclerosis, some regulatory T (Treg) cells become exTreg cells. We crossed inducible Treg and exTreg cell lineage-tracker mice (FoxP3eGFP−Cre-ERT2 ROSA26CAG-fl-stop-fl-tdTomato) to atherosclerosis-prone Apoe−/− mice, sorted Treg cells and exTreg cells and determined their transcriptomes by bulk RNA sequencing (RNA-seq). Genes that were differentially expressed between mouse Treg cells and exTreg cells and filtered for their presence in a human single-cell RNA-sequencing (scRNA-seq) panel identified exTreg cell signature genes as CST7, NKG7, GZMA, PRF1, TBX21 and CCL4. Projecting these genes onto the human scRNA-seq with CITE-seq data identified human exTreg cells as CD3+CD4+CD16+CD56+, which was validated by flow cytometry. Bulk RNA-seq of sorted human exTreg cells identified them as inflammatory and cytotoxic CD4+T cells that were significantly distinct from both natural killer and Treg cells. DNA sequencing for T cell receptor-β showed clonal expansion of Treg cell CDR3 sequences in exTreg cells. Cytotoxicity was functionally demonstrated in cell killing and CD107a degranulation assays, which identifies human exTreg cells as cytotoxic CD4+T cells.
Atherosclerosis is a chronic inflammatory disease of the artery walls with clear evidence of a systemic CD4+T cell-mediated autoimmune response to apolipoprotein B (ApoB) epitopes in mice1–5 and humans3,6,7. Treg cells play a protective role via anti-inflammatory cytokines and contact-dependent mechanisms8,9 and represent a promising therapeutic tool. Under inflammatory conditions, Treg cells become plastic, that is, they acquire lineage-defining transcription factors in addition to FoxP3 (called TH-like Treg cells)10–12, like T-bet for TH1 or RORγt for TH17. In chronic inflammation, Treg cells become unstable and lose CD25 and FoxP3 expression13. Such exTreg cells have been identified in mouse disease models such as in type 1 diabetes14, experimentally induced autoimmune encephalomyelitis15, arthritis16 and atherosclerosis4,7,10,11,17. In some studies, exTreg cells have been reported to express RORγT and produce interleukin (IL)-17A14,16,18, or T-bet and interferon (IFN)-γ14,15,19 or Bcl6 and CXCR5 (ref. 17). However, complete transcriptomes of exTreg cells have not been reported. Here, we use the inducible Treg cell lineage-tracker mouse strain FoxP3-eGFP−Cre-ERT2 (ref. 20) ROSA26CAG-fl-stop-fl-tdTomato, crossed into atherosclerosis-prone Apoe−/− mice. Tamoxifen injection induces the generation of tdTomato and GFP-expressing Foxp3+ Treg cells. Converted exTreg cells are detectable as GFP−tdTomato+CD4+T cells.
Human exTreg cells are suspected to exist, but have not been described. In a previous study, transcriptomic analysis of tetramer-sorted APOB-specific human CD4+ T cells, which are expected to contain Treg cells and exTreg cells based on the mouse studies4,7,11,17, revealed that exTreg cells are not similar to Treg cells7. In fact, exTreg cells mapped widely across a uniform manifold approximation and projection (UMAP) plot constructed of Treg cells, TH1 and memory T cells. The present study was designed to identify human exTreg cells by using an integrated approach of mapping gene signatures from sorted mouse exTreg cell transcriptomes to human scRNA-seq with cellular indexing of transcriptomes and epitopes sequencing (CITE-seq) data, followed by T cell antigen receptor sequencing (TCR-seq), bulk RNA-seq and functional characterization of sorted human exTreg cells. Bulk RNA-seq of sorted Treg cells and exTreg cells from the lineage-tracker mice on the Apoe−/− background yielded high-quality transcriptomes identifying hundreds of differentially expressed genes (DEGs). Then, we extracted gene signatures from exTreg cells and mapped them to a published and publicly available human peripheral blood mononuclear cell (hPBMC) scRNA-seq dataset21. This dataset also had information on cell surface phenotype by CITE-seq. This identified surface markers on CD4+T cells that expressed the exTreg cell signature genes. These were in turn used to sort the putative exTreg cells from human blood, obtain high-quality, deep transcriptomes and assess their function. To identify the provenance of human exTreg cells, we used TCRβ sequencing. We reasoned that exTreg cells derived from Treg cells might show clonal expansion of TCRβ sequences found in Treg cells. TCR diversity was assessed by analyzing TCR CDR3 sequences directly and using GLIPH22.
Results
Differentially expressed mouse exTreg and Treg cell-classifying genes
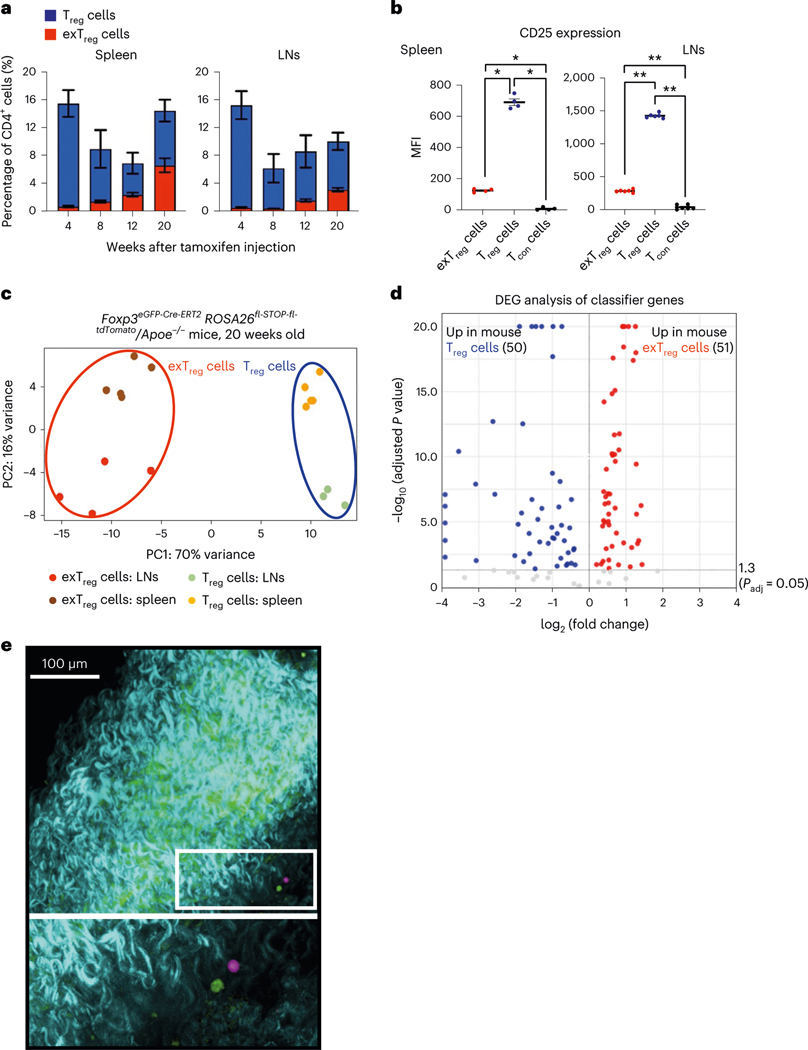
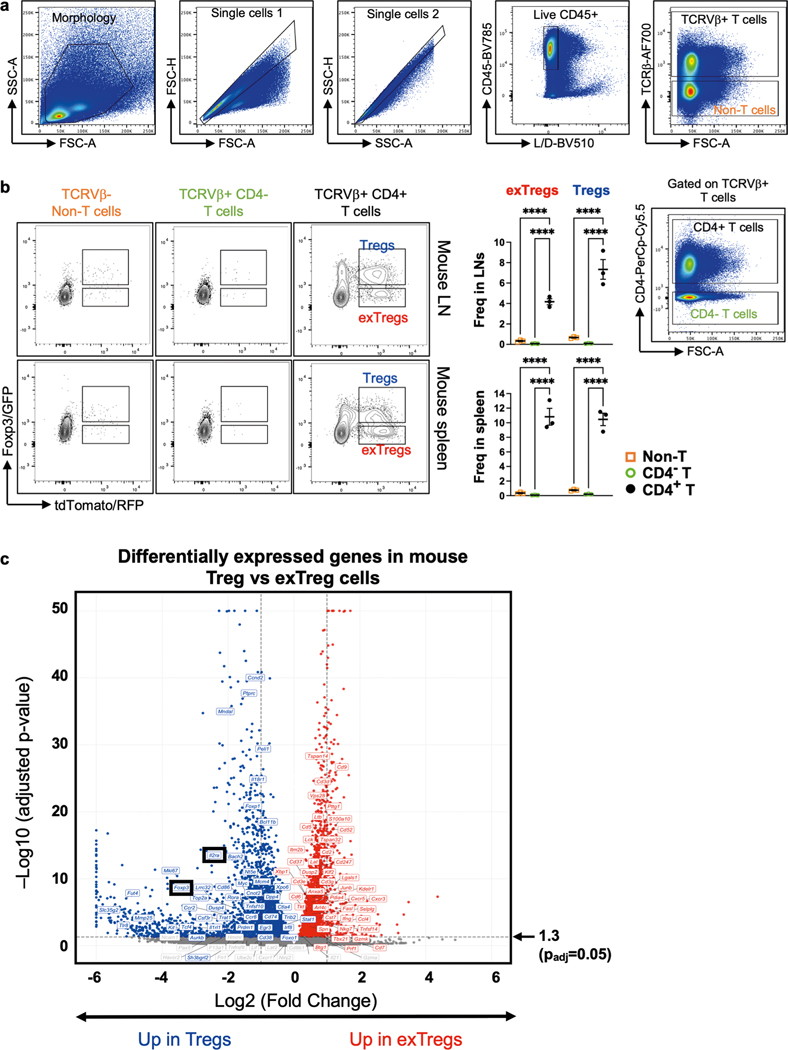
To track exTreg cells in mice under conditions of chronic sterile inflammation, we used a recently published mouse model7, in which we crossed an inducible FoxP3-Cre lineage-tracker mouse strain (FoxP3eGFP-Cre-ERT2ROSA26CAG-fl-stop-fl-tdTomato) into the atherosclerosis-prone Apoe−/− mouse strain. Both strains are in a C57BL/6 background. Apoe−/− mice develop atherosclerosis with chronic inflammation, which can trigger Treg cell instability and exTreg cell formation. In tamoxifen-injected mice, GFP+tdTomato+ Treg cells and GFP−tdTomato+ exTreg cells are detected as distinct CD4+T cell subsets, with negligible GFP+ or tdTomato+ cells among control non-T cells and CD4− T cells (Extended Data Fig. 1a). We quantified the frequencies of Treg cells (GFP+tdTomato+) and exTreg cells (GFP−tdTomato+) in the spleen and lymph nodes (LNs) of these mice at 4, 8, 12 and 20 weeks of age after tamoxifen injection (Fig. 1a). At 4 weeks, exTreg cells accounted for <1% of total CD4+T cells in either organ. They gradually accumulated over time, reaching ~7% in spleen and ~4% in LNs at 20 weeks. As previously reported10,14, we observed significantly lower surface expression of CD25 in exTreg cells (Fig. 1b) than in Treg cells.
Fig. 1 |. Deep transcriptomes from mouse exTreg cells and Treg cells identify differentially expressed candidate genes.
a, Frequency of mouse exTreg cells (red) and Treg cells (blue) among all CD4+T cells in spleen and LNs of FoxP3eGFP-Cre-ERT2ROSA26CAG-fl-stop-fl-tdTomato Apoe−/− mice at 4 (Treg n = 7; exTreg n = 5), 8 (Treg n = 4; exTreg n = 4), 12 (Treg n = 5; exTreg n = 5) and 20 (Treg n = 6; exTreg n = 5) weeks after tamoxifen injection. All mice were on regular CD. b, Median fluorescence intensity (MFI) of CD25 expression on exTreg cells (red circles), Treg cells (blue circles) and conventional CD4+T cells (Tcon, black circles) in spleen (n = 4) and LNs (n = 6) from 16-week-old FoxP3eGFP-Cre-ERT2ROSA26CAG-fl-stop-fl-tdTomato Apoe−/− mice on CD. Results (a and b) are represented as the mean ± s.e.m. Spleen (b) *P = 0.0286; LN (b) **P = 0.0022; two-tailed Mann–Whitney U test. c, PCA of bulk RNA-seq data from sorted mouse exTreg cells and Treg cells from spleen and LNs of 20-week-old FoxP3eGFP-Cre-ERT2ROSA26CAG-fl-stop-fl-tdTomato Apoe−/− mice on CD. Results (a–c) are from independent biological replicates. d, Volcano plot of differentially expressed mouse exTreg and Treg cell-classifying genes, identified by the SVM trained on mouse transcripts with human orthologs and filtered for those present in the human scRNA-seq targeted gene panel. y and x axes capped at 20 (P = 10−20) and ±4 (log2FC), respectively. Horizontal line at −log10 (P adjusted) = 1.3 (same as Padj = 0.05). Statistical analyses were performed using a two-tailed Wald test with Benjamini–Hochberg P-value adjustment. e, Mouse aortas with carotid artery branches from FoxP3eGFP-Cre-ERT2ROSA26CAG-fl-stop-fl-tdTomato Apoe−/− mice were fixed and imaged using a Leica SP8 multiphoton microscope. GFP+ Treg cells (pseudocolored green) and tdTomato+ exTreg cells (pseudocolored pink) in the adventitia (top). Bottom image is a zoomed-in view of the white box. Blue-green indicates a second harmonic generation microscopy analysis of extracellular matrix. Scale bar, 100 μm. Data are representative of four independent experiments.
Mice of both sexes were maintained on a regular chow diet (CD) and LNs and spleens were collected at 20 weeks after tamoxifen injection. Treg cells (TCRβ+CD4+GFP+tdTomato+) and exTreg cells (TCRβ+C D4+GFP−tdTomato+) were sorted by flow cytometry (sorting scheme as previously described7) and sequenced using an optimized bulk RNA-seq method. In the principal component analysis (PCA), principal component (PC) 1 distinguished between Treg cells and exTreg cells and PC2 distinguished between the site of origin (LNs or spleens; Fig. 1c). The first two components explained the majority (86%) of the transcriptome variance. The mouse genes were filtered for human orthologs and intersected with a published dataset of 496 human genes that were analyzed by scRNA-seq with CITE-seq21. Mouse orthologs were found for 383 of the 496 human genes (Supplementary Table 1). Expression of these 383 genes in the transcriptomes from sorted mouse Treg cells and exTreg cells were used to train a support vector machine (SVM) model. Treg cell versus exTreg cell genes were ranked by weight and the top 60 classifying genes were identified for each subset (Supplementary Table 2). As expected, the top 60 genes classifying Treg cells included Foxp3 and Il2ra (encoding CD25; Extended Data Fig. 1b). The top 60 genes classifying exTreg cells included Tbx21, Gzmk, Prf1, Nkg7, Ifng and Ccl4 (Extended Data Fig. 1b). Most (50 of 60 Treg cell genes and 51 of 60 exTreg cell genes) were significantly (P adjusted < 0.05) differentially expressed between mouse Treg cells and exTreg cells (Fig. 1d, statistics in Supplementary Table 3). Treg cells and exTreg cells were also found in the artery wall (Fig. 1e), but numbers were insufficient for cell sorting.
exTreg cell-specific genes and surface markers in human CD4+ T cells
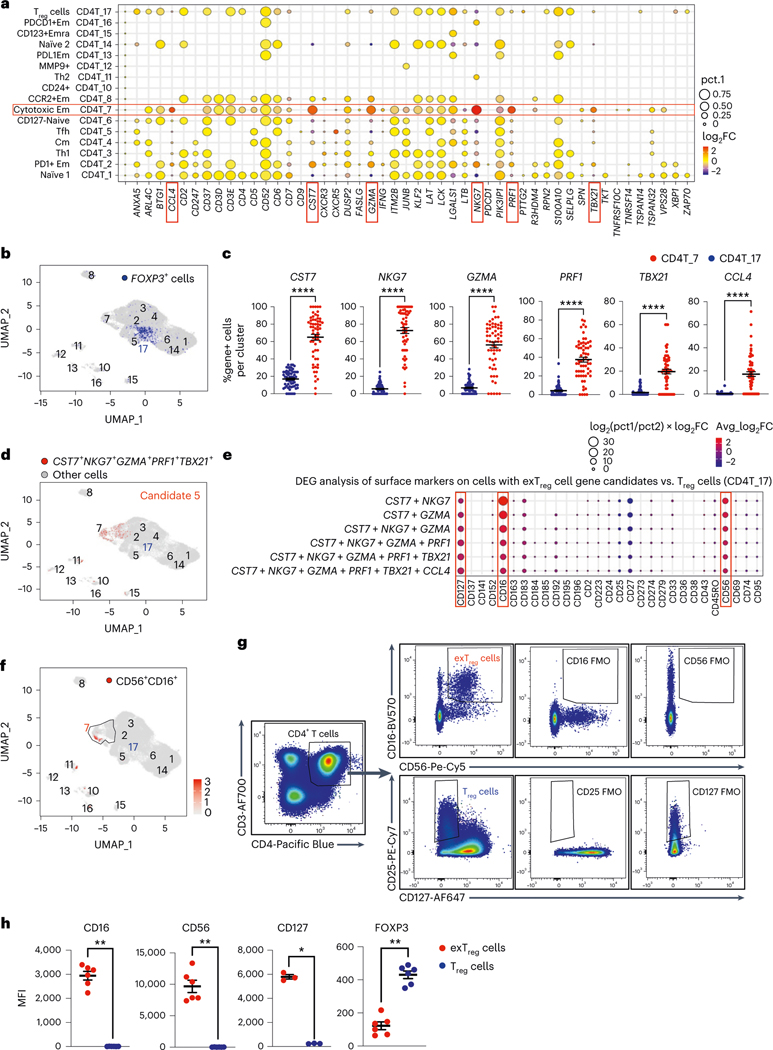
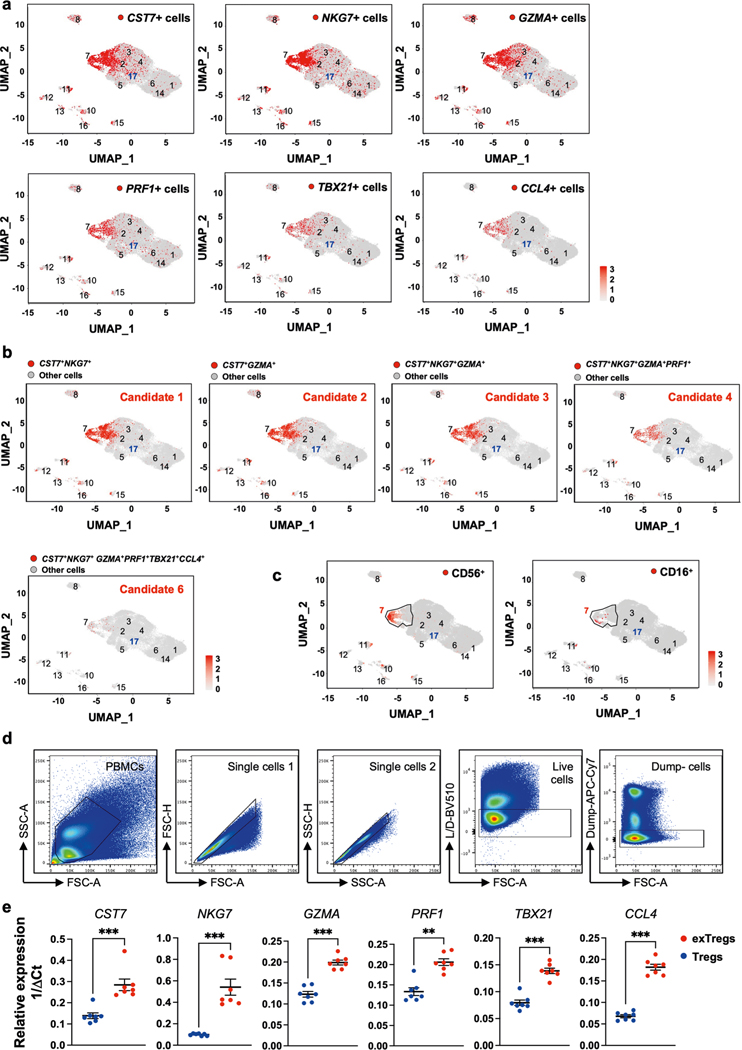
Mouse exTreg DEGs (Fig. 1d, up in exTreg cells) were projected onto the UMAP projections of a published scRNA-seq transcriptome and CITE-seq dataset from 40,821 CD4+ T cells from 61 participants in the Coronary Assessment in Virginia (CAVA) cohort21. This cohort contains men and women, aged from 40 to 80 years, with coronary artery disease (CAD) quantified by angiography (Gensini scores), where Gensini scores <6 were considered CAD− and scores >30 were considered CAD+. A full description of the cohort is published21. Statistical significance (P < 0.05) of exTreg cell gene enrichment (pct.1 and log2 fold change) in each CD4+ T cell cluster versus the other CD4+ T clusters, (one-versus-all) was evaluated. Six genes (CST7, NKG7, GZMA, PRF1, TBX21, CCL4) showed high and specific expression in cluster CD4T_7 (encompassing 1,359 cells), which was previously classified as cytotoxic effector memory cells21 (Fig. 2a). In the UMAP projections of human CD4+ T cells, each of the six exTreg cell classifier genes was most highly expressed in cells that mapped to CD4T_7 (Extended Data Fig. 2a). The FOXP3-expressing Treg cells resided in cluster CD4T_17, which was previously identified as the Treg cluster21 (Fig. 2b). The fraction of cells expressing the exTreg candidate genes was significantly higher in cluster 7 than in Treg cells for all six genes (Fig. 2c).
Fig. 2 |. Mouse exTreg cell classifier genes identify human exTreg cell candidate genes and surface markers in a human scRNA-seq and CITE-seq dataset of CD4+T cells.
a, Differentially expressed mouse exTreg classifier genes were examined among all CD4+ T cell clusters from a published single-cell human dataset from 61 men and women (aged 40–80 years). Statistical significance for the enrichment of each gene in one cluster versus all others was assessed. Average log2 fold change (log2FC, dot color) and positive cell proportions (pct.1, dot size) for significantly (P < 0.05) enriched genes are shown. Six highly expressed exTreg genes (CST7, NKG7, GZMA, PRF1, TBX21 and CCL4) enriched in human cluster CD4T_7 (red boxes). b, Feature plot showing expression of FOXP3 gene (blue dots) in the human CD4+ T single-cell dataset. Treg cell cluster CD4T_17, previously identified as Treg cells, highlighted. c, Frequencies of cells that expressed each of the exTreg cell signature genes in CD4T_7 (red circles) and CD4T_17 (Treg cells, blue circles). n = 61. d, Cells expressing optimal exTreg cell candidate gene combination (CST7 + NKG7 + GZMA + PRF1 + TBX21) are highlighted in red on UMAP embeddings of CD4+ T clusters from the scRNA-seq data. All other cells are in gray. e, Differentially expressed surface markers (CITE-seq antibodies) on cells expressing candidate gene combinations. Average log2FC (dot color) and log2(pct.1/pct.2) × avg_log2FC (dot size) for significant (P < 0.05) differentially expressed protein markers on candidate cells versus CD4T_17 (Treg cells) are shown. Enriched exTreg markers CD127, CD16 and CD56 are marked with red boxes. The second-to-last combination is candidate 5 (CST7 + NKG7 + GZMA + PRF1 + TBX21). f, UMAP embeddings of CD4+ T clusters. Black outline marks cluster CD4T_7; cells that coexpressed CD16 and CD56 are shown as red dots. g, Representative plots from flow cytometry (FACS) showing CD16+CD56+CD4+T cells (exTreg cells, red) and CD25+CD127loCD4+T cells (Treg cells, blue) with FMO controls. h, MFI of CD16 (n = 6), CD56 (n = 6), CD127 (n = 3) and FOXP3 (n = 6) expression in exTreg cells (red circles) and Treg cells (blue circles). 20% male, 80% female donors; ages 23–64 years. Results (c and h) are represented as the mean ± s.e.m. Each dot (c and h) represents a biological replicate from an independent human donor. Statistical comparisons using a two-tailed Mann–Whitney U test (c and h) and a two-tailed Wilcoxon’s rank-sum test with Benjamini–Hochberg correction for multiple comparisons (a and e). In c, ****P < 0.000000000000001 for CST7, NKG7, GZMA, PRF1 and ****P = 3.86 × 10⁻¹³ for TBX21. In h, *P = 0.0121, **P = 0.0022.
Having learned that cluster 7 likely contains human exTreg cells, we wished to deconvolve their identities at single-cell resolution. Serial combinations of the six candidate exTreg markers improved specificity and identified consecutively smaller CD4+ T cell populations (Supplementary Table 4). Coexpression of CST7 and NKG7 was found in 9.4% of all CD4+ T cells; coexpression of CST7 and GZMA in 8.7%; CST7, NKG7 and GZMA in 7.1%; CST7, NKG7, GZMA and PRF1 in 3.5%; CST7, NKG7, GZMA, PRF1 and TBX21 in 1.1% (candidate 5 in Fig. 2d) and CST7, NKG7, GZMA, PRF1, TBX21 and CCL4 in 0.3% (candidates 1–4 and 6 in Extended Data Fig. 2b).
We considered exTreg cell candidate 5 (Fig. 2d) optimal, because this signature identified no cells in the Treg cell cluster CD4T_17 and showed negligible expression in other CD4+ T cell clusters.
Next, we studied the cell surface phenotype of the candidate human exTreg cells, based on the CITE-seq data (51 antibodies). Analysis of differentially expressed surface markers on candidate exTreg cells versus Treg cells (Fig. 2e) revealed statistically significant (P < 0.05) overexpression of CD16, CD56 and CD127 (Fig. 2e). Projecting CD56 and CD16 surface expression onto the UMAP revealed that CD56 protein was expressed on the surface of 1,681 cells (4.1% of all CD4+ T cells; Extended Data Fig. 2c). CD16 was expressed on fewer cells (109 cells, 0.3% of all CD4+ T cells; Extended Data Fig. 2c). Interestingly, almost all CD16+ cells coexpressed CD56 (94 of 109 cells; Fig. 2f). This analysis thus identified two markers by which candidate human exTreg cells could be sorted: CD56 and CD16.
Having identified CD56 and CD16 as surface markers for candidate human exTreg cells, we conducted flow cytometry on PBMCs and found that some CD4+T cells coexpressed CD16 and CD56 protein on their surface (Fig. 2g, with fluorescence-minus-one (FMO) controls; more gating strategy in Extended Data Fig. 2d). Treg cells were identified as CD25+CD127loCD4+T cells (Fig. 2g, with FMOs). Quantitative analysis by flow cytometry showed that exTreg cells, unlike Treg cells, expressed high levels of CD16, CD56 and CD127, and low levels of FOXP3 protein (Fig. 2h). We sorted CD16+CD56+ exTreg cells and CD25+CD127lo Treg cells, prepared cDNA and conducted quantitative PCR with reverse transcription (RT–qPCR) for the six exTreg cell signature genes (CST7, NKG7, GZMA, PRF1, TBX21 and CCL4). Normalized transcript expression levels of all these genes were significantly upregulated in exTreg cells compared to Treg cells (Extended Data Fig. 2e).
Deep transcriptomes of human CD16+CD56+ exTreg cells
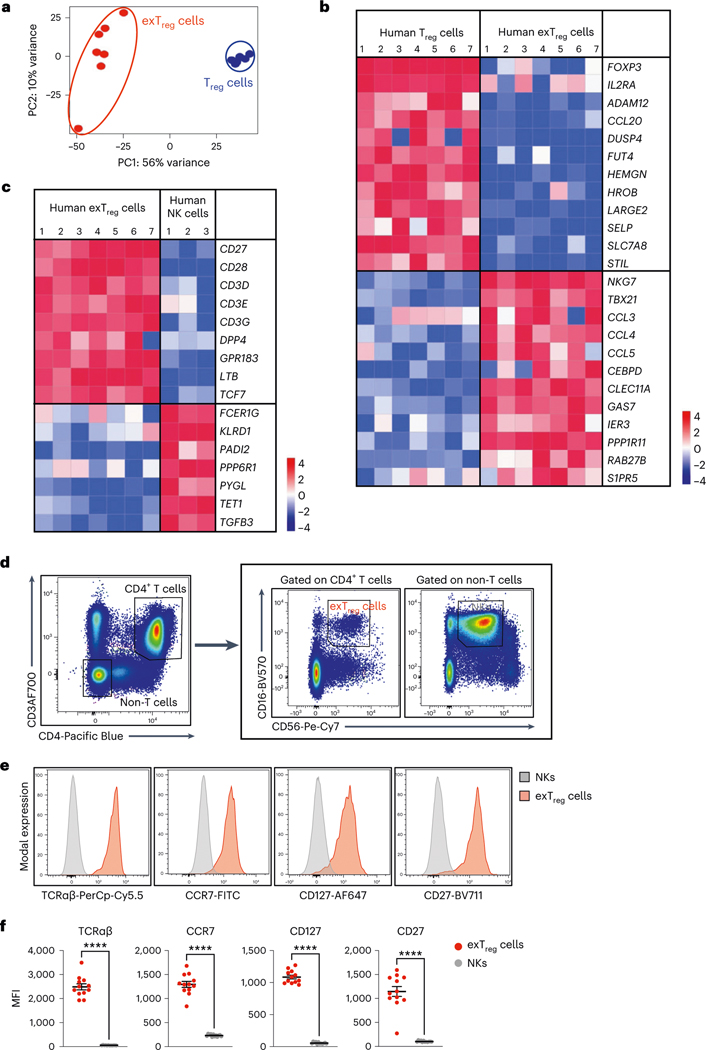
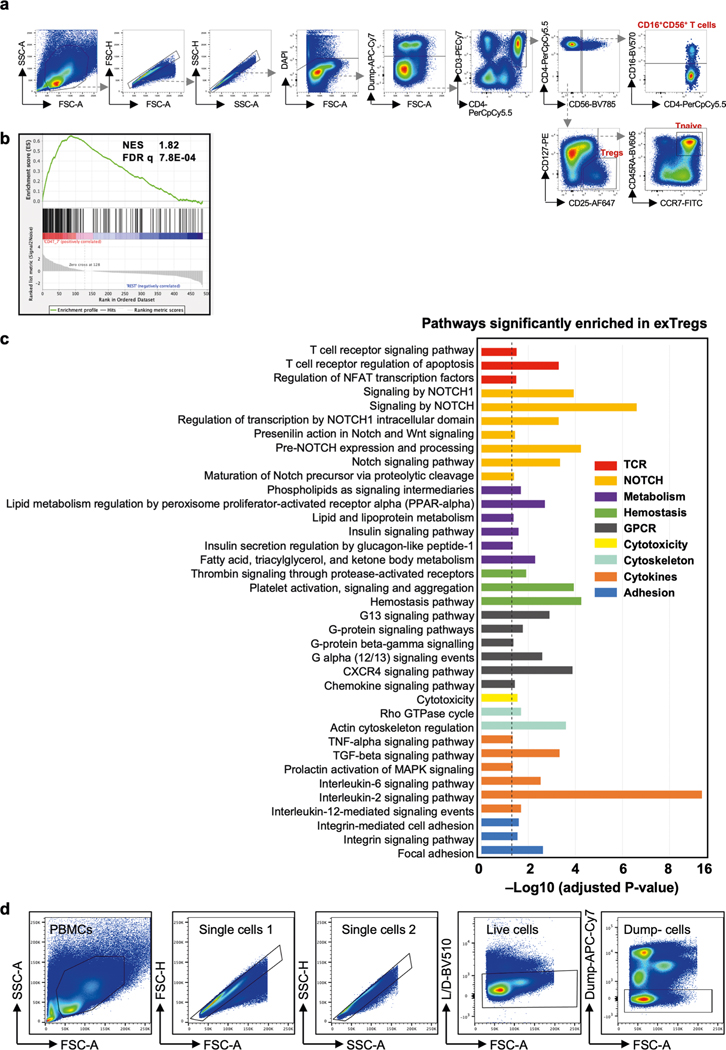
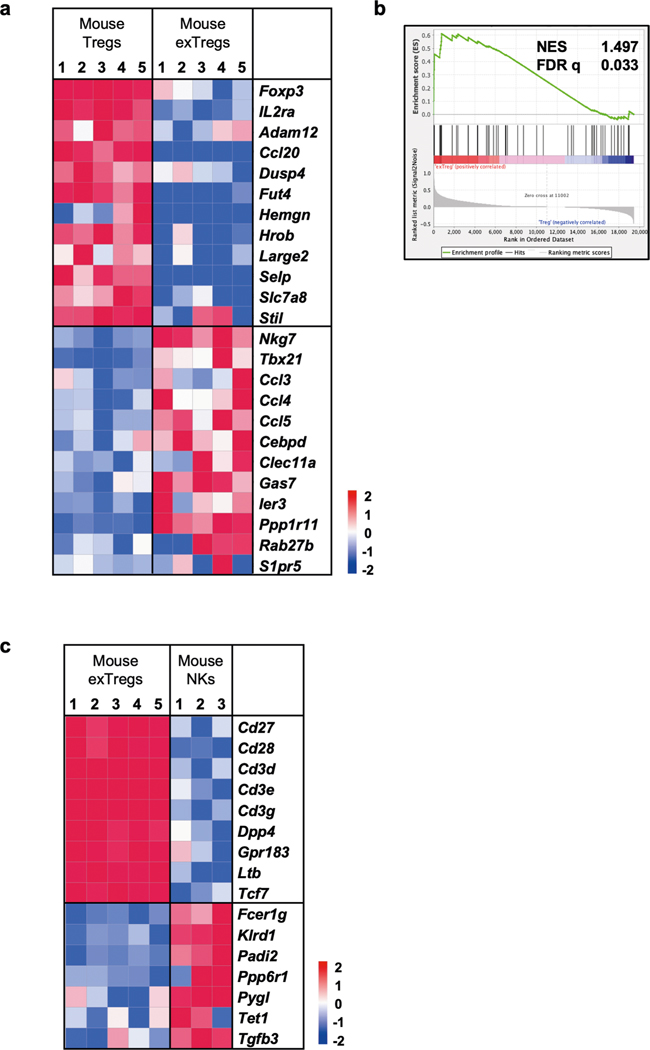
Having established that human exTreg cells can be isolated using CD16 and CD56, we next sorted CD4+CD16+CD56+ exTreg cells from seven donors and compared their transcriptomes with CD4+CD25+CD127lo Treg cells (sorting scheme in Extended Data Fig. 3a). PCA revealed that exTreg cells clustered far from Treg cells (Fig. 3a). PC1 (56% of variance) was the main driver of this separation (Fig. 3a and Supplementary Table 5). Human exTreg cells had lost FOXP3 and IL2RA expression (Fig. 3b). They significantly gained cytotoxic and inflammatory genes like NKG7, TBX21, CCL3, CCL4 and CCL5, all of which were not expressed or present at low levels in Treg cells (Fig. 3b). This pattern of gene expression was also seen in the mouse dataset (Extended Data Fig. 4a).
Fig. 3 |. Deep transcriptomes from sorted human CD3+CD4+CD16+CD56+ exTreg cells contrasted with Treg cells and NK cells.
a, PCA plot of bulk RNA-seq data from sorted human exTreg (CD3+CD4+CD16+CD56+) and Treg (CD3+CD4+CD25+CD127lo) cells. n = 7. Donor details for human bulk RNA-seq in Supplementary Table 13. b,c, Comparative gene signature analysis between human exTreg cells and Treg cells (b) or NK (c) cells. Genes were filtered for significant differential expression, consistent in both mouse and human datasets (only human shown here). An external dataset was used for human NK cells: GSE133383 (samples GSM3907331, GSM3907341 and GSM3907351). Lowly expressed genes (<7 raw reads in all samples) in our dataset were filtered out. EdgeR was used to normalize the counts by applying the trimmed mean of M-values method and counts-per-million conversion. Analysis of DEGs was done using DESeq2. Curated lists of significant DEGs (log2FC ± 1, adjusted P < 0.05) genes are shown on normalized heat maps, scaled by row (z scores). d, Representative FACS plots showing exTreg cells as CD3+CD4+CD16+CD56+ T cells and NK cells as CD3−CD4−CD16+CD56+ non-T cells in hPBMCs. e, Histograms showing the fluorescence intensities of conjugated antibodies against TCRαβ, CCR7, CD127 and CD27 on NK cells (gray) and exTreg cells (red). The scaled y axis was normalized to mode. f, MFI values of the specified markers (n = 12 for each) in NK cells (gray circles) and exTreg cells (red circles) were plotted as the mean ± s.e.m. 40% male and 60% female donors, aged 20–69 years. Each dot represents a biological replicate from an independent human donor. Statistical comparisons were done using a two-tailed Wald test with Benjamini–Hochberg correction for multiple testing (b and c) and a two-tailed Mann–Whitney U test (f). ****P = 7.396 × 10⁻⁷ in f.
Gene-set enrichment analysis (GSEA) of human bulk exTreg cell transcriptomes against the human scRNA-seq dataset confirmed their enrichment in CD4 cluster 7 (normalized enrichment score (NES) 1.82, false discovery rate q = 7.8 × 10⁻⁴, Extended Data Fig. 3b). Similarly, mouse exTreg genes, filtered for human orthologs in the scRNA-seq panel, positively correlated with human exTreg cell genes from bulk RNA-seq (NES = 1.497, false discovery rate q = 0.033, Extended Data Fig. 4b). This formally showed that the leading exTreg cell gene signatures are significant and consistent among the three datasets (mouse bulk RNA-seq, human scRNA-seq, human bulk RNA-seq). Pathway analysis on all genes that were significantly upregulated in human exTreg cells, compared to Treg cells (Supplementary Table 6) revealed significant (adjusted P value < 0.05) enrichment of cellular processes related to TCR, Notch, cytokine and receptor-mediated signaling, metabolism, cytotoxicity, adhesion and hemostasis (Extended Data Fig. 3c).
In humans, CD16 and CD56 are canonical markers of natural killer (NK) cells. Unlike NK cells, human exTreg cells expressed CD3 subunits (Fig. 3c,d). We compared our exTreg cell transcriptomes from both mouse and human bulk RNA-seq datasets with publicly available NK cell data. DEGs were filtered for significance in both species (human in Fig. 3c; mouse in Extended Data Fig. 4c). The TCR-related signaling complex genes CD3D, CD3E and CD3G were all significantly higher in exTreg cells than in NK cells. TCF7, encoding a transcription factor involved in T cell development and memory differentiation, was also significantly higher in exTreg cells than in NK cells. CD27, known to be absent on mature human NK cells23, was significantly expressed in ex Treg cells. Conversely, KLRD1 (encoding CD94) and FCER1G were significantly higher in NK cells (Fig. 3c). The identity of CD3+CD4+CD16+CD56+ human exTreg cells and CD3−CD4−CD16+CD56+ human NK cells was also confirmed by fluorescence-activated cell sorting (FACS; representative plots in Fig. 3d; gating scheme in Extended Data Fig. 3d). exTreg cells, and not NK cells, expressed TCRαβ, CCR7, CD127 and CD27 proteins on the surface (representative histograms in Fig. 3e; quantification in Fig. 3f). Taken together, we found that the exTreg cell gene signatures were conserved between mice and humans. Human CD3+CD4+CD16+CD56+ exTreg cells are distinct from both Treg cells and NK cells.
TCRβ sequencing shows clonal expansion of human exTreg cells from Treg cells
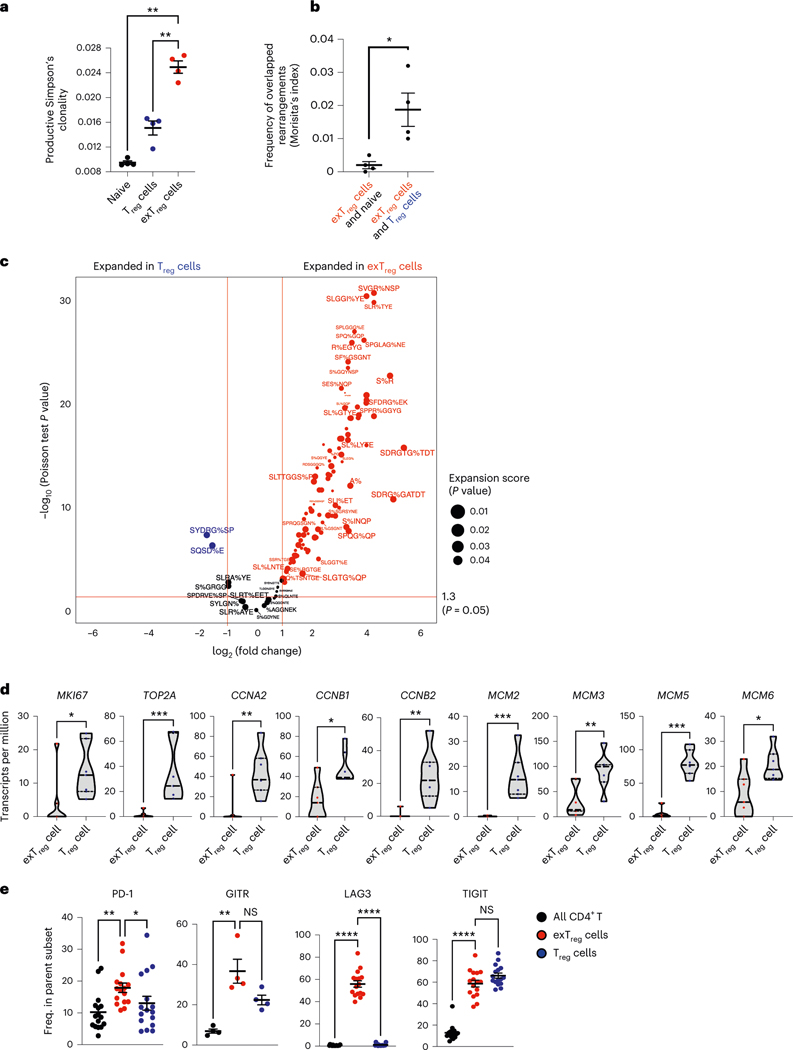
To study the provenance of human CD16+CD56+CD4+T cells, we used TCRB sequencing. We reasoned that if CD16+CD56+ T cells are exTreg cells, their TCRB CDR3 sequences would overlap with TCRB CDR3 sequences in Treg cells. Moreover, if exTreg cells arise by clonal expansion from Treg cells, we expected to see clonal enrichment. Thus, we sequenced TCRβ from sorted Treg cells (CD25hiCD127lo) and exTreg cells (CD16+CD56+) CD4+T cells from four healthy donors (sorting strategy was the same as that used for bulk RNA-seq, Extended Data Fig. 3a; number of templates and rearrangements in Supplementary Table 7). For comparison, we included naïve CD4+T cells (CD45RA+CCR7+). Simpson’s clonality was higher in exTreg cells than in Treg cells or naïve CD4+T cells (Fig. 4a). Morisita’s index, a measure of overlap between samples, showed a significantly higher frequency of shared rearrangements of exTreg cells with Treg cells than with naive T cells (Fig. 4b).
Fig. 4 |. Oligoclonal human exTreg cells are clonally expanded from proliferating Treg cells.
a, Productive Simpson’s clonality of TCRβ sequences from sorted naïve T cells (black circles), Treg cells (blue circles) and exTreg cells (red circles). n = 4. Donor details for human TCR-seq in Supplementary Table 13. b, Frequency of rearrangements shared between exTreg cells and naïve or between exTreg cells and Treg cells was measured using Morisita’s index. n = 4. Results (a and b) are represented as the mean ± s.e.m. c, GLIPH2-analyzed conserved amino acid motifs in TCRβ sequences. Groups with exTreg TCRs were filtered for statistically significant expansion score (P < 0.05). 178 of 345 expanded exTreg GLIPH2 groups were shared by Treg cells. Relative abundance of Treg and exTreg TCRs in these 178 Treg/exTreg groups was compared and DEG patterns (log2FC ± 1, two-sided Poisson test P < 0.05) are shown as a volcano plot. Horizontal line at −log10 (P value) = 1.3 (same as P = 0.05). Vertical lines at |log2FC| = 1. d, Violin plots showing normalized expression levels (transcripts per million) of proliferation genes MKI67, TOP2A, CCNA2, CCNB1, CCNB2, MCM2, MCM3, MCM5 and MCM6 in human bulk transcriptomes from sorted human Treg cells (blue dots) and exTreg cells (red dots). n = 7. 33.33% male and 66.67% female donors, aged 21–54 years. e, Frequency of PD-1 (n = 16), GITR (n = 4), LAG3 (n = 16) and TIGIT (n = 16) expressing cells by FACS, percentage of parent (all CD4+T cells (black circles), exTreg cells (red circles), Treg cells (blue circles); mean ± s.e.m.). 50% male and 50% female donors, aged 20–69 years. Each dot represents a biological replicate from an independent donor. Statistical comparisons were done using one-way analysis of variance (ANOVA) with Dunnett’s multiple-comparison test (a), a two-tailed Mann–Whitney U test (b and d) and a Kruskal–Wallis test, adjusted with Dunn’s multiple-comparison testing (e). In a, exTreg cells versus naive **P = 0.0012; versus Treg cells **P = 0.0068. In b, *P = 0.0286. In d, *P = 0.0111 for MKI67, CCNB1; *P = 0.0175 for MCM6; **P = 0.007 for CCNA2 and MCM3; **P = 0.0012 for CCNB2; ***P = 0.0006 for TOP2A, MCM2, MCM5. In e, PD-1 **P = 0.0023, GITR **P = 0.0047, LAG3 ****P = 3.21 × 10⁻⁷, TIGIT ****P = 5.227 × 10⁻⁵ for exTreg cells versus CD4+T cells; PD-1 *P = 0.0329, GITR P = 0.3396, LAG3 ****P = 1.659 × 10⁻⁵, TIGIT P = 0.423 for exTreg cells versus Treg cells. NS, not significant.
For a more detailed analysis, we used GLIPH22, a software that identifies conserved amino acid sequence patterns in CDR3 sequences. First, we filtered the GLIPH groups based on their enrichment (Fisher P < 0.05) in our dataset, as compared to a published set of CDR3 sequences from naïve T cells22. CDR3 sequence patterns with exTreg TCRs were filtered for statistically significant expansion based on the productive frequencies of their TCRs (expansion score P < 0.05). We identified 345 expanded exTreg cell groups. TCRβ sequences from Treg cells were present in ~50% (178 of 345) of them (Supplementary Table 8). We compared the relative abundance of Treg cell and exTreg cell TCRβ sequences in these groups and found many TCRβ CDR3 patterns that were significantly expanded (log2FC ± 1, Poisson test P < 0.05) in exTreg cells compared to Treg cells (Fig. 4c; GLIPH patterns in Supplementary Table 9).
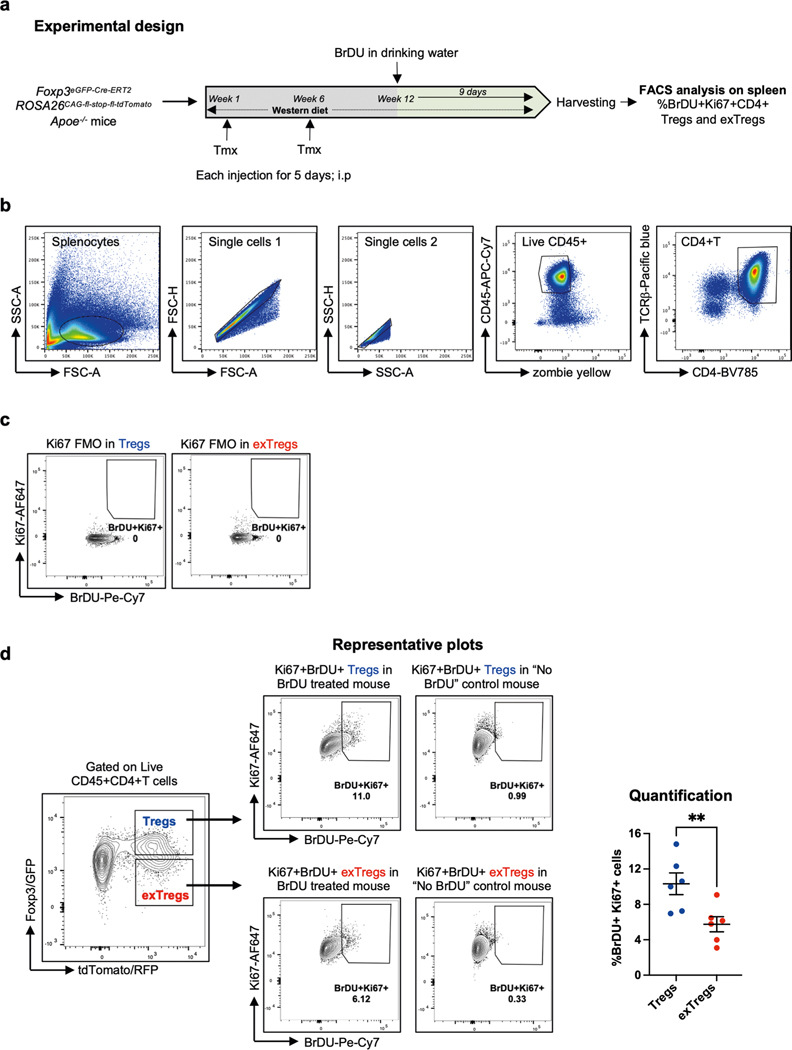
The clonal expansion observed in exTreg cells prompted us to reason that Treg cells may have proliferated and differentiated into oligoclonal exTreg cells. This was supported by our observation that the SVM model had identified genes related to DNA replication and cell cycle, such as Aurkb, Ccnd2, Mcm4, Mki67 and Top2a, as Treg cell-classifying genes (Supplementary Table 2). These genes were significantly upregulated in mouse Treg cells, compared to exTreg cells (Extended Data Fig. 1b and Supplementary Table 3). To functionally compare Treg cell versus exTreg cell proliferation in atherosclerotic mice, we conducted an in vivo BrDU incorporation experiment in FoxP3eGFP-Cre-ERT2 ROSA26CAG-fl-stop-fl-tdTomato Apoe−/− mice (experimental design in Extended Data Fig. 5a). Proliferating Treg cells and exTreg cells (gating scheme, controls and representative plots in Extended Data Fig. 5b–d) were monitored based on Ki67 (encoded by Mki67) expression and BrDU incorporation. Frequencies of Ki67+BrDU+CD4+T cells were significantly higher among Treg cells than exTreg cells (quantification in Extended Data Fig. 5d), showing that mouse Treg cells actively proliferate during atherosclerosis.
Next, we examined proliferation-related genes in our human bulk RNA-seq dataset (Fig. 3). We found that human Treg cells, as compared to exTreg cells, expressed significantly higher transcript levels of MKI67 (gene encoding Ki67), topoisomerase TOP2A, MCM2, MCM3, MCM5 and MCM6 (members of the replicative helicase that are involved in the formation of pre-replicative complexes) and cyclin A and B genes (which activate DNA replication and mitosis, respectively; Fig. 4d). These data are consistent with the idea that exTreg cells may arise from Treg cells by proliferation and clonal expansion.
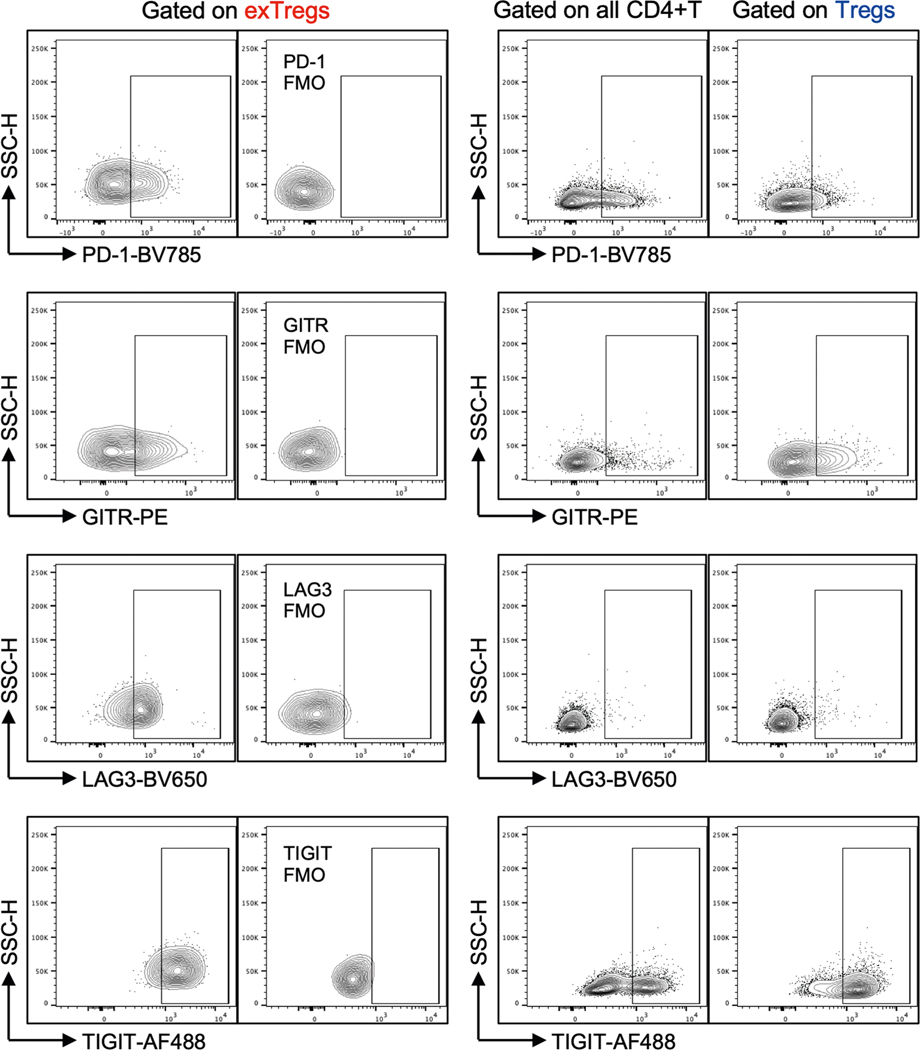
To assess whether human exTreg cells retain any phenotypic similarities with Treg cells, we monitored expression of the Treg cell markers PD-1, GITR, LAG3 and TIGIT on exTreg cells using FACS (representative plots and FMO controls in Extended Data Fig. 6, quantification in Fig. 4e). All CD4+T cells were used as a negative control. exTreg cells retained TIGIT and GITR, expressed significantly more PD-1 than Treg cells, and gained expression of LAG3. We also filtered the transcriptomes of human exTreg cells by known Treg genes24 and found 32 such genes that were retained in exTreg cells (Supplementary Table 10).
Human exTreg cells are not suppressive but cytotoxic
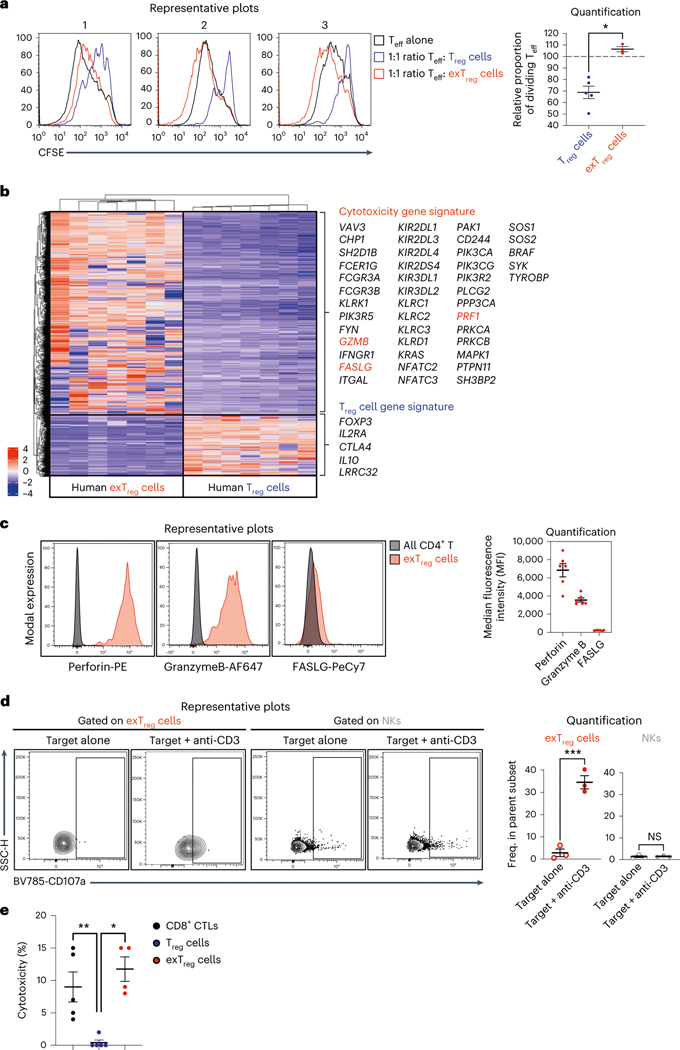
To test whether human exTreg cells retained the suppressive capacity of Treg cells, we conducted a suppression assay to compare the effects of Treg cells and exTreg cells on the proliferation of effector T cells (Teff) cells. Co-culturing Treg cells with Teff cells at a 1:1 Treg:Teff cell ratio effectively suppressed proliferation of Teff cells, as measured by carboxyfluorescein succinimidyl ester (CFSE) dilution (Fig. 5a). By contrast, Teff cell proliferation in the presence of exTreg cells (Fig. 5a) remained the same as proliferation of Teff cells alone (Fig. 5a). Teff cell proliferation was significantly higher when co-cultured with exTreg cells than with Treg cells (Fig. 5a) and not different from proliferation of Teff cells alone.
Fig. 5 |. Human exTreg cells are not suppressive but are cytotoxic.
a, CFSE-labeled CD3+CD4+CD25−T cells (Teff) were co-cultured at 1:1 ratio with either CTV-labeled Treg cells or exTreg cells, in the presence of anti-CD3/CD28/CD2-coated beads. Left, representative histograms from three independent experiments showing CFSE in Teff cells alone (black line), in Teff cells cultured with Treg cells (blue line) and in Teff cells cultured with exTreg cells (red line). Right, proportion of dividing Teff cells after 5 d of co-culture with Treg cells (blue circles, n = 5) or ex Treg cells (red circles, n = 3). 40% male and 60% female donors; aged 23–43 years. b, Heat map of DEGs (P < 0.01 and |log2FC| > 2, based on a two-tailed Wald test with Benjamini–Hochberg P-value adjustment) between human exTreg versus Treg transcriptomes from Fig. 3. Cytotoxic and Treg signature genes are highlighted. c, FACS analysis of cytotoxic proteins FASLG, perforin and granzyme B (genes are labeled red in b) in human exTreg cells, compared to bulk CD4+T cells. Left, representative histograms of intensities of fluorochrome-conjugated antibodies against FASLG, perforin and granzyme B on exTreg cells (red) and all CD4+T cells (black). Right, MFIs of marker protein expression in exTreg cells. n = 6. 50% male and 50% female donors, aged 25–37 years. d, Representative contour plots (left) and quantification (right) of basal and anti-CD3-induced degranulation in exTreg cells (red) and NK cells (gray), as measured by surface mobilization of the degranulation marker CD107a by FACS. hPBMCs were co-cultured with uncoated P815 cells (target alone, open circles) or 5 μg ml−1 anti-CD3-coated P815 cells (target + anti-CD3, filled circles) for 6 h at a 10:1 PBMC:P815 ratio. n = 3. 33.33% male and 66.67% female donors; aged 25–38 years. e, Anti-CD3-loaded P815 cells were co-cultured with CD8 CTLs (black circles, n = 5), Treg cells (blue circles, n = 5) or exTreg cells (red circles, n = 4) at a 1:5 P815:effector cells ratio for 16 h. 60% male and 40% female donors, aged 21–45 years. Cytotoxicity was assessed by measuring lactate dehydrogenase amounts in the supernatant. Results (a and c–e) are represented as the mean ± s.e.m. Each dot represents a biological replicate from an independent donor. Statistical comparisons were done using a two-tailed Mann–Whitney U test (a and e) and a two-tailed unpaired t-test (d). *P = 0.0357 (a). ***P = 0.0008 (d, exTreg cells); P = 0.7707 (d; NKs). **P = 0.0079 (e, Treg cells versus CTLs); *P = 0.0159 (e; Treg cells versus exTreg cells).
To delineate the functional profile of human exTreg cells, we carefully examined their transcriptomes (Fig. 3) and contrasted them with Treg cells (heat map of DEGs in Fig. 5b). We found that human exTreg cells expressed many genes present in the KEGG list of cytotoxic genes. These included GZMB, PRF1 and FASLG, known to mediate effector functions in cytotoxic cells. Additionally, exTreg cells had lost FOXP3, IL2RA, CTLA4, IL10 and LRRC32 gene expression, supporting their functional loss of suppressive capacity.
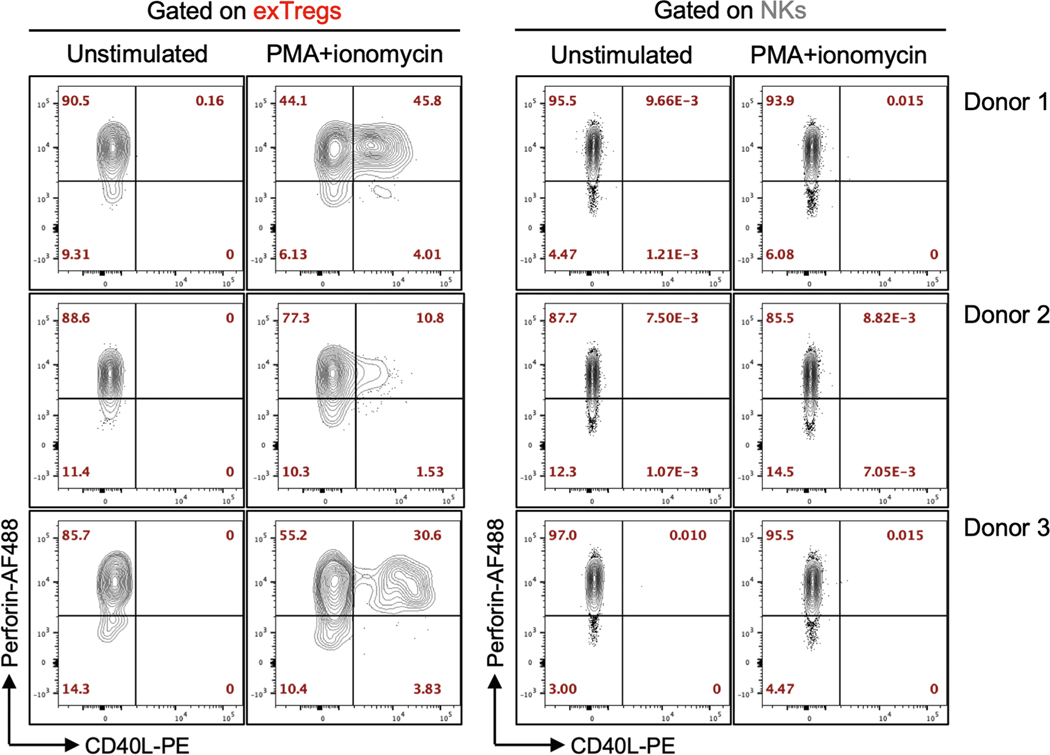
We validated intracellular expression of perforin (encoded by PRF1), granzyme B (encoded by GZMB) and FAS ligand (encoded by FASLG) in human exTreg cells at the protein level by FACS. We detected high expression of perforin and granzyme B, but not FAS ligand on exTreg cells (representative histograms in Fig. 5c; quantification in Fig. 5c). Although both exTreg cells and NK cells expressed the cytotoxic marker perforin, only exTreg cells upregulated the activation-induced CD4+T cell marker CD40L, upon stimulation with phorbol 12-myristate 13-acetate (PMA) and ionomycin (Extended Data Fig. 7). In a degranulation assay with P815 target cells, crosslinking with anti-CD3 triggered surface mobilization of the degranulation marker CD107a specifically in exTreg cells and not in NK cells (representative histograms in Fig. 5d, quantification in Fig. 5d). These functional data further confirm that exTreg cells are distinct from NK cells. To directly test the cytotoxic potential of exTreg cells, we used anti-CD3-coated P815 target cells and co-cultured them with sorted human exTreg cells at a 1:5 target-to-effector ratio. CD8+ cytotoxic T lymphocytes (CTLs) were used as positive control. Treg cells were used as a negative control. exTreg cells showed cytotoxicity in the same range as bona fide CD8+ CTLs (Fig. 5e). As expected, Treg cells showed no cytotoxicity (Fig. 5e).
These data collectively show that CD16+CD56+ exTreg cells do not exhibit Treg cell-like suppressive properties and instead acquire cytotoxicity, although they retain some Treg cell genes and markers. Unlike cytotoxic NK cells, exTreg cells can be activated by TCR-related stimulation and express T cell markers upon activation.
Human exTreg cells express cytotoxic and inflammatory markers
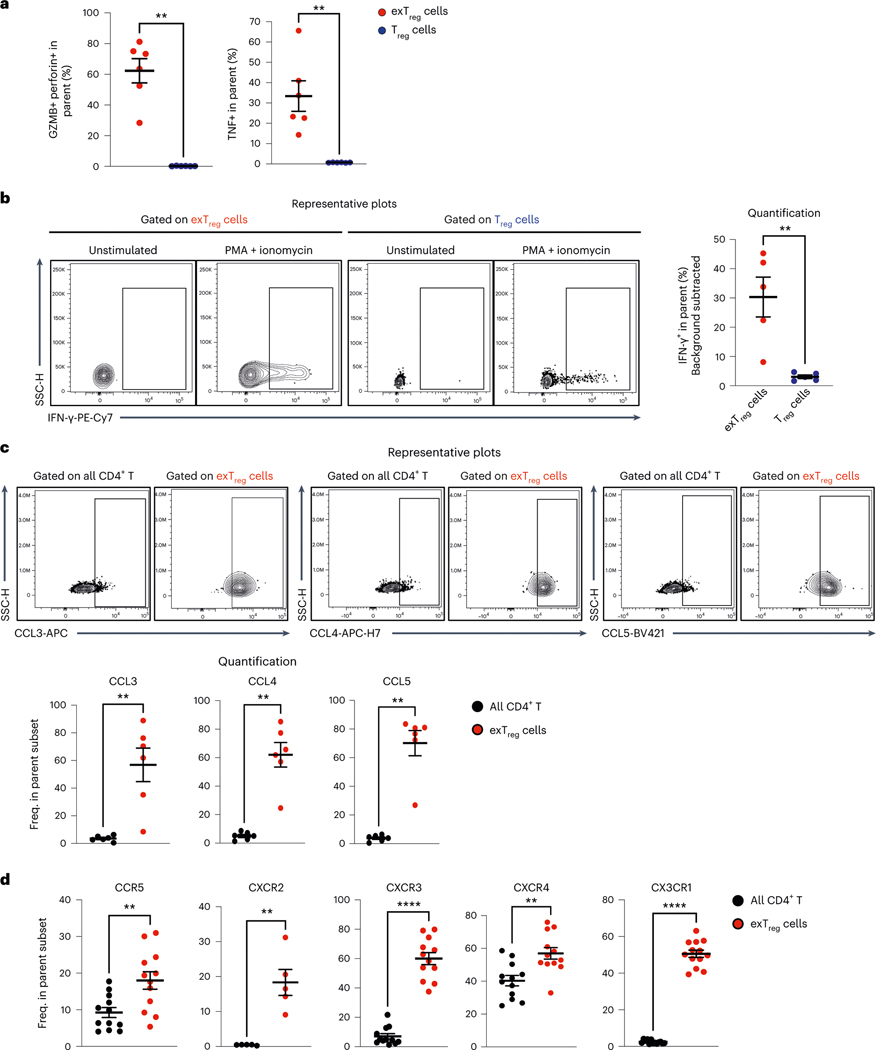
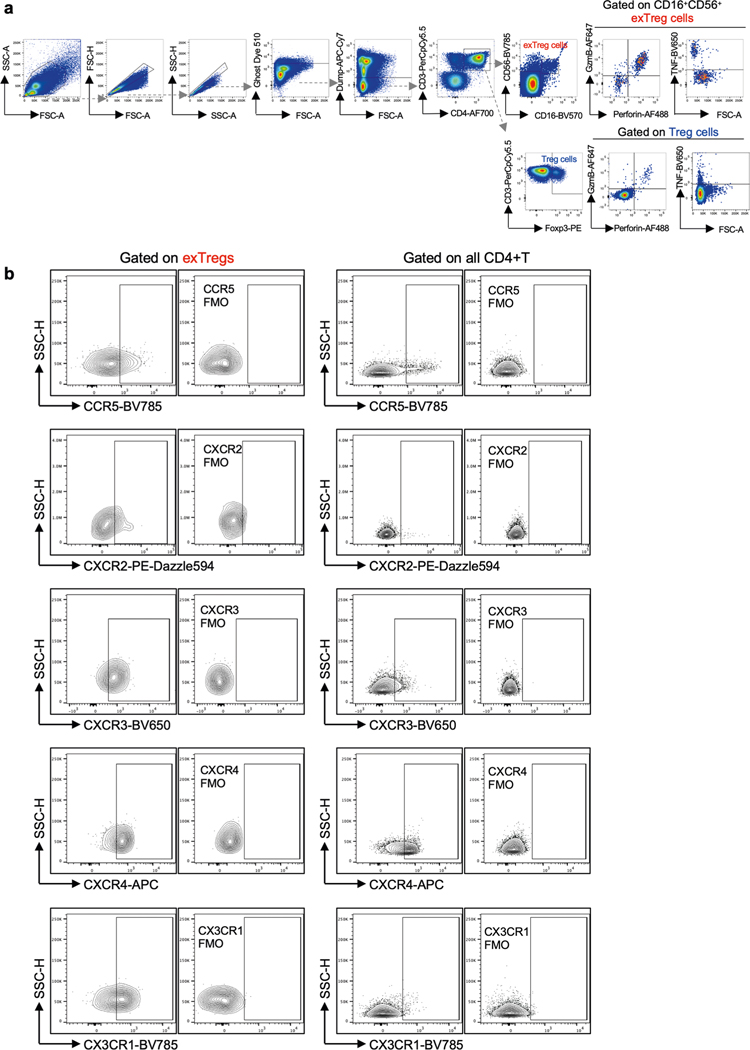
We recently reported that mouse exTreg cells, unlike Treg cells, express tumor necrosis factor (TNF) and IFN-γ7. Here we compared the expression of cytotoxic and inflammatory cytokines in human Treg cells and exTreg cells in an intracellular cytokine staining (ICS) assay (gating scheme in Extended Data Fig. 8a). About 60% of exTreg cells coexpressed granzyme B and perforin (Fig. 6a). We confirmed that about 30–40% of exTreg cells expressed intracellular TNF protein as measured by flow cytometry (Fig. 6a). Basal expression of IFN-γ was low in unstimulated exTreg cells but strongly upregulated upon activation with PMA and ionomycin (Fig. 6b). Stimulation-induced IFN-γ production was significantly higher in exTreg cells than in Treg cells (Fig. 6b).
Fig. 6 |. Human exTreg cells express cytotoxic proteins, inflammatory cytokines, chemokines and chemokine receptors.
a, Frequencies of GzmB+perforin+ and TNF+ cells in Treg cells (blue circles) and exTreg cells (red circles) were assessed in an ICS assay by FACS. n = 6. 50% male and 50% female donors; aged 24–39 years. b, Representative contour plots (left) showing intracellular expression of IFN-γ under unstimulated and PMA–ionomycin-stimulated conditions in exTreg cells and Treg cells. Right, frequency of PMA-induced IFN-γ in exTreg cells (red circles) and Treg cells (blue circles). n = 5. 40% male and 60% female donors; aged 23–39 years. c, hPBMCs were stained for intracellular expression of CCL3 (MIP-1α), CCL4 (MIP-1β) and CCL5 (RANTES). Top, representative contour FACS plots showing expression among all CD4+T cells and in exTreg cells. Bottom, frequencies of CCL3+, CCL4+ and CCL5+ cells among the parent subset (all CD4+T cells (black circles), exTreg cells (red circles)). n = 6. 50% male and 50% female donors, aged 26–33 years. d, Frequencies of CCR5 (n = 12), CXCR2 (n = 5), CXCR3 (n = 12), CXCR4 (n = 12) and CX3CR1 (n = 13) chemokine receptor-expressing exTreg cells (red circles) and all CD4+T cells (black circles). 40% male and 60% female donors, aged 20–69 years. Results (a–d) were plotted as the mean ± s.e.m. Each dot represents a biological replicate from an independent donor. Statistical comparisons were performed using a two-tailed Mann–Whitney U test (a–d). **P = 0.0022 (a), **P = 0.0079 (b), **P = 0.0022 (c). In d, **P = 0.0068 (CCR5), **P = 0.0079 (CXCR2), ****P = 7.396 × 10⁻⁷ (CXCR3), **P = 0.0023 (CXCR4), ****P = 1.92 × 10⁻⁷ (CX3CR1).
In our gene expression analysis (Fig. 3b), the chemokines CCL3, CCL4 and CCL5 were significantly higher in human exTreg cells than in Treg cells. Using FACS, we confirmed that intracellular protein expression of all three chemokines was specifically enriched in exTreg cells and not detected in bulk CD4+T cells (Fig. 6c). About 60% of exTreg cells expressed CCL3 or CCL4 proteins (Fig. 6c). CCL5 expression was found in 70–80% of exTreg cells (Fig. 6c). These chemokines attract monocytes25 and promote inflammation.
Chemokine receptors play a major role in T cell trafficking and tissue infiltration. In the pathway analysis of human exTreg genes, the CXCR4 signaling pathway was significantly enriched (Extended Data Fig. 3c). To confirm this finding, we used flow cytometry to monitor the expression of CXCR4 and other inflammation-related chemokine receptors such as CCR5, CXCR2, CXCR3 and CX3CR1. Expression of all these receptors was significantly higher on ex Treg cells than on bulk CD4+T cells (representative data and FMO controls in Extended Data Fig. 8b, quantification in Fig. 6d). About 20% of exTreg cells expressed CCR5 or CXCR2. CXCR3, CXCR4 and CX3CR1 could be detected in about 50–60% of exTreg cells. In atherosclerotic mice, CCR5 expression on T cells is required for T cell homing to aortic lesions10. CXCR3 is a well-established inflammatory chemokine receptor expressed on TH1 cells and on activated effector and memory T cells that migrate to inflammatory lesions26. CXCR2 was highly expressed on CD4+T cells that infiltrated gray matter tissue in a mouse model of multiple sclerosis27. CX3CR1 has been shown to be expressed on highly polarized cytotoxic dengue-virus specific CD4+T cells in humans28. Its ligand CX3CL1 is highly expressed in atherosclerotic lesions29,30. SDF-1, the ligand for CXCR4, has been detected at higher levels in human atherosclerotic plaques, and not in normal blood vessels31.
Inflammatory and cytotoxic genes in exTreg cells from individuals with coronary artery disease
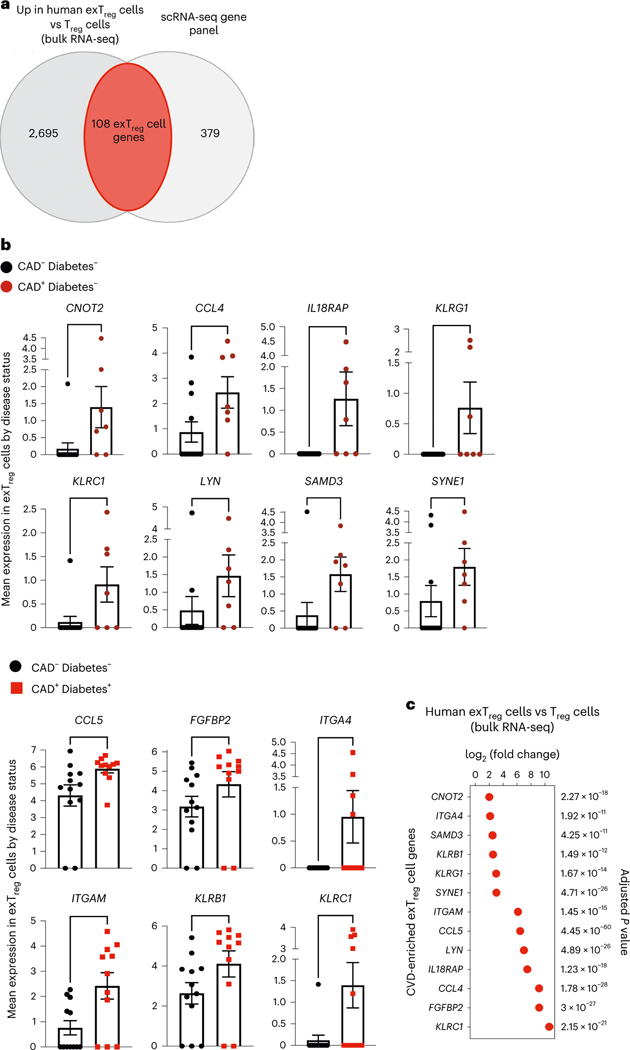
The CAVA cohort, from which the scRNA-seq data with CITE-seq came, encompasses participants with Gensini scores > 30 (CAD+) and < 6 (CAD−). First, we intersected the genes significantly upregulated in human exTreg cells (up in exTreg cells; Supplementary Table 6) with the genes tested in the human scRNA-seq dataset and found 108 such genes (Fig. 7a and Supplementary Table 11). Next, we tested which of these genes were expressed at significantly higher levels in exTreg cells from CAD+ cases as compared to CAD− controls. In non-diabetic CAD+ individuals, we found that CNOT2, CCL4, IL18RAP, KLRG1, KLRC1, LYN, SAMD3 and SYNE1 were significantly upregulated (Fig. 7b) compared to CAD− controls (Fig. 7b). In exTreg cells from diabetic individuals with CAD (Fig. 7b), CCL5, FGFBP2, ITGA4, ITGAM, KLRB1 and KLRC1 were significantly higher in CAD+ than in CAD− individuals (Fig. 7b). KLRC1 was found to be significantly overexpressed in both non-diabetic and diabetic CAD+ individuals. Statistical analysis of the differential expression of these 13 genes between exTreg cells and Treg cells showed highly significant upregulation in human ex Treg cells (Fig. 7c).
Fig. 7 |. Inflammatory and cytotoxic human exTreg genes overexpressed in individuals with coronary artery disease.
a, Genes that were significantly upregulated in human exTreg cells compared to Treg cells (2,803 genes) in the human bulk RNA-seq data (Fig. 3) were intersected with the genes present in the published human scRNA-seq panel (Fig. 2). Donor details for human bulk RNA-seq are in Supplementary Table 13 and those for scRNA-seq are in ref. 21. b, Mean expression of genes in CD16+CD56+ exTreg cells from the scRNA-seq dataset that were significantly increased in CAD+ non-diabetic (brown circles in top, n = 7) or diabetic (red squares in bottom, n = 11) individuals in comparison to control CAD− non-diabetic (black circles, n = 12) individuals. Results are shown as the mean ± s.e.m. Each point represents data from exTreg cells from an independent donor. Statistical comparisons were done using a two-tailed Mann–Whitney U test. Top, **P = 0.0064 (CNOT2), *P = 0.0414 (CCL4), **P = 0.009 (IL18RAP), *P = 0.0361 (KLRG1), *P = 0.0163 (KLRC1), *P = 0.0371 (LYN), **P = 0.0095 (SAMD3), *P = 0.0395 (SYNE1). Bottom, *P = 0.0126 (CCL5), *P = 0.0354 (FGFBP2), *P = 0.0373 (ITGA4), *P = 0.018 (ITGAM), *P = 0.031 (KLRB1), *P = 0.032 (KLRC1). c, log2FC and adjusted P values of a DEG analysis (based on a two-tailed Wald test with Benjamini–Hochberg P-value adjustment) between exTreg cells and Treg cells for the 13 CAD-relevant exTreg genes from b.
In summary, using gene signatures from mouse exTreg cells, we identified human CD3+CD4+CD16+CD56+ T cells as human exTreg cells and validated expression of exTreg signature genes and surface markers. Bulk RNA-seq showed that exTreg cells are very different from Treg cells and NK cells, representing a distinct subset of CD4+T cells. Human exTreg cells express inflammatory and cytotoxic genes and retain some Treg cell markers. TCR-seq showed shared Treg/exTreg cell TCRB clones that were more expanded in exTreg cells compared to Treg cells. Such oligoclonal exTreg cells likely originated from proliferating Treg cells. Functionally, human exTreg cells lack suppressive capacity and have acquired cytotoxic properties. They express cytotoxic effectors, inflammatory cytokines, chemokines and chemokine receptors. Expression of multiple inflammatory and cytotoxic genes in exTreg cells is augmented in individuals with CAD compared to CAD− controls.
Discussion
Our findings define human exTreg cells as CD3+CD4+CD56+CD16+ T cells. These cells express the exTreg signature genes CST7, NKG7, GZMA, PRF1, TBX21 and CCL4. At the protein level, human exTreg cells express T cell markers like TCRαβ, CCR7, CD27 and CD127. Inflammatory chemokine receptors including CCR5, CXCR2, CXCR3, CXCR4 and CX3CR1 were enriched on exTreg cells. Most human exTreg cells also expressed granzyme B and the monocyte-attracting, pro-inflammatory chemokines CCL3, CCL4 and CCL5. They upregulated IFN-γ production upon stimulation. Unlike Treg cells, exTreg cells expressed little FOXP3 and completely failed to suppress Teff cell proliferation. Instead, they exerted cytotoxic effects. Clonality analysis by TCRβ sequencing revealed that exTreg cells contain expanded clones sharing TCR CDR3 sequences with Treg cells.
It is estimated that 80% of systemic Treg cells come from the thymus (tTreg cells)32,33. The remaining 20% are induced from conventional T cells in the periphery (iTreg cells). Both nTreg cells and iTreg cells are mostly in LNs, but some are found in the blood34,35. Fate-mapping experiments show that nTreg cells are quite stable under steady-state conditions20, whereas iTreg cells are known to be unstable14,15,19. Under conditions of chronic inflammation, such as those that exist in atherosclerosis, exTreg cells, that is, cells that no longer express FoxP3, are found routinely4,14,16,17. Zhou et al. showed the development and pathogenicity of exTreg cells from Treg cells using Foxp3GFP × Rosa26-loxP-Stop-loxP-YFP fate-mapping mice crossed with NOD mice14. We previously showed that exTreg cells from mice, vaccinated with an apolipoprotein B peptide, produced IFN-γ7. Adoptive transfer of such exTreg cells increased atherosclerotic lesion size7.
Because the transcriptome of Treg cells shares similarity with that of TH17 cells36,37, exTreg cells were suspected to become TH17 cells. We have previously shown that in women with cardiovascular disease, many APOB-specific T cells express both FoxP3 and RORγt3. This phenotype is consistent with Treg cell plasticity, which proposes that Treg cells acquire the transcriptional program of the cells they regulate38,39. Thus, TH1-Treg cells express T-bet, TH17-Treg cells express Stat3 and TH2-Treg cells express IRF4 (refs. 40–42). However, in atherosclerosis, Treg cells lose FoxP3 expression. Based on flow cytometry, Treg cells in atherosclerosis have been reported to become TH17-like cells3, TH1-like cells10,11 or TFH-like cells17. Our present lineage tracking, gene and protein expression and functional data show that, in both mice and humans, exTreg cells are cytotoxic CD4+ T cells. The relationship between these different flavors of exTreg cells remains to be explored.
Recent work has shown a loss of tolerance to self in mice43 and humans44 with atherosclerosis. Many Treg cells express TCRs specific for self-epitopes45. Thus, it is plausible that the conversion of Treg cells to exTreg cells through proliferation and clonal expansion may be part of the mechanism for this loss of tolerance to self. The function of exTreg cells includes cytotoxicity. In fact, CTLs have been reported in plaques46. exTreg cells are also pro-inflammatory by attracting monocytes. Thus, exTreg cells are expected to exacerbate atherosclerosis by attracting more monocytes, some of which can differentiate to macrophages9.
Transcriptomic analysis, ICS and functional assays all show that exTreg cells have a highly activated cytotoxic phenotype. However, exTreg cells retain expression of the Treg cell markers PD-1, GITR and TIGIT, and expression of some Treg cell genes. TCRβ sequencing shows that exTreg cells have a limited repertoire diversity and show clear clonal expansion of TCR sequence patterns also found in Treg cells. Experimentally, we show that Treg cells proliferate in mice with atherosclerosis. Considering these findings together, we hypothesize that the development of exTreg cells in chronic inflammation may be driven by repetitive TCR stimulation. Repetitive TCR stimulation is known to lead to a Temra-like phenotype47. Through this process, exTreg cells become cytotoxic and pro-inflammatory Teff cells.
It was surprising to find CD16 and CD56 as cognate surface markers for human exTreg cells. CD56, also known as NCAM (neural cell adhesion molecule) and CD16, an Fc receptor (FcγRIIIa), are typically coexpressed on NK cells48. To contrast human exTreg cells and NK cells, we compared their transcriptomes and found genes that were significantly differentially expressed in both mice and humans. We used FACS analysis to confirm the expression of T cell markers on CD3+CD4+CD16+CD56+ human exTreg cells, which were not detectable on CD3−CD4−CD16+CD56+ NK cells. Functionally, exTreg cells, unlike NK cells, degranulated upon TCR engagement.
Treg cells represent a unique, preexisting, non-naïve population of CD4+T cells that have already been exposed to antigen. Unlike naïve T cells, Treg cells can quickly respond to antigen exposure. In cancer models, Treg cells play a role in shielding the tumor from the immune system. However, inhibiting indoleamine 2,3-dioxygenase drives some of these Treg cells to provide CD40L-dependent help to dendritic cells for cross-presentation, thus licensing CD8+T cells to become CTLs49,50. The reprogrammed Treg cells were induced by vaccinating with antigen and a TLR9 ligand50. They arise from an Eos (Ikzf4)-labile population of Treg cells49. Unlike the cytotoxic exTreg cells identified here, the Treg cells reprogrammed by indoleamine 2,3-dioxygenase inhibition still express FoxP3 at levels similar to Treg cells49. Thus, these cells may represent early exTreg cells, driven by adjuvant-induced inflammatory signals including IL-6 (ref. 50). In experiments using CFSE-labeled Treg cells, reprogramming occurred at a time when proliferation was still minimal (that is, before proliferation) and required the IL-6 receptor on the Treg cells49. The relationship between these early exTreg cells and the cytotoxic exTreg cells described here remains to be determined.
A limitation of this study is that the mouse exTreg cell signatures are from sorted spleen and LN cells, while the human exTreg cell transcriptomic data are from peripheral blood. This discrepancy is due to practical constraints. The yield of PBMCs in mice is insufficient for sorting Treg cells and exTreg cells for preparation of high-quality libraries. Conversely, LN or spleen biopsy samples are not available from the CAVA cohort (from where the human scRNA-seq dataset came). Future, more detailed studies, beyond the scope of this work, may yield more transcriptomic data for phenotypic and functional analysis.
In conclusion, we discovered and defined, phenotypically and functionally, human exTreg cells. Although human exTreg cells retain some Treg cell markers, their main gene signature is cytotoxic. Functionally, human exTreg cells kill target cells as efficiently as CTLs. exTreg cells are pro-inflammatory in that they express IFN-γ and monocyte-attracting chemokines. The conversion of Treg cells to exTreg cells may be part of the recently described breaking of tolerance to self in atherosclerosis.
Online content
Any methods, additional references, Nature Portfolio reporting summaries, source data, extended data, supplementary information, acknowledgements, peer review information; details of author contributions and competing interests; and statements of data and code availability are available at https://doi.org/10.1038/s41590-023-01589-9.
Methods
Human samples
Healthy volunteers were recruited by the clinical core at the La Jolla Institute for Immunology (LJI). All participants received financial compensation according to guidelines approved by LJI’s Institutional Review Board. Written informed consents were obtained from all enrolled participants. Donors self-reported ethnicity and race details, and tested negative for hepatitis B, hepatitis C and HIV. None of the donors had any ongoing infection. They had no known conditions of cancer, diabetes, heart or kidney or liver disease. Donors were neither pregnant nor nursing. De-identified blood or PBMC samples for the study were made available by LJI’s clinical core. Ethical approval for the study was provided by the Institutional Review Board of LJI (IRB protocol nos. IB-248–0821 and VD-057).
Animal experiments
All animal experiments in this study used fate-mapping lineage-tracker mice (FoxP3eGFP-Cre-ERT2ROSA26CAG-fl-stop-fl-tdTomato Apoe−/− in a B6 background) from both sexes, as previously described7. All mouse experiments were approved by the LJI Animal Care and Use Committee (protocol no. AP00001019). The housing conditions for these mice were as follows: lights on at 6:00 and off at 18:00, ambient temperature between 20 °C and 24 °C and humidity between 30% and 70% (mean, 40%; outdoor environment can affect humidity inside).
Seven- to eight-week-old lineage-tracker mice were injected with tamoxifen for 5 consecutive days (intraperitoneally; 75 mg per kg body weight). For time-course experiments, spleens and LNs from four to seven mice (exact number indicated in figure legends) were harvested at 4, 8, 12 or 20 weeks after tamoxifen injection. Fixed samples of mouse carotid arteries from four 20-week-old tamoxifen-injected mice were imaged using a Leica SP8 confocal microscope with a HC Fluotar ×25/0.95 water objective. CD25 expression was quantified in single-cell suspensions from spleens (n = 4) and LNs (n = 6) of 16-week-old tamoxifen-injected mice. Bulk RNA-seq was performed on spleens (n = 5) and LNs (n = 4) from 20-week-old tamoxifen-injected mice. Animals were on a regular CD. For analysis of Foxp3/GFP and tdTomato/RFP within non-T cells, TCRβ+CD4− cells and TCRβ+CD4+ cells, three 8-week-old female lineage-tracker mice were injected with tamoxifen twice for 5 d each, at week 1 and week 6. These mice were fed a western diet (WD; 42% kcal from fat, 0.2% cholesterol) for 12 weeks and then spleens (n = 3) and LNs (n = 3) were harvested for flow cytometry.
BrDU proliferation assay
Seven 8-week-old female Foxp3eGFP-Cre-ERT2ROSA26fl-STOP-fl-tdTomato Apoe−/− (B6) mice were injected with tamoxifen twice for 5 d each, at week 1 and week 6, then fed a WD for 12 weeks. For six mice, BrDU (0.8 mg ml−1) was incorporated in the drinking water for the last 9 d of WD feeding. Spleen cells were harvested and processed into single-cell suspensions. After staining for viability and surface markers for 30 min at 4 °C, cells were fixed and permeabilized for 20 min at 24 °C with the Foxp3-staining kit (eBioscience). Cells were then treated with DNase I solution for 1 h at 37 °C. Cells were washed and stained for intracellular markers for 30 min at 24 °C. Samples were analyzed on an LSR II (BD Biosciences).
Cell isolation
Mouse spleens and LNs were harvested, crushed and filtered through a sterile 100-μm filter in 1× PBS. Red blood cells and platelets from spleen cells were discarded using RBC lysis buffer (Invitrogen) for 5 min followed by centrifugation at 250g for 10 min.
hPBMCs were isolated by density gradient centrifugation. Briefly, undiluted blood was transferred onto Ficoll-PaquePLUS (Cytiva) in SepMate tubes (StemCell) and centrifuged at 1,200g for 10 min. PBMC ring was harvested, washed with 1× PBS (Gibco) and centrifuged at 800g for 10 min. Red blood cells and platelets were discarded using RBC lysis buffer (Invitrogen) for 5 min followed by centrifugation at 250g for 10 min.
Flow cytometry
Mouse splenocytes or lymphocytes and hPBMCs were incubated with fixable viability dye (Ghost Dye Violet 510; Tonbo Biosciences or zombie yellow; BioLegend) for 30 min at 4 °C, washed and antibodies against surface markers were added for 30 min at 4 °C, according to the analysis mentioned in the figure legends. ICS was performed using either the eBioscience IC Fixation Buffer (only cytokines or chemokine panels) or the eBioscience Foxp3/Transcription factor staining buffer set (when cytokines were co-stained with FOXP3) for 20 min at 24 °C. Briefly, cells were permeabilized, then incubated with antibodies against intracellular markers (as mentioned in the figure legends) for 45 min at 24 °C and analyzed on an LSR Fortessa or LSR II (BD Biosciences).
For suppressive assay readout, cells were incubated with anti-CD3 or anti-CD4 for 20 min at 4 °C. DAPI was added right before analyzing on a BD FACSCanto (BD Biosciences).
For ICS assay, hPBMCs were stimulated for 6 h with PMA and ionomycin (1×; Cell Stimulation Cocktail, eBioscience). For the last 4 h, protein transport inhibitors brefeldin and monensin (1×; Protein Transport Inhibitor Cocktail, eBioscience) were added. After staining for viability and surface markers, cells were fixed, permeabilized and stained for intracellular markers. Samples were analyzed on an LSR II (BD Biosciences). All flow cytometry data were analyzed using FlowJo version 10.8.1.
Antibodies used are listed in Supplementary Table 12.
Cell sorting
Mouse cells from spleens and LNs were first incubated with a fixable viability dye for 30 min at 4 °C, washed and antibodies against surface markers were added for 30 min at 4 °C. Cells were sorted with a FACSAria II (BD Biosciences). Mouse Treg cells were defined as TCRβ+CD4+GFP+TdTomato+ and exTreg cells as TCRβ+CD4+ GFP−TdTomato+. hPBMCs were first enriched for CD4+ T cells. Cells were incubated with purified anti-CD14, anti-CD19 and anti-CD8a for 20 min at 4 °C. Then, Dynabeads coated with goat anti-Mouse IgG (Invitrogen) were added to the cells for 10 min on a turning wheel at 4 °C. Using a magnet, the supernatant containing CD4-enriched T cells was collected. Enriched cells were incubated for 30 min at 4 °C with antibodies against surface markers. Dead cells were stained using DAPI right before sorting on a FACSAria II or FACSAria Fusion (BD Biosciences). After gating on morphology, singlets, live cells (DAPI−) and CD8a−CD14−CD19− Treg cells were defined as CD3+CD4+CD25hiCD127lo, exTreg cells as CD3+CD4+CD56+CD16+ and naive T cells as CD3+CD4+ CD45RA+CCR7+.
Antibodies used are listed in Supplementary Table 12.
Quantitative real-time PCR
Human Treg cells and exTreg cells were directly sorted into 750 μl TRIzol LS (Thermo Fisher) and 20 μl of low-input lysis buffer (0.1% Triton X-100 (vol/vol), 1 U μl−1 RNase inhibitor, 2.5 mM dNTP), respectively. For TRIzol samples, RNA was extracted with miRNAeasy micro kit (Qiagen). Total RNA was quantified using a nanodrop spectrophotometer. TRIzol and low-input samples were reverse transcribed into cDNA using SuperScript II reverse transcriptase (Thermo Fisher). Real-time PCR reactions were performed according to the RT2 SYBR green gene expression assay protocol (Qiagen). RT2 SYBR Green qPCR master mix and premade RT2 qPCR Primer Assays (Qiagen) for human CST7 (GeneGlobe ID PPH05560E-200), NKG7 (GeneGlobe ID PPH07745A-200), GZMA (GeneGlobe ID PPH00314F-200), PRF1 (GeneGlobe ID PPH07126A-200), TBX21 (GeneGlobe ID PPH00396A-200), CCL4 (GeneGlobe ID PPH00563B-200) and ACTB (GeneGlobe ID PPH00073G-200) were used. Details can be found at https://geneglobe.qiagen.com/us/product-groups/rt2-qpcr-primer-assays. Results were calculated by applying the 1/ΔCT method using ACTB as housekeeping gene.
Bulk RNA-seq
Mouse Treg cells and exTreg cells were sorted into TRIzol LS (Thermo Fisher). Human Treg cells (200,000–500,000) were sorted into 750 μl of TRIzol LS (Thermo Fisher), while human exTreg cells (1,000 cells) were directly sorted in 20 μl of low-input lysis buffer as described previously51. For TRIzol samples, RNA was extracted using the miRNeasy micro kit (Qiagen). RNA quality was measured by using a 2100 TapeStation (Agilent Technologies). Samples with high-quality RNA (RNA integrity number > 8.0) were used for the next steps. For both TRIzol LS and low-input samples, double-stranded-cDNA was prepared using the SuperScript II reverse transcriptase (Thermo Fisher) according to the manufacturer’s instructions. cDNA was amplified using 15 cycles and eluted in 24 μl. Around 100 ng of resulting cDNA was processed using the Illumina DNA Prep Kit (20018704, Illumina) following the manufacturer’s instructions. Samples were normalized based on DNA concentration, pooled and loaded onto an Illumina NovaSeq 6000, and sequenced with 50 base-pair paired-end reads (PR50). Post-mapping quality-control checks were used to exclude poor-quality samples. Sequencing quality control was performed with FastQC v0.11.9 and MultiQC version v1.12. RNA-seq reads were trimmed using Ilumina’s DRAGEN FASTQ toolkit version 1.0.0. The STAR (v2.7.1 with default parameters)52 aligner was used to map the transcriptomes of the human and mouse bulk RNA-seq data to GENCODE GRCh38.p13 and GENCODE GRCm39, respectively. Raw read gene counts were obtained using STAR aligner with the ‘--quantMode GeneCounts’ option, which was used for the differential gene expression analysis. Quality of read counts was assessed before normalization, batch-effect correction and performing differential expression analysis using DESeq2 (v1.34)53. To eliminate lowly expressed genes, a cutoff (≤100 raw counts across samples) was enforced to remove genes with low read counts. Normalized counts data from DESeq2 were used to make z-score heat maps and perform the differential gene expression analysis. Variance stabilizing transformed (VST) counts were used to make the PCA plot and the spearman correlation plot.
Donor information is listed in Supplementary Table 13. Mouse and human bulk RNA-seq data are available on the NCBI Gene Expression Omnibus (GEO) under accession no. GSE217010.
Support vector machine
We used the SVM classifier from Scikit-learn (v1.1)54 machine learning library to classify data points. Packages such as Numpy (v1.23.2), Matplotlib (v3.5.2), Pandas (v 1.4.3) and Seaborn (v0.11.2) were used along with Scikit-learn to aid preprocessing. The mouse bulk RNA-seq data on sorted exTreg cells and Treg cells from spleen and LNs were used for SVM classification. For binary classification purposes, samples were labeled as either exTreg cells or Treg cells. Information on tissue type was disregarded. In total, 383 overlapping mouse–human orthologous genes were used in the single-cell datasets. The linear kernel was used to make predictions for which data were split into 90% train and 10% test. Fivefold cross-validation resulted in an accuracy of ~98%. The feature weights were extracted from the linear classifier to interpret the weights assigned to the genes. The weights defined the classifying power of each gene. The top 60 genes with positive weights (classifying exTreg cells) and the top 60 genes with negative weights (classifying Treg cells) were identified.
Single-cell RNA-seq analysis
A published21 single-cell dataset with CITE-seq on hPBMCs was used. This dataset is from 61 men and women (aged 40–80 years) undergoing cardiac catheterization at the University of Virginia Health System. All participants provided written informed consent before enrollment, and the study was approved by the Human Institutional Review Board (no. 15328) at the University of Virginia. Peripheral blood for sequencing experiments was obtained from these participants before catheterization. We performed differential gene expression analysis using Seurat v4.0.6 (FindAllMarkers and FindMarkers function), which uses the Wilcoxon rank-sum test. We compared these cells against all the CD4+ T cells and the Treg cells (cluster 17 from ref. 21) to identify DEGs and surface markers. Human scRNA-seq data are available at the NCBI GEO (accession no. GSE190570).
Plots
GGplot2 v3.3.5 and ComplexHeatmaps v2.12.1 were used to make bar plots and heat maps. Feature plots and UMAP plots were generated using Seurat’s FeaturePlot and DimPlot functions. Dot plots were generated using the package Ggpubr v0.4.0.
Enrichment analysis
For pathways analysis, gene lists have been inputted to the Enrichr online tool (https://maayanlab.cloud/Enrichr/). GSEA55 (v4.2.3) was used to identify cell clusters enriched for T cell-specific gene sets. We interrogated the pseudobulk of the single-cell transcriptome by performing GSEA against the exTreg cell and Treg cell gene signatures to identify clusters enriched for these cell types. We used the gene signatures of Treg cells and exTreg cells from mouse and human bulk RNA-seq data to validate and characterize cells expressing these genes in the single-cell dataset.
Bulk TCRβ sequencing
Human Treg cells, exTreg cells and naive T cells were sorted in HEPES buffer (1× PBS with 2% FBS and 0.025 M HEPES, pH7.3) and gDNA was extracted using QIAamp DNA Micro Kit (Qiagen). TCRβ data were sequenced with the immunoSEQ assay (Adaptive Biotech). Processing of raw Illumina sequence reads, filtering, demultiplexing, clustering and mapping of CDR3 sequences and annotation of VDJ genes using IMGT (ImMunoGeneTics) database sequences were performed by Adaptive Biotechnologies. Final sequence data were made available for download and analysis with their immunoSEQ Analyzer. Details of all productive TCR sequences are provided in Supplementary Table 14. TCR data were analyzed using GLIPH (v.2)22,56. Further downstream analysis was done in R using packages dplyr v1.0.9 and stats v4.1.1. GLIPH clusters were filtered for Fisher’s score < 0.05. Clonally expanded and enriched motifs were identified by P-value statistics using the poisson. test function to compare summed contribution scores of samples from each cluster (summed template frequency of each cell type by cluster). The poisson. test function performs an exact test of a simple null hypothesis about the ratio between two rate parameters. The log2 fold change values and P values of the enriched motifs were plotted as a volcano plot to identify expanded TCRs.
Donor information is listed in Supplementary Table 13.
Suppressive assay
Sorted CD16+CD56+ T cells and Treg cells were labeled with CellTrace Violet (Thermo Fisher) and tested for suppressive activity at a ratio of Treg cells/CD16+CD56+:Teff of 1:1 by a co-culture with CFSE labeled (Thermo Fisher) Teff cells (12,500 cells per well) stimulated with the Treg cell suppression inspector (Miltenyi) at a ratio of cells:beads of 1:2 in a 50 μl final volume of complete RPMI medium (RPMI 1640 medium + L-Glutamine, 1× penicillin–streptomycin, 10 mM HEPES buffer pH 7.3, 1 mM sodium pyruvate and 1× MEM non-essential amino acid) containing 5% AB Serum (GeminiBio). After 5 d of co-culture, proliferation was analyzed by dilution of CFSE in Teff cells (L/D−CD3+CD4+).
Degranulation assay
hPBMCs were co-cultured with P815 target cells at a 10:1 (PBMC:target) ratio for 6 h at 37 °C, 5% CO2. Target cells were either pre-loaded with 5 μg ml−1 human anti-CD3 (OKT3 clone) or left uncoated. Fluorochrome-conjugated anti-CD107a was added to each well (1:100 dilution, vol/vol) at the start of the incubation period. After 2 h, protein transport inhibitor cocktail was added at a 1× concentration. After the incubation, cells were harvested, washed and stained with fluorescently labeled antibodies for surface markers. CD107a antibody was not added again at this stage. CD16+CD56+ exTreg cells were gated from singlets, viable, CD14−, CD19− CD3+CD4+T cells, while CD16+CD56+ mature NK cells were identified from CD3−CD4− non-T cells.
Cytotoxic assay
P815 cells were incubated for 30 min with anti-CD3 (OKT3 clone; 5 μg ml−1). After a washing step, cells were resuspended in complete RPMI medium containing 5% AB Serum and 50 μM β-mercaptoethanol. Sorted CD8+ CTLs, Treg cells and CD16+CD56+ T cells were co-cultured with anti-CD3-loaded P815 at a ratio of 1:5 of P815:effector cells (7,500 P815 cells per well) in a final volume of 50 μl for 16 h at 37 °C and 5% CO2. Cytotoxicity was measured in the supernatant using CyQUANT LDH Cytotoxicity Assay Kit following the provider’s instructions (Invitrogen).
Statistics
Data analysis and statistical comparisons were done using GraphPad Prism version 9.3.1 and R version 4.0.1. We used a two-tailed Wald test with Benjamini–Hochberg P-value adjustment for comparing differential expression of genes in the human and mouse bulk RNA-seq transcriptomes. For analysis of gene and surface marker enrichment within CD4+ T cell clusters in the human scRNA-seq data, we used a two-tailed Wilcoxon’s rank-sum test with Benjamini–Hochberg correction for multiple comparisons. We used a two-sided Poisson test for the identification of enriched CDR3 motifs in the human TCR-seq dataset. Two-sample comparisons were done with a two-tailed Mann–Whitney U test or with a two-tailed unpaired student’s t-test. We used one-way ANOVA with Dunnett’s multiple-comparison test or a Kruskal–Wallis test with Dunn’s multiple-comparison testing for analyses involving more than two samples. A two-way ANOVA with Dunnett’s multiple-comparison test was performed when two independent variables were involved. We used a two-tailed Fisher’s exact test with Benjamini–Hochberg adjusted P values for pathway enrichment analysis. All statistical tests, sample sizes and error bar descriptions of graphs are detailed in the legends of respective figures. Statistical tests for supplementary tables are provided in the column headers. Exact P values are reported in the figure legends and Supplementary Information.
Reporting summary
Further information on research design is available in the Nature Portfolio Reporting Summary linked to this article.
Extended Data
Extended Data Fig. 1 |. Experimental controls for lineage-tracker atherosclerotic mouse model and differentially expressed genes in mouse Treg cells vs exTregs.
(a,b) Eight week-old female Foxp3eGFP-Cre-ERT2 ROSA26fl-STOP-fl-tdTomato Apoe−/− mice were injected with Tamoxifen twice for 5 days each, at week 1 and 6, then fed Western diet (WD) for 12 weeks. a) gating strategy, b) representative plots and quantification of exTreg and Treg cells among CD4+T cells (black circles) in lymph nodes (LNs) and spleen, harvested after 12 weeks of WD from 3 independent mice. Non-T cells (orange open squares) and CD4−T cells (green open circles) are negative controls. Frequencies of exTregs and Treg cells among the parent subsets were plotted as mean ± SEM. Statistical comparisons were done using 2-way ANOVA with Dunnett’s multiple comparison test. **** p < 0.0001. c) Volcano plot representing significantly differentially expressed genes between mouse Treg cells and exTregs from 20-week old FoxP3eGFP-Cre-ERT2 ROSA26CAG-fl-stop-fl-tdTomato Apoe−/− mice (lymph nodes and spleen pooled). Left, up in Treg cells (blue). Right, up in exTregs (red). Horizontal dotted line is at -log10 (p adjusted) = 1.3 (padj = 0.05). The top 60 exTreg and 60 Treg classifying genes from the SVM model are annotated. Canonical Treg genes Il2ra and Foxp3 are shown in black boxes. Statistical analyses of DE genes using two-tailed Wald test with Benjamini-Hochberg correction for multiple comparisons.
Extended Data Fig. 2 |. Expression of exTreg candidate genes in scRNAseq data and validation by qRT-PCR from sorted human cells.
(a) Feature maps showing the gene expression of the single gene markers CST7, NKG7, GZMA, PRF1, TBX21 and CCL4 in the human single-cell dataset for all CD4 T cell clusters. (b) Combinations 1–4 and 6 of exTreg candidate genes are highlighted in red on UMAP embeddings of CD4 T clusters from the scRNA-Seq. (c) UMAP embeddings of CD4 T clusters. Black outline marks cluster CD4T_7; cells that express either CD56 (left) or CD16 (right) are shown as red dots. (d) Gating strategy to identify exTreg and Treg cells in human PBMCs. Dump channel: CD14, CD19. (e) Gene expression analysis of CST7, NKG7, GZMA, PRF1, TBX21 and CCL4 in sorted human Treg cells (blue circles) and exTregs (red circles) by qRT-PCR. Gene-specific Ct values were normalized (ΔCt) based on actin (ACTB). Relative expression was calculated by the 1/ΔCt method. n = 7. 33.33% male, 66.67% female donors; age: 21–54 yrs. Data shown as mean ± SEM. Each dot represents a biological replicate from an independent donor. Statistical comparisons by two-tailed Mann Whitney U test. **p = 0.0012,***p = 0.0006.
Extended Data Fig. 3 |. Human bulk RNAseq.
(a) Gating strategy used to sort human exTregs and Treg cells to perform bulk RNA-seq. (b) gene set enrichment analysis (GSEA) of bulk RNA-seq transcriptomes of sorted human exTreg cells against CD4T_7 (left) and all other clusters (right). Normalized enrichment score (NES) and FDR q values are indicated. (c) Significantly (adjusted p < 0.05) enriched pathways in human exTreg cells, based on genes expressed at significantly higher levels in human exTreg than in Treg cells. Analysis by Bioplanet2019 from the EnrichR suite. Dotted line indicates adjusted p = 0.05 (-log10 padj=1.3). Statistical comparisons with two-tailed Fisher’s exact test and Benjamini- Hochberg adjustment of p-values. (d) Gating strategy to identify exTregs and NK cells in human PBMCs. Dump channel: CD14, CD19.
Extended Data Fig. 4 |. Mouse bulk RNAseq.
(a) Comparative gene signature analysis between mouse exTregs and Treg cells. Genes were filtered for significant differential expression in mouse and human dataset. Gene expression shown here is from FoxP3eGFP-Cre-ERT2 ROSA26CAG-fl-stop-fl-tdTomato Apoe−/− mice. Low-expressed genes (<7 raw reads in all samples) in our dataset were filtered out. Technical replicates were averaged, biological replicates shown as columns. Analysis of differentially expressed (DE) genes was done using DESeq2. Curated list of significant DE (log2FC ± 1, adjusted p < 0.05) genes are shown on normalized heatmaps, scaled by row (z scores). (b) Gene set enrichment analysis (GSEA) of mouse exTreg genes from bulk RNA-seq transcriptomes against human exTreg (left) and Treg cells (right) from the human bulk RNA-seq data set. Mouse orthologs of human genes, filtered for those present in the human scRNA-Seq targeted gene panel, were used to calculate enrichment for mouse bulk RNA-seq dataset. (c) Comparative gene signature analysis between mouse exTreg and NK cells. An external dataset was used for mouse NK cells (3 samples): GSE122597, GSE116177, and GSE52043. EdgeR was used to normalize the counts by applying the trimmed mean of M-values (TMM) method and counts per million (CPM) conversion. All other data processing and filtering steps were same as in a. Curated list of significant DE (log2FC ± 1, adjusted p < 0.05) genes are shown on normalized heatmaps, scaled by row (z scores). Statistical analyses of DE genes (a,c) using two-tailed Wald test with Benjamini-Hochberg correction for p-value adjustment. All data from independent biological replicates.
Extended Data Fig. 5 |. Assessment of proliferation in mouse Treg cells and exTregs.
(a) Eight week-old female Foxp3eGFP-Cre-ERT2 ROSA26fl-STOP-fl-tdTomato Apoe−/− mice were injected with Tamoxifen twice for 5 days each, at week 1 and 6, then fed Western diet (WD) for 12 weeks. BrDU (0.8 mg/mL) was incorporated in the drinking water for the last 9 days of WD (n = 6). (b) Gating scheme for CD4+T cells. (c) Ki67 FMO control. (d) Representative plots and quantification of proliferating Treg cells (blue circles, %Ki67+BrDU+CD4+Foxp3+RFP+) and exTregs (red circles, %Ki67+BrDU+CD4+Foxp3−RFP+) in the spleen (n = 6), as identified by anti-BrDU and anti-Ki-67 Abs. Data shown as mean ± SEM. Each animal is an independent biological replicate. Gates were set by FMO for Ki67 and by no BrdU controls for BrdU. Background from “No BrDU” control was subtracted for normalization. The percentage of proliferating cells was compared by two-tailed Mann-Whitney U test, **p = 0.0087.
Extended Data Fig. 6 |. Treg marker expression on human exTregs.
Representative contour FACS plots showing the expressions of PD-1, GITR, LAG3 and TIGIT in exTreg cells (left). Corresponding FMO controls were used to set the gates. Right, contour plots showing the expression of these markers in all CD4+T cells and in Treg cells from the same donor.
Extended Data Fig. 7 |. Cytotoxic and T cell activation marker expression on stimulated human exTreg vs NK cells.
Contour plots show intracellular expression of CD40L (X-axis) and Perforin (Y-axis) in exTregs and NK cells from unstimulated and PMA+ionomycin stimulated PBMCs. Data from three independent donors. 33.33% male, 66.67% female donors, age: 25–43 yrs.
Extended Data Fig. 8 |. Gating strategy and representative plots.
(a) Gating strategy used to analyze granzyme B, perforin and TNF in Treg cells and exTregs. (b) Contour plots show surface expression of chemokine receptors CCR5, CXCR2, CXCR3, CXCR4 and CX3CR1 on exTreg cells (left) and their corresponding expression in all CD4+T cells (right). Individual FMO controls were used to set the gate for expression of each receptor.
Supplementary Material
Acknowledgements
We thank A. Rudensky at Memorial Sloan Kettering Cancer Center for providing lineage-tracker mice. We also thank members of the clinical core and flow cytometry core at LJI. We thank Z. Mikulski and S. McArdle, microscopy core, LJI, for capturing images of exTreg cells and Treg cells in mouse arteries. We thank H. Cheroutre and N. Thiault who kindly provided the P815 cell line.
Footnotes
Code availability
No new algorithms were generated for this study.
Competing interests
The authors declare no competing interests.
Additional information
Extended data is available for this paper at https://doi.org/10.1038/s41590-023-01589-9.
Supplementary information The online version contains supplementary material available at https://doi.org/10.1038/s41590-023-01589-9.
Peer review information Nature Immunology thanks the anonymous reviewers for their contribution to the peer review of this work. Primary Handling Editor: L. A. Dempsey, in collaboration with the Nature Immunology team. Peer reviewer reports are available.
Data availability
RNA-seq data have been uploaded to the NCBI GEO and are accessible under accession numbers GSE217010 (mouse and human bulk RNA-seq) and GSE190570 (human scRNA-seq data). Human TCR-seq data were generated and processed by Adaptive Biotechnologies. Details of productive TCR sequences, accessed through their immunoSEQ Analyzer portal, are provided in Supplementary Table 14. Source data are provided with this paper.
References
- 1.Tse K. et al. Atheroprotective vaccination with MHC-II restricted peptides from ApoB-100. Front. Immunol 4, 493 (2013). [DOI] [PMC free article] [PubMed] [Google Scholar]
- 2.Kimura T. et al. Atheroprotective vaccination with MHC-II-restricted ApoB peptides induces peritoneal IL-10-producing CD4 T cells. Am. J. Physiol 312, H781–H790 (2017). [DOI] [PMC free article] [PubMed] [Google Scholar]
- 3.Kimura T. et al. Regulatory CD4+ T cells recognize major histocompatibility complex class II molecule-restricted peptide epitopes of apolipoprotein B. Circulation 138, 1130–1143 (2018). [DOI] [PMC free article] [PubMed] [Google Scholar]
- 4.Wolf D. et al. Pathogenic autoimmunity in atherosclerosis evolves from initially protective apolipoprotein B 100 –reactive CD4+ T-regulatory cells. Circulation 142, 1279–1293 (2020). [DOI] [PMC free article] [PubMed] [Google Scholar]
- 5.Marchini T, Hansen S. & Wolf D. ApoB-specific CD4+ T cells in mouse and human atherosclerosis. Cells 10, 446 (2021). [DOI] [PMC free article] [PubMed] [Google Scholar]
- 6.Roy P. et al. Immunodominant MHC-II (major histocompatibility complex II) restricted epitopes in human apolipoprotein B. Circ. Res 131, 258–276 (2022). [DOI] [PMC free article] [PubMed] [Google Scholar]
- 7.Saigusa R. et al. Single-cell transcriptomics and TCR reconstruction reveal CD4 T cell response to MHC-II-restricted APOB epitope in human cardiovascular disease. Nat. Cardiovasc. Res 1, 462–475 (2022). [DOI] [PMC free article] [PubMed] [Google Scholar]
- 8.Ait-Oufella H, Lavillegrand J-R & Tedgui A. Regulatory T cell-enhancing therapies to treat atherosclerosis. Cells 10, 723 (2021). [DOI] [PMC free article] [PubMed] [Google Scholar]
- 9.Roy P, Orecchioni M. & Ley K. How the immune system shapes atherosclerosis: roles of innate and adaptive immunity. Nat. Rev. Immunol 22, 251–265 (2022). [DOI] [PMC free article] [PubMed] [Google Scholar]
- 10.Li J. et al. CCR5+T-bet+FoxP3+ effector CD4 T cells drive atherosclerosis. Circ. Res 118, 1540–1552 (2016). [DOI] [PMC free article] [PubMed] [Google Scholar]
- 11.Butcher MJ et al. Atherosclerosis-driven Treg plasticity results in formation of a dysfunctional subset of plastic IFNγ+ Th1/Tregs. Circ. Res 119, 1190–1203 (2016). [DOI] [PMC free article] [PubMed] [Google Scholar]
- 12.Qiu R. et al. Regulatory T cell plasticity and stability and autoimmune diseases. Clin. Rev. Allergy Immunol. 58, 52–70 (2020). [DOI] [PubMed] [Google Scholar]
- 13.Ali AJ, Makings J. & Ley K. Regulatory T cell stability and plasticity in atherosclerosis. Cells 9, 2665 (2020). [DOI] [PMC free article] [PubMed] [Google Scholar]
- 14.Zhou X. et al. Instability of the transcription factor Foxp3 leads to the generation of pathogenic memory T cells in vivo. Nat. Immunol 10, 1000–1007 (2009). [DOI] [PMC free article] [PubMed] [Google Scholar]
- 15.Bailey-Bucktrout SL et al. Self-antigen-driven activation induces instability of regulatory T cells during an inflammatory autoimmune response. Immunity 39, 949–962 (2013). [DOI] [PMC free article] [PubMed] [Google Scholar]
- 16.Svensson MND et al. Reduced expression of phosphatase PTPN2 promotes pathogenic conversion of Tregs in autoimmunity. J. Clin. Invest 129, 1193–1210 (2019). [DOI] [PMC free article] [PubMed] [Google Scholar]
- 17.Gaddis DE et al. Apolipoprotein AI prevents regulatory to follicular helper T cell switching during atherosclerosis. Nat. Commun 9, 1095 (2018). [DOI] [PMC free article] [PubMed] [Google Scholar]
- 18.Hsieh W-C et al. PTPN2 links colonic and joint inflammation in experimental autoimmune arthritis. JCI Insight 5, e141868 (2020). [DOI] [PMC free article] [PubMed] [Google Scholar]
- 19.Hua J. et al. Pathological conversion of regulatory T cells is associated with loss of allotolerance. Sci. Rep 8, 7059 (2018). [DOI] [PMC free article] [PubMed] [Google Scholar]
- 20.Rubtsov YP et al. Stability of the regulatory T cell lineage in vivo. Science 329, 1667–1671 (2010). [DOI] [PMC free article] [PubMed] [Google Scholar]
- 21.Saigusa R. et al. Sex differences in coronary artery disease and diabetes revealed by scRNA-seq and CITE-seq of human CD4+ T cells. Int. J. Mol. Sci 23, 9875 (2022). [DOI] [PMC free article] [PubMed] [Google Scholar]
- 22.Glanville J. et al. Identifying specificity groups in the T cell receptor repertoire. Nature 547, 94–98 (2017). [DOI] [PMC free article] [PubMed] [Google Scholar]
- 23.Dogra P. et al. Tissue determinants of human NK cell development, function, and residence. Cell 180, 749–763 (2020). [DOI] [PMC free article] [PubMed] [Google Scholar]
- 24.Ferraro A. et al. Interindividual variation in human T regulatory cells. Proc. Natl Acad. Sci. USA 111, E1111–E1120 (2014). [DOI] [PMC free article] [PubMed] [Google Scholar]
- 25.Sokol CL & Luster AD The chemokine system in innate immunity. Cold Spring Harb. Perspect. Biol 7, a016303 (2015). [DOI] [PMC free article] [PubMed] [Google Scholar]
- 26.Mackay CR CXCR3+CCR5+ T cells and autoimmune diseases: guilty as charged? J. Clin. Invest 124, 3682–3684 (2014). [DOI] [PMC free article] [PubMed] [Google Scholar]
- 27.Khaw YM et al. Astrocytes lure CXCR2-expressing CD4+ T cells to gray matter via TAK1-mediated chemokine production in a mouse model of multiple sclerosis. Proc. Natl Acad. Sci. USA 118, e2017213118 (2021). [DOI] [PMC free article] [PubMed] [Google Scholar]
- 28.Weiskopf D. et al. Dengue virus infection elicits highly polarized CX3CR1+ cytotoxic CD4+ T cells associated with protective immunity. Proc. Natl Acad. Sci. USA 112, E4256–E4263 (2015). [DOI] [PMC free article] [PubMed] [Google Scholar]
- 29.Stolla M. et al. Fractalkine is expressed in early and advanced atherosclerotic lesions and supports monocyte recruitment via CX3CR1. PLoS ONE 7, e43572 (2012). [DOI] [PMC free article] [PubMed] [Google Scholar]
- 30.Lesnik P, Haskell CA & Charo IF Decreased atherosclerosis in CX3CR1−/− mice reveals a role for fractalkine in atherogenesis. J. Clin. Invest 111, 333–340 (2003). [DOI] [PMC free article] [PubMed] [Google Scholar]
- 31.Abi-Younes S. et al. The stromal cell-derived factor-1 chemokine is a potent platelet agonist highly expressed in atherosclerotic plaques. Circ. Res 86, 131–138 (2000). [DOI] [PubMed] [Google Scholar]
- 32.Shevach EM Foxp3+ T regulatory cells: still many unanswered questions–a perspective after 20 years of study. Front. Immunol 9, 1048 (2018). [DOI] [PMC free article] [PubMed] [Google Scholar]
- 33.Klein L, Robey EA & Hsieh C-S Central CD4+ T cell tolerance: deletion versus regulatory T cell differentiation. Nat. Rev. Immunol 19, 7–18 (2019). [DOI] [PubMed] [Google Scholar]
- 34.Cording S. et al. The intestinal micro-environment imprints stromal cells to promote efficient Treg induction in gut-draining lymph nodes. Mucosal Immunol. 7, 359–368 (2014). [DOI] [PubMed] [Google Scholar]
- 35.Pezoldt J. et al. Neonatally imprinted stromal cell subsets induce tolerogenic dendritic cells in mesenteric lymph nodes. Nat. Commun 9, 3903 (2018). [DOI] [PMC free article] [PubMed] [Google Scholar]
- 36.Bettelli E. et al. Reciprocal developmental pathways for the generation of pathogenic effector TH17 and regulatory T cells. Nature 441, 235–238 (2006). [DOI] [PubMed] [Google Scholar]
- 37.Korn T. et al. IL-6 controls Th17 immunity in vivo by inhibiting the conversion of conventional T cells into Foxp3+ regulatory T cells. Proc. Natl Acad. Sci. USA 105, 18460–18465 (2008). [DOI] [PMC free article] [PubMed] [Google Scholar]
- 38.Josefowicz SZ, Lu L-F & Rudensky AY Regulatory T cells: mechanisms of differentiation and function. Annu. Rev. Immunol 30, 531–564 (2012). [DOI] [PMC free article] [PubMed] [Google Scholar]
- 39.Josefowicz SZ et al. Extrathymically generated regulatory T cells control mucosal TH2 inflammation. Nature 482, 395–399 (2012). [DOI] [PMC free article] [PubMed] [Google Scholar]
- 40.Chaudhry A. et al. CD4+ regulatory T cells control TH17 responses in a Stat3-dependent manner. Science 326, 986–991 (2009). [DOI] [PMC free article] [PubMed] [Google Scholar]
- 41.Zheng Y. et al. Regulatory T-cell suppressor program co-opts transcription factor IRF4 to control TH2 responses. Nature 458, 351–356 (2009). [DOI] [PMC free article] [PubMed] [Google Scholar]
- 42.Koch MA et al. T-bet+ Treg cells undergo abortive Th1 cell differentiation due to impaired expression of IL-12 receptor β2. Immunity 37, 501–510 (2012). [DOI] [PMC free article] [PubMed] [Google Scholar]
- 43.Wang Z. et al. Pairing of single-cell RNA analysis and T cell antigen receptor profiling indicates breakdown of T cell tolerance checkpoints in atherosclerosis. Nat. Cardiovasc. Res 2, 290–306 (2023). [DOI] [PMC free article] [PubMed] [Google Scholar]
- 44.Depuydt MAC et al. Single-cell T cell receptor sequencing of paired human atherosclerotic plaques and blood reveals autoimmune-like features of expanded effector T cells. Nat. Cardiovasc. Res 2, 112–125 (2023). [DOI] [PMC free article] [PubMed] [Google Scholar]
- 45.Fisson S. et al. Continuous activation of autoreactive CD4+ CD25+ regulatory T cells in the steady state. J. Exp. Med 198, 737–746 (2003). [DOI] [PMC free article] [PubMed] [Google Scholar]
- 46.Chowdhury RR et al. Human coronary plaque T cells are clonal and cross-react to virus and self. Circ. Res 130, 1510–1530 (2022). [DOI] [PMC free article] [PubMed] [Google Scholar]
- 47.Thome JJC & Farber DL Emerging concepts in tissue-resident T cells: lessons from humans. Trends Immunol. 36, 428–435 (2015). [DOI] [PMC free article] [PubMed] [Google Scholar]
- 48.Van Acker HH, Capsomidis A, Smits EL & Van Tendeloo VF CD56 in the immune system: more than a marker for cytotoxicity? Front. Immunol 8, 892 (2017). [DOI] [PMC free article] [PubMed] [Google Scholar]
- 49.Sharma MD et al. An inherently bifunctional subset of Foxp3+ T helper cells is controlled by the transcription factor Eos. Immunity 38, 998–1012 (2013). [DOI] [PMC free article] [PubMed] [Google Scholar]
- 50.Sharma MD et al. Reprogrammed foxp3+ regulatory T cells provide essential help to support cross-presentation and CD8+ T cell priming in naive mice. Immunity 33, 942–954 (2010). [DOI] [PMC free article] [PubMed] [Google Scholar]
- 51.Rosales SL et al. A sensitive and integrated approach to profile messenger RNA from samples with low cell numbers. Methods Mol. Biol 1799, 275–302 (2018). [DOI] [PubMed] [Google Scholar]
- 52.Dobin A. et al. STAR: ultrafast universal RNA-seq aligner. Bioinformatics 29, 15–21 (2013). [DOI] [PMC free article] [PubMed] [Google Scholar]
- 53.Love MI, Huber W. & Anders S. Moderated estimation of fold change and dispersion for RNA-seq data with DESeq2. Genome Biol. 15, 550 (2014). [DOI] [PMC free article] [PubMed] [Google Scholar]
- 54.Pedregosa F. et al. Scikit-learn: machine learning in Python. J. Mach. Learn. Res 12, 2825–2830 (2011). [Google Scholar]
- 55.Subramanian A. et al. Gene-set enrichment analysis: a knowledge-based approach for interpreting genome-wide expression profiles. Proc. Natl Acad. Sci. USA 102, 15545–15550 (2005). [DOI] [PMC free article] [PubMed] [Google Scholar]
- 56.Huang H, Wang C, Rubelt F, Scriba TJ & Davis MM Analyzing the Mycobacterium tuberculosis immune response by T cell receptor clustering with GLIPH2 and genome-wide antigen screening. Nat. Biotechnol 38, 1194–1202 (2020). [DOI] [PMC free article] [PubMed] [Google Scholar]
Associated Data
This section collects any data citations, data availability statements, or supplementary materials included in this article.
Supplementary Materials
Data Availability Statement
RNA-seq data have been uploaded to the NCBI GEO and are accessible under accession numbers GSE217010 (mouse and human bulk RNA-seq) and GSE190570 (human scRNA-seq data). Human TCR-seq data were generated and processed by Adaptive Biotechnologies. Details of productive TCR sequences, accessed through their immunoSEQ Analyzer portal, are provided in Supplementary Table 14. Source data are provided with this paper.


