

Abstract
The use of cannabis products has increased substantially. Cannabis products have been perceived and investigated as potential treatments for attention-deficit/hyperactivity disorder (ADHD). Accordingly, co-administration of cannabis products and methylphenidate (MPH), a first-line medication for ADHD, is possible. Oral MPH undergoes extensive presystemic metabolism by carboxylesterase 1 (CES1), a hepatic enzyme which can be inhibited by two prominent cannabinoids, Δ9-tetrahydrocannabinol (THC) and cannabidiol (CBD). This prompts further investigation into the likelihood of clinical interactions between MPH and these two cannabinoids through CES1 inhibition. In the present study, inhibition parameters were obtained from a human liver S9 system and then incorporated into static and physiologically-based pharmacokinetic (PBPK) models for prediction of potential clinical significance. The inhibition of MPH hydrolysis by THC and CBD was reversible, with estimated unbound inhibition constants (Ki,u) of 0.031 and 0.091 µM, respectively. The static model predicted a mild increase in MPH exposure by concurrent THC (34%) and CBD (94%) from smoking a cannabis cigarette and ingestion of prescriptive CBD, respectively. PBPK models suggested no significant interactions between single doses of MPH and CBD (2.5 – 10 mg/kg) when administered simultaneously, while a mild interaction (area under drug concentration-time curve increased by up to 55% and maximum concentration by up to 45%) is likely if multiple doses of CBD (10 mg/kg twice daily) are administered. In conclusion, the pharmacokinetic disposition of MPH can be potentially influenced by THC and CBD under certain clinical scenarios. Whether the magnitude of predicted interactions translates into clinically relevant outcomes requires verification in an appropriately designed clinical study.
SIGNIFICANCE STATEMENT
This work demonstrated a potential mechanism of drug-drug interactions between methylphenidate (MPH) and two major cannabinoids (Δ9-tetrahydrocannabinol [THC] and cannabidiol [CBD]) not previously reported. We predicted a mild interaction between MPH and THC when the cannabinoid exposure occurred via cannabis smoking. Mild interactions between MPH and CBD were predicted with multiple oral administrations of CBD.
Introduction
Cannabis products are prepared from plants within the Cannabis genus which contain a number of unique compounds (cannabinoids) that can regulate various biologic processes. Most cannabis products contain the major psychoactive constituent Δ9-tetrahydrocannabinol (THC) and are frequently used recreationally. The use of cannabis has increased dramatically in the US both recreationally and medically, which appears to coincide with the growing number of states legalizing its use (Azofeifa et al., 2016). In addition to its recreational use, the use of cannabis for treatment of certain diseases and palliative care has attracted attention in the medical community (Bridgeman and Abazia, 2017). Notably, cannabidiol (CBD), the major non-psychoactive cannabinoid, has been formulated as a highly purified oral solution (Epidiolex) and received approval by the US Food and Drug Administration (FDA) for treatment of two severe forms of epilepsy (Lennox-Gastaut syndrome and Dravet syndrome) in pediatric patients.
With an increase in interest and use of cannabis, the likelihood of concomitant use of cannabis/cannabinoids and conventional medications also increases and with it, a higher risk of drug-drug interactions (DDIs). Importantly, medical cannabis users are typically treating chronic medical conditions that are only partially responsive to conventional medications and may be more likely to use prescription medications with medical cannabis (Caputi and Humphreys, 2018). We recently identified THC, CBD, and cannabinol as potent in vitro inhibitors of carboxylesterase 1 (CES1), and THC and CBD were predicted to pose a risk of DDI when consumed concurrently with CES1 substrate medications (Qian et al., 2019a; Qian et al., 2019b).
CES1 is an esterase predominantly expressed in the liver and is responsible for the majority of hepatic hydrolytic activity (Imai et al., 2006; Crow et al., 2007; Taketani et al., 2007; Basit et al., 2020). When examined by the absolute abundance in the liver, the expression of CES1 exceeds that of any major phase I or phase II drug-metabolizing enzymes (i.e., cytochrome P450s (P450s) and UDP-glucuronosyltransferases) suggesting its essential role in the disposition of both endogenous compounds and xenobiotics (He et al., 2019). Indeed, therapeutic agents serving as CES1 substrates include one or more medications from almost all drug classes (Her and Zhu, 2020; Qian and Markowitz, 2020).
Methylphenidate (MPH) is almost exclusively eliminated by CES1 (Faraj et al., 1974; Redalieu et al., 1982; Sun et al., 2004; Zhu et al., 2008). A typical MPH formulation is a racemic mixture of d- and l-threo enantiomers (i.e., d-MPH and l-MPH), with d-MPH being the biologically active isomer (Patrick et al., 1987). MPH is highly soluble and has almost complete absorption after oral administration (Faraj et al., 1974). However, the absolute oral bioavailability of MPH is relatively low (∼20% and 5% for d-MPH and l-MPH, respectively), suggesting extensive presystemic metabolism (Srinivas et al., 1993). After oral administration, the majority of MPH is recovered in the urine in the form of its inactive metabolite ritalinic acid (RA) (Faraj et al., 1974; Patrick et al., 1981; Redalieu et al., 1982), and this clearance pathway (with preference on l-MPH) was identified as metabolism by CES1 (Sun et al., 2004; Patrick et al., 2007; Zhu et al., 2008). Accordingly, impairment of CES1 activity by either genetic polymorphism or concurrent administration with medications serving as metabolic inhibitors of CES1 may result in an increase in the exposure to MPH. This hypothesis finds support in several clinical studies (Patrick et al., 2007; Patrick et al., 2013; Zhu et al., 2017). A schematic representing inhibition of CES1-mediated hydrolysis of MPH by THC and CBD was shown in Fig. 1.
Fig. 1.

Chemical structures of MPH, RA, THC, and CBD and hypothesis of CES1-mediated interactions between MPH and THC/CBD. Dashed lines with flat arrows represent inhibition.
MPH is prescribed as a first-line medication for patients with attention-deficit/hyperactivity disorder (ADHD) (Conners, 2002; Piper et al., 2018; Wolraich et al., 2019), a neuropsychiatric disorder that has an onset typically in childhood but can persist well into adulthood (Wilens and Spencer, 2010; Wolraich et al., 2019). Concomitant use of MPH with cannabis products is likely to occur under several circumstances. “Self-medication” with cannabis products for ADHD symptoms is reported to be relatively common (Mitchell et al., 2016), and the potential therapeutic effects of cannabis products in ADHD have been investigated and reported (Strohbeck-Kuehner et al., 2008; Cooper et al., 2017; Hupli, 2018; Hergenrather et al., 2020). In addition, over-the-counter availability of CBD makes it very accessible to the general public as well as ADHD patients (Smith et al., 2021).
In the present study, we assessed the inhibition kinetics of MPH metabolism by the major cannabinoids THC and CBD using an established in vitro human liver S9 (HLS9) system and predicted the magnitude of clinical interactions by both static and physiologically based pharmacokinetic (PBPK) models.
Materials and Methods
Materials
Racemic MPH, phenacetin, and bovine serum albumin (BSA) were purchased from MilliporeSigma (St. Louis, MO). THC, CBD, and RA analytical standards were purchased from Cayman Chemical (Ann Arbor, MI). HLS9 pooled from 200 donors (XTreme 200) was purchased from Sekisui XenoTech (Kansas City, KS). HEPES (4-(2-hydroxyethyl)-1-piperazineethanesulfonic acid) was purchased from Thermo Fisher Scientific, Inc. (Waltham, MA). All other used chemicals were of the highest analytical grade.
General In Vitro Assay Conditions
In the in vitro assay, racemic MPH was incubated with HLS9 which efficiently converted MPH into its metabolite RA. The formation of RA was monitored as a surrogate of MPH metabolism. The incubation mixture contained varying concentrations of MPH, 250 µg/ml of HLS9, 0.2% BSA, and 20 mM of HEPES. Consistent with previously reported studies (Sun et al., 2004; Aresti-Sanz et al., 2020), significant spontaneous hydrolysis of MPH was observed in various buffered aqueous solutions tested in our study. The least amount of RA was spontaneously formed in HEPES, and, accordingly, it was chosen as the buffer system for the studies. Similarly, BSA was used, which has the effect of limiting the relative fraction of MPH hydrolyzed spontaneously compared with MPH hydrolyzed by enzymes. The reaction was initiated by addition of HLS9 to the incubation mixture at 37°C for a period of 20 minutes. Our preliminary results indicated that the reaction was linear with respect to the selected enzyme concentration and incubation time. After 20 minutes, the reactions were terminated by adding acetonitrile (4-fold volume of the incubation mixture) containing 2.5 µM phenacetin as the internal standard and 1% formic acid. Formic acid was added to increase the stability of MPH during sample analysis (Aresti-Sanz et al., 2020). The resulting mixture was vortexed and centrifuged at 16,100 × g for 10 minutes to precipitate the protein. The supernatant was transferred out and diluted with water/acetonitrile containing 1% formic acid before liquid chromatography-tandem mass spectrometry (LC-MS/MS) analysis.
Evaluation of Inhibition Mechanism
The mechanism of inhibitory effects exerted by THC and CBD on MPH hydrolysis was determined in a time-dependent inhibition (TDI) assay. In this assay, samples were divided into either the preincubation group or control group, and there was an extra preincubation period prior to the typical incubation period described in the “General In Vitro Assay Conditions” section. In the preincubation period, HLS9 was incubated either with (preincubation group) or without (control group) inhibitor (i.e., THC and CBD, final concentration 0–31.8 µM) for 30 minutes. Once the preincubation period ended, MPH was added to both groups to initiate the reactions. Inhibitor was compensated to the control group accordingly to match the inhibitor concentrations between preincubation and control groups. Both groups contained the same mixture components in the incubation period: 75 µM substrate (MPH), 250 µg/ml HLS9, 0.2% BSA, 20 mM HEPES, and 1% (v/v) DMSO. THC and CBD have limited aqueous solubility and were thereby predissolved in DMSO. The DMSO concentrations (v/v) in all samples were adjusted to 0.5% during the preincubation period and 1% during the incubation period to control potential bias introduced by this organic solvent. The incubation lasted for 20 minutes, after which the reactions were terminated by addition of acetonitrile (4-fold incubation volume) containing 2.5 µM phenacetin and 1% formic acid. The resulting mixture was then prepared for LC-MS/MS analysis as described above in the “General In Vitro Assay Conditions” section. This study was conducted in a single experiment with triplicate samples.
Since some spontaneous hydrolysis of MPH during incubation was observed, the measured RA formation was corrected by control samples with identical experimental setup and MPH concentrations but without HLS9. The resulting rate of RA formation was expressed as a percentage ratio (Rv) of the one in sample without inhibitor. A nonlinear regression analysis (eq. 1) was performed using Rv as the dependent variable and unbound concentrations (Iu) of either THC or CBD as the independent variable:
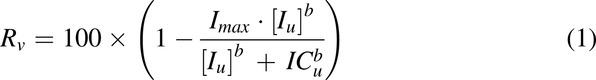 |
where the iterated parameters were: ICu, the unbound half maximal inhibition concentration; Imax, the maximal degree of inhibition; and b, a shape exponent. The estimated ICu was further converted to IC50,u (unbound inhibitor concentration that achieves 50% Rv) using eq. 2:
A TDI (i.e., irreversible inhibition of mechanism) is concluded when a decrease of ≥1.5-fold IC50,u is observed with a 30-minute preincubation (Grimm et al., 2009).
Inhibition Kinetics of MPH Metabolism by THC and CBD
The inhibition of MPH hydrolysis by THC and CBD was further investigated in in vitro assays in which the kinetic parameters of the inhibition were estimated for determination of inhibition types and potency. The assay conditions and procedures have been described in the “General In Vitro Assay Conditions” section with the exception of inclusion of inhibitors (i.e., THC and CBD). The incubation mixture comprised combinations of varying MPH concentrations (0, 25, 50, 100, 200, and 400 µM) and cannabinoid concentrations (0–19.1 µM for THC and 0–25.4 µM for CBD). The final DMSO concentration (v/v) was 1%. Incubation mixtures containing 0–400 µM MPH and 1% DMSO without the presence of either cannabinoid were used as control samples. The reactions were initiated by addition of HLS9 into the incubation mixture at 37°C and lasted for 20 minutes. Afterward, acetonitrile (4-fold incubation volume) containing 2.5 µM phenacetin and 1% formic acid was added to terminate the reactions. The resulting mixture was then prepared for LC-MS/MS analysis as described above in the “General In Vitro Assay Conditions” section. This study was conducted in three independent experiments with duplicate samples in each.
Similar to the TDI study, the RA formed in the control samples without HLS9 was subtracted from the one measured in the samples with the same substrate concentrations to account for spontaneous hydrolysis of MPH. The kinetic parameters were estimated without weighting using a mixed competitive-noncompetitive model described by eq. 3 (Segel, 1975; Greenblatt et al., 2011):
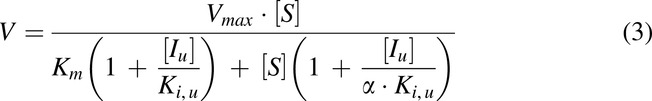 |
The dependent variable (V) is the formation rate of RA and the independent variables included MPH ([S]) and unbound cannabinoid ([Iu]) concentrations. The iterated parameters were: Vmax, the maximum metabolite formation rate; Km, the Michaelis-Menten constant; Ki,u, the unbound inhibition constant for inhibitor which is an indicator of inhibition potency; and α, an indicator of the inhibition type. An estimated α value approaching positive infinity indicates competitive type of inhibition, while a value equal to 1 suggests a noncompetitive type of inhibition. The inhibition type was further verified by Lineweaver-Burk plots.
Binding of THC and CBD in In Vitro Assay
Excessive nonspecific binding of cannabinoids to both protein and test tube wall has been previously documented (Garrett and Hunt, 1974; Patilea-Vrana and Unadkat, 2019; Qian et al., 2019b). Given that 0.2% BSA was included in the in vitro incubation, ignoring this factor will result in an underestimated inhibition potency of the tested cannabinoids. Accordingly, the unbound concentrations of THC and CBD in the in vitro assay were calculated using the tube adsorption method (Patilea-Vrana and Unadkat, 2019). In the binding assay, two groups (protein group and buffer group) of samples were prepared. In the protein group, the composition of the incubation mixture (i.e., 250 µg/ml of HLS9, cannabinoids, 0.2% BSA, and 20 mM of HEPES) was identical to that used in the kinetic study described above with the exception of MPH which was not added. In the buffer group, the incubation mixture contained all the components in the protein group except for HLS9 and BSA. The mixture was placed in a water bath maintained at 37°C and incubated for 20 minutes. Afterward, in each group, samples were further split into two treatments. In the first treatment (Treatment A), the incubation mixture was transferred to a twofold volume of acetonitrile (containing phenacetin as the internal standard) in a new tube. In the second treatment (Treatment B), a same twofold volume of acetonitrile solution was directly added to the incubation mixture. Addition of acetonitrile was presumed to recover essentially all of the cannabinoid adsorbed to the tube wall. The resulting mixture was vortexed and centrifuged at 16,100 × g for 10 minutes. The supernatant was further diluted with acetonitrile/water and subject to LC-MS/MS analysis. This study was conducted in three independent experiments with duplicate samples each.
To estimate unbound fractions of THC and CBD in the incubation mixture, a binding model (Supplemental Fig. 1) was proposed as a simplification of the binding process, where the cannabinoid was assumed to be in unbound form ([S]), bound to the tube wall (SWb in the buffer group and SWp in the protein group), or bound to the protein (SP) and rapid equilibrium among these three forms was assumed. The unbound fractions of THC and CBD over the range of concentrations studied in the in vitro assays were not considered solubility limited.
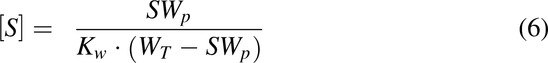
The binding between cannabinoid and tube wall was studied in the buffer group in the absence of protein. The binding data were described by the following equation using nonlinear regression analysis:
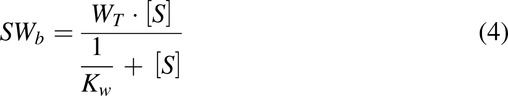 |
where SWb and [S] represented the cannabinoid bound to the tube wall and unbound cannabinoid concentration, respectively. The estimated parameters were: Kw, the binding constant between cannabinoid and tube wall; and WT, the total tube wall (W + SWb) available for cannabinoid binding.
Fig. 2.

Inhibition curves for THC (A) and CBD (B) in time-dependent inhibition study. HLS9 (250 µg/ml) was preincubated with or without cannabinoids for 30 minutes before addition of MPH. The formation rate of metabolite (ritalinic acid) from MPH was expressed as a relative value over the control sample without addition of cannabinoids. Data points represent the mean (±S.D.) of triplicate samples from a single experiment. Lines represent model prediction.
When the protein was added (the protein group), the free cannabinoid cannot be directly measured. Instead, the measured concentration in solution included both free cannabinoid (S) and the fraction bound to the protein (SP). By contrast, the fraction of cannabinoid bound to tube wall (SWp) could still be measured (difference in cannabinoid concentration between Treatments A and B). The binding process could be described by a new equation integrating the protein component [derivation of equation provided in (Supplemental Appendix A)]:
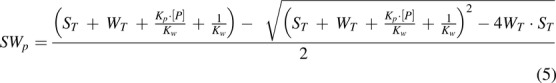 |
The dependent variable was the measured cannabinoid bound to the tube wall (SWp), and the independent variable was the total cannabinoid concentration (ST = S + SWp + SP) in the incubation mixture, which was measured as the cannabinoid concentration in the sample from the protein group with Treatment B. WT and Kw had been estimated in eq. 4 and were used as constants here. Kp represented the binding constant between cannabinoid and protein. [P] was another variable representing the free concentration of protein in the incubation mixture. Since [P] could not be measured, the term Kp×[P] was estimated as a single parameter with the assumption that [P] was constant regardless of cannabinoid concentrations. This assumption appeared to be valid based on the large amount of BSA (0.2%) added in the incubation mixture.
It was determined that neither THC nor CBD could be completely recovered with Treatment B. Absorption onto the inner layer of tube wall might be a potential cause. Consequently, in our analysis, empirical equations were employed to account for the observed loss of cannabinoids.
Once the parameters were estimated, the unbound concentrations of cannabinoid ([S]) in the incubation mixture of inhibition studies could be calculated utilizing an equation derived from eq. 4 by assuming same interaction between cannabinoid and tube wall regardless of the presence of protein:
 |
where Kw and WT are estimated from eq. 4, and SWp can be calculated from eq. 5 based on the total cannabinoid added to the incubation (i.e., ST).
LC-MS/MS Analysis
The concentrations of RA formed during in vitro incubations and cannabinoids from the in vitro binding assay were determined by LC-MS/MS. The system consisted of a Shimadzu high-performance liquid chromatography system (Shimadzu, Kyoto, Japan) coupled to an AB Sciex API 3000 triple-quadrupole mass spectrometer (Applied Biosystems, Foster City, CA). Chromatographic separation was achieved on an analytical column (Aqua, 50 × 2.0 mm, 5 µm, Phenomenex, Inc., Torrance, CA). A gradient mobile phase was employed, comprised of water with 0.1% formic acid as the aqueous phase and methanol as the organic phase. The total flow rate of the mobile phase was 0.25 ml/min. Mass spectrometry was performed in positive mode with electrospray as the ionization method. The monitored mass transitions for RA, THC, CBD, and the internal standard phenacetin were m/z 220 → 84, 315 → 193, 315 → 193, and 180 → 110, respectively. The lowest standards used in our study were 5 nM, 79 nM, and 79 nM for RA, THC, and CBD, respectively. The range and linearity of calibration standards and the accuracy and precision of low, median, and high standards for each analyte are provided in (Supplemental Table 1). Representative chromatograms of RA, THC, and CBD are provided in (Supplemental Fig. 2).
Prediction of Clinical Interactions by Static Models
To evaluate the possibility of interactions between MPH and tested cannabinoids rising to clinical significance, a ratio of intrinsic clearance (R1) was calculated by eq. 7 (FDA Center for Drug Evaluation and Research, 2020):
 |
where Imax,u is the maximal unbound physiological concentrations of THC and CBD at steady-state, and Ki,u is the unbound inhibition constant obtained from in vitro study.
R1 was then compared with a cut-off value of 1.02 as recommended in the FDA guidance referenced above.
Since both R1 values for THC and CBD exceeded the cut-off value, the magnitude of DDI was further evaluated using a static mechanistic model. In the model, a ratio of area under the plasma concentration-time curve (AUCR) of MPH in the presence to absence of cannabinoids was predicted using the equation provided in the FDA guidance document with minor modification (FDA Center for Drug Evaluation and Research, 2020):
 |
where [I]h is the maximum unbound concentration of cannabinoid in the liver. fm is the fraction of MPH that is metabolized by CES1. An fm value of 80% was used based on a PK study in which the radio-labeled metabolites of MPH excreted in urine were measured (Faraj et al., 1974). Ki,u is the unbound inhibition constant estimated from the in vitro inhibition kinetic study. The intestinal component of a typical static model was not considered due to the unknown fraction of MPH available after intestinal metabolism. Per FDA guidance, this fraction is assumed to be 1 when the data are not available, which consequently leads to inattention to DDI in intestine (FDA Center for Drug Evaluation and Research, 2020). Notably, minimal influence from inhibition of intestinal CES1 is expected due to the relatively low abundance of CES1 as compared with that in the liver (Taketani et al., 2007; Basit et al., 2020).
For both THC and CBD, only drug concentrations achieved systemically (i.e., plasma/serum/blood concentrations) were used as the surrogates for [I]h in eq. 8. Although the reported maximum concentration of CBD was achieved by the oral route (Taylor et al., 2018), a maximum unbound concentration of CBD at portal vein was not estimated in the static model due to a paucity of information around the fraction of absorption, intestinal bioavailability, and absorption rate of CBD with this formulation. Instead, PBPK models were constructed for a more mechanistic prediction of clinical interactions between MPH and CBD.
Prediction of Clinical Interactions by PBPK Models
To obtain a more mechanistic prediction of DDIs between MPH and CBD under various clinical scenarios, PBPK models were built for both immediate-release (IR) MPH (Ritalin) and an oral solution formulation of CBD (Epidiolex). Pharmacokinetic (PK) studies of MPH and CBD using human subjects were searched in the public domain and summarized. Only PK data with Ritalin and Epidiolex were collected with the exception of data with intravenous administration route. A total of 17 (21 datasets) and 5 (8 datasets) studies were selected for MPH and CBD, respectively. The demographics of subjects in each study was summarized in (Supplemental Tables 2 and 3).
A “middle-out” approach was implemented during model development for both MPH and CBD. The system-specific parameters were mainly derived from the default database of the PBPK software, and drug-specific parameters were obtained from various sources as well as software prediction (Supplemental Tables 4 and 5). Generally, data from intravenous administrations were used first to inform the in vivo clearance and volume of distribution. Components such as dissolution, intestinal permeability, and presystemic metabolism were then added and refined using the datasets with oral formulation. A general workflow of the model development and verification is summarized in (Supplemental Fig. 3).
Fig. 3.

Representative analyses of inhibition kinetics and Lineweaver-Burk plots for THC (A1, A2) and CBD (B1, B2). Incubation was conducted using 250 µg/ml HLS9 with combinations of varying concentrations of MPH and cannabinoids. Data were from one of three independent experiments with duplicate samples. Points represent mean values (±S.D.) of duplicate samples.
For MPH, enzyme kinetic data from a reported in vitro study were incorporated (Sun et al., 2004). fm of MPH by CES1 was fixed at 80% based on the fraction of MPH excreted as RA in urine after both intravenous and oral dose of radio-labeled MPH (Faraj et al., 1974). The remaining MPH was presumed to be cleared by P450 enzymes with unidentified individual isoforms. In the PBPK model, a dummy non-CES1 enzyme was created to account for the remaining 20% clearance of MPH. The intrinsic clearance of MPH by CES1 and the non-CES1 enzyme were first calculated based on the in vivo plasma clearance of MPH observed from a study with intravenous dosing route (Srinivas et al., 1993). However, PK studies with oral doses consistently showed shorter terminal half-lives than the only available intravenous data (Supplemental Fig. 4). Therefore, the data with intravenous administration were not used in the model development. Instead, an in silico lipophilicity value was used without optimization to inform drug distribution and the Vmax values were optimized based on the datasets with oral formulation. Features of competitive inhibition of CES1 by d- and l-MPH was also incorporated into the model, and the Km values obtained in vitro (Sun et al., 2004) were used as Ki. The abundance of CES1 in the liver and intestine was obtained from a proteomics study (Basit et al., 2020).
Fig. 4.

PBPK model simulated and observed concentration-time profiles of MPH after oral administration. The simulated PK profiles were compared with the observed data reported in literature for assessment of model performance. Demographics of the simulated virtual individuals (n = 100) were matched to ones reported in the respective study. Solid lines and shades represent mean and 90% (5th–95th) prediction interval of simulated profiles, respectively. Points and error bars represent mean and S.D. of the observed data, respectively. Median values (both simulated and observed) were summarized for the Stage_2017 study.
For CBD, CYP3A4, CYP2C19, and CYP2C9 are the major enzymes responsible for its oxidative metabolism (Jiang et al., 2011; Beers et al., 2021). The fm of CBD by the respective isoforms have been reported based on an in vitro CBD depletion assay (Beers et al., 2021). These fm values are 0.54, 0.31, and 0.15 for CYP3A4, CYP2C19, and CYP2C9, respectively. A similar fm value (0.46) for CYP3A4 can be estimated (Supplemental Appendix B) based on the relative CBD exposure (area under drug concentration-time curve, AUC) after an oromucosal administration of 1:1 THC:CBD either with or without a strong CYP3A4 inhibitor (ketoconazole) (Stott et al., 2013). In this study, the fm values reported by Beers et al. were used. Then, further based on the in vivo plasma clearance of CBD (74.4 L/h) after an intravenous dose (Ohlsson et al., 1986), the intrinsic clearance of CBD by CYP3A4, CYP2C19, and CYP2C9 were calculated as 4.62, 15.1, and 1.44 µl/min/pmol protein, respectively. The details of the back-calculation method are provided in (Supplemental Appendix B). Meanwhile, mechanism-based inhibition of CYP3A4 and CYP2C19 and reversible inhibition of CYP2C9 by CBD have been reported (Bansal et al., 2020), which was also incorporated into our PBPK model. The hepatic abundance of CYP3A4, CYP2C19, and CYP2C9 was set using system-default, while their abundance in intestine was scaled based on a proteomics study (Drozdzik et al., 2018). There is a paucity of information regarding the dissolution and absorption of CBD, which appears to be solubility limited. Accordingly, two Weibull functions were empirically implemented to describe this process.
In both models, the lipophilicity of the compounds was input to enhance the prediction of a number of parameters, such as intestinal and tissue permeability. For calculation of drug distribution, the method described by Rodgers and Rowland (Rodgers and Rowland, 2006; Rodgers and Rowland, 2007) was selected for MPH, and the method described by Schmitt (Schmitt, 2008) was selected for CBD. As aforementioned, the lipophilicity value of MPH was used without optimization, while the lipophilicity value of CBD was optimized due to a substantial underprediction of drug exposure when compared with observed data with intravenous administration (Ohlsson et al., 1986). Selection of lipophilicity for optimization was guided by physiologic plausibility, sensitivity analysis (Supplemental Fig. 5), and the ability of the new estimate to describe observed data (Supplemental Fig. 6). The optimized lipophilicity value (3.15) is different from the reported in silico LogP of CBD (approximately 5.9) (Nelson et al., 2020). However, it has been noted that methods for drug distribution may not be very reliable for highly lipophilic compounds (Rodgers and Rowland, 2007). It has been documented that predicted distribution may be vulnerable to experimental error, uncertainty from in silico predictions, and overprediction of tissue distribution for lipophilic compounds (Pearce et al., 2017). Therefore, we consider the optimization of lipophilicity for CBD justifiable.
Fig. 5.

PBPK model simulated and observed concentration-time profiles of CBD after oral administration. The simulated PK profiles were compared with the observed data reported in literature for assessment of model performance. Demographics of the simulated virtual individuals (n = 100) were matched to ones reported in the respective study. Solid lines and shades represent geometric mean and 90% (5th–95th) prediction interval of simulated profiles, respectively. Points and error bars represent geometric mean and S.D. of the observed data, respectively.
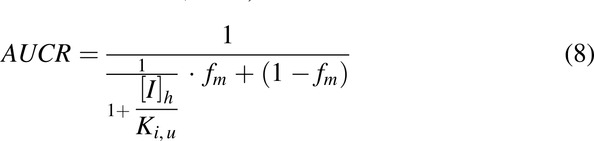
Fig. 6.
Simulated outcomes of administration of MPH either simultaneously (A) or with a time difference (B) to a single dose of CBD. The IR formulation of MPH (Ritalin) and the prescriptive oral solution formulation of CBD (Epidiolex) were used in simulation. Under the scenarios of simultaneous administration (A), different strengths of CBD dose (2.5–10 mg/kg) were simulated. Under the scenarios of MPH and CBD administered at different time (B), the dose of CBD was fixed at 10 mg/kg. The resulting influence of CBD on the exposure to d-MPH were summarized as ratios of AUC and Cmax as compared with MPH administered alone. The ratios were reported in the forms of geometric means and 90% prediction interval of the simulated 100 virtual subjects.
Overall, the PBPK models were developed based on training datasets (10 for MPH and 3 for CBD). The developed PBPK models were further verified on other datasets (10 for MPH and 4 for CBD) that were not used in model development. For model evaluation, simulations were performed with virtual populations (100 subjects each) and study designs matching the reported clinical studies. PK parameters from simulation were compared with the ones observed. Prediction error (PE) was calculated as below for model evaluation (Khalil and Laer, 2014):
 |
where Ypredicted and Yobserved represent the PK parameters summarized from simulation and observed from reported studies, respectively. PE is further weighted by number of study subjects, and a weighted PE within ±25% is considered acceptable.
Once the models for MPH and CBD were verified, both models were integrated into a joint model for prediction of DDI under various clinical scenarios in which immediate release (IR)-MPH (Ritalin) and the oral solution of CBD (Epidiolex) were co-administered. Inhibition of CES1 by CBD was described by the Ki,u value obtained from this study. The non-CES1 enzymes are assumed not subject to inhibition by CBD. A virtual population comprising 100 subjects (50% female) with an age range of 18–55 were created and used in all simulations. The AUC and maximum concentration (Cmax) of the biologically active enantiomer d-MPH were selected as the endpoints and compared with the one in which racemic MPH was given alone. The significance of interactions was assessed based on the changes in d-MPH AUC and Cmax as perpetrated by co-administered CBD.
Software and Statistical Methods
The built-in “nls” function (NL2SOL algorithm) in R 3.6.0 (R Foundation for Statistical Computing, Vienna, Austria) was employed in the nonlinear regression analysis of the data from nonspecific binding, TDI, and inhibition kinetic studies. The model performance was evaluated by diagnostic residual plots, parameter uncertainty and plausibility, and visual check. Noncompartmental analysis was performed utilizing the “PKNCA” package in R 3.6.0. AUC was calculated using a linear trapezoidal method. The “ggplot2” package in R 3.6.0 was used for generating plots. Lineweaver-Burk plots were made using Microsoft Excel (Redmond, WA). The PBPK models were developed and verified using PK-Sim and Mobi version 9.1 (Open Systems Pharmacology, http://www.open-systems-pharmacology.org) software. A subset of physicochemical parameters of MPH and CBD (Supplemental Tables 4 and 5) were predicted by using either PK-Sim or ADMET Predictor v9.5.0. (Simulation Plus). Parameter optimization was performed utilizing the “Parameter Identification” module in PK-Sim and the Monte-Carlo algorithm was used in estimation.
Results
Nonspecific Binding of THC and CBD in the In Vitro Incubation Mixture
In pure buffer, THC and CBD present in the solution at the end of incubation was substantially lower than the amount added (Supplemental Fig. 7). Their concentrations increased in accordance with the increasing amount added, suggesting solubility was not the main cause of the observed loss of cannabinoids in solution. Based on the nonlinear feature of the increase, a saturable process was indicated, which matched our hypothesis of nonspecific binding to tube wall. In buffer containing proteins (BSA and HLS9), the majority of the added cannabinoids were recovered in the solution (Supplemental Fig. 7), indicating extensive protein binding. The data were well described by the proposed binding model (eq. 4 and 5, [Supplemental Fig. 1]). The unbound fractions of THC and CBD tested in the incubation mixture (fu,inc) were then calculated (Supplemental Table 6). For THC, the added total concentrations (1.59–31.8 µM) in the incubation mixture converted to unbound concentrations in the range of 0.0233–0.487 µM (fu,inc approximated 1.5%). For CBD, the added total concentrations (1.59–31.8 µM) in the mixture converted to unbound concentrations in the range of 0.0640–1.49 µM (fu,inc approximated 4.4%).
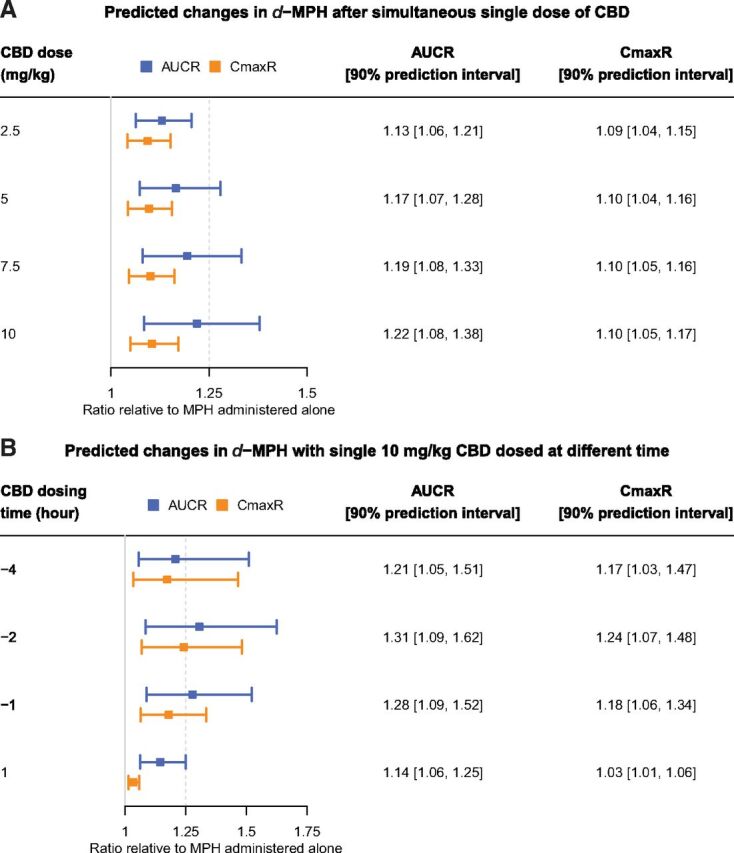
Fig. 7.

Simulated changes in MPH exposure when co-administered with multiple doses of CBD for 7 days. The IR formulation of MPH (Ritalin) and the prescriptive oral solution formulation of CBD (Epidiolex) were used in simulation. In the simulation, MPH was administered twice daily with a time interval of 4 hours between the first and second doses, while CBD (0, 5, and 10 mg/kg) was given every 12 hours. The AUC24 and Cmax of d-MPH were summarized on Day 1, 4, and 7. Open circles represent individual parameter values of the simulated 100 virtual subjects. Horizontal bars in the boxplots represent the 5th, 50th, and 95th percentiles of the simulated population.
THC and CBD Reversibly Inhibited MPH Hydrolysis
The hydrolysis of MPH mediated by HLS9 was inhibited by THC and CBD both in a concentration-dependent manner (Fig. 2). The calculated IC50,u values for THC and CBD at the presence and absence of tested cannabinoids during a 30-minute preincubation period are summarized in Table 1. Based on the observation that the inhibition of MPH hydrolysis was not potentiated (i.e., lower IC50,u) by preincubation with either THC or CBD, reversible mechanism of inhibition (i.e., not time-dependent) was concluded for both cannabinoids.
TABLE 1.
Inhibition of MPH hydrolysis by THC and CBD in time-dependent studies.
| IC50,u (µM) | |||
|---|---|---|---|
| Cannabinoids | Preincubation: 0 min (A) |
Preincubation: 30 min (B) |
A/B |
| THC | 0.0441 ± 0.0074 | 0.0618 ± 0.0097 | 0.71 |
| CBD | 0.157 ± 0.027 | 0.198 ± 0.029 | 0.79 |
IC50,u, unbound inhibitor concentration that achieves 50% activity. IC50,u values were presented as estimate ± SE (uncertainty) from nonlinear regression analysis using data from a single experiment with three replicate samples.
In Vitro Kinetic Study on Inhibition of MPH Hydrolysis by THC and CBD
The kinetic data were well described by the mixed competitive-noncompetitive model. The estimated parameters are listed in Table 2 and representative kinetic profiles are shown in Fig. 3. The Ki,u values for THC and CBD were 0.031 and 0.091 µM, respectively. The estimated α values and the Lineweaver-Burk plots (Fig. 3) suggested mixed but closer to noncompetitive inhibition type for THC and competitive inhibition type for CBD.
TABLE 2.
Determination of kinetic parameters for inhibition of MPH hydrolysis by THC and CBD.
| Cannabinoids | Km (µM) | Ki,u (µM) | α | Vmax (pmol/min/mg protein) |
|---|---|---|---|---|
| THC | 85.7 ± 12.9 | 0.031 ± 0.003 | 16.4 ± 14.7 | 1056 ± 77 |
| CBD | 90.6 ± 10.1 | 0.091 ± 0.004 | >9999 | 940 ± 150 |
All values were presented as mean ± S.D. of three independent experiments with duplicate samples.
Prediction of Clinical Interactions between MPH and Cannabinoids by Static Models
Literature reporting the human PK of THC and CBD with various cannabis products and dosing routes were reviewed to extract the maximum attainable systemic exposure to these two cannabinoids. For THC, the highest exposure was reported in a study by Huestis and colleagues, where a mean THC plasma Cmax of 0.515 µM was achieved in healthy subjects (n = 6) after smoking a cannabis cigarette containing 33.8 mg THC (Huestis et al., 1992).
For CBD, the highest exposure (plasma Cmax = 2.33 µM) was observed after healthy volunteers (n = 9) took the second oral dose of 750 mg twice daily Epidiolex (Taylor et al., 2018). The unbound plasma Cmax (Imax,u) values were further calculated by multiplying the Cmax by the unbound fraction of THC (0.028) (Garrett and Hunt, 1974) and CBD (0.04) in plasma (FDA Center for Drug Evaluation and Research, 2018b). Based on the Imax,u and Ki,u values, The R1 values were calculated as 1.46 and 2.54 for THC and CBD, respectively, suggesting possible clinical DDI and necessity of further investigations. The likelihood of clinical DDIs was then evaluated by a static mechanistic model, which predicted AUCR values of 1.34 and 1.94 for THC and CBD, respectively.
Development of PBPK models for MPH and CBD
The MPH model was developed and verified using datasets shown in Table 3. The weighted PE for both d-MPH (11.7% for AUC and -0.8% for Cmax) and l-MPH (-7.0% for AUC and 1.3% for Cmax) were within the prespecified acceptance range. Plots of model-predicted versus observed concentration-time profiles for all MPH datasets are provided in Fig. 4. The CBD model was developed and verified using datasets shown in Table 4. The weighted PE were 6.2% for AUC and -12.3% for Cmax, which also met prespecified acceptance criteria. Plots of model-predicted versus observed concentration-time profiles for all CBD datasets are provided in Fig. 5.
TABLE 3.
Model evaluation for MPH.
| AUC (ng·h/ml) | Cmax (ng/ml) | ||||||||
|---|---|---|---|---|---|---|---|---|---|
| Dose | N | Mean observed | Mean predicted | PE (%) | Mean observed | Mean predicted | PE (%) | ||
| d/dl-MPH | |||||||||
| Calibration Datasets | |||||||||
| (Midha et al., 2001) | 40 mg Ritalin | 24 | 59.1 | 90.8 | 53.7 | 11.7 | 16.9 | 45.1 | |
| (Midha et al., 2001) | 40 mg Ritalin (fed) | 24 | 68.1 | 103 | 51.2 | 14.3 | 15.6 | 9.1 | |
| (Patrick et al., 2007) | 0.3 mg/kg Ritalin | 20 | 82.9 | 54.5 | −34.3 | 15.3 | 8.5 | −44.4 | |
| (Spencer et al., 2006) | 40 mg Ritalin | 12 | 81.9b | 97.1 | 18.5 | 14.1 | 15.7 | 11.3 | |
| (Teo et al., 2004) | 20 mg Focalin | 15 | 121 | 96.1 | −20.5 | 23.7 | 18.1 | −23.7 | |
| (Teo et al., 2004) | 20 mg Focalin (fed) | 15 | 132 | 99.6 | −24.5 | 22.1 | 15.5 | −30.0 | |
| (Patrick et al., 2013) | 0.3 mg/kg Ritalin | 24 | 52.1 | 53.4 | 2.5 | 10.1 | 8.2 | −18.8 | |
| (Patrick et al., 2013) | 0.15 mg/kg Focalin | 24 | 53.7 | 53.4 | −0.6 | 10.7 | 8.2 | −23.4 | |
| (Parasrampuria et al., 2007) | 50 mg Ritalin | 49 | 106 | 125 | 17.9 | 21.1 | 24.0 | 13.7 | |
| (Parasrampuria et al., 2007) | 90 mg Ritalin | 49 | 195 | 226 | 15.9 | 38.8 | 43.2 | 11.3 | |
| Verification Datasets | |||||||||
| (Hysek et al., 2014) | 60 mg Ritalin | 15 | 175a | 172 | −1.9 | 30.4 | 32.4 | 6.6 | |
| (Abbas et al., 2016) | 40 mgc Ritalin | 29 | 132 | 202 | 52.6 | 15.6 | 22.9 | 46.8 | |
| (Adjei et al., 2014) | 25 mgd Ritalin | 24 | 282 | 188 | −33.3 | 29.1 | 18.0 | −38.1 | |
| (DeVane et al., 2000) | 10 mg Ritalin | 6 | 23.7a | 19.7 | −16.9 | 4 | 4.5 | 12.5 | |
| (Koehm et al., 2010) | 20 mg Ritalin | 9 | 35 | 43 | 22.9 | 7 | 7.1 | 1.4 | |
| (Meyer et al., 2000) | 20 mg Ritalin | 20 | 35.8 | 48.9 | 36.5 | 7.6 | 8.8 | 15.9 | |
| (Patrick et al., 1989) | 10 mge Ritalin | 18 | 42.0 | 45.3 | 7.8 | 6.4 | 4.8 | −25.3 | |
| (Spencer et al., 2012) | 40 mgf Ritalin | 26 | 179a | 185 | 3.3 | 25.4 | 22.6 | −10.8 | |
| (Stage et al., 2017) | 10 mg Ritalin | 16 | 21.4g | 23.2g | 18.7 | 5g | 3.9g | −19.2 | |
| (Wong et al., 1998) | 40 mg Ritalin | 21 | 93.6 | 90.1 | −3.7 | 17.8 | 16.4 | −7.9 | |
| Weighted PE (%) | 11.7 | -0.8 | |||||||
| l-MPH | |||||||||
| (Wong et al., 1998) | 40 mg Ritalin | 21 | 1.51 | 1.33 | −11.9 | 0.821 | 0.54 | −34.2 | |
| (Patrick et al., 2013) | 0.3 mg/kg Ritalin | 24 | 0.77 | 0.72 | −6.5 | 0.18 | 0.22 | 22.2 | |
| (Patrick et al., 2007) | 0.3 mg/kg Ritalin | 20 | 0.82a,b | 0.80 | −2.4 | 0.22b | 0.25 | 13.6 | |
| Weighted PE (%) | -7.0 | 1.3 | |||||||
PK parameters shown as arithmetic mean values unless otherwise noted.
a AUC0-last
b Obtained from a non-compartmental analysis of digitized population-level data.
c Two doses administered 6 hours apart.
d Three doses administered 4 hours apart.
e Two doses administered 5 hours apart.
f Two doses administered 4 hours apart.
g Values shown as median.
TABLE 4.
Model evaluation for CBD.
| AUC (ng·h/ml) | Cmax (ng/ml) | |||||||
|---|---|---|---|---|---|---|---|---|
| Dose (Epidiolex) | N | Mean observed | Mean predicted | PE (%) | Mean observed | Mean predicted | PE (%) | |
| Calibration Datasets | ||||||||
| (Taylor et al., 2018) | 1500 mg | 6 | 1470a,b | 1486a | 1.1 | 260b | 214 | −17.7 |
| (Taylor et al., 2018) | 6000 mg | 6 | 3490a,b | 3076a | −11.9 | 610b | 453 | −25.7 |
| (Tayo et al., 2020) | 200 mg | 8 | 435a,b | 648a | 49.0 | 118b | 87.0 | −26.3 |
| Verification Datasets | ||||||||
| (Taylor et al., 2019) | 200 mg | 8 | 522a,b | 548a | 5.0 | 96.4b | 86.2 | −10.6 |
| (Crockett et al., 2020) | 750 mg | 29 | 1490b | 1526 | 2.4 | 154b | 152 | −1.3 |
| (Taylor et al., 2018) | 3000 mg | 6 | 2540a,b | 2608a | 2.7 | 418b | 386 | −7.7 |
| (Taylor et al., 2018) | 4500 mg | 6 | 3100a,b | 2968a | −4.3 | 677b | 441 | −34.9 |
| Weighted PE (%) | 6.2 | −12.3 | ||||||
PK parameters are shown as geometric mean values.
a AUC0-last
b Obtained from a non-compartmental analysis of digitized population-level data due to the discrepancies observed between the reported PK parameters and concentration-time plots.
Prediction of Clinical Interactions between MPH and CBD by PBPK Models
To evaluate the likelihood of a clinical interaction between MPH and CBD, virtual scenarios in which single doses of IR-MPH (10 mg) and prescriptive oral solution of CBD (0 – 10 mg/kg) were administered simultaneously were simulated. The AUC and Cmax of MPH caused by highest concomitant CBD dose (10 mg/kg) increased by 22% and 10%, respectively (Fig. 6).
CBD dose (10 mg/kg) was then simulated with a time interval either before or after the MPH dose to explore effects of dosing time. A maximum magnitude of interactions was predicted when the CBD dose was given between 1 and 4 hours prior to the MPH dose (Fig. 6). Under this scenario, the changes in MPH AUC and Cmax could be above 31% and 24%, respectively.
Finally, multiple doses of dl-MPH (10 mg twice daily with a 4-hour interval) and CBD (0, 5 or 10 mg/kg every 12 hours) were simulated for 7 days to assess the outcomes from long-term co-administration. An increasing trend of interaction was predicted over the simulated duration (Fig. 7). On Day 7, as compared with treatment with placebo (i.e., 0 mg/kg CBD), concomitant use of 5 mg/kg CBD increased MPH AUC24 (AUC over 24-hour interval) and Cmax by 38% and 31%, respectively. Similarly, the higher simulated CBD dose (10 mg/kg) exerted a mild influence, with a predicted increase in MPH AUC24 and Cmax by 55% and 45%, respectively.
Discussion
In the present study, potent reversible inhibition of MPH hydrolysis by THC and CBD with Ki,u values in the nanomolar range were identified in vitro. Since MPH is almost exclusively metabolized by CES1, the observed inhibitory effects are presumed to be mediated by inhibition on CES1. This observation is consistent with our prior work utilizing recombinant CES1 (Qian et al., 2019b). The essential role CES1 plays in the PK of MPH is most obviously demonstrated by an approximately 150% increase in MPH exposure observed in subjects carrying loss-of-function CES1 variants as compared with their non-carrier peers (Patrick et al., 2007; Zhu et al., 2008; Stage et al., 2017). In addition, a recently published study revealed an inverse correlation between plasma CES1 (an hypothesized indicator of hepatic CES1 activity) and MPH exposure (Shi et al., 2021). Although essentially no direct clinical assessments have been conducted to assess the influence of CES1 inhibitors on the PK of co-administered CES1 substrate drugs, reduced CES1 activity associated with loss-of-function CES1 variants has been documented to significantly increase drug exposures in patients treated with a number of CES1 substrate drugs, including MPH (Zhu et al., 2008; Stage et al., 2017), clopidogrel (Lewis et al., 2013; Tarkiainen et al., 2015), and oseltamivir (Tarkiainen et al., 2012). Similarly, impairment of CES1 activity by concomitant drugs is expected to increase exposure to MPH and potentially lead to a higher likelihood and severity of adverse effects (such as insomnia and blood pressure and heart rate increase) that are typically associated with higher doses of MPH (Stein et al., 2003; Nissen, 2006; Food and Drug Administration, 2021).
For THC, smoking a cannabis cigarette (Huestis et al., 1992) was predicted to achieve sufficient systemic concentrations to alter the disposition of MPH. An increase in MPH exposure (AUC) by 34% was predicted using the static model, suggesting a mild magnitude of DDI. For CBD, the highest drug exposure was conferred by use of Epidiolex due to its relatively large oral CBD doses, and an increase of 94% in MPH exposure was predicted by the static model. PBPK models were then developed to provide a more mechanistic insight into the interactions between MPH and CBD. As suggested by the PBPK model, a single dose of oral solution CBD, even at the maximum dose in its label, is not likely to cause any significant impact on concurrent IR-MPH. However, a mild DDI might be expected under the scenario where the CBD dose was given 1–4 hours prior to the MPH dose. One potential explanation for this phenomenon is the relatively slow dissolution/absorption process of CBD with the prescriptive oral solution formulation. Notably, CBD has a relatively long half-life (Ohlsson et al., 1986; Crockett et al., 2020) and accordingly, drug accumulation is expected after multiple doses. In addition, mechanism-based inhibition of CYP3A4 and CYP2C19 by CBD has been reported (Bansal et al., 2020), which poses a potential of autoinhibition since CBD is also metabolized by these two enzymes (Jiang et al., 2013; Beers et al., 2021). Therefore, a higher CBD exposure may be expected at steady state, which prompted us to assess the scenarios under multiple CBD doses. Consequently, a higher but still mild inhibition of MPH clearance caused by a 7-day treatment of twice daily 10 mg/kg CBD was predicted.
The scenarios of co-administration of MPH and medical/recreational cannabis products are likely. A positive association between childhood ADHD and cannabis use disorder was found (Lee et al., 2011). As more states in the US are expected to legalize recreational use of cannabis, the chance of concomitant consumption of MPH and THC is growing. In addition, utilization of cannabis products for treatment of ADHD symptoms has garnered attention from both the lay public and the research community (Mitchell et al., 2016; Cooper et al., 2017; Mansell et al., 2021). It should be noted that the potency of cannabis has risen dramatically since those earlier studies from which we estimated the physiologically achievable concentrations (i.e., Cmax) of THC (Chandra et al., 2019). Accordingly, the exposure to THC on an individual via cannabis abuse is likely higher presently than what was reported in earlier studies.
Although CBD content is relatively low in conventional preparations of cannabis (Mehmedic et al., 2010), relatively pure formulations can be accessed by either prescribed Epidiolex or by various over-the-counter CBD products derived from industrial hemp. The over-the-counter CBD products are particularly concerning since their use is not regulated by healthcare professionals and marked differences have been observed between the actual and labeled CBD content of these products (Gurley et al., 2020). These factors have added an additional layer of uncertainty surrounding the risk of DDI between MPH and CBD beyond the clinical scenarios with IR-MPH and Epidiolex evaluated in this work. Moreover, CBD exposure is significantly increased when consumed after a meal (Taylor et al., 2018), which makes consideration of food effects necessary in designing future clinical DDI studies.
Our study has several limitations. First, the PBPK models were developed based on population-level data from the published literature. Consequently, certain features of individual data were overlooked. In particular, covariates that can help explain the observed PK variability were not examined. In the evaluation of PBPK models, we have observed individual PE in the range of around ±50% for several datasets and were not able to further investigate the cause of this inter-study variability due to lack of individual-level data and subject demographics. Second, this work only assessed DDI potentials associated with the IR formulation of MPH. A variety of extended-release and modified-release formulations are now more widely prescribed (Cortese et al., 2017; Steingard et al., 2019). As illustrated in Fig. 6, the relative timing of MPH and CBD dosing may influence the magnitude of their interactions. Therefore, the findings in the current work may not be fully extrapolated to scenarios in which one of the modified-release formulations of MPH is used. Third, the potential for additional contribution to DDI by THC or the metabolites of CBD were not evaluated in this study. We previously identified significant inhibition of CES1 by THC but minimal inhibition by two of its major metabolites (Qian et al., 2019b). Moreover, in the CBD PBPK model, the remaining 20% clearance of MPH was considered exempted from inhibition by CBD due to uncertainty surrounding the individual enzymes involved. These assumptions potentially lead to an underprediction of DDI magnitude.
In this study, the estimated Ki,u values of THC and CBD reflect the unbound concentrations after correction for nonspecific binding using the tube adsorption method (Patilea-Vrana and Unadkat, 2019). Employing a different system (recombinant CES1 as enzyme source and oseltamivir as the substrate), we previously reported 11- to 17-fold higher Ki values for THC (0.541 µM) and CBD (0.974 µM) (Qian et al., 2019b). This difference may be partially explained by the non-specific binding, which was not considered in the previous work. The fu,inc (approximately 1.5% for THC and 4.4% for CBD) we calculated from binding assay were in a similar range to the reported plasma protein binding (Garrett and Hunt, 1974; FDA Center for Drug Evaluation and Research, 2018a; Bansal et al., 2022). Furthermore, other methods (e.g., ultracentrifugation) have been employed in similar studies, and differences do exist among the fu,inc values calculated by different methods (Basit et al., 2020; Bansal et al., 2022). Notably, whether consideration of nonspecific binding can translate into a more accurate prediction of DDI needs further confirmation through clinical study.
In conclusion, we determined the reversible inhibition mechanism of THC and CBD on MPH metabolism and estimated the inhibition potency as measured by Ki,u values. The static model suggests mild increase in MPH exposure caused by exposure to either THC from smoking cannabis or by orally administered CBD. PBPK models were developed and used for simulation of various clinical scenarios. The simulation suggests that concomitant administration of MPH and a single oral dose of prescriptive CBD is generally free of DDI concerns even at the highest strength (10 mg/kg) of CBD. However, a mild increase in MPH exposure (AUC by up to 55% and Cmax by up to 45%) caused by inhibition of CES1 by CBD is possible under scenarios where CBD is administered long term and particularly a few hours prior to the MPH dose. A clinical study is warranted to confirm and evaluate the clinical relevance of the findings in this work.
Abbreviations
- ADHD
attention-deficit/hyperactivity disorder
- AUC
area under drug concentration-time curve
- CBD
cannabidiol
- CES1
carboxylesterase 1
- Cmax
maximum concentration
- DDI
drug-drug interaction
- FDA
US Food and Drug Administration
- fm
fraction metabolized by individual enzymes
- fu,inc
unbound fraction in incubation mixture
- HLS9
human liver S9
- IC50,u
unbound inhibitor concentration that achieves 50% inhibition
- IR-MPH
immediate release methylphenidate
- Ki
inhibition constant
- Ki,u
unbound inhibition constant
- Km
the Michaelis-Menten constant
- LC-MS/MS
liquid chromatography-tandem mass spectrometry
- MPH
methylphenidate
- P450
cytochrome P450
- PBPK
physiologically based pharmacokinetics
- PE
prediction error
- PK
pharmacokinetics
- RA
ritalinic acid
- TDI
time-dependent inhibition
- THC
Δ9-tetrahydrocannabinol Vmax, the maximum metabolite formation rate
Authorship Contributions
Participated in research design: Qian, Markowitz.
Conducted experiments: Qian.
Performed data analysis: Qian, Markowitz.
Wrote or contributed to the writing of the manuscript: Qian, Markowitz.
Footnotes
This work was partially supported by the Eunice Kennedy Shriver National Institute of Child Health and Human Development [R01-HD093612].
This manuscript constituted part of Qian Y’s dissertation.
No author has an actual or perceived conflict of interest with the contents of this article.
 This article has supplemental material available at dmd.aspetjournals.org.
References
- Abbas R, Palumbo D, Walters F, Belden H, Berry SA (2016) Single-dose Pharmacokinetic Properties and Relative Bioavailability of a Novel Methylphenidate Extended-release Chewable Tablet Compared With Immediate-release Methylphenidate Chewable Tablet. Clin Ther 38:1151–1157. [DOI] [PubMed] [Google Scholar]
- Adjei A, Teuscher NS, Kupper RJ, Chang WW, Greenhill L, Newcorn JH, Connor DF, Wigal S (2014) Single-dose pharmacokinetics of methylphenidate extended-release multiple layer beads administered as intact capsule or sprinkles versus methylphenidate immediate-release tablets (Ritalin(®)) in healthy adult volunteers. J Child Adolesc Psychopharmacol 24:570–578. [DOI] [PMC free article] [PubMed] [Google Scholar]
- Aresti-Sanz J, Maho W, Pereira RR, Permentier H, El Aidy SpH-dependent spontaneous hydrolysis rather than gut bacterial metabolism reduces levels of the ADHD treatment, Methylphenidate [biRxiv website]. July 2020. Available at: https://www.biorxiv.org/content/10.1101/2020.07.06.189191v1.article-info. Accessed January 27, 2021.
- Azofeifa A, Mattson ME, Grant A (2016) Monitoring Marijuana Use in the United States: Challenges in an Evolving Environment. JAMA 316:1765–1766. [DOI] [PubMed] [Google Scholar]
- Bansal S, Maharao N, Paine MF, Unadkat JD (2020) Predicting the Potential for Cannabinoids to Precipitate Pharmacokinetic Drug Interactions via Reversible Inhibition or Inactivation of Major Cytochromes P450. Drug Metab Dispos 48:1008–1017. [DOI] [PMC free article] [PubMed] [Google Scholar]
- Bansal S, Paine MF, Unadkat JD (2022) Comprehensive predictions of cytochrome P450 (CYP)-mediated in vivo cannabinoid-drug interactions based on reversible and time-dependent CYP inhibition in human liver microsomes. Drug Metab Dispos. [DOI] [PMC free article] [PubMed] [Google Scholar]
- Basit ANeradugomma NKWolford CFan PWMurray BTakahashi RHKhojasteh SCSmith BJHeyward STotah RA, et al. (2020) Characterization of Differential Tissue Abundance of Major Non-CYP Enzymes in Human. Mol Pharm 17:4114–4124. [DOI] [PubMed] [Google Scholar]
- Beers JL, Fu D, Jackson KD (2021) Cytochrome P450-Catalyzed Metabolism of Cannabidiol to the Active Metabolite 7-Hydroxy-Cannabidiol. Drug Metab Dispos 49:882–891. [DOI] [PMC free article] [PubMed] [Google Scholar]
- Bridgeman MB, Abazia DT (2017) Medicinal Cannabis: History, Pharmacology, And Implications for the Acute Care Setting. P&T 42:180–188. [PMC free article] [PubMed] [Google Scholar]
- Caputi TL, Humphreys K (2018) Medical Marijuana Users are More Likely to Use Prescription Drugs Medically and Nonmedically. J Addict Med 12:295–299. [DOI] [PubMed] [Google Scholar]
- Chandra S, Radwan MM, Majumdar CG, Church JC, Freeman TP, ElSohly MA (2019) New trends in cannabis potency in USA and Europe during the last decade (2008-2017). Eur Arch Psychiatry Clin Neurosci 269:5–15. [DOI] [PubMed] [Google Scholar]
- Conners CK (2002) Forty years of methylphenidate treatment in Attention-Deficit/ Hyperactivity Disorder. J Atten Disord 6 (Suppl 1):S17–S30. [DOI] [PubMed] [Google Scholar]
- Cooper RE, Williams E, Seegobin S, Tye C, Kuntsi J, Asherson P (2017) Cannabinoids in attention-deficit/hyperactivity disorder: A randomised-controlled trial. Eur Neuropsychopharmacol 27:795–808. [DOI] [PubMed] [Google Scholar]
- Cortese S, D’Acunto G, Konofal E, Masi G, Vitiello B (2017) New Formulations of Methylphenidate for the Treatment of Attention-Deficit/Hyperactivity Disorder: Pharmacokinetics, Efficacy, and Tolerability. CNS Drugs 31:149–160. [DOI] [PubMed] [Google Scholar]
- Crockett J, Critchley D, Tayo B, Berwaerts J, Morrison G (2020) A phase 1, randomized, pharmacokinetic trial of the effect of different meal compositions, whole milk, and alcohol on cannabidiol exposure and safety in healthy subjects. Epilepsia 61:267–277. [DOI] [PMC free article] [PubMed] [Google Scholar]
- Crow JA, Borazjani A, Potter PM, Ross MK (2007) Hydrolysis of pyrethroids by human and rat tissues: examination of intestinal, liver and serum carboxylesterases. Toxicol Appl Pharmacol 221:1–12. [DOI] [PMC free article] [PubMed] [Google Scholar]
- DeVane CL, Markowitz JS, Carson SW, Boulton DW, Gill HS, Nahas Z, Risch SC (2000) Single-dose pharmacokinetics of methylphenidate in CYP2D6 extensive and poor metabolizers. J Clin Psychopharmacol 20:347–349. [DOI] [PubMed] [Google Scholar]
- Drozdzik M, Busch D, Lapczuk J, Müller J, Ostrowski M, Kurzawski M, Oswald S (2018) Protein Abundance of Clinically Relevant Drug-Metabolizing Enzymes in the Human Liver and Intestine: A Comparative Analysis in Paired Tissue Specimens. Clin Pharmacol Ther 104:515–524. [DOI] [PubMed] [Google Scholar]
- Faraj BA, Israili ZH, Perel JM, Jenkins ML, Holtzman SG, Cucinell SA, Dayton PG (1974) Metabolism and disposition of methylphenidate-14C: studies in man and animals. J Pharmacol Exp Ther 191:535–547. [PubMed] [Google Scholar]
- FDA Center for Drug Evaluation and Research Epidiolex (cannabidiol) clinical pharmacology and biopharmaceutic(s) review, application#210365Orig1s000 [Drugs@FDA website]. June 2018. Available at: https://www.accessdata.fda.gov/drugsatfda_docs/nda/2018/210365Orig1s000ClinPharmR.pdf. Accessed December 16, 2021 .
- FDA Center for Drug Evaluation and Research Epidiolex (cannabidiol) clinical pharmacology and biopharmaceutic(s) review, application#210365Orig1s000 [Drugs@FDA website]. June 2018. Available at: https://www.accessdata.fda.gov/drugsatfda_docs/nda/2018/210365Orig1s000ClinPharmR.pdf. Accessed December 31, 2020.
- FDA Center for Drug Evaluation and Research In Vitro Drug Interaction Studies — Cytochrome P450 Enzyme- and Transporter-Mediated Drug Interactions Guidance for Industry. Available at: https://www.fda.gov/media/134582/download. Accessed December 18, 2021.
- Food and Drug Administration RITALIN® (methylphenidate hydrochloride) Drug Label. Available at: https://www.accessdata.fda.gov/drugsatfda_docs/label/2021/010187s093lbl.pdf. Accessed February 10, 2022.
- Garrett ER, Hunt CA (1974) Physiochemical properties, solubility, and protein binding of delta9-tetrahydrocannabinol. J Pharm Sci 63:1056–1064. [DOI] [PubMed] [Google Scholar]
- Greenblatt DJ, Zhao Y, Venkatakrishnan K, Duan SX, Harmatz JS, Parent SJ, Court MH, von Moltke LL (2011) Mechanism of cytochrome P450-3A inhibition by ketoconazole. J Pharm Pharmacol 63:214–221. [DOI] [PubMed] [Google Scholar]
- Grimm SWEinolf HJHall SDHe KLim HKLing KHLu CNomeir AASeibert ESkordos KW, et al. (2009) The conduct of in vitro studies to address time-dependent inhibition of drug-metabolizing enzymes: a perspective of the pharmaceutical research and manufacturers of America. Drug Metab Dispos 37:1355–1370. [DOI] [PubMed] [Google Scholar]
- Gurley BJ, Murphy TP, Gul W, Walker LA, ElSohly M (2020) Content versus Label Claims in Cannabidiol (CBD)-Containing Products Obtained from Commercial Outlets in the State of Mississippi. J Diet Suppl 17:599–607. [DOI] [PubMed] [Google Scholar]
- He B, Shi J, Wang X, Jiang H, Zhu HJ (2019) Label-free absolute protein quantification with data-independent acquisition. J Proteomics 200:51–59. [DOI] [PMC free article] [PubMed] [Google Scholar]
- Her L, Zhu HJ (2020) Carboxylesterase 1 and Precision Pharmacotherapy: Pharmacogenetics and Nongenetic Regulators. Drug Metab Dispos 48:230–244. [DOI] [PMC free article] [PubMed] [Google Scholar]
- Hergenrather JY, Aviram J, Vysotski Y, Campisi-Pinto S, Lewitus GM, Meiri D (2020) Cannabinoid and Terpenoid Doses are Associated with Adult ADHD Status of Medical Cannabis Patients. Rambam Maimonides Med J 11:1. [DOI] [PMC free article] [PubMed] [Google Scholar]
- Huestis MA, Henningfield JE, Cone EJ (1992) Blood cannabinoids. I. Absorption of THC and formation of 11-OH-THC and THCCOOH during and after smoking marijuana. J Anal Toxicol 16:276–282. [DOI] [PubMed] [Google Scholar]
- Hupli AMM (2018) Medical Cannabis for Adult Attention Deficit Hyperactivity Disorder: Sociological Patient Case Report of Cannabinoid Therapeutics in Finland. Med Cannabis Cannabinoids 1:112–118. [DOI] [PMC free article] [PubMed] [Google Scholar]
- Hysek CM, Simmler LD, Schillinger N, Meyer N, Schmid Y, Donzelli M, Grouzmann E, Liechti ME (2014) Pharmacokinetic and pharmacodynamic effects of methylphenidate and MDMA administered alone or in combination. Int J Neuropsychopharmacol 17:371–381. [DOI] [PubMed] [Google Scholar]
- Imai T, Taketani M, Shii M, Hosokawa M, Chiba K (2006) Substrate specificity of carboxylesterase isozymes and their contribution to hydrolase activity in human liver and small intestine. Drug Metab Dispos 34:1734–1741. [DOI] [PubMed] [Google Scholar]
- Jiang R, Yamaori S, Okamoto Y, Yamamoto I, Watanabe K (2013) Cannabidiol is a potent inhibitor of the catalytic activity of cytochrome P450 2C19. Drug Metab Pharmacokinet 28:332–338. [DOI] [PubMed] [Google Scholar]
- Jiang R, Yamaori S, Takeda S, Yamamoto I, Watanabe K (2011) Identification of cytochrome P450 enzymes responsible for metabolism of cannabidiol by human liver microsomes. Life Sci 89:165–170. [DOI] [PubMed] [Google Scholar]
- Khalil F, Läer S (2014) Physiologically based pharmacokinetic models in the prediction of oral drug exposure over the entire pediatric age range-sotalol as a model drug. AAPS J 16:226–239. [DOI] [PMC free article] [PubMed] [Google Scholar]
- Koehm M, Kauert GF, Toennes SW (2010) Influence of ethanol on the pharmacokinetics of methylphenidate’s metabolites ritalinic acid and ethylphenidate. Arzneimittelforschung 60:238–244. [DOI] [PubMed] [Google Scholar]
- Lee SS, Humphreys KL, Flory K, Liu R, Glass K (2011) Prospective association of childhood attention-deficit/hyperactivity disorder (ADHD) and substance use and abuse/dependence: a meta-analytic review. Clin Psychol Rev 31:328–341. [DOI] [PMC free article] [PubMed] [Google Scholar]
- Lewis JPHorenstein RBRyan KO’Connell JRGibson QMitchell BDTanner KChai SBliden KPTantry US, et al. (2013) The functional G143E variant of carboxylesterase 1 is associated with increased clopidogrel active metabolite levels and greater clopidogrel response. Pharmacogenet Genomics 23:1–8. [DOI] [PMC free article] [PubMed] [Google Scholar]
- Mansell H, Quinn D, Kelly LE, Szafron M, Alcorn J (2021) Pharmacokinetics and Perceptions of Children and Young Adults Using Cannabis for Attention-Deficit/Hyperactivity Disorder and Oppositional Defiant Disorder: Protocol for a Mixed Methods Proof-of-Concept Study. JMIR Res Protoc 10:e31281. [DOI] [PMC free article] [PubMed] [Google Scholar]
- Mehmedic Z, Chandra S, Slade D, Denham H, Foster S, Patel AS, Ross SA, Khan IA, ElSohly MA (2010) Potency trends of Δ9-THC and other cannabinoids in confiscated cannabis preparations from 1993 to 2008. J Forensic Sci 55:1209–1217. [DOI] [PubMed] [Google Scholar]
- Meyer MC, Straughn AB, Jarvi EJ, Patrick KS, Pelsor FR, Williams RL, Patnaik R, Chen ML, Shah VP (2000) Bioequivalence of methylphenidate immediate-release tablets using a replicated study design to characterize intrasubject variability. Pharm Res 17:381–384. [DOI] [PubMed] [Google Scholar]
- Midha KK, McKay G, Rawson MJ, Korchinski ED, Hubbard JW (2001) Effects of food on the pharmacokinetics of methylphenidate. Pharm Res 18:1185–1189. [DOI] [PubMed] [Google Scholar]
- Mitchell JT, Sweitzer MM, Tunno AM, Kollins SH, McClernon FJ (2016) “I Use Weed for My ADHD”: A Qualitative Analysis of Online Forum Discussions on Cannabis Use and ADHD. PLoS One 11:e0156614. [DOI] [PMC free article] [PubMed] [Google Scholar]
- Nelson KM, Bisson J, Singh G, Graham JG, Chen SN, Friesen JB, Dahlin JL, Niemitz M, Walters MA, Pauli GF (2020) The Essential Medicinal Chemistry of Cannabidiol (CBD). J Med Chem 63:12137–12155. [DOI] [PMC free article] [PubMed] [Google Scholar]
- Nissen SE (2006) ADHD drugs and cardiovascular risk. N Engl J Med 354:1445–1448. [DOI] [PubMed] [Google Scholar]
- Ohlsson A, Lindgren JE, Andersson S, Agurell S, Gillespie H, Hollister LE (1986) Single-dose kinetics of deuterium-labelled cannabidiol in man after smoking and intravenous administration. Biomed Environ Mass Spectrom 13:77–83. [DOI] [PubMed] [Google Scholar]
- Parasrampuria DA, Schoedel KA, Schuller R, Gu J, Ciccone P, Silber SA, Sellers EM (2007) Assessment of pharmacokinetics and pharmacodynamic effects related to abuse potential of a unique oral osmotic-controlled extended-release methylphenidate formulation in humans. J Clin Pharmacol 47:1476–1488. [DOI] [PubMed] [Google Scholar]
- Patilea-Vrana GI, Unadkat JD (2019) Quantifying Hepatic Enzyme Kinetics of (-)-Δ9-Tetrahydrocannabinol (THC) and Its Psychoactive Metabolite, 11-OH-THC, through In Vitro Modeling. Drug Metab Dispos 47:743–752. [DOI] [PMC free article] [PubMed] [Google Scholar]
- Patrick KS, Caldwell RW, Ferris RM, Breese GR (1987) Pharmacology of the enantiomers of threo-methylphenidate. J Pharmacol Exp Ther 241:152–158. [PubMed] [Google Scholar]
- Patrick KS, Kilts CD, Breese GR (1981) Synthesis and pharmacology of hydroxylated metabolites of methylphenidate. J Med Chem 24:1237–1240. [DOI] [PubMed] [Google Scholar]
- Patrick KS, Straughn AB, Jarvi EJ, Breese GR, Meyer MC (1989) The absorption of sustained-release methylphenidate formulations compared to an immediate-release formulation. Biopharm Drug Dispos 10:165–171. [DOI] [PubMed] [Google Scholar]
- Patrick KS, Straughn AB, Minhinnett RR, Yeatts SD, Herrin AE, DeVane CL, Malcolm R, Janis GC, Markowitz JS (2007) Influence of ethanol and gender on methylphenidate pharmacokinetics and pharmacodynamics. Clin Pharmacol Ther 81:346–353. [DOI] [PMC free article] [PubMed] [Google Scholar]
- Patrick KS, Straughn AB, Reeves OT 3rd, Bernstein H, Bell GH, Anderson ER, Malcolm RJ (2013) Differential influences of ethanol on early exposure to racemic methylphenidate compared with dexmethylphenidate in humans. Drug Metab Dispos 41:197–205. [DOI] [PMC free article] [PubMed] [Google Scholar]
- Pearce RG, Setzer RW, Davis JL, Wambaugh JF (2017) Evaluation and calibration of high-throughput predictions of chemical distribution to tissues. J Pharmacokinet Pharmacodyn 44:549–565. [DOI] [PMC free article] [PubMed] [Google Scholar]
- Piper BJ, Ogden CL, Simoyan OM, Chung DY, Caggiano JF, Nichols SD, McCall KL (2018) Trends in use of prescription stimulants in the United States and Territories, 2006 to 2016. PLoS One 13:e0206100. [DOI] [PMC free article] [PubMed] [Google Scholar]
- Qian Y, Gurley BJ, Markowitz JS (2019a) The Potential for Pharmacokinetic Interactions Between Cannabis Products and Conventional Medications. J Clin Psychopharmacol 39:462–471. [DOI] [PubMed] [Google Scholar]
- Qian Y, Markowitz JS (2020) Natural Products as Modulators of CES1 Activity. Drug Metab Dispos 48:993–1007. [DOI] [PubMed] [Google Scholar]
- Qian Y, Wang X, Markowitz JS (2019b) In Vitro Inhibition of Carboxylesterase 1 by Major Cannabinoids and Selected Metabolites. Drug Metab Dispos 47:465–472. [DOI] [PubMed] [Google Scholar]
- Redalieu E, Bartlett MF, Waldes LM, Darrow WR, Egger H, Wagner WE (1982) A study of methylphenidate in man with respect to its major metabolite. Drug Metab Dispos 10:708–709. [PubMed] [Google Scholar]
- Rodgers T, Rowland M (2006) Physiologically based pharmacokinetic modelling 2: predicting the tissue distribution of acids, very weak bases, neutrals and zwitterions. J Pharm Sci 95:1238–1257. [DOI] [PubMed] [Google Scholar]
- Rodgers T, Rowland M (2007) Mechanistic approaches to volume of distribution predictions: understanding the processes. Pharm Res 24:918–933. [DOI] [PubMed] [Google Scholar]
- Schmitt W (2008) General approach for the calculation of tissue to plasma partition coefficients. Toxicol In Vitro 22:457–467. [DOI] [PubMed] [Google Scholar]
- Segel IH (1975) Enzyme Kinetics: Behavior and Analysis of Rapid Equilibrium and Steady-State Enzyme Systems, John Wiley & Sons, New York. [Google Scholar]
- Shi J, Xiao J, Wang X, Jung SM, Bleske BE, Markowitz JS, Patrick KS, Zhu HJ (2021) Plasma Carboxylesterase 1 Predicts Methylphenidate Exposure: A Proof-of-Concept Study Using Plasma Protein Biomarker for Hepatic Drug Metabolism. Clin Pharmacol Ther 111:878–885. [DOI] [PMC free article] [PubMed] [Google Scholar]
- Smith T, Majid F, Eckl V, Reynolds CM (2021) Herbal Supplement Sales in US Increase by Record-Breaking 17.3% in 2020. HerbalGram 131:52–65. [Google Scholar]
- Spencer TJ, Biederman J, Ciccone PE, Madras BK, Dougherty DD, Bonab AA, Livni E, Parasrampuria DA, Fischman AJ (2006) PET study examining pharmacokinetics, detection and likeability, and dopamine transporter receptor occupancy of short- and long-acting oral methylphenidate. Am J Psychiatry 163:387–395. [DOI] [PubMed] [Google Scholar]
- Spencer TJ, Biederman J, Martin JM, Moorehead TM, Mirto T, Clarke A, Batchelder H, Faraone SV (2012) Importance of pharmacokinetic profile and timing of coadministration of short- and long-acting formulations of methylphenidate on patterns of subjective responses and abuse potential. Postgrad Med 124:166–173. [DOI] [PubMed] [Google Scholar]
- Srinivas NR, Hubbard JW, Korchinski ED, Midha KK (1993) Enantioselective pharmacokinetics of dl-threo-methylphenidate in humans. Pharm Res 10:14–21. [DOI] [PubMed] [Google Scholar]
- Stage C, Jürgens G, Guski LS, Thomsen R, Bjerre D, Ferrero-Miliani L, Lyauk YK, Rasmussen HB, Dalhoff K, INDICES Consortium (2017) The impact of CES1 genotypes on the pharmacokinetics of methylphenidate in healthy Danish subjects. Br J Clin Pharmacol 83:1506–1514. [DOI] [PMC free article] [PubMed] [Google Scholar]
- Stein MA, Sarampote CS, Waldman ID, Robb AS, Conlon C, Pearl PL, Black DO, Seymour KE, Newcorn JH (2003) A dose-response study of OROS methylphenidate in children with attention-deficit/hyperactivity disorder. Pediatrics 112:e404. [DOI] [PubMed] [Google Scholar]
- Steingard R, Taskiran S, Connor DF, Markowitz JS, Stein MA (2019) New Formulations of Stimulants: An Update for Clinicians. J Child Adolesc Psychopharmacol 29:324–339. [DOI] [PMC free article] [PubMed] [Google Scholar]
- Stott C, White L, Wright S, Wilbraham D, Guy G (2013) A Phase I, open-label, randomized, crossover study in three parallel groups to evaluate the effect of Rifampicin, Ketoconazole, and Omeprazole on the pharmacokinetics of THC/CBD oromucosal spray in healthy volunteers. Springerplus 2:236. [DOI] [PMC free article] [PubMed] [Google Scholar]
- Strohbeck-Kuehner P, Skopp G, Mattern R (2008) Cannabis improves symptoms of ADHD. Cannabinoids 3:1–3. [Google Scholar]
- Sun Z, Murry DJ, Sanghani SP, Davis WI, Kedishvili NY, Zou Q, Hurley TD, Bosron WF (2004) Methylphenidate is stereoselectively hydrolyzed by human carboxylesterase CES1A1. J Pharmacol Exp Ther 310:469–476. [DOI] [PubMed] [Google Scholar]
- Taketani M, Shii M, Ohura K, Ninomiya S, Imai T (2007) Carboxylesterase in the liver and small intestine of experimental animals and human. Life Sci 81:924–932. [DOI] [PubMed] [Google Scholar]
- Tarkiainen EK, Backman JT, Neuvonen M, Neuvonen PJ, Schwab M, Niemi M (2012) Carboxylesterase 1 polymorphism impairs oseltamivir bioactivation in humans. Clin Pharmacol Ther 92:68–71. [DOI] [PubMed] [Google Scholar]
- Tarkiainen EK, Holmberg MT, Tornio A, Neuvonen M, Neuvonen PJ, Backman JT, Niemi M (2015) Carboxylesterase 1 c.428G>A single nucleotide variation increases the antiplatelet effects of clopidogrel by reducing its hydrolysis in humans. Clin Pharmacol Ther 97:650–658. [DOI] [PubMed] [Google Scholar]
- Taylor L, Crockett J, Tayo B, Morrison G (2019) A Phase 1, Open-Label, Parallel-Group, Single-Dose Trial of the Pharmacokinetics and Safety of Cannabidiol (CBD) in Subjects With Mild to Severe Hepatic Impairment. J Clin Pharmacol 59:1110–1119. [DOI] [PMC free article] [PubMed] [Google Scholar]
- Taylor L, Gidal B, Blakey G, Tayo B, Morrison G (2018) A Phase I, Randomized, Double-Blind, Placebo-Controlled, Single Ascending Dose, Multiple Dose, and Food Effect Trial of the Safety, Tolerability and Pharmacokinetics of Highly Purified Cannabidiol in Healthy Subjects. CNS Drugs 32:1053–1067. [DOI] [PMC free article] [PubMed] [Google Scholar]
- Tayo B, Taylor L, Sahebkar F, Morrison G (2020) A Phase I, Open-Label, Parallel-Group, Single-Dose Trial of the Pharmacokinetics, Safety, and Tolerability of Cannabidiol in Subjects with Mild to Severe Renal Impairment. Clin Pharmacokinet 59:747–755. [DOI] [PMC free article] [PubMed] [Google Scholar]
- Teo SK, Scheffler MR, Wu A, Stirling DI, Thomas SD, Stypinski D, Khetani VD (2004) A single-dose, two-way crossover, bioequivalence study of dexmethylphenidate HCl with and without food in healthy subjects. J Clin Pharmacol 44:173–178. [DOI] [PubMed] [Google Scholar]
- Wilens TE, Spencer TJ (2010) Understanding attention-deficit/hyperactivity disorder from childhood to adulthood. Postgrad Med 122:97–109. [DOI] [PMC free article] [PubMed] [Google Scholar]
- Wolraich MLHagan JF JrAllan CChan EDavison DEarls MEvans SWFlinn SKFroehlich TFrost J, et al. ; SUBCOMMITTEE ON CHILDREN AND ADOLESCENTS WITH ATTENTION-DEFICIT/HYPERACTIVE DISORDER (2019) Clinical Practice Guideline for the Diagnosis, Evaluation, and Treatment of Attention-Deficit/Hyperactivity Disorder in Children and Adolescents. Pediatrics 144:4. [DOI] [PMC free article] [PubMed] [Google Scholar]
- Wong YN, King SP, Laughton WB, McCormick GC, Grebow PE (1998) Single-dose pharmacokinetics of modafinil and methylphenidate given alone or in combination in healthy male volunteers. J Clin Pharmacol 38:276–282. [DOI] [PubMed] [Google Scholar]
- Zhu HJPatrick KSStraughn ABReeves OT 3rdBernstein HShi JJohnson HJKnight JMSmith ATMalcolm RJ, et al. (2017) Ethanol Interactions With Dexmethylphenidate and dl-Methylphenidate Spheroidal Oral Drug Absorption Systems in Healthy Volunteers. J Clin Psychopharmacol 37:419–428. [DOI] [PMC free article] [PubMed] [Google Scholar]
- Zhu HJPatrick KSYuan HJWang JSDonovan JLDeVane CLMalcolm RJohnson JAYoungblood GLSweet DH, et al. (2008) Two CES1 gene mutations lead to dysfunctional carboxylesterase 1 activity in man: clinical significance and molecular basis. Am J Hum Genet 82:1241–1248. [DOI] [PMC free article] [PubMed] [Google Scholar]