Abstract
Coronary flow induces hemodynamic alterations in the aortic sinus region. The objectives of this study are to: (1) investigate the differences among sinus hemodynamics and leaflet wall shear stresses engendered by the left versus right versus non-coronary flow and (2) correlate respective wall shear stresses with leaflet calcification in patients. A left heart simulator flow loop with a tunable coronary circuit provided physiological coronary flow waveforms corresponding to the left coronary cusp case (LCC), right coronary cusp case (RCC), and non-coronary cusp case (NCC). High spatio-temporal resolution particle image velocimetry was conducted to quantify leaflet wall shear stress and sinus vorticity fields and to measure aortic leaflet tip kinematics. Thirty-one patients with severe calcific aortic valve disease were segmented from CT data for the calcific volumes in their respective left, right, and non-coronary cusps. Leaflet tip position during systole shows the RCC has a wider leaflet opening compared to LCC and NCC. Velocity and vorticity fields combined with leaflet position data show that sinus vorticity is diminished (peak ~43s−1) in the LCC while RCC and NCC maintain high vorticity (~1200s−1 and ~950s−1 respectively). WSS magnitudes greater than 0.3 Pa show 20% and 81% greater occurrences in the LCC and RCC respectively compared to NCC. Significant differences (X2 (2, n = 31) = 7.31, p = 0.0258) between the calcification levels in each cusp of the patient population. Coronary flow differences between LCC, RCC, and NCC show significant impact on leaflet kinematics and sinus flow hemodynamics. Clinical data correlations of the coronary flow cases indicate the left coronary cusp has a higher likelihood of calcification compared to the right.
SUMMARY
There exists a tangible difference in the sinus hemodynamics between the left, right and non-coronary sinuses during normal physiological conditions. The fluctuating waveform of the left coronary flow leads to lesser occurrences of shear stress greater than 0.3 Pa in the left case compared with the right one. This finding comes in agreement with in-vivo data that show higher likelihoods of calcification in the left coronary cusp compared to the right coronary.
Overall this study highlights the very sensitive nature of coronary flow on sinus hemodynamics and leaflet mechanics. Furthermore, these effects correlate with the development of CAVD providing further evidence of hemodynamics having measurable effects in the progression of calcification. These effects should provide further insights into the onset and progression of CAVD when placed in a living tissue model under these physiological conditions.
INTRODUCTION
Calcific aortic valve disease (CAVD) is the second leading cause of heart failure whose long-term progression leads to stenotic aortic valves that impair the cardiovascular system’s pumping function 1, 4. Current studies in the field have begun to conclude that along with long-term degradation that occur as an individual age, there are local biomechanical factors in the aortic sinus environment playing a significant role in valvular calcification and these factors can majorly be attributed to the hemodynamics. Previous in-vivo assessments have indicated that while the location of aortic valve calcification varies within a typical trileaflet patient, the non-coronary cusp (NCC) is consistently characterized by the most calcification density compared to cusps with coronary ostia 5, 17. The disruption of the hemodynamic environment activates processes that elicit inflammatory response and further exacerbates the progression of CAVD. Previous studies attempted to establish correlations with local hemodynamic conditions particularly related to the complex spatiotemporal nature of fluid wall shear stress dynamics that the aortic side of the leaflets experience 24. Hatoum et al showed the differences in aortic sinus vortex dynamics as a function of different degrees of calcification7. Moore et al have shown that the formation, propagation and directionality of the aortic sinus vortex directly influence the direction of shear stress causing high oscillations within the aortic sinus regions of the ostia, leaflet and sinotubular junction 24, 25.
Coronary flow supplies the main source of oxygen for the cardiac muscle and there are distinct differences in how the heart’s vascular contraction affects the left and right coronary arteries 22. The left coronary’s vasculature runs deeper within the myocardium which constricts the vessel with each heartbeat while the right coronary’s vasculature lies above the myocardium and avoids this constriction allowing for more unperturbed flow 28. The constriction has been shown through echocardiographic measurements to cause the left coronary to briefly reverse flow during systole. In conjunction with the anatomical differences in vessel diameter, vessel length and downstream branching, there should be distinct differences from a fluid dynamic standpoint in how mechanical forces acting respective vessels would affect their respective aortic cusps. In-vitro investigations of the coronary flow impact on the sinus hemodynamics throughout the cardiac cycle have been performed only without accurate physiological modeling of each left and right coronary flows. Thus, to date, there have been no investigations into the coronary sinus hemodynamics that are operating under physiological conditions.
Evidence suggests that wall shear stress on the leaflets regulates stenosis but the extent that coronary flow plays in sinus vortex dynamics has not been fully characterized [2]. Studies have shown that typical shear stresses over the aortic valve fibrosa range from zero during diastole to ~20 dynes/cm2 (~2 Pascals) during systole 7, 9–11, 13, 14, 33. It would be paramount to study the effect the fluid effects have on the sinus and how they are affecting the leaflet.
Thus hemodynamics, including the asymmetrical nature of the coronary flows may lead to variability in the development of CAVD [2,5]. With that in mind, the objective of this study is twofold: (1) quantify the left vs right vs non-coronary sinus flow environment and leaflet dynamics in a controlled in-vitro setup and (2) correlate differences in aortic leaflet wall shear stress (WSS) propagation to provide explanation to clinical observations of patients with calcific aortic valve disease. These objectives should reveal the differences in sinus hemodynamics between the left coronary cusp (LCC) and right coronary cusp (RCC) flows during normal physiological conditions and potentially give further context in the understanding of CAVD propagation and correlations with the sinus flow.
METHODS
Hemodynamic assessment
Figure 1 details the left heart simulator flow loop with the coronary circuit. A 21mm Medtronic Hancock II T505 (Medtronic, Minneapolis, MN,USA) porcine bioprosthetic aortic valve was mounted inside an idealized acrylic aortic sinus chamber based on the schematics of Moore et al and Hatoum et al 14, 25 and was tested under physiological conditions of 60 beats per minute and 120/80mmHg. Average cardiac output of 3.9L/min was calculated and set for this valve size based upon existing relationships between body size area and cardiac output 31. The working fluid used was a 60:40 solution of water and 99% glycerin as a blood viscosity matching analog (density ρ = 1080 kg/m3 and kinematic viscosity ν = 3.88 cSt). Aortic flow rates were measured with a Transonic ultrasonic flow probe (Transonic Inc., Ithaca, NY) upstream to the aortic valve chamber. Aortic pressures were measured just upstream and downstream of the valve using Validyne pressure transducers to ensure physiological conditions. The pulsatile pump utilized in this flow loop is a custom-built pump connected to an air compressor controlled by a LabVIEW program and vacuum line that modulates the compression and expansion respectively. The pump itself is comprised of an air bladder sealed within an acrylic chamber connected inline to the working fluid reservoir.
Figure 1.
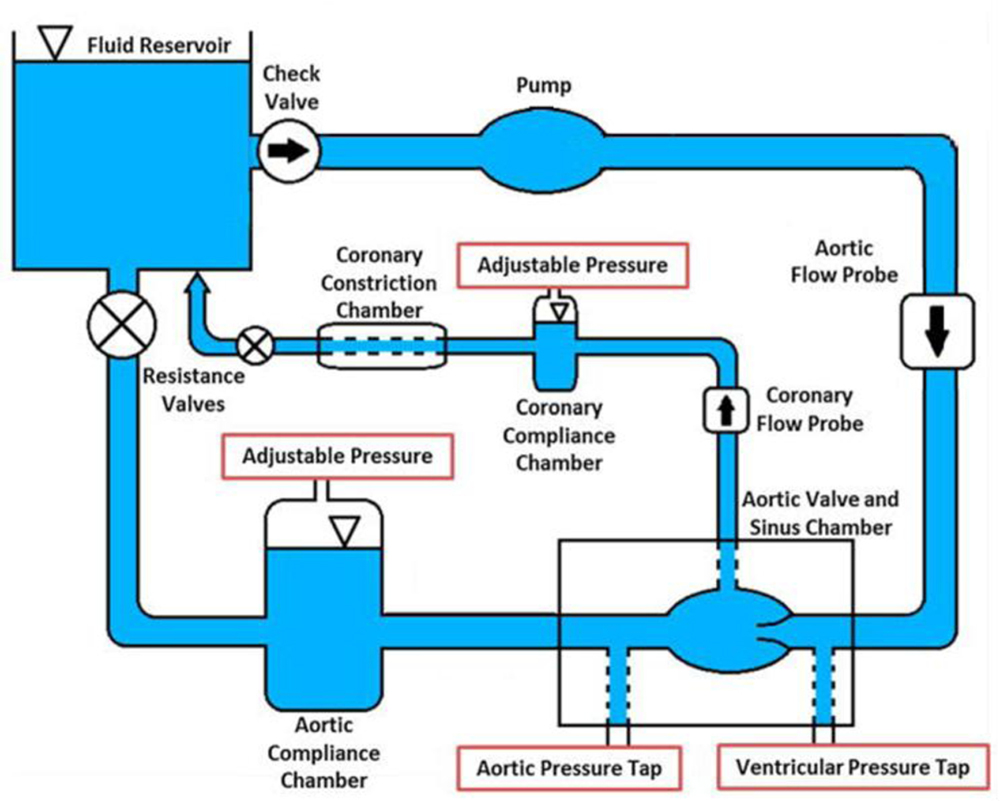
Left heart simulator with coronary circuit.
Coronary Circuit
The coronary circuit was designed to provide physiological coronary flow waveforms throughout the cardiac cycle with the use of a pneumatically controlled Starling resistor. Coronary flow rates were measured using an additional Transonic ultrasonic flow probe downstream of the coronary chamber’s ostium and upstream of the starling resistor. Simulations of left and right coronaries parameters were conducted to match the physiological waveforms of coronary flow through each of the coronary ostia 29. The left coronary case utilized an independent Starling resistor with parameters controlled by an in-house LabVIEW program. The Starling resistor was collapsed or expanded during specific intervals to match physiological changes in coronary flow. The right coronary case did not utilize the starling resistor function to match physiological right coronary flow waveform. Figure 2 presents the marked differences in the flow waveforms for the left and right coronaries during one cardiac cycle. For this study we set the left coronary flow to averaged 155 mL/min with a maximum 239ml/min and minimum of −11mL/min. The right coronary case was set to average 76 mL/min with maximum of 95 mL/min and minimum of 65 mL/min. These values being within the physiological range for a healthy adult 29. One hundred consecutive cardiac cycles of aortic pressure, ventricular pressure, flow rate and coronary flow rate data were recorded at a sampling rate of 100 Hz. In this experiment, it is considered that the load on the cusps during the no-coronary flow represents the load on the no-coronary cusp during a normal flow of a real and healthy subject.
Figure 2.
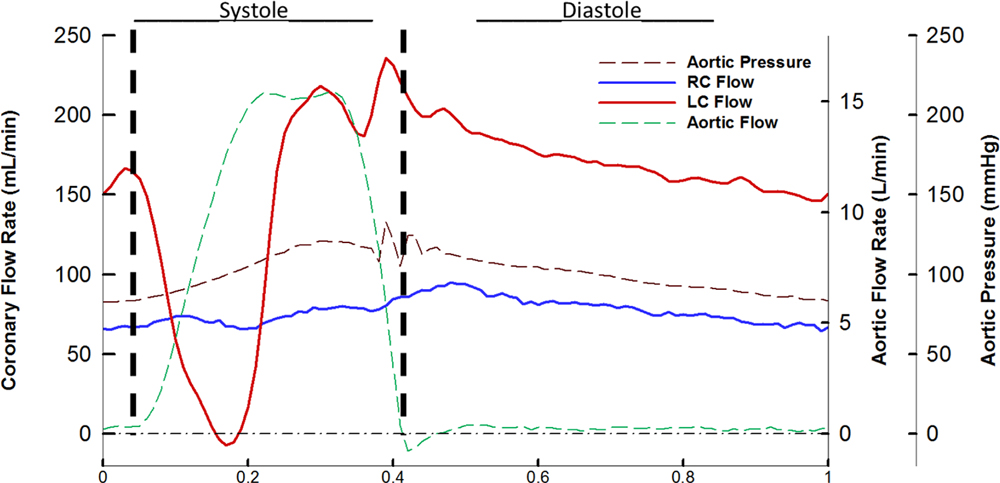
Aortic pressure, right coronary flow, left coronary flow, and aortic flow during one cardiac cycle. RC denotes right coronary and LC left coronary.
Particle Image Velocimetry (PIV)
Flow visualization was performed using two-dimensional high-resolution time-resolved particle image velocimetry (PIV) after seeding the working fluid with fluorescent PMMA-Rhodamine B particles with diameters ranging from 1 to 20 µm. PIV was conducted at a temporal resolution of 3000Hz and a spatial resolution of 70 microns per pixel. Refraction was corrected using a calibration in DaVis particle image velocimetry software (DaVis 7.2, LaVision Germany). Velocity vectors were calculated using adaptive cross-correlation algorithms in a method using 50% overlap multi-pass with two 16x16 interrogation windows. More details on PIV can be found in previous works by Moore et al. and Hatoum et al 7–9, 13, 14. In this study, equations for vorticity, fluid shear stress, and wall shear stress vector exerted by the wall on the fluid are of interest.
Vorticity, ωz, is the curl of the velocity field and therefore captures rotational components of the blood flow shearing. Vx and Vy are the components of velocity in the x and y direction respectively in m/s. Equation 1 shows the applied equation and the units of magnitude are s−1.
| (Equation 1) |
Fluid shear stress, τ, is the gradient of the velocity field. Equation 2 describes the applied equation where μ is a viscosity of 3.5 cP, and Vx and Vy are the components of velocity in the x and y direction respectively in m/s. Resulting units are in pascals (Pa).
| (Equation 2) |
Wall shear stress, τw, was used to calculate the shear stress vector exerted by the wall on the fluid along the leaflet. Measurements were taken at three zones along the leaflet as indicated in Figure 3a. Zone 1 represents the leaflet tip, Zone 2 represents a region along the medial portion of the leaflet, and Zone 3 represents a region more towards the base of the leaflet. In Equation 3, n is the normal vector to those zones, t is the tangent vector to those zones, and (∇V) and (∇V)T represent the velocity gradient and transposed velocity gradient respectively. The resulting units are in Pascals (Pa).
Figure 3:

A) Location of Shear stress measurements along the leaflet, Blue is Zone 1, Green is Zone 2, red is Zone 3. Shear stress is measured in Pascals. B) Measurements done for leaflet tip kinematics.
| (Equation 3) |
Leaflet Tip Kinematics
Leaflet tip kinematics were calculated by manually tracking positions of the tip of the leaflet over systolic lengths of four cardiac cycles every 10 frames. Points were tracked and measured from annulus to leaflet tip (horizontal shift) and sinus radius to leaflet tip (vertical shift) and shown in Figure 3b.
CT Angiograms Segmentation and 3D reconstruction
All study protocols complied with the Institutional Review Boards of The Ohio State University (Columbus, OH, USA), Colorado State University (Fort Collins, CO, USA) and The Wexner Medical Center. Patients referred to the Medical Center of the Rockies and the Wexner Medical Center for multi-slice computed tomography (MSCT) of the chest. Patients ages averaged 79 +/− 8.9 years with 11 Males and 20 females. The study was approved by the Institutional Review Board (IRB) under the title ”Developing Precision Medicine Guidelines for Trans-Catheter Aortic Valve Replacement”. Consent of the patients is part of the IRB protocol and is granted before the time of surgery.
The MSCT examinations were performed with a Philips Brilliance 64 channel CT scanner (Philips Healthcare, Amsterdam, Netherlands). In this data acquisition protocol, the thickness of slices was 0.67 mm, the vertical spacing between the pixels was 0.33 mm and horizontal pixel spacing was 0.748 mm. Constructed images were in DICOM format and grayscale color. The images were recorded in angiogram mode to evaluate coronary arteries. Data set has been studied before TAVR procedure.
The 3D models of the aortic roots were constructed from CT scan images using ITK-SNAP version 3.2 (Yushkevich, Piven et al. 2006). In the 3D models, calcified lesions of RCC, NCC and LCC regions as well as RCA and LCA were segmented using a thresholding technique utilizing the guidelines of McCollough et al21. Patient-specific aortic valve roots were extracted from whole body. The calcium volume in ITK-SNAP were measured in mm3 on each of the RC, NC and LC sinuses and leaflets.
Wall Shear Stress Distributions
Probabilistic evaluations of wall shear stress acting on the leaflet were conducted. Using MATLAB probability density function (PDF) and cumulative distribution function (CDF) were calculated by binning captured wall shear stress from points along each specified region over the cardiac cycle. Specific regions of the leaflet are at the tip, the belly and towards the base of the leaflet as shown in figure 3.
vi is the bin value, ci is the number of elements in the bin, wi is the width of the bin, N is the number of elements in the input data.
| (Equation 4) |
| (Equation 5) |
RESULTS
Sinus Hemodynamic Assessment
Streak videos of the particles are shown in Video 1. Figure 4 shows the coronary sinus velocity vector and vorticity maps across the cardiac cycle with designations for periods throughout. The left coronary case labeled as LCC, right coronary case labeled as RCC, and non-coronary case labeled as NCC.
Figure 4:
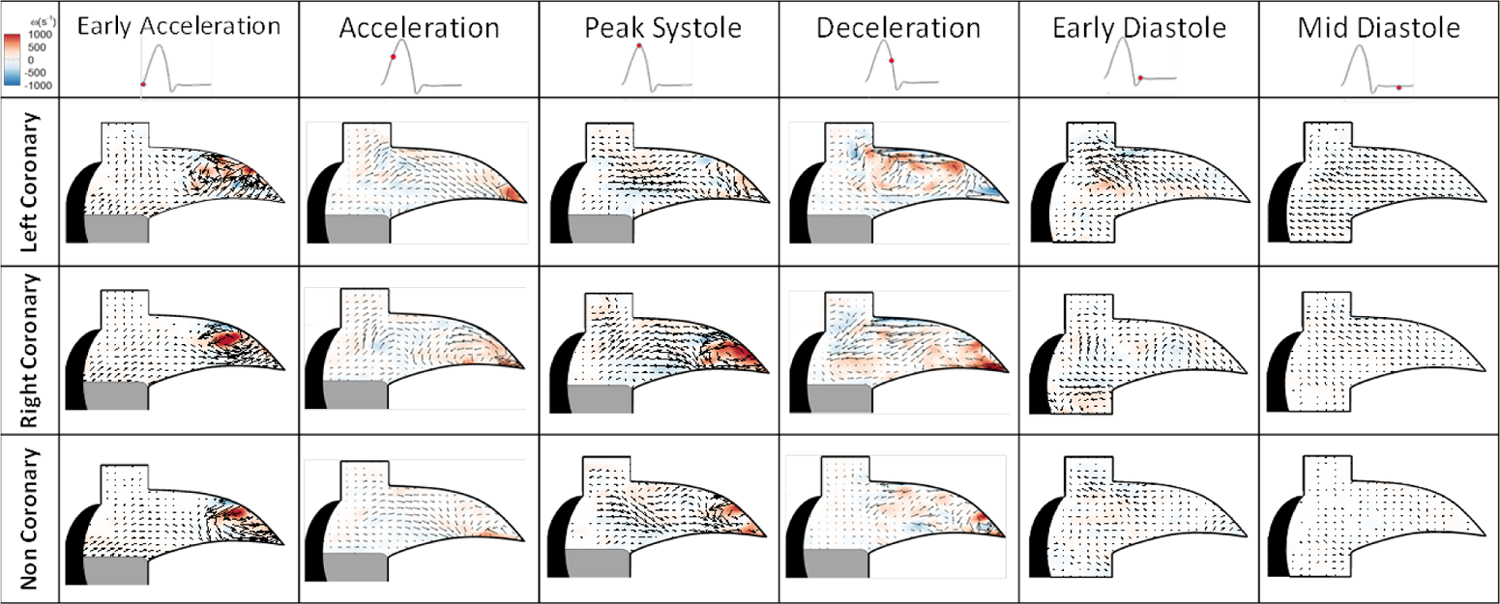
Aortic sinus velocity vectors and vorticity maps within the coronary sinus across cardiac cycle.
Sinus Flow Velocity
During early systole, within the sinus velocities measure 0.052 m/s in the LCC compared to the RCC’s 0.1 m/s and NCC’s 0.038 m/s. During acceleration, LCC velocities peak at 0.219 m/s. Peak systolic sinus velocities for the left coronary case measured 0.38 m/s compared to the right’s 0.9 m/s and the non-coronary 0.744 m/s. During the deceleration phase of systole, the LCC has a peak velocity of 0.3 m/s while the right has ~0.5 m/s. During diastole, LCC flow has double the peak velocity of RCC (0.23 m/s vs 0.12 m/s) as the fluid travels into the coronary ostium from the ascending aorta and nearby sinus regions. NCC velocities are mostly at a standstill during diastole.
Sinus Vorticity
Figure 4 shows the vorticity maps for each of the cases during the cardiac cycle. During early acceleration, the LCC demonstrated vorticity values of ~1200 s−1, RCC ~1325 s−1 and NCC’s ~1300 s−1. During acceleration, LCC magnitude decreases to ~197 s−1 with the RCC and NCC higher vorticity values of ~440 s−1 and 633 s−1 respectively. At peak systole, LCC results in greatly diminished magnitude of 43 s−1 compared to the RCC and NCC’s 1200 s−1 and ~944 s−1. During the diastole, weak pockets of circulation remain with values for the RCC of 226 s−1 near where the leaflet retracted and 168 s−1 in the center of the sinus. The LCC does not exhibit a full stable circulation due to the higher diastolic flow but some rotational aspects from the fluid being siphoned into the ostium have values of 400 s−1. NCC has very little rotational activity with values closer to 50 s−1.
Fluid Shear Stress within the Ostium
Figure 5 shows the fluid shear stress during the cardiac cycle. During early acceleration, the LCC reveals a shear magnitude of 4.3 Pa compared to the RCC’s 3.2 Pa and NCC’s 3.81 pa. At peak systole, the LCC has greatly diminished fluid shear stress magnitude (0.14 Pa) in the center of the sinus compared to the higher values of the RCC’s 3.5 Pa and NCC’s ~1.4 Pa. During diastole, the LCC shear stresses are focused more at the corner of the coronary ostia and sinus radius with values of 1.3 Pa compared to the RCC’s and NCC’s respective ~0.8 and 0.4 Pa in the region where the leaflet retracted.
Figure 5:
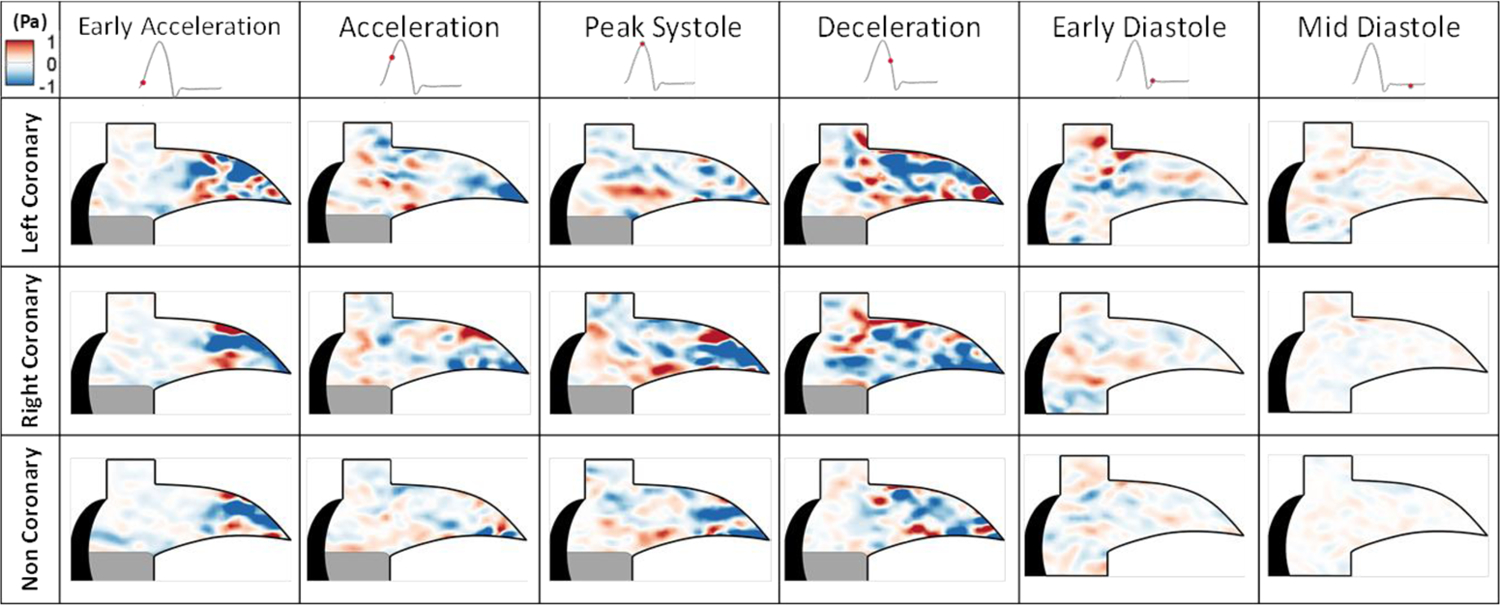
Fluid shear stress across the cardiac cycle.
Leaflet Tip Kinematics
Figure 6 shows the results of the leaflet tip kinematics tracking during systole as guided by Figure 3b. For most of the systolic duration, the resulting vertical shift for the RCC sits about ~6mm from the sinus radius compared to the LCC and NCC’s ~6.3mm. The horizontal shift places RCC closer to the annulus at ~12mm distance while the LCC and NCC are ~12.3mm away from the annulus.
Figure 6:
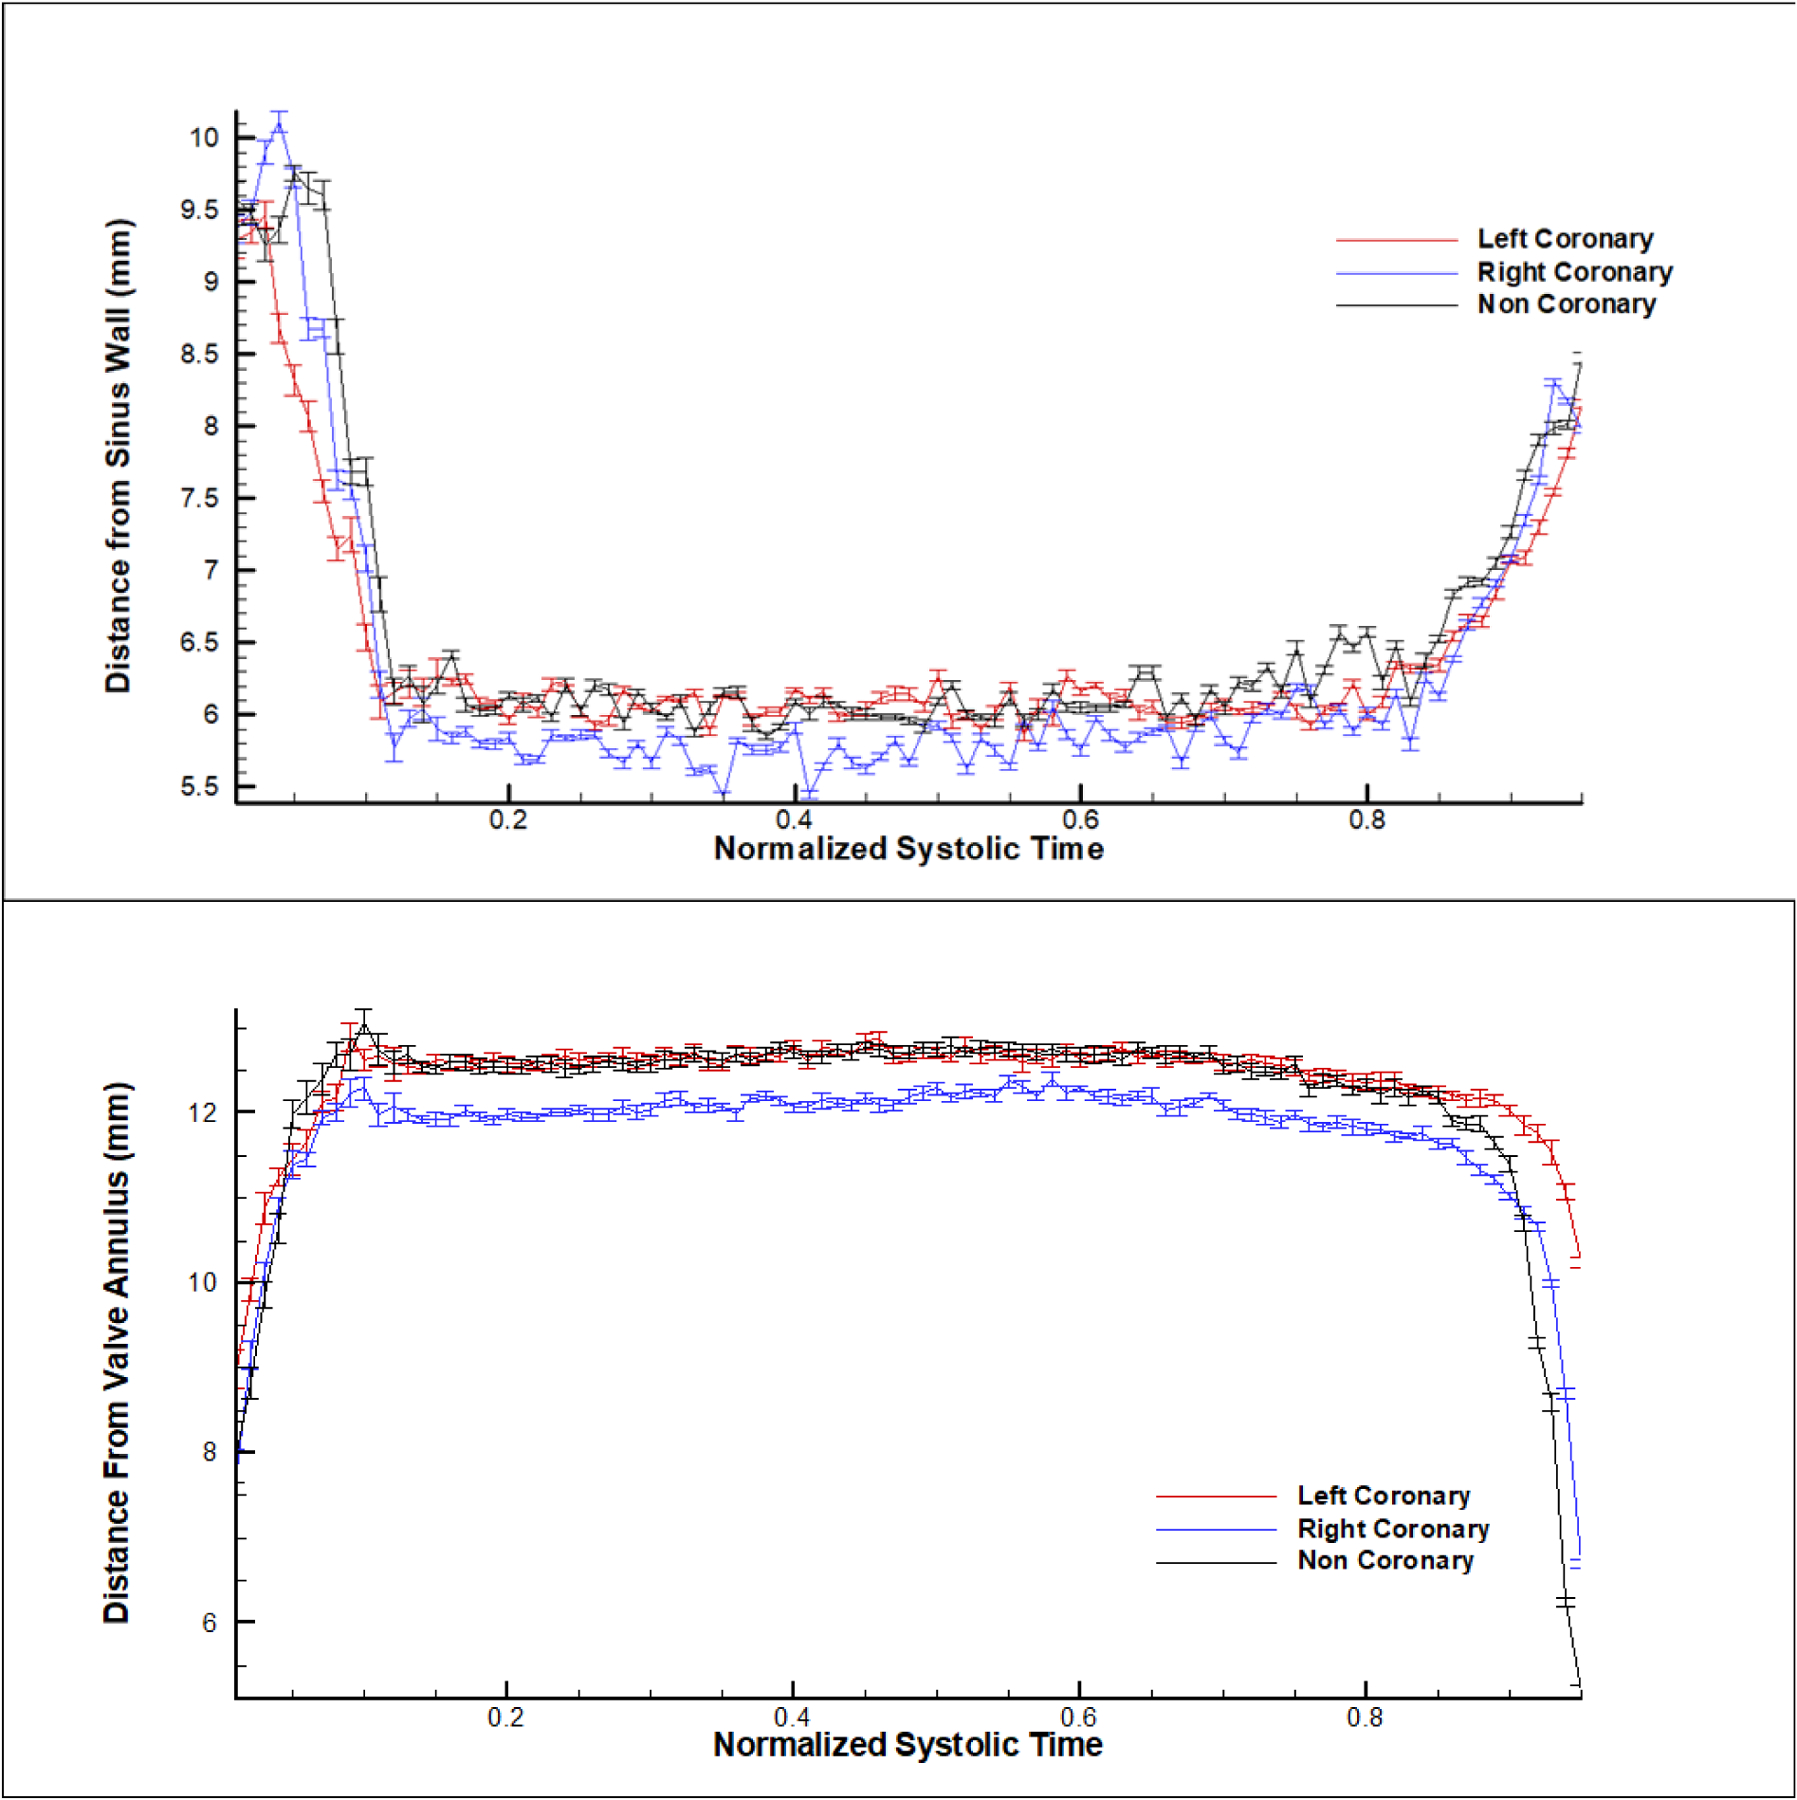
Leaflet tip distance from the (b) sinus wall and (b) from the valve annulus.
Leaflet Wall Shear Stress and Probability Distributions
Figure 7 details the probability density function of varying wall shear stresses in three zones occurring along the leaflet as indicated by Figure 2b. Maximal wall shear stress magnitudes in Zone 1, at the tip of the leaflet, were 0.546 Pa, 0.8913 Pa, and 0.5136 Pa for the LCC, RCC and NCC cases respectively. Zone 2, in the middle of the leaflet, had 0.4916 Pa, 0.5358 Pa, and 0.4508 Pa, for the LCC, RCC and NCC cases respectively. Zone 3, towards the base of the leaflet, had 0.6241 Pa, 0.6177 Pa and 0.5982 Pa for the LCC, RCC and NCC cases respectively. The left case trends with lower probabilities of higher shear stress (> 0.2 Pa) in all regions compared to the right coronary. An analysis of variance test was conducted to show that the effect of leaflet case (LCC, NCC and RCC) on the measured shear stress points at specific leaflet zone (tip, middle, base) was significant. At each zone, there was found to be significance in the variance of the measurements. For the tip: F (2,19221) = 82.34, p = .0001. For the middle: F (2,19221) = 156.36, p = .0001. For the base: F (2,24027) = 68.74, p = .0001
Figure 7:
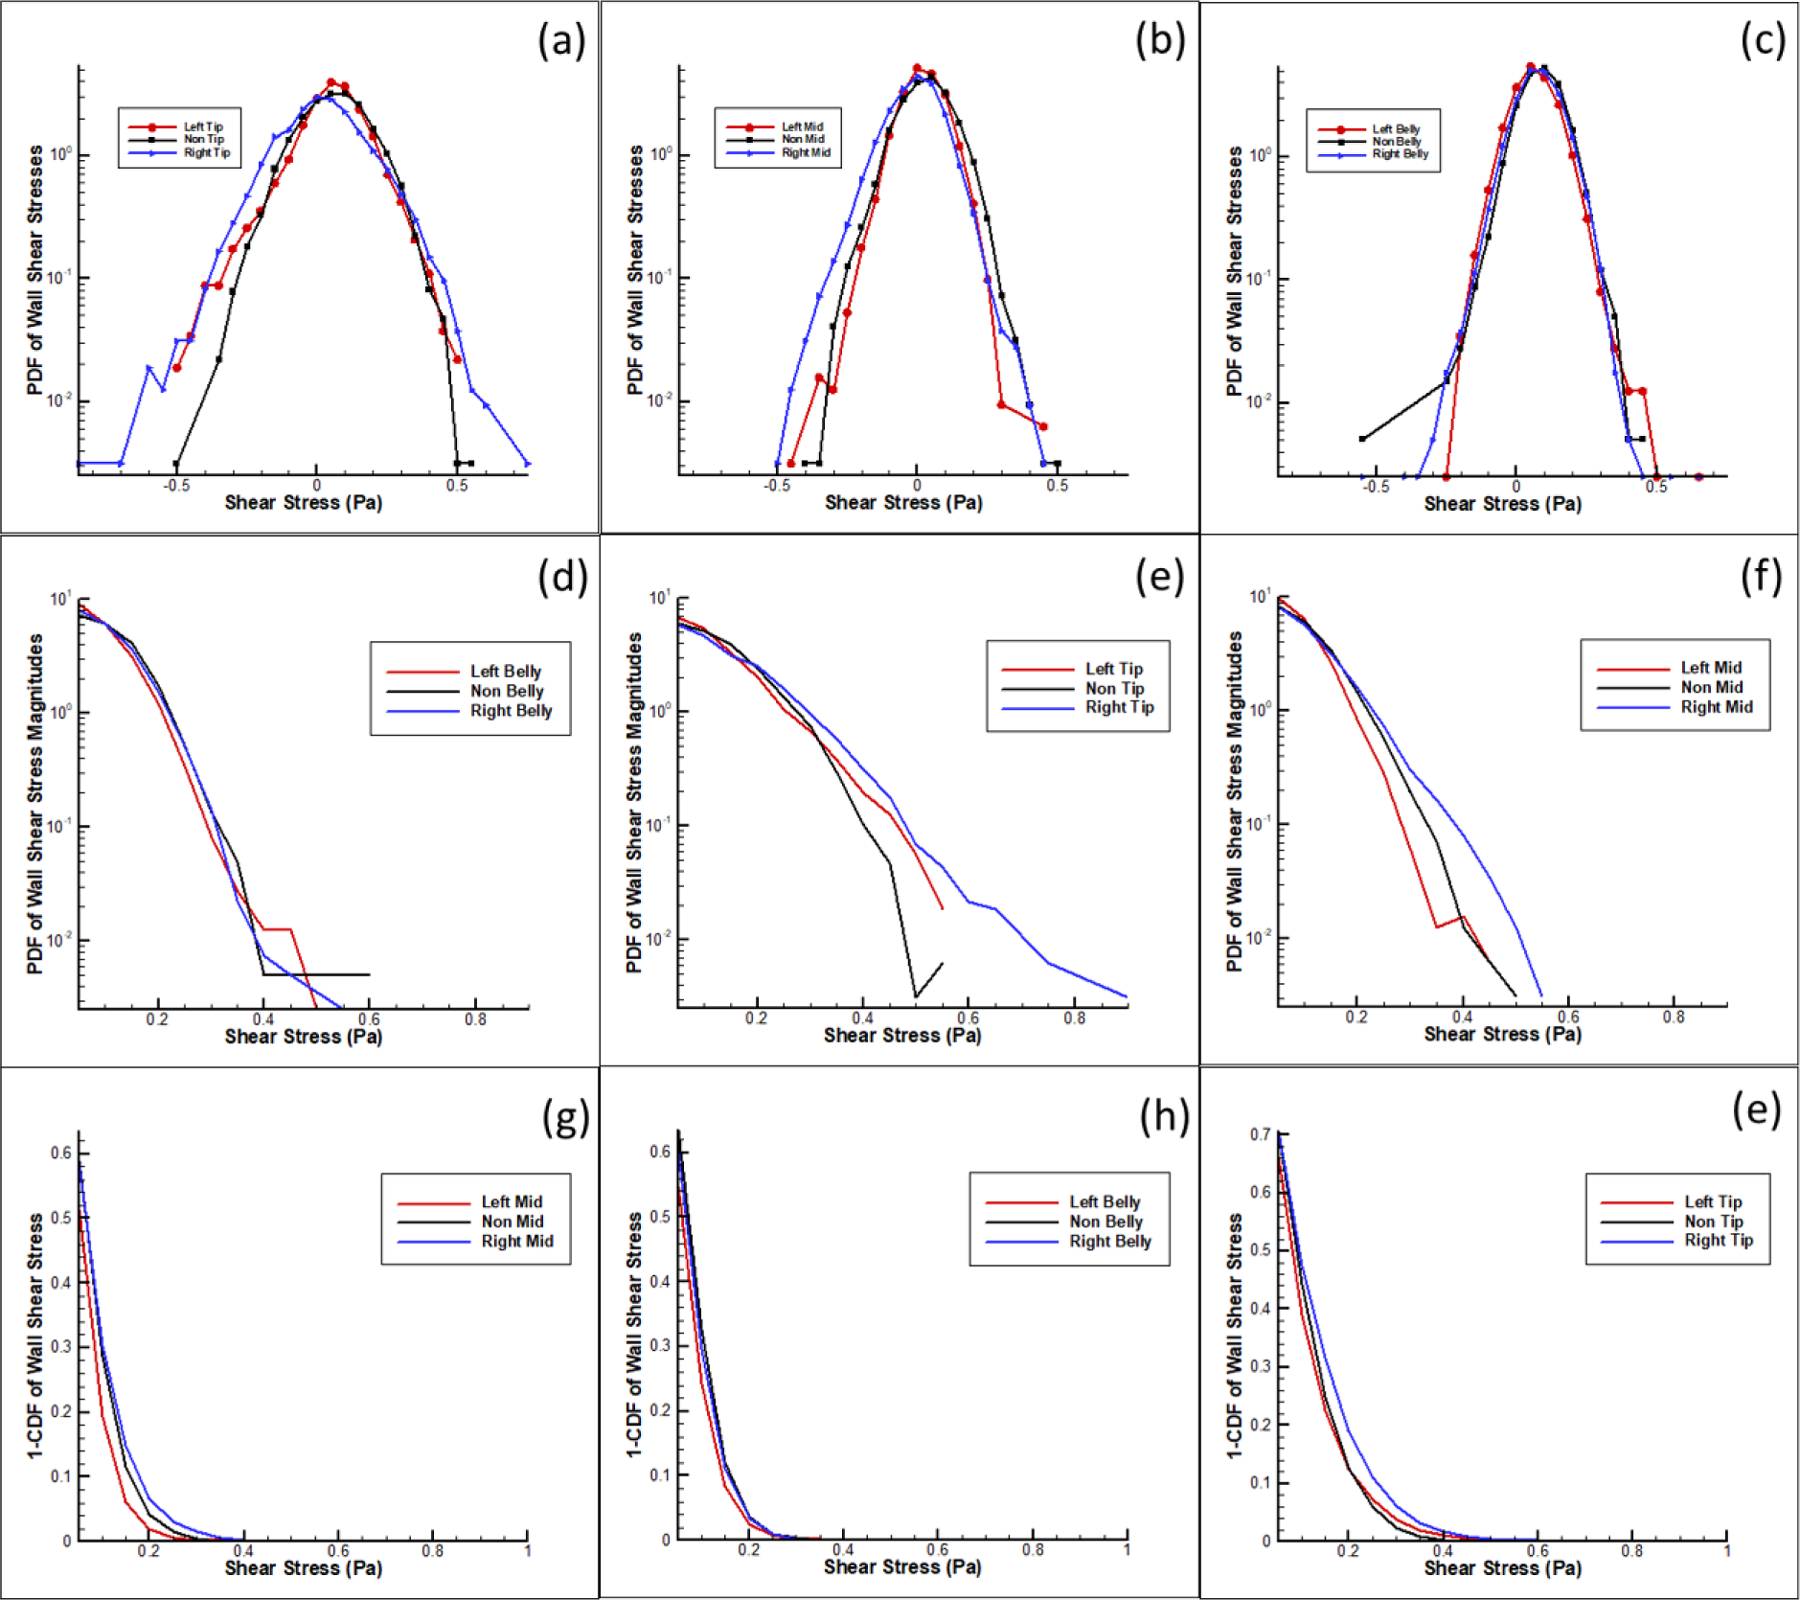
Probabilistic density functions of shear stress along the leaflet at three zones in the left, right and non-coronary cases. A-C) Probability density function of shear stress in log scale. D-F) Probability density function of shear stress magnitudes in log scale. G-I) Probability Curves from cumulative distribution function of shear stress magnitudes greater than 0.3 Pascals.
CT Reconstructions of Patient Calcification Volume
Figure 8 summarizes the results of CT scans 31 patients’ aortic valves segmented and reconstructed to measure the volume of their calcification patterns. Calcification averages of 122.41, 172.61 and 232.36 mm3 for the right coronary, left coronary and non-coronary cusps respectively (Left 95% Confidence Interval = 98.24, 246.98; Right 95% CI = 73.44, 171.38; Non-Coronary 95% CI = 165.60, 299.11). Statistical analysis using a Student’s t-test for the means, paired RCC and NCC were found significantly different (p = 0.0153). LCC is not significantly different paired with either the RCC or NCC (p = 0.1827, 0.2622). Further analysis using a nonparametric Wilcoxon/Kruskal-Wallis test of the medians of the patient population cusp calcification found significant differences (X2 (2, n = 31) = 7.31, p = 0.0258) between the calcification levels in each cusp of the patient population. In Figure 9, occurrences of shear stress magnitudes greater than 0.3 Pa show 20% and 81% greater occurrences in the left coronary and right coronary respectively when compared to the non-coronary.
Figure 8:
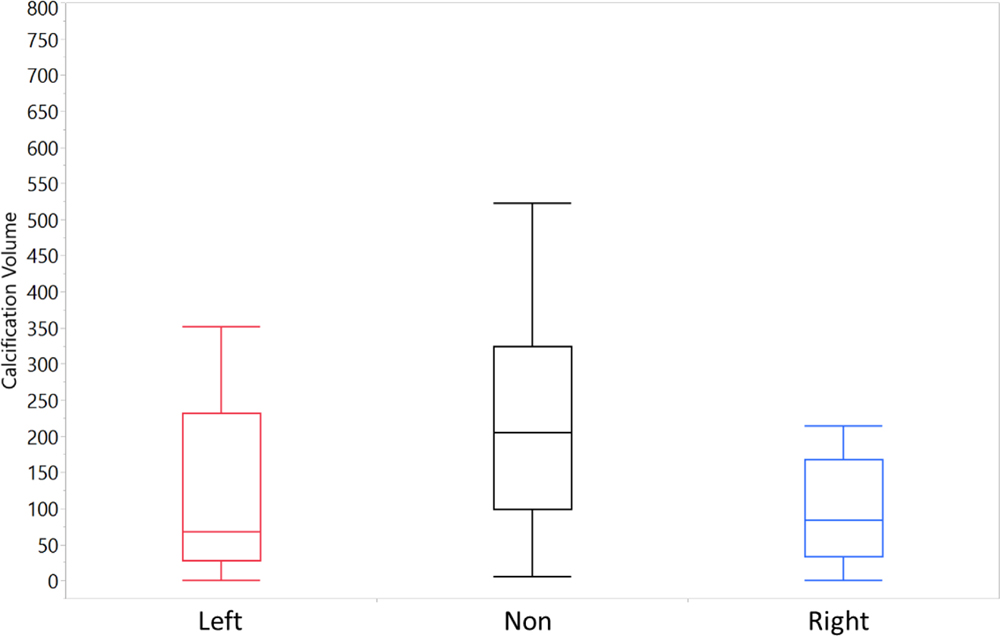
Average calcium volumes of reconstructed CT scans of patient aortic valves (n=31).
Figure 9:
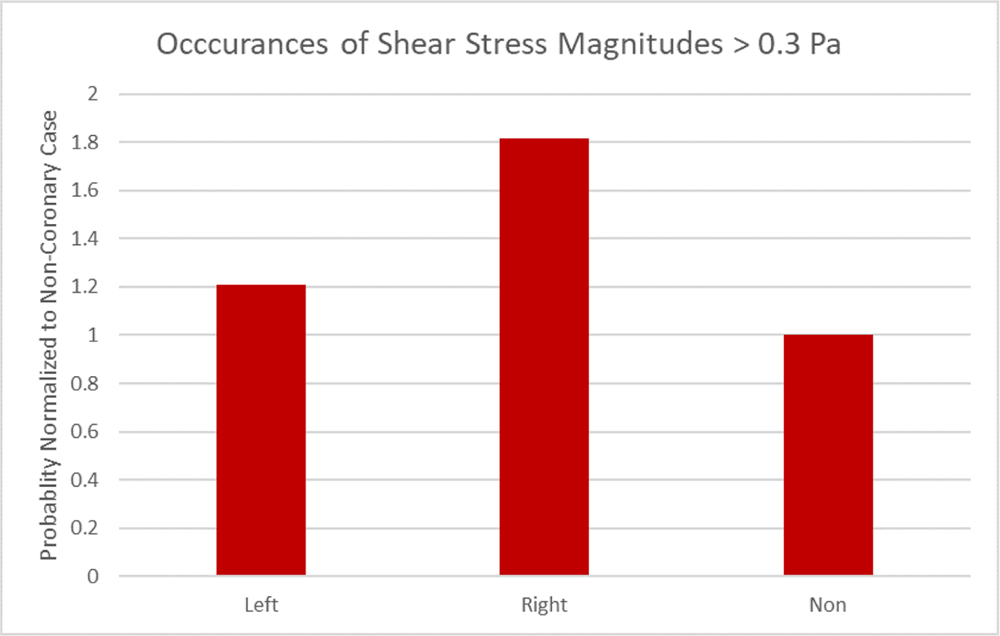
Occurrences of shear stress greater than 0.3 Pa normalized to the non-coronary probability.
DISCUSSION
Differences in coronary flow and anatomy lead to substantially different hemodynamic effects
This study aimed at characterizing the fine scale differences in the effect of coronary flow using a physiological correct flow methodology. Previous studies have indicated flow patterns differences with and without a coronary flow but lacked a true distinction between the left and right coronary flow waveforms and the resulting subtle hemodynamic effects at play within the sinus when emulating the physiological coronary flow conditions 24, 25, 28. The presence and importance of the sinus vortex has been a long-standing focus of aortic hemodynamics and this study demonstrates that different coronary flows lead to different sinus hemodynamics 12, 14, 24, 25, 27. When comparing the coronary sinuses, the influence of coronary flow has been demonstrated to have a great influence on the sinus hemodynamics. During systole, the left coronary flow develops a fluid shear environment encompassing a larger area of the sinus closer to the ostium while the right coronary concentrates fluid shear stresses closer to the sinotubular junction. When examining the sinus activity, peak velocities provide insight into the strength of the vorticity and fluid shear stress. During the acceleration phase of systole, as the aortic valve opens, and the downstream jet takes shape, the left coronary begins a fall in flowrate. The multi-phasic characteristic of the left coronary waveform has as a deceleration as left coronary flow begins during systole. Because of the change in the directionality, the sinus vortex is disrupted during peak systole leading to a brief period of stagnant flow. As the aortic pressure rise in systole, greater constriction of the coronary vessel occurs pushing fluid back into the ostium during peak systole as shown in the vectors of Figure 4. In turn, this leads to more diffuse systolic rotational activity in the LCC sinus compared to the more concentrated vortices of the RCC and NCC sinuses. The reduced flow observed in the right coronary sinus is due to the lack of contractile forces compressing the vessel throughout and steadily follows the aortic pressure. Thus, fluid is always in transport through the ostia, allowing for vorticity patterns that showcase stable sinus hemodynamics previously explored by Moore et al24.
During the diastole, in all cases weak pockets of circulation remain that diminish as the diastolic flow increases, with values for the RCC near where the leaflet retracted in the center of the sinus remaining in circulation. The LCC does not exhibit a full stable circulation due to the higher diastolic flow but retains some rotational aspects as the fluid being siphoned into the ostium have values of 400 s−1. NCC has very little rotational activity with values closer to 0. The lack of ostium in the non-coronary case does not allow fluid to be siphoned into the coronary thus there is not a high degree of sinus vortex disruptions. Without an outlet, particles circle the entirety of the sinus going around the curvature to the belly of the leaflet instead of washing out. For this reason, the non-coronary has vorticity patterns that resemble the left coronary during systole. During diastole, initially the NCC behaves akin to the right coronary case in but ultimately rapidly reduces fluid motion to a static state for the duration of diastole. Without an ostium pulling in fluid, there is no fluid outlet resulting in a large but slowly rotating activity.
It is conjectured that the non-coronary cusp is mostly likely the first to calcify and this could be due in part to the lack of relieving flow from a coronary ostium as well as the underlying anatomy. Within a healthy tricuspid valve, asymmetry is both anatomical and functional. The non-coronary cusp can range from 14–28 mm in height compared to the left and right coronary cusps variation from 12–25 mm 30. If each cusp were given an equal width, the non-coronary cusp should be the largest in volume allowing for more fluid interaction in the space. To further build the distinction between the coronary anatomies, left coronary ostium is larger between 3–5 mm in diameter compared to the right’s 2–3 mm 15. This would result in larger potential flow simply from the larger orifice area. Tying the anatomical and functional features of each artery together, the physiological forces acting on the left and right coronary arteries also pulse the vessels in distinctly different manners which would lead to diverging effects in sinus flow patterns 16. Coronary echocardiograms have shown the difference in the waveforms of the two arteries with peaks occurring in diastole for both but a multi-phasic shape for the left coronary during systole to the point of complete non-pathological reversal of flow 18. As mentioned earlier, during the isovolumetric contraction, the heart muscle generates a greater force on the left ventricle pumping the blood out of the ventricles and inducing a constriction on the coronary vasculature most prominently the left coronary.
The aim was to emulate that specific physical action of heart using the starling resistor to simulate the effects of the isovolumetric contraction. The resulting effects from the differences in coronary flow also affects the leaflet positioning as shown in Figure 6. Leaflet kinematics demonstrated a lower leaflet tip position in the left and non-coronary sinuses compared to the right coronary sinus. In the non-coronary case, there is no outlet to provide for relief in pressure, so it maintains a higher pressure compared to those with an ostium pushing the leaflet downward. In the left coronary, due to the contractile forces on the vessel, as the flow decelerates towards zero the pressure within the sinus increases to levels akin to the non-coronary, producing a similar slight downward shift in the leaflet tip position. Conversely, the right coronary mirrors the aortic pressure without the contractile forces upon it allowing for greater pressure relief and wider valve opening. The leaflet kinematics results show how the right coronary’s relatively constant flow can better open the leaflet during systole in contrast to left coronary case where the coronary flow is slowing down due to the higher pressure at the ostia relative to the leaflet. A slight shift in leaflet vertical position changes the re-attachment point of the jet which explains why there is more vorticity in the right coronary sinus case. The left coronary flow’s more chaotic nature exerts pressure onto the leaflet pushing the jet downward and diminishes the effects of vorticity. The coronaries’ effect within the sinus and on the leaflets showcases how the left and right cases distinctly impact overall sinus hemodynamics.
Implications with CAVD
A prevalent question with CAVD is whether the progression of the disease can be predicted through the study of hemodynamics. To provide perspective, in contrast to vascular endothelium, which assembles parallel to the direction of flow, valvular endothelium aligns perpendicular to flow due to the dynamics of valvular opening and closing. This dynamic dictates aortic valve tissue morphology in order to best condition the cellular biomechanical environment 23. The deposition of lipids, macrophages and other inflammatory agents typically occurs on the aortic side of the leaflets and along with altered mechanical forces, has been shown to induce pathways that lead pro-calcific states in valve interstitial cells (VICs) 20, 23. Previous studies have shown that abnormal alterations in the hemodynamics impact the biomechanical environment through pathological levels of shear stress 32. This causes the cells lining the endothelium of the leaflet tissue to exhibit endothelial dysfunction. Endothelial dysfunction leads to a pro-inflammatory state allowing for enhanced permeability of macrophages and/or apoptosis. This results in gaps in the endothelium and upregulation of the expression of aortic valve leaflet endothelial adhesion molecules in a TGF-β1 (transforming growth factor) and BMP-4 (bone-morphogenic protein) dependent manner 6, 32.
For these reasons, there have been issues with predicting the progression of the disease. However, a consistent finding was that the non-coronary cusp is either the first to have sclerotic/stenotic activity or has the most calcification 17, 26. This falls in line with the results. The patient data has corroborated the conjecture that non-coronary is most susceptible with the non-coronary cusps having up to 90% more calcium volume on average compared to the left and right coronary cusps. This experiment further reiterated that conjecture showing the non-coronary case developing the lowest overall shear stress over the course of the cardiac cycle along with having the most calcification within the patient population. Changes in oscillatory shear stress and low shear stress are implicated in the initiation of the inflammatory factors on the aortic surface 2, 19, 32. Because the cells of the non-coronary are so conditioned to their relatively low shear stress, when greater there is a more opportunistically chance that the biomechanical response the VICs will be activated and stiffen their adjacent ECM to deflect the stress that is being applied to them.
The results show that in an idealized model with a healthy bioprostethic valve, there remain differences in the probabilities of shear stress and this is due to the influence of the developed differences in coronary flow. Wall shear stress is greater at the tip of the leaflet compared to the middle or belly of the leaflet. Previous studies have conjectured that the calcification patterns spread in two ways: 1) emanating at the cusp attachment area and spreading radially inward toward the center of the leaflet and 2) a straight line across the center of the leaflet 2. Since abnormal wall shear stress has been shown to be a favorable condition for the progression of CAVD, it can be presumed that over a lifetime at these parameters, there would be a more prevalent occurrence of the pro-stenotic activity in non-coronary compared to the left and right coronaries. The patient data has corroborated that conjecture with the non-coronary cusps having up to 90% more calcium volume on average compared to the left and right coronary cusps.
There is no specific threshold for pathological shear stress leading to initiation of pro-calcific/pro-inflammatory valvular state. The aortic valve can withstand normal shear stresses up to 800 dynes/cm2 (80 Pascals) on the ventricularis. With such a large variance, the focus was to compare at typical shear stress on the fibrosa of the leaflet of between 10–20 dynes/cm2 (1–2 Pascals) 2, 32, 33. All the results are below or within this range at the highest end of the wall shear stress. It must be reiterated that this is an idealized study in which the effects of years of biological phenomena are not present. Progressive alterations to the shear stress environment, resulting in disturbed, low flow shear stress can be deleterious to the valvular environment through the inducement of changes in cellular gene expression, function, and viability 3, 6.
The leaflet wall shear stress data shown strongly correlated with patient calcification data. Within the patient population, the right coronary case had lowest average calcification volume amongst the patient population as well as the highest probability for shear stresses greater than 0.3 Pascals. Statistical analysis shows that there is significance in the difference of the calcification volumes between the LCC, RCC, and NCC patient populations. An interesting finding is that when comparing means pairwise, RCC and NCC were found to be significantly different (p-value = 0.0153) but the LCC is not significantly different when paired with either the RCC or NCC (p-value = 0.1827 and 0.2622). This correlates well with the fluid dynamic findings of this study showing that the LCC has flow characteristics exhibiting aspects of both the RCC (having an ostium for additional outflow) and the NCC (period of zero flow causes an increase in pressure buildup), providing an explanation for the asymmetric calcific accumulation.
A potential explanation for this phenomenon is that the differences in sinus environments between the cusps, over the course of a lifetime, begin to have a more pronounced impacts as stressor thresholds on the cells are reached. If one considers the average wall shear stress acting on the leaflet as the baseline for healthy function, then there exists the probability within a given region that the cells could experience a short burst of abnormal forces. This could trigger a localized or acute biomechanical response by the cells which may be the trigger leading to sclerotic activity and ultimately stenosis. Looking at results of the coronary flow rate must have subtle effect on the biomechanical environment of the sinus and thus have some correlation on the initiation of the calcification. Unexplored differences could also be in part due to the asymmetry of cusps. Further in vitro studies using a bioreactor with live tissue valves at these coronary conditions should provide further information about the stress threshold for endothelial dysfunction and the initiation of remodeling/signaling pathways towards more pro-osteogenic states.
LIMITATIONS
Though we elucidated the role that coronary flow has on leaflet mechanics, each coronary cusp was simulated individually rather than simultaneously as would occur in the real physiological state in the presence of a surgical bioprosthetic valve. We also note that only one coronary being simulated at a time doesn’t allow us to look at possible asymmetries in valve opening dynamics. Additionally, we did not investigate higher HR or high blood pressure states. We look to implement the use of simultaneous coronary measurement in future studies under various physiological conditions. The use of 2D PIV techniques does not allow for viewing of the whole volume mechanics occurring in the sinus. As such only differences in flow patterning and leaflet mechanics along the midline of the leaflet are being captured. Though this may not be sufficient to comprehensively assess the overall leaflet motion and the 3D structures in the sinus, it serves as a good comparative approach between the 3 different coronary and non-coronary cases. Off-planar axis effects still contribute but are not captured. Additionally, the use of an idealized acrylic geometry for the aortic root that doesn’t consider patient specific anatomy and their specific flow profiles or the contribution by the myocardial wall that would occur in the real physiology. These are studies that will be conducted in the future as more data is gathered and consented.
Supplementary Material
Video 1: Streak plots of the 3 different coronary conditions throughout the cardiac cycle.
ACKNOWLEDGEMENTS
This research was supported by the National Institutes of Health under Award Number 3R01HL118924 and 5R01HL119824 and by the American Heart Association under Award Number 19POST34380804.
Funding:
The research done was partly supported by National Institutes of Health (NIH) under Award Number 3R01HL119824 and 5R01HL119824 and by the American Heart Association under award number 19POST34380804.
Footnotes
Publisher's Disclaimer: This Author Accepted Manuscript is a PDF file of an unedited peer-reviewed manuscript that has been accepted for publication but has not been copyedited or corrected. The official version of record that is published in the journal is kept up to date and so may therefore differ from this version.
Conflict of Interest: Dr. Dasi reports having a patent application filed on novel polymeric valves. No other conflicts were reported.
REFERENCES
- 1.Bonow Robert O., and Greenland Philip, ‘Population-Wide Trends in Aortic Stenosis Incidence and Outcomes’, Circulation, 131 (2015), 969–71. [DOI] [PubMed] [Google Scholar]
- 2.Butcher Jonathan, Simmons Craig A, and James Warnock, Review: Mechanobiology of the Aortic Heart Valve. Vol. 17 (2008), pp. 62–73. [PubMed] [Google Scholar]
- 3.Chiu Jeng-Jiann, and Chien Shu, ‘Effects of Disturbed Flow on Vascular Endothelium: Pathophysiological Basis and Clinical Perspectives’, Physiological reviews, 91 (2011), 10.1152/physrev.00047.2009. [DOI] [PMC free article] [PubMed] [Google Scholar]
- 4.Foroutan Farid, Guyatt Gordon H, O’Brien Kathleen, Bain Eva, Stein Madeleine, Bhagra Sai, Sit Daegan, Kamran Rakhshan, Chang Yaping, Devji Tahira, Mir Hassan, Manja Veena, Schofield Toni, Siemieniuk Reed A, Agoritsas Thomas, Bagur Rodrigo, Otto Catherine M, and Vandvik Per O, ‘Prognosis after Surgical Replacement with a Bioprosthetic Aortic Valve in Patients with Severe Symptomatic Aortic Stenosis: Systematic Review of Observational Studies’, BMJ, 354 (2016). [DOI] [PMC free article] [PubMed] [Google Scholar]
- 5.Freeman Rosario V., and Otto Catherine M., ‘Spectrum of Calcific Aortic Valve Disease’, Pathogenesis, Disease Progression, and Treatment Strategies, 111 (2005), 3316–26. [DOI] [PubMed] [Google Scholar]
- 6.Gould Sarah T., Srigunapalan Suthan, Simmons Craig A., and Anseth Kristi S., ‘Hemodynamic and Cellular Response Feedback in Calcific Aortic Valve Disease’, Circulation Research, 113 (2013), 186–97. [DOI] [PubMed] [Google Scholar]
- 7.Hatoum Hoda, and Prasad Lakshmi %J Annals of biomedical engineering Dasi, ‘Spatiotemporal Complexity of the Aortic Sinus Vortex as a Function of Leaflet Calcification’, 47 (2019), 1116–28. [DOI] [PMC free article] [PubMed] [Google Scholar]
- 8.Hatoum Hoda, Dollery Jennifer, Lilly Scott M, Crestanello Juan A, and Prasad Dasi Lakshmi, ‘Effect of Severe Bioprosthetic Valve Tissue Ingrowth and Inflow Calcification on Valve-in-Valve Performance’, Journal of biomechanics (2018). [DOI] [PMC free article] [PubMed] [Google Scholar]
- 9.Hatoum Hoda, Dollery Jennifer, Lilly Scott M, Crestanello Juan A, and Prasad Dasi Lakshmi, ‘Implantation Depth and Rotational Orientation Effect on Valve-in-Valve Hemodynamics and Sinus Flow’, The Annals of thoracic surgery (2018). [DOI] [PMC free article] [PubMed] [Google Scholar]
- 10.Hatoum Hoda, Dollery Jennifer, Lilly Scott M, Crestanello Juan A, and Prasad Lakshmi %J Annals of biomedical engineering Dasi, ‘Sinus Hemodynamics Variation with Tilted Transcatheter Aortic Valve Deployments’, 47 (2019), 75–84. [DOI] [PMC free article] [PubMed] [Google Scholar]
- 11.Hatoum Hoda, Dollery Jennifer, Lilly Scott M, Crestanello Juan, Prasad Lakshmi %J The Journal of thoracic Dasi, and cardiovascular surgery, ‘Impact of Patient-Specific Morphologies on Sinus Flow Stasis in Transcatheter Aortic Valve Replacement: An in Vitro Study’, 157 (2019), 540–49. [DOI] [PMC free article] [PubMed] [Google Scholar]
- 12.Hatoum Hoda, Dollery Jennifer, Lilly Scott M., Crestanello Juan A., and Lakshmi Prasad Dasi, ‘Effect of Severe Bioprosthetic Valve Tissue Ingrowth and Inflow Calcification on Valve-in-Valve Performance’, Journal of Biomechanics, 74 (2018), 171–79. [DOI] [PMC free article] [PubMed] [Google Scholar]
- 13.Hatoum Hoda, Maureira Pablo, Lilly Scott, and Prasad Lakshmi %J JACC: Cardiovascular Interventions Dasi, ‘Impact of Leaflet Laceration on Transcatheter Aortic Valve-in-Valve Washout: Basilica to Solve Neosinus and Sinus Stasis’, 12 (2019), 1229–37. [DOI] [PMC free article] [PubMed] [Google Scholar]
- 14.Hatoum Hoda, Moore Brandon L., Maureira Pablo, Dollery Jennifer, Crestanello Juan A., and Prasad Dasi Lakshmi, ‘Aortic Sinus Flow Stasis Likely in Valve-in-Valve Transcatheter Aortic Valve Implantation’, The Journal of Thoracic and Cardiovascular Surgery, 154 (2017), 32–43.e1. [DOI] [PMC free article] [PubMed] [Google Scholar]
- 15.JAMES THOMASN, ‘Anatomy of the Coronary Arteries in Health and Disease’, Circulation, 32 (1965), 1020–33. [DOI] [PubMed] [Google Scholar]
- 16.Johnson Kevin, Sharma Puneet, and Oshinski John, ‘Coronary Artery Flow Measurement Using Navigator Echo Gated Phase Contrast Magnetic Resonance Velocity Mapping at 3.0t’, Journal of Biomechanics, 41 (2008), 595–602. [DOI] [PMC free article] [PubMed] [Google Scholar]
- 17.Khalique Omar K., Hahn Rebecca T., Gada Hemal, Nazif Tamim M., Vahl Torsten P., George Isaac, Kalesan Bindu, Forster Molly, Williams Mathew B., Leon Martin B., Einstein Andrew J., Pulerwitz Todd C., Pearson Gregory D. N., and Kodali Susheel K., ‘Quantity and Location of Aortic Valve Complex Calcification Predicts Severity and Location of Paravalvular Regurgitation and Frequency of Post-Dilation after Balloon-Expandable Transcatheter Aortic Valve Replacement’, JACC: Cardiovascular Interventions, 7 (2014), 885–94. [DOI] [PubMed] [Google Scholar]
- 18.Krzanowski Marek, Bodzoń Wojciech, and Dimitrow Paweł Petkow, ‘Imaging of All Three Coronary Arteries by Transthoracic Echocardiography. An Illustrated Guide’, Cardiovascular Ultrasound, 1 (2003), 16. [DOI] [PMC free article] [PubMed] [Google Scholar]
- 19.Lei M, Giddens DP, Jones SA, Loth F, and Bassiouny H, ‘Pulsatile Flow in an End-to-Side Vascular Graft Model: Comparison of Computations with Experimental Data’, Journal of Biomechanical Engineering, 123 (2000), 80–87. [DOI] [PubMed] [Google Scholar]
- 20.Leopold Jane A., ‘Cellular Mechanisms of Aortic Valve Calcification’, Circulation: Cardiovascular Interventions, 5 (2012), 605–14. [DOI] [PMC free article] [PubMed] [Google Scholar]
- 21.McCollough Cynthia H, Ulzheimer Stefan, Halliburton Sandra S, Shanneik Kaiss, White Richard D, and Willi A %J Radiology Kalender, ‘Coronary Artery Calcium: A Multi-Institutional, Multimanufacturer International Standard for Quantification at Cardiac Ct’, 243 (2007), 527–38. [DOI] [PubMed] [Google Scholar]
- 22.Milin Alexandra C, Vorobiof Gabriel, Aksoy Olcay, and Ardehali Reza, ‘Insights into Aortic Sclerosis and Its Relationship with Coronary Artery Disease’, Journal of the American Heart Association, 3, e001111. [DOI] [PMC free article] [PubMed] [Google Scholar]
- 23.Milin Alexandra C., Vorobiof Gabriel, Aksoy Olcay, and Ardehali Reza, ‘Insights into Aortic Sclerosis and Its Relationship with Coronary Artery Disease’, Journal of the American Heart Association, 3 (2014). [DOI] [PMC free article] [PubMed] [Google Scholar]
- 24.Moore Brandon, and Prasad Dasi Lakshmi, ‘Spatiotemporal Complexity of the Aortic Sinus Vortex’, Experiments in Fluids, 55 (2014), 1770. [DOI] [PMC free article] [PubMed] [Google Scholar]
- 25.Moore Brandon L., and Prasad Dasi Lakshmi, ‘Coronary Flow Impacts Aortic Leaflet Mechanics and Aortic Sinus Hemodynamics’, Annals of Biomedical Engineering, 43 (2015), 2231–41. [DOI] [PMC free article] [PubMed] [Google Scholar]
- 26.Otto CM, ‘Calcification of Bicuspid Aortic Valves’, Heart, 88 (2002), 321–22. [DOI] [PMC free article] [PubMed] [Google Scholar]
- 27.Peacock JA, ‘An in Vitro Study of the Onset of Turbulence in the Sinus of Valsalva’, Circulation Research, 67 (1990), 448–60. [DOI] [PubMed] [Google Scholar]
- 28.Piola M, Vismara R, Tasca G, Lucherini F, Redaelli P, Soncini M, Romagnoni C, Mangini A, Antona C, and Fiore GB, ‘Design of a Simple Coronary Impedance Simulator for the in Vitro Study of the Complex Coronary Hemodynamics’, Physiol Meas, 37 (2016), 2274–85. [DOI] [PubMed] [Google Scholar]
- 29.Sankaran Sethuraman, Moghadam Mahdi Esmaily, Kahn Andrew M., Tseng Elaine E., Guccione Julius M., and Marsden Alison L., ‘Patient-Specific Multiscale Modeling of Blood Flow for Coronary Artery Bypass Graft Surgery’, Annals of Biomedical Engineering, 40 (2012), 2228–42. [DOI] [PMC free article] [PubMed] [Google Scholar]
- 30.Schäfers Hans-Joachim, Schmied Wolfram, Marom Gil, and Aicher Diana, ‘Cusp Height in Aortic Valves’, The Journal of Thoracic and Cardiovascular Surgery, 146 (2013), 269–74. [DOI] [PubMed] [Google Scholar]
- 31.Sluysmans T, and Colan SD, ‘Theoretical and Empirical Derivation of Cardiovascular Allometric Relationships in Children’, J Appl Physiol (1985), 99 (2005), 445–57. [DOI] [PubMed] [Google Scholar]
- 32.Sucosky Philippe, Balachandran Kartik, Elhammali Adnan, Jo Hanjoong, and Yoganathan Ajit P., ‘Altered Shear Stress Stimulates Upregulation of Endothelial Vcam-1 and Icam-1 in a Bmp-4– and Tgf-Β1–Dependent Pathway’, Arteriosclerosis, Thrombosis, and Vascular Biology, 29 (2009), 254–60. [DOI] [PMC free article] [PubMed] [Google Scholar]
- 33.Yap Choon Hwai, Saikrishnan Neelakantan, Tamilselvan Gowthami, and Yoganathan Ajit P., ‘Experimental Measurement of Dynamic Fluid Shear Stress on the Aortic Surface of the Aortic Valve Leaflet’, Biomechanics and Modeling in Mechanobiology, 11 (2012), 171–82. [DOI] [PMC free article] [PubMed] [Google Scholar]
Associated Data
This section collects any data citations, data availability statements, or supplementary materials included in this article.
Supplementary Materials
Video 1: Streak plots of the 3 different coronary conditions throughout the cardiac cycle.


