

Abstract
Background
A previous Surveillance, Epidemiology, and End Results (SEER) study revealed a concerning decline in brachytherapy utilization in the United States between 1988–2009. This study evaluates recent trends in brachytherapy utilization in cervical cancer, and identifies factors and survival benefit associated with the use of brachytherapy treatment.
Methods and Materials
Using SEER data, 8500 patients with FIGO 2009 stage IB2-IVA cervical cancer treated with external beam radiotherapy (EBRT) between 2000–2020 were identified. Logistic regression analysis was performed on potential factors associated with brachytherapy use: age, marital status, race, ethnicity, income, metropolitan status, year of diagnosis, SEER region, histology, grade and stage. To adjust for differences between patients who received brachytherapy and those who did not, propensity-score matching was used. Multivariable Cox regression analysis assessed the association of brachytherapy use with cervical cancer-specific mortality (CSM) and all-cause mortality (ACM) in the matched cohort.
Results
Sixty-four percent of the 8500 women received brachytherapy in combination with EBRT; 36% received EBRT alone. The brachytherapy utilization rate declined sharply in 2003/2004 (lowest rate 44% in 2003), and then gradually improved especially in 2018–2020 (76%). Factors associated with higher odds of brachytherapy use included younger age, married (versus single), later years of diagnosis, certain SEER regions and earlier stage. In the propensity-score matched cohort, brachytherapy treatment was associated with lower 4-year cumulative incidence of cancer death (32.1% vs 43.4%, P<.001) and better overall survival (OS, 64.0% vs 51.4%, P<.001). Brachytherapy treatment was independently associated with lower CSM (hazard ratio [HR] 0.70, 95% CI 0.64–0.76; P<.001) and ACM (HR 0.72, 95% CI 0.67–0.78; P<.001).
Conclusion
Brachytherapy utilization among SEER regions has improved since 2004 in patients with stage IB2-IVA cervical cancer. Brachytherapy use remains independently associated with significantly lower CSM and ACM, and an essential component of treatment for patients with locally advanced cervical cancer.
Introduction
The gold standard for the definitive management of locally advanced cervical cancer consists of external beam radiotherapy (EBRT), concurrent cisplatin chemotherapy and brachytherapy. A previous Surveillance, Epidemiology, and End Results (SEER) study revealed a concerning decline in brachytherapy utilization in the United States between 1988 and 2009, and that brachytherapy use was independently associated with significantly lower cervical cancer-specific mortality (CSM) and all-cause mortality (ACM).1 A subsequent study using the National Cancer Database (NCDB) also reported a decline in brachytherapy utilization between 2004 and 2011, resulting in inferior overall survival (OS).2
These concerning findings led to increased awareness and efforts promoting the importance of brachytherapy, from press to publications, and presentations at conferences and workshops. The American Brachytherapy Society (ABS) issued a statement, “Cervical Cancer: Cure is Possible if Patients Receive Brachytherapy”.3 Several other societies and guidelines also underscore the importance of brachytherapy, including the American Society of Clinical Oncology Resource-Stratified Clinical Practice Guideline for the Management and Care of Women with Invasive Cervical Cancer,4 Society of Gynecologic Oncology-ABS evidence-based review on brachytherapy,5 and the American Society for Radiation Oncology Clinical Practice Guideline for Cervical Cancer.6 We hypothesized that the utilization rate of brachytherapy in cervical cancer improved in the U.S. since the prior study a decade ago. This updated analysis evaluates recent trends in brachytherapy utilization, and identifies factors and survival benefit associated with the use of brachytherapy treatment.
Methods
Data Source
A retrospective population-based study was conducted using Research Plus Data from 17 registries of the National Cancer Institute’s Surveillance, Epidemiology, and End Results (SEER) program. The full set of 22 SEER registries cover approximately 48% of the United States population,7 but since SEER 22 data contains limited variables, the SEER 17 data that contains all variables from the following registries were used: Alaska; Connecticut; Atlanta, Greater Georgia and Rural Georgia (combined into “Georgia” for patient confidentiality); San Francisco-Oakland, San Jose-Monterey, Los Angeles and Greater California (combined into “California” for patient confidentiality); Hawaii; Iowa; Kentucky; Louisiana; New Mexico; New Jersey; Seattle-Puget Sound; and Utah. County attribute data from the U.S. Census were linked to the SEER databases to classify counties as ‘metro’ or ‘nonmetro” and derive median household income. The study was approved by the institutional review board.
Study Population
Between January 1, 2000 and December 31, 2020, all patients diagnosed with stage IB2-IVA invasive cervical cancer in a SEER region were identified (n=24,205). Stage was assigned using the extent of disease codes, stage and tumor size variables according to the 2009 International Federation of Gynecologists and Obstetricians (FIGO) staging criteria. As the goal was to determine the utilization rate of brachytherapy, the following were excluded sequentially:1 cases not histologically confirmed, those diagnosed at autopsy, rare histologies that are not routinely treated with definitive radiotherapy (e.g. sarcoma) and/or less likely cervical (e.g. serous cystadenocarcinoma),8 those with a history of other malignancies, those not treated with EBRT or had “radiation NOS”, those who did not receive chemotherapy, those aged < 18, those with survival/follow-up time ≤ 5 months (i.e. not long enough to receive both EBRT and brachytherapy), or those treated with upfront surgery were sequentially excluded (Fig. E1). A total of 8500 patients met the inclusion criteria of the study.
Covariates
Patient demographic and tumor factors potentially associated with the use of brachytherapy were evaluated: age (<50, ≥50–59, ≥60–69, ≥70–79, ≥80); marital status (married, single/divorced/widowed, unknown); race and ethnicity (Hispanic, non-Hispanic American Indian/Alaskan Native, non-Hispanic Asian/Pacific Islander, non-Hispanic black, non-Hispanic white, unknown); metropolitan status (yes, no, unknown); household income (< $45,000, $45,000 – 59,999, $60,000 – 74,999, > $75,000); year of diagnosis (2000–2003, 2004–2006, 2007–2010, 2011–2014, 2015–2017, 2018–2020); registry location; grade (1, 2, 3, unknown); histology (squamous cell carcinoma, adenocarcinoma, adenosquamous carcinoma, other); and stage (IB2, II, III, IVA). Histology was defined using the World Health Organization International Classification of Diseases for Oncology 3rd edition (ICD-O 3), and categorized following the ICD-O 3 schema reported by Cohen et al (based on an expert gynecologic pathologist).8 The primary outcome—radiation treatment—was recorded in the database as external beam with or without radioactive implants. Since 1988, the SEER codes for radiation treatment have remained consistent.
Outcomes
The main analysis was restricted to those who received EBRT and chemotherapy. Brachytherapy utilization was defined as receipt of brachytherapy in combination with EBRT.1 Time to death was defined as time from diagnosis to death, or censoring, whichever occurs first. The cause of death was classified using SEER cause-specific death classification. Cancer registries use algorithms to ascertain the cause-specific death classification variable, taking into account causes of death in conjunction with site of the original cancer diagnosis, and comorbidities.9
Statistical Analysis
Similar statistical methodology to the prior SEER study was employed.1 Distributions of categorical variables by brachytherapy use were compared using the chi-square test or chi-square trend test. To identify factors independently associated with brachytherapy use, multivariable logistic regression analysis was performed on all potential factors listed under the Covariates section above. Backward elimination selection (P>0.10) and forward stepwise logistic regression with P<.10 as the selection criteria were used for inclusion of covariates in the model. To avoid unstable estimates of effects, missing value categories (from race and ethnicity, marital and metro status) and categories with observations constituting <1% of the cohort (Alaska registry) were removed from the regression model. Adjusted odds ratios (ORs) with 95% confidence intervals were reported for each covariate.
Propensity-score matching and survival analysis
As patients were not randomly assigned to receive brachytherapy, propensity-score matching was applied to adjust for differences in baseline characteristics.10,11 The propensity score, the probability of receiving brachytherapy conditional on the patient’s measured covariates, was estimated using a multivariable logistic regression model. All the baseline factors described in the Covariates section were included in the model, with backward elimination selection (P>.10). Patients were matched one-to-one on propensity scores using a greedy 5 → 1 digit match algorithm. ‘Brachytherapy’ cases were ordered by propensity score and sequentially matched to the nearest ‘no brachytherapy’ cases, starting first with a 5-digit match (i.e. best match).1,12 The difference in means or proportions divided by standard errors (‘standardized difference’) was used to examine the balance of covariate distribution between those who received brachytherapy and those who did not (Table E1).12,13 All standardized differences were <.02, indicating no imbalance between the two groups.12
OS was estimated using the Kaplan-Meier method and compared using log rank test. Non-parametric cumulative incidence functions for cancer and non-cancer death were calculated and compared using Gray’s test. Multivariable Cox proportional hazards models for CSM and ACM were fitted in the propensity-score matched cohort, including brachytherapy use and all the factors described in the Covariates section. Proportional hazards assumptions were tested using Schoenfeld residuals. All p-values were two-sided with a significance level of .05. SAS software, version 9.3 (SAS Institute, Cary, NC) or R version 4.3.0 (R Core Team, 2023) was used for all analyses.
Results
Between 2000 – 2020, 8500 patients with FIGO 2009 stage IB2 – IVA were treated with EBRT and chemotherapy in SEER regions. Of those, 64% received brachytherapy in combination with EBRT and 36% received EBRT alone. The brachytherapy utilization rate declined sharply in 2003/2004 (highest 80% in 2001 to lowest 44% in 2003 and 46% in 2004), and then gradually increased, especially in 2018–2020 (chi-square trend test P<.001, Fig. 1). The highest brachytherapy utilization rate during 2018–2020 was 79% in 2019. When plotted by stage, a similar trend in brachytherapy utilization rate was observed for stages IB2, II and III cervical cancer (chi-square trend test P=.001, P<.001 and P=.18, respectively; Fig. E2). Trend analysis was not performed for the subgroup of stage IVA cervical cancer, given the relatively small number of cases per year (range 0 – 6).
Figure 1.
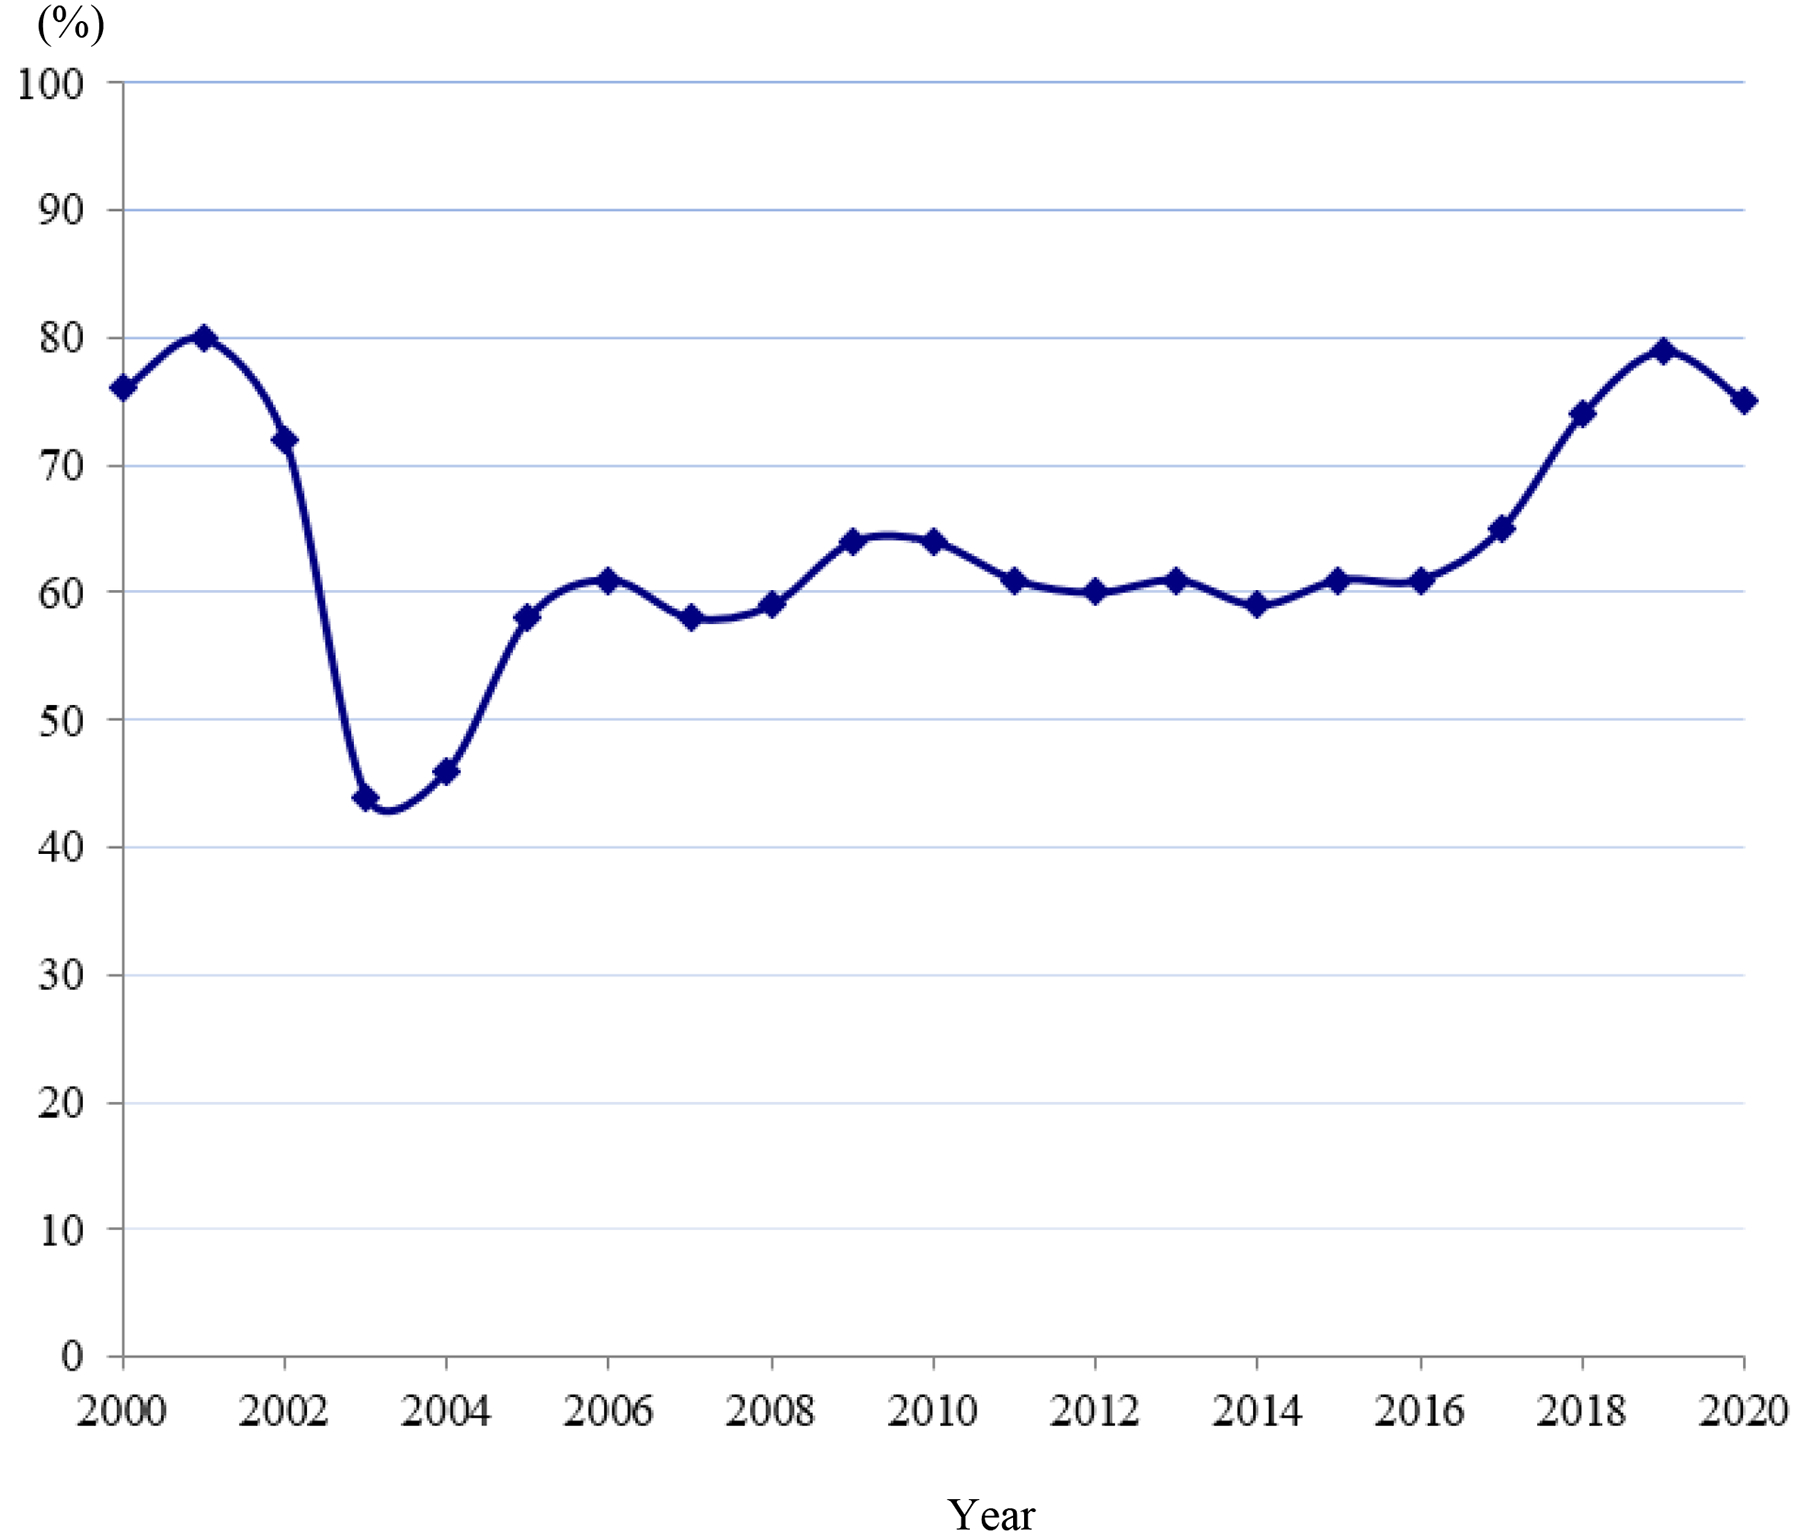
Brachytherapy utilization rate in 17 SEER registries between 2000–2020
There were significant differences in the distributions of age, marital status, race and ethnicity, metropolitan status, income, year of diagnosis, geographical location, and stage between patients who received brachytherapy and those who did not (Table 1). Factors associated with higher odds of receiving brachytherapy on multivariable logistic regression analysis included younger age, married (vs single/divorced/widowed), later years of diagnosis, certain SEER regions and earlier stage (Table 2). In the entire (unmatched) cohort, patients who received brachytherapy had significantly higher 4-year OS (66.0% vs 51.2%, P<.001; Fig. E3). Brachytherapy treatment was independently associated with lower ACM (HR 0.70, 95% CI 0.65–0.75; P<.001) on multivariable Cox regression analysis (Table E2).
Table 1.
Patient and tumor characteristics by brachytherapy use
| Characteristics | No Brachytherapy (n=3060) |
Brachytherapy (n=5440) |
P |
|---|---|---|---|
| Age, mean (SD), y | 52 (14) | 51 (14) | .008 |
| < 50 | 1379 (45) | 2609 (48) | |
| ≥ 50 – 59 | 784 (26) | 1350 (25) | |
| ≥ 60 – 69 | 506 (17) | 871 (16) | .04 |
| ≥ 70 – 79 | 291 (10) | 474 (9) | |
| ≥ 80 | 100 (3) | 136 (3) | |
| Single/Divorced/Widowed | 1902 (62) | 3054 (56) | |
| Married | 1051 (34) | 2157 (40) | <.001 * |
| Unknown | 107 (4) | 229 (4) | |
| Hispanic | 816 (27) | 1309 (24) | |
| Non-Hispanic American Indian/Alaska Native | 27 (1) | 59 (1) | |
| Non-Hispanic Asian or Pacific Islander | 287 (8) | 588 (11) | <.001 * |
| Non-Hispanic Black | 538 (18) | 772 (14) | |
| Non-Hispanic Unknown Race | 5 (<1) | 6 (<1) | |
| Non-Hispanic White | 1387 (45) | 2706 (50) | |
| No | 321 (10) | 794 (15) | |
| Yes | 2739 (89) | 4639 (85) | <.001 * |
| Unknown | 2 (<1) | 7 (<1) | |
| < $45,000 | 216 (7) | 429 (8) | |
| $45,000 – 59,999 | 614 (20) | 1105 (20) | <.001 |
| $60,000 – 74,999 | 1238 (40) | 1986 (37) | |
| > $75,000 | 992 (32) | 1920 (35) | |
| 2000 – 2003 | 450 (15) | 996 (18) | |
| 2004 – 2006 | 520 (17) | 637 (12) | |
| 2007 – 2010 | 592 (19) | 933 (17) | <.001 |
| 2011 – 2014 | 635 (21) | 966 (18) | |
| 2015 – 2017 | 532 (17) | 876 (16) | |
| 2018 – 2020 | 331 (11) | 1062 (20) | |
| Registry, No. (%) | |||
| Alaska Natives | 2 (<1) | 7 (<1) | |
| California | 1388 (45) | 2100 (39) | |
| Connecticut | 105 (3) | 157 (3) | |
| Georgia | 351 (11) | 745 (14) | |
| Hawaii | 30 (1) | 100 (2) | |
| Iowa | 75 (2) | 262 (5) | <.001 |
| Kentucky | 108 (4) | 620 (11) | |
| New Jersey | 442 (14) | 644 (12) | |
| New Mexico | 66 (2) | 110 (2) | |
| Seattle (Puget Sound) | 98 (3) | 274 (5) | |
| Louisiana | 363 (12) | 288 (5) | |
| Utah | 32 (1) | 133 (2) | |
| Squamous cell carcinoma | 2559 (84) | 4519 (83) | |
| Adenocarcinoma | 317 (10) | 635 (12) | .16 |
| Adenosquamous carcinoma | 102 (3) | 154 (3) | |
| Other | 82 (3) | 132 (2) | |
| Well differentiated | 108 (4) | 227 (4) | |
| Moderately differentiated | 945 (31) | 1772 (33) | .10 |
| Poorly differentiated | 1100 (36) | 1845 (34) | |
| Unknown | 907 (30) | 1596 (29) | |
| IB2 | 367 (12) | 661 (12) | |
| II | 1486 (49) | 3049 (56) | <.001 |
| III | 1186 (39) | 1719 (32) | |
| IVA | 21 (<1) | 11 (<1) |
χ2 test performed without the cases from Alaska and without those with unknown marital, race/ethnicity or metro status, which are excluded from subsequent analyses.
Table 2.
Predictors of Brachytherapy Use – Multivariable Logistic Regression Analysis
| Characteristics (n=8147) |
% Received Brachytherapy | Adjusted OR (95% CI) |
P |
|---|---|---|---|
| < 50 | 65 | 1 (reference) | |
| ≥ 50 – 59 | 63 | 0.94 (0.84–1.06) | .30 |
| ≥ 60 – 69 | 63 | 0.92 (0.80–1.06) | .24 |
| ≥ 70 – 79 | 62 | 0.87 (0.73–1.03) | .10 |
| ≥ 80 | 57 | 0.67 (0.50–0.89) | .006 |
| Single/Divorced/Widowed | 62 | 1 (reference) | <.001 |
| Married | 67 | 1.20 (1.09–1.33) | |
| 2000 – 2003 | 68 | 1.92 (1.62–2.27) | |
| 2004 – 2006 | 55 | 1 (reference) | <.001 |
| 2007 – 2010 | 61 | 1.38 (1.17–1.62) | <.001 |
| 2011 – 2014 | 60 | 1.31 (1.11–1.54) | .001 |
| 2015 – 2017 | 62 | 1.38 (1.17–1.63) | <.001 |
| 2018 – 2020 | 76 | 2.74 (2.29–3.27) | <.001 |
| Louisiana | 45 | 1 (reference) | <.001 |
| California | 60 | 1.96 (1.60–2.40) | <.001 |
| Connecticut | 59 | 1.85 (1.33–2.56) | <.001 |
| Georgia | 68 | 2.68 (2.17–3.31) | <.001 |
| Hawaii | 78 | 4.63 (2.89–7.44) | <.001 |
| Iowa | 78 | 4.50 (3.28–6.17) | <.001 |
| Kentucky | 85 | 7.93 (6.07–10.38) | <.001 |
| New Jersey | 59 | 1.83 (1.45–2.32) | <.001 |
| New Mexico | 63 | 2.48 (1.73–3.54) | <.001 |
| Seattle (Puget Sound) | 74 | 3.69 (2.70–5.06) | <.001 |
| Utah | 81 | 5.45 (3.50–8.51) | <.001 |
| < $45,000 | 66 | 1 (reference) | |
| $45,000 – 59,999 | 64 | 1.05 (0.85–1.31) | .64 |
| $60,000 – 74,999 | 61 | 0.97 (0.77–1.22) | .80 |
| > $75,000 | 66 | 1.15 (0.91–1.47) | .24 |
| IB2 | 64 | 1 (reference) | |
| II | 67 | 1.22 (1.05–1.42) | .01 |
| III | 59 | 0.83 (0.71–0.98) | .02 |
| IVA | 34 | 0.34 (0.16–0.74) | .006 |
Race and ethnicity, metro, grade and histology were eliminated from the regression model because P<.10.
In the propensity-score matched cohort (n = 5566), patients who received brachytherapy had significantly higher 4-year OS (64.0% vs 51.4%, P<.001; Fig. 2a), and lower 4-year cumulative incidence of cervical cancer-specific death (32.1% vs 43.4%, P<.001; Fig. 2b). There were no differences in 4-year cumulative incidence of non-cancer-related death between those who received brachytherapy and those who did not (3.7% vs 4.8%, P=.98; Fig. 2c). Brachytherapy treatment was independently associated with lower CSM (HR 0.70, 95% CI 0.64–0.76; P<.001), and ACM (HR 0.72, 95% CI 0.67–0.78; P<.001) on multivariable Cox regression analysis (Table 3). Other variables independently associated with lower CSM included: married status, Hispanic ethnicity, non-Hispanic Asian or Pacific Islander race, later year of diagnosis, some SEER regions, squamous histology, well differentiation, and earlier stage (Table 3). The same variables plus younger age were also independently associated with lower ACM (Table 3).
Figure 2.
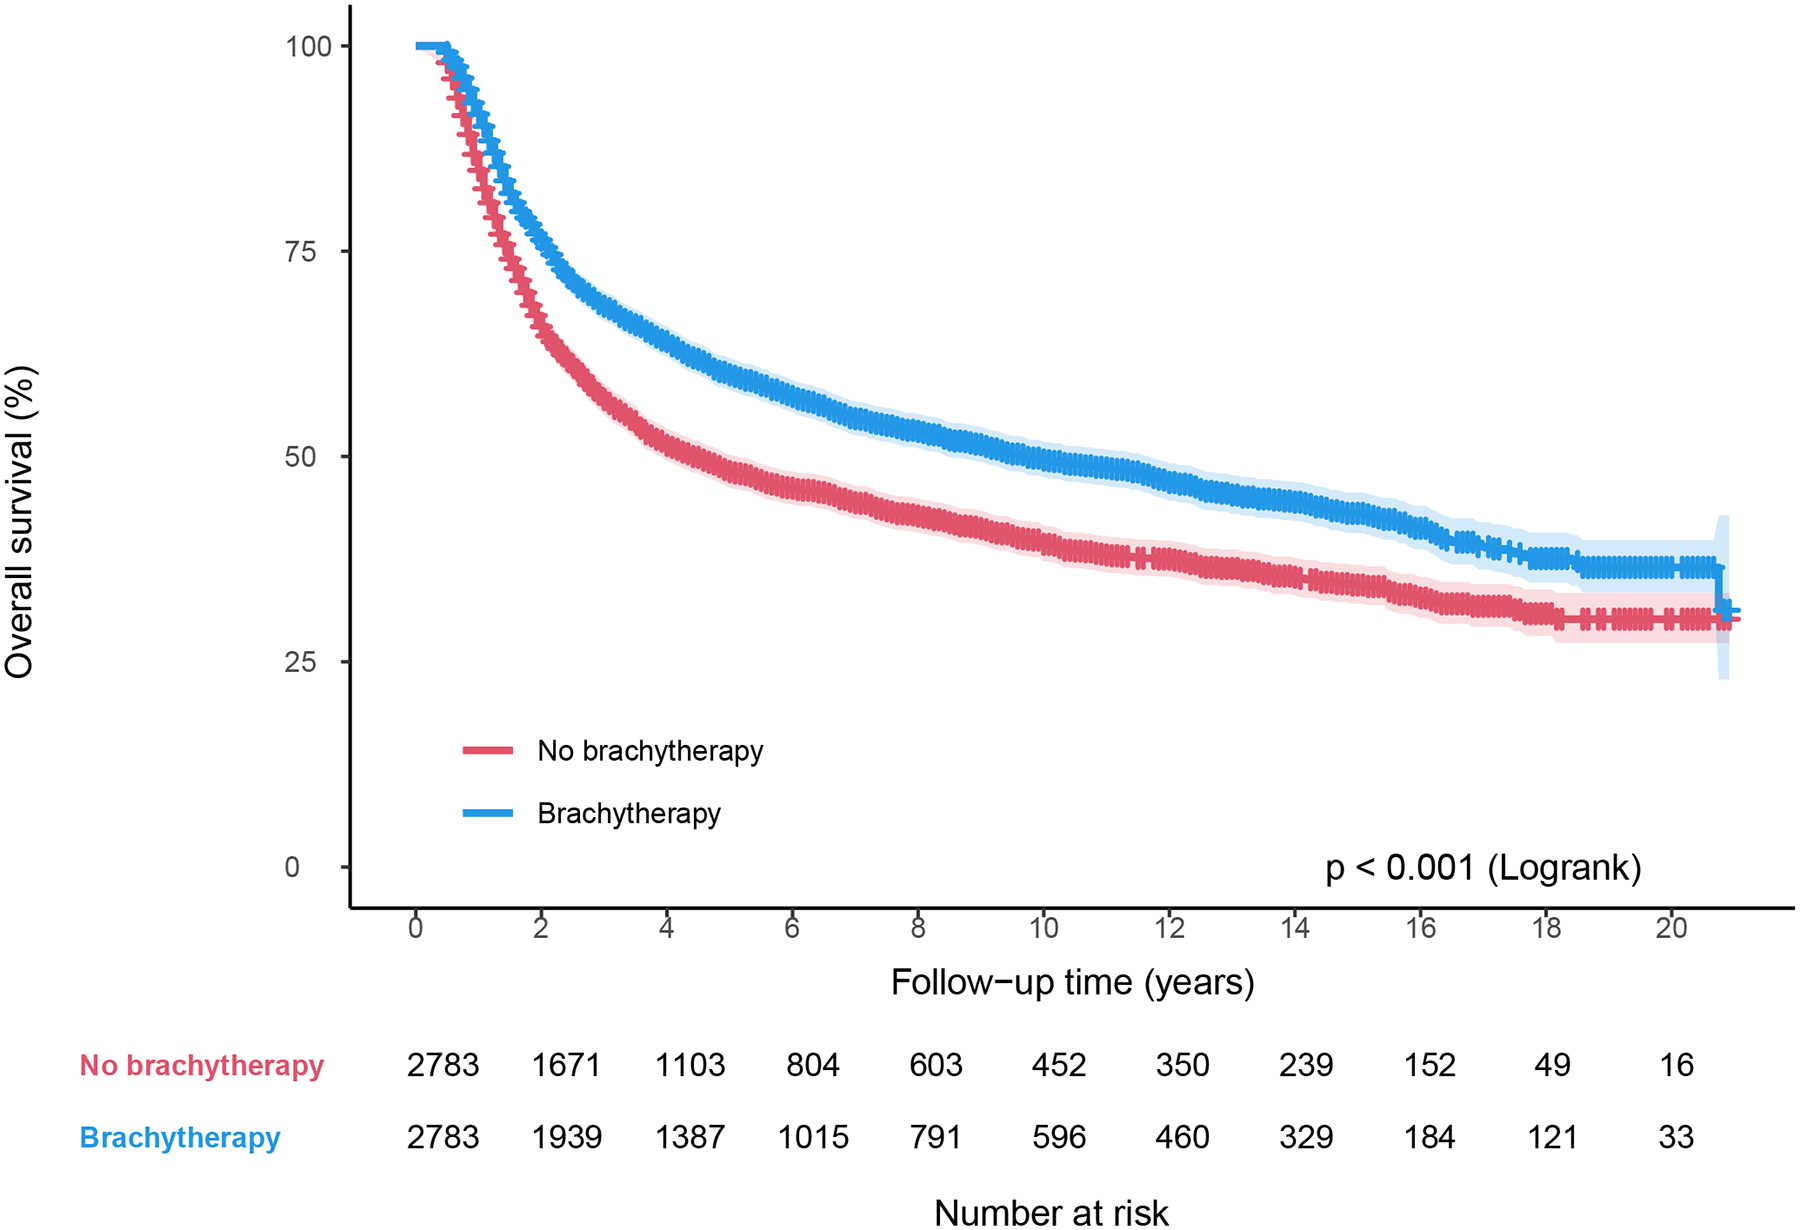
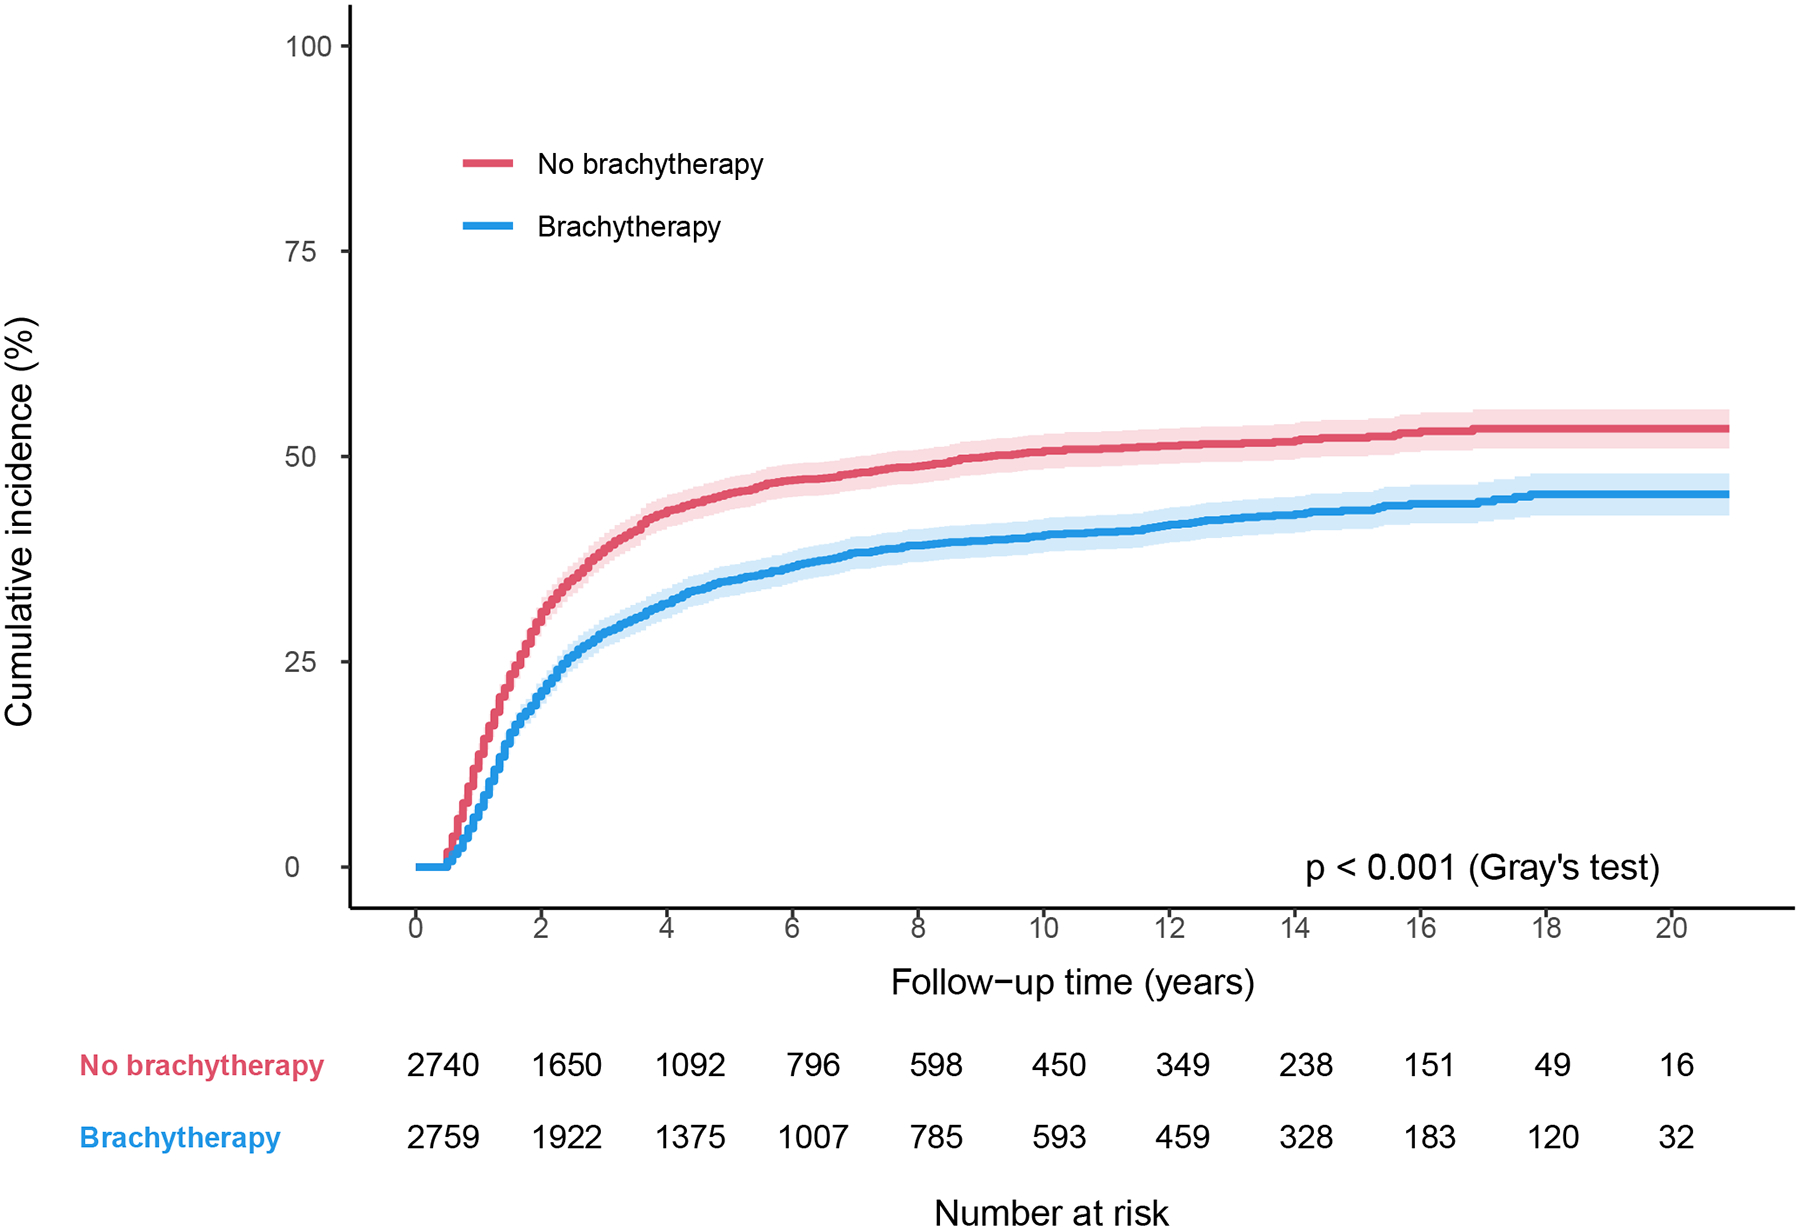
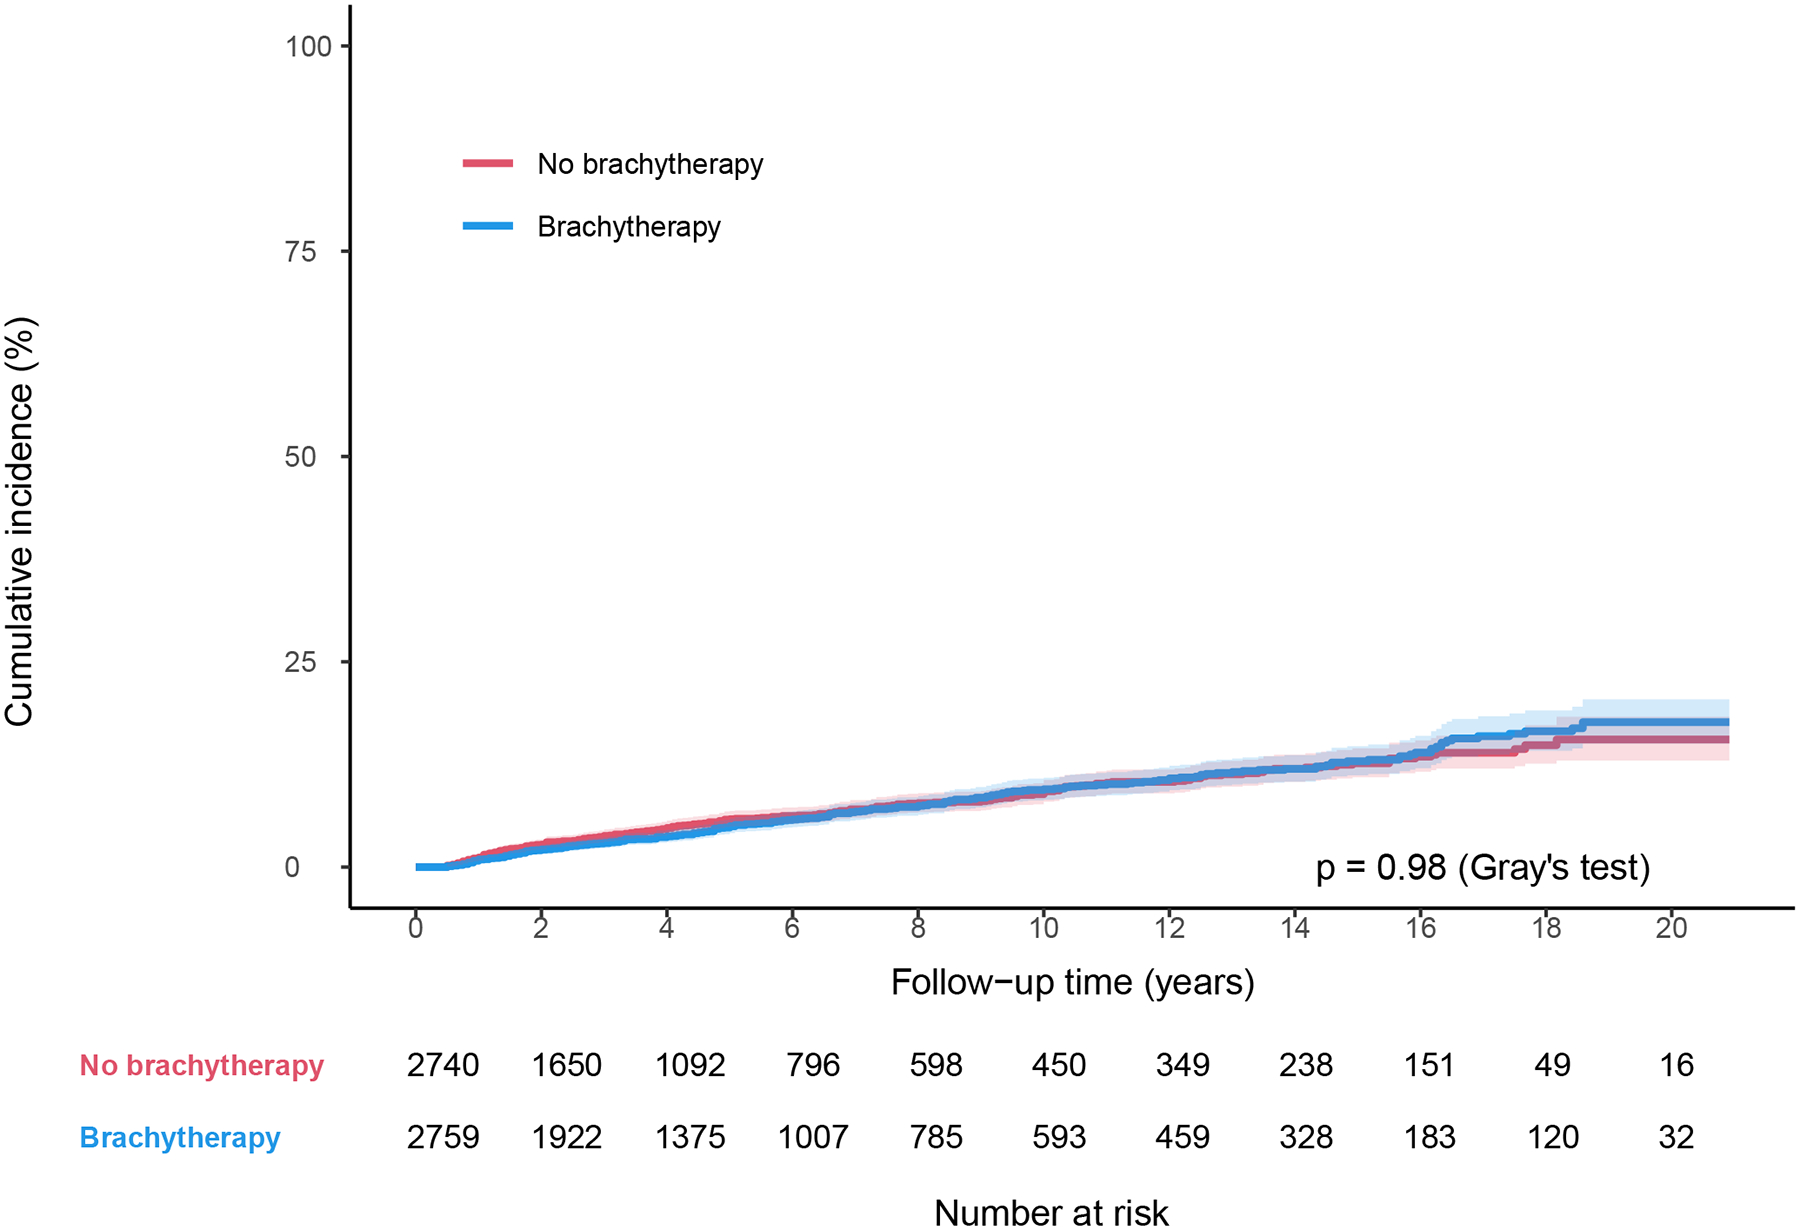
Survival by brachytherapy use for matched cohort between 2000–2020. (A) Overall survival, (B) Cause-specific survival, and (C) Non-cancer-related survival.
Table 3.
Multivariable Cox Regression Analysis in the propensity score-matched cohort
| Characteristics (n = 5566)* |
Cancer-Specific Mortality | All-Cause Mortality | ||
|---|---|---|---|---|
| Hazard Ratio (95% CI) |
P | Hazard Ratio (95% CI) |
P | |
| Brachytherapy treatment | ||||
| No | 1 (reference) | 1 (reference) | ||
| Yes | 0.70 (0.64–0.76) | <.001 | 0.72 (0.67–0.78) | <.001 |
| Age | ||||
| < 50 | 1 (reference) | 1 (reference) | ||
| ≥ 50 – 59 | 0.92 (0.83–1.03) | .14 | 1.02 (0.93–1.13) | .64 |
| ≥ 60 – 69 | 0.94 (0.83–1.06) | .30 | 1.20 (1.08–1.33) | .001 |
| ≥ 70 – 79 | 0.99 (0.84–1.15) | .85 | 1.39 (1.22–1.59) | <.001 |
| ≥ 80 | 1.09 (0.84–1.42) | .51 | 1.71 (1.40–2.10) | <.001 |
| Marital Status | ||||
| Single/Divorced/Widowed | 1 (reference) | 1 (reference) | ||
| Married | 0.88 (0.81–0.97) | .007 | 0.87 (0.80–0.95) | .001 |
| Race and Ethnicity | ||||
| Hispanic | 0.84 (0.75–0.94) | .002 | 0.81 (0.73–0.90) | <.001 |
| Non-Hispanic American Indian/Alaska Native | 1.04 (0.67–1.59) | .87 | 1.00 (0.68–1.45) | .99 |
| Non-Hispanic Asian or Pacific Islander | 0.78 (0.66–0.92) | .003 | 0.78 (0.68–0.91) | .001 |
| Non-Hispanic Black | 1.06 (0.94–1.20) | .37 | 1.06 (0.95–1.18) | .31 |
| Non-Hispanic White | 1 (reference) | 1 (reference) | ||
| Income | ||||
| < $45,000 | 1 (reference) | 1 (reference) | ||
| $45,000 – 59,999 | 0.98 (0.80–1.20) | .85 | 0.92 (0.76–1.13) | .42 |
| $60,000 – 74,999 | 1.02 (0.82–1.26) | .86 | 0.91 (0.73–1.13) | .38 |
| > $75,000 | 0.97 (0.77–1.21) | .77 | 0.85 (0.68–1.07) | .16 |
| Metro | ||||
| No | 1 (reference) | 1 (reference) | ||
| Yes | 1.01 (0.81–1.25) | .96 | 1.14 (0.97–1.34) | .11 |
| Year of Diagnosis | ||||
| 2000 – 2003 | 0.98 (0.85–1.12) | .73 | 1.02 (0.90–1.15) | .77 |
| 2004 – 2006 | 1 (reference) | 1 (reference) | ||
| 2007 – 2010 | 0.94 (0.82–1.07) | .32 | 0.96 (0.85–1.08) | .47 |
| 2011 – 2014 | 0.84 (0.73–0.96) | .01 | 0.87 (0.77–0.99) | .03 |
| 2015 – 2017 | 0.75 (0.65–0.87) | <.001 | 0.76 (0.67–0.89) | <.001 |
| 2018 – 2020 | 0.67 (0.54–0.84) | <.001 | 0.73 (0.60–0.90) | .003 |
| Registry | ||||
| Louisiana | 1 (reference) | 1 (reference) | ||
| California | 0.93 (0.77–1.13) | .47 | 1.01 (0.85–1.20) | .89 |
| Connecticut | 0.68 (0.51–0.92) | .02 | 0.79 (0.61–1.04) | .09 |
| Georgia | 0.92 (0.76–1.11) | .37 | 1.08 (0.91–1.28) | .38 |
| Hawaii | 1.84 (1.18–2.89) | .008 | 1.85 (1.23–2.80) | .003 |
| Iowa | 0.96 (0.70–1.30) | .77 | 1.06 (0.79–1.41) | .71 |
| Kentucky | 0.88 (0.67–1.15) | .36 | 0.95 (0.74–1.22) | .68 |
| New Jersey | 0.87 (0.71–1.07) | .20 | 0.91 (0.75–1.10) | .35 |
| New Mexico | 0.74 (0.51–1.06) | .10 | 0.86 (0.62–1.18) | .34 |
| Seattle (Puget Sound) | 0.79 (0.58–1.08) | .13 | 0.94 (0.71–1.24) | .66 |
| Utah | 0.71 (0.44–1.15) | .16 | 0.84 (0.55–1.29) | .43 |
| Histology | ||||
| Squamous cell carcinoma | 1 (reference) | 1 (reference) | ||
| Adenocarcinoma | 1.38 (1.21–1.57) | <.001 | 1.32 (1.17–1.49) | <.001 |
| Adenosquamous carcinoma | 1.31 (1.05–1.63) | .02 | 1.21 (0.98–1.48) | .08 |
| Other | 1.34 (1.06–1.70) | .01 | 1.34 (1.08–1.67) | .008 |
| Grade | ||||
| Well differentiated | 1 (reference) | 1 (reference) | ||
| Moderately differentiated | 1.21 (0.88–1.43) | .34 | 1.13 (0.91–1.40) | .26 |
| Poorly differentiated | 1.30 (1.02–1.66) | .03 | 1.26 (1.02–1.56) | .04 |
| Unknown | 1.10 (0.86–1.40) | .47 | 1.11 (0.90–1.38) | .34 |
| Stage | ||||
| IB2 | 1 (reference) | 1 (reference) | ||
| II | 1.18 (1.00–1.37) | .04 | 1.17 (1.02–1.35) | .03 |
| III | 2.36 (2.02–2.75) | <.001 | 2.20 (1.91–2.54) | <.001 |
| IVA | 2.79 (1.54–5.06) | <.001 | 2.56 (1.48–4.44) | <.001 |
5499 for cause-specific survival as cause of death was unknown for 67 patients.
Discussion
This study shows recent improvement in brachytherapy utilization, especially in 2018–2020. Nonetheless, there remains significant disparities in brachytherapy use, and room for improvement. Brachytherapy use remains independently associated with lower CSM and ACM.
Given the population-based nature of SEER data, it is not possible to determine the exact cause of the sharp decline in brachytherapy utilization in the SEER database in 2003/2004. The SEER radiation summary codes have not changed since 1988 (Appendix). The American College of Surgeon Commission on Cancer (CoC) no longer required the collection of SEER radiation summary data field effective Jan 2002.14,15 If the radiation summary data field was not reported by a CoC hospital, SEER registries could generate the radiation treatment code from the CoC “Boost Treatment Modality” (or “Regional Treatment Modality”) field using a conversion scheme outlined in the 2003 version of the SEER code manual (Appendix).14,15 While it is possible that this change might have contributed to the decline in brachytherapy utilization,16 the fact that the brachytherapy utilization rate remained low for years after this change makes it less likely. The Quality Research in Radiation Oncology study, which reviewed the records of 261 randomly selected patients from 45 facilities (42% of the facilities invited to participate) in 2005–2007, also reported a decrease in brachytherapy utilization rate compared to 1996–1999 (87.5% vs 92.4%).17,18
We previously postulated that the increased uptake of highly conformal radiotherapy techniques such as IMRT and Medicare reimbursement of IMRT could have contributed to the decreased utilization in brachytherapy starting in 2003.1,15,19 A SEER-Medicare study showed that practice setting and reimbursement policy strongly influenced the adoption of IMRT for breast cancer.20 Schad et al and Bauer-Nilsen et al also hypothesized that the relative differences in physician reimbursement and relative value units (RVU) between brachytherapy and IMRT are the likely primary determinant of decline in cervical brachytherapy.21,22 Attending time per RVU is approximately 4-fold higher for brachytherapy than IMRT.22 In a 2018 survey of American Brachytherapy Society (ABS) members, 64% of the respondents agreed/strongly agreed that reimbursement policies favoring IMRT/SBRT vs. brachytherapy influenced brachytherapy use.23 While > 97% of the ABS survey respondents would recommend brachytherapy for most patients with cervical cancer, 30% report barriers in performing brachytherapy, and 37% would perform an IMRT or SBRT boost in specific scenarios in potentially curable patients.23 However, IMRT and proton therapy provide inferior dosimetry compared to brachytherapy.24 IMRT or SBRT boost was also associated with inferior survival compared to brachytherapy in the NCDB study by Gill et al.2 Other potential reasons for decreased brachytherapy utilization include poor physician or patient access to brachytherapy, inadequate training and/or maintenance of brachytherapy skills.25,26 Significant geographic disparities in access to brachytherapy exist; establishing programs that provide travel and lodging support for patients from areas without access to brachytherapy may mitigate disparities.27
This study shows an improvement in brachytherapy utilization in SEER regions in recent years, especially 2018–2020. Possible reasons for this improvement include increased awareness about brachytherapy utilization and its importance since the prior studies from a decade ago, efforts to promote brachytherapy and procedural training, and most importantly increase in Medicare reimbursement (hospital outpatient prospective payment system) for tandem and ovoid insertion in recent years. Decreasing the disparity between reimbursement for brachytherapy compared with competing treatment modalities is critical. In the U.S. starting in 2023, the Accreditation Council for Graduate Medical Education (ACGME) changed residency training requirements to ensure that residents obtain a minimum number of tandem-based brachytherapy cases. These efforts and strategies must continue, in order to further boost brachytherapy utilization and ensure that patients with cervical cancer receive the best possible care.
The survival benefit of brachytherapy use was confirmed in this updated SEER analysis, which includes 11 more years of data compared to the previous analysis. Previous Patterns of Care studies conducted in the 1970s also showed the importance of brachytherapy in optimizing tumor control.28,29 Smaller institutional series and the NCDB study by Gill et al demonstrated better outcomes associated with brachytherapy use as well.2,30,31 In addition to delivering brachytherapy, proper placement of the brachytherapy applicator is also critical in optimizing local control and disease-free survival.32,33
Compared to a recent NCDB analysis,34 this SEER analysis did not find that Hispanic ethnicity was associated with decreased brachytherapy utilization, rather the opposite. Reasons for this discrepancy are not clear, but may include differences in centers included, differences in reporting ethnicity, core structural differences in the databases or other unknown confounders. Debates regarding completeness, accuracy, and selection bias exist with both of these databases. The NCDB is a much larger data set from 1500 American College of Surgeons Commission on Cancer (CoC)-approved hospitals, representing approximately 70 % of all newly diagnosed cancer cases in the United States and therefore has a greater potential opportunity for inaccuracies.35 The SEER cohort is population-based whereas NCDB is hospital based data. Geographic capture of cases varies, as states with a higher proportion of CoC-approved hospitals will have a higher percentage of cases captured. American Indians and Alaskan Natives were found to have a lower percentage of cases captured compared with whites, blacks, and Asian/Pacific Islanders (32.8 % vs. 64.7–67.4 %). Elderly patients (>65 years) were found to have lower case coverage than persons aged <65 (63 vs. 73 %). Cervical cancer had the highest case coverage (77.9 %).36
Similar to other studies based on the SEER database, this study has limitations, including potential misclassification of exposures or outcomes.1 Since SEER collects information on surgery, radiotherapy and chemotherapy given as part of the first course of therapy (i.e. before disease progression/recurrence) and since brachytherapy is typically delivered in a hospital setting during the SEER data collection period, brachytherapy use should not be significantly under-reported.1 A previous study comparing SEER data with SEER-Medicare data showed that although sensitivity for chemotherapy was poor, the overall positive predictive value of SEER treatment variables for both chemotherapy and radiotherapy was high (e.g. 91% for chemotherapy and 98% for radiotherapy for breast cancer; gynecological cancer not evaluated).37 Given the high positive predictive value of treatment receipt, this study excluded patients who did not receive EBRT and/or chemotherapy or with unknown treatment status. The SEER database does not capture patient preference, comorbidities or insurance coverage, which may also impact brachytherapy utilization. The insurance variable was temporarily available in previous SEER releases of November 2012–2018 submissions, but no longer available. Attempts to account for factors that determine brachytherapy receipt was made by propensity-score matching, by including age in the analysis (on the assumption that comorbidities increase with age) and by comparing non-cancer-related death between the two groups.1 There was no significant difference in non-cancer-related death rates between patients who received brachytherapy and those who did not in the propensity-score matched cohort, suggesting that comorbidities associated with early death were relatively balanced.1 The SEER database also lacks details on radiotherapy technique, dose-fractionation, overall treatment time, and treatment facility type (e.g. community vs academic). A small proportion of patients had missing data for a few variables (e.g. marital status, race and ethnicity) and therefore were excluded from the regression analyses.
While SEER data may be subject to the above limitations, the population covered by SEER is broadly representative of the general United States population.38 This population-based study reveals recent brachytherapy utilization in real-world practice in the United States. SEER data are particularly suited for analyzing longitudinal trends.39 Another strength of the SEER data is the ascertainment of cause of death, enabling analysis of CSM.
Conclusions
Brachytherapy utilization rate in cervical cancer has improved in the United States in SEER regions since its nadir in 2003/2004. Significant disparities in brachytherapy use remain. Given the overall survival benefit associated with brachytherapy treatment, physicians are strongly urged to maximize patients’ chance of cure by either personally delivering high quality, image-guided brachytherapy or referring to those specializing in gynecologic brachytherapy.
Supplementary Material
Funding Statement
This work was supported by the Princess Margaret Cancer Foundation - Department Radiation Oncology Academic Enrichment Fund.
Footnotes
Conflict of Interest Statement for All Authors
Dr Kathy Han was on the Astra Zeneca Cervical Cancer Radiation Oncology Advisory Board.
All the other co-authors report no conflict of interest.
Data Availability Statement for this Work
Research data are available upon request from the Surveillance, Epidemiology, and End Results Program, at https://seer.cancer.gov/.
References
- 1.Han K, Milosevic M, Fyles A, et al. Trends in the utilization of brachytherapy in cervical cancer in the United States. Int J Radiat Oncol Biol Phys 2013;87:111–9. [DOI] [PubMed] [Google Scholar]
- 2.Gill BS, Lin JF, Krivak TC, et al. National Cancer Data Base analysis of radiation therapy consolidation modality for cervical cancer: the impact of new technological advancements. Int J Radiat Oncol Biol Phys 2014;90:1083–90. [DOI] [PubMed] [Google Scholar]
- 3.CERVICAL CANCER TREATMENT: CURE IS POSSIBLE IF PATIENTS RECEIVE BRACHYTHERAPY. Accessed from: https://www.americanbrachytherapy.org/resources/cervical-brachy/.
- 4.Chuang LT, Temin S, Camacho R, et al. Management and Care of Women With Invasive Cervical Cancer: American Society of Clinical Oncology Resource-Stratified Clinical Practice Guideline. J Glob Oncol 2016;2:311–340. [DOI] [PMC free article] [PubMed] [Google Scholar]
- 5.Holschneider CH, Petereit DG, Chu C, et al. Brachytherapy: A critical component of primary radiation therapy for cervical cancer: From the Society of Gynecologic Oncology (SGO) and the American Brachytherapy Society (ABS). Gynecol Oncol 2019;152:540–547. [DOI] [PubMed] [Google Scholar]
- 6.Chino J, Annunziata CM, Beriwal S, et al. Radiation Therapy for Cervical Cancer: Executive Summary of an ASTRO Clinical Practice Guideline. Pract Radiat Oncol 2020;10:220–234. [DOI] [PMC free article] [PubMed] [Google Scholar]
- 7.Surveillance, Epidemiology, and End Results program. Overview of the SEER program. Available at: https://seer.cancer.gov/about/overview.html
- 8.Cohen CM, Wentzensen N, Castle PE, et al. Racial and Ethnic Disparities in Cervical Cancer Incidence, Survival, and Mortality by Histologic Subtype. Journal of Clinical Oncology 2023;41:1059–1068. [DOI] [PMC free article] [PubMed] [Google Scholar]
- 9.Howlader N, Ries LAG, Mariotto AB, et al. Improved Estimates of Cancer-Specific Survival Rates From Population-Based Data. Journal of the National Cancer Institute 2010;102:1584–1598. [DOI] [PMC free article] [PubMed] [Google Scholar]
- 10.Rosenbaum PR, Rubin DB. Reducing Bias in Observational Studies Using Subclassification on the Propensity Score. Journal of the American Statistical Association 1984;79:516–524. [Google Scholar]
- 11.D’Agostino RB. Propensity score methods for bias reduction in the comparison of a treatment to a non-randomized control group. Statistics in Medicine 1998;17:2265–2281. [DOI] [PubMed] [Google Scholar]
- 12.Parlsons LS. Reducing Bias in a Propensity Score Matched-Pair Sample Using Greedy Matching Techniques. Available at: http://www2.sas.com/proceedings/sugi26/p214-26.pdf. Accessed May 2, 2023.
- 13.Cohen J Statistical Power Analysis for the Behavioral Sciences, 2 ed. Hillsdale, NJ: Lawrence Erlbaum Associates Publishers; 1988. [Google Scholar]
- 14.Surveillance, Epidemiology, and End Results Program. Historical coding and staging manuals. Available at: https://seer.cancer.gov/tools/codingmanuals/historical.html
- 15.Han K, Milosevic M, Fyles A, et al. In reply to Smith and Eifel. Int J Radiat Oncol Biol Phys 2014;88:460–1. [DOI] [PubMed] [Google Scholar]
- 16.Smith GL, Eifel PJ. Trends in the utilization of brachytherapy in cervical cancer in the United States. In regard to Han et al. Int J Radiat Oncol Biol Phys 2014;88:459–60. [DOI] [PubMed] [Google Scholar]
- 17.Eifel PJ, Ho A, Khalid N, et al. Patterns of radiation therapy practice for patients treated for intact cervical cancer in 2005 to 2007: a quality research in radiation oncology study. Int J Radiat Oncol Biol Phys 2014;89:249–56. [DOI] [PubMed] [Google Scholar]
- 18.Eifel PJ, Moughan J, Erickson B, et al. Patterns of radiotherapy practice for patients with carcinoma of the uterine cervix: a patterns of care study. Int J Radiat Oncol Biol Phys 2004;60:1144–53. [DOI] [PubMed] [Google Scholar]
- 19.Mell LK, Mehrotra AK, Mundt AJ. Intensity-modulated radiation therapy use in the U.S., 2004. Cancer 2005;104:1296–303. [DOI] [PubMed] [Google Scholar]
- 20.Smith BD, Pan I-W, Shih Y-CT, et al. Adoption of Intensity-Modulated Radiation Therapy for Breast Cancer in the United States. Journal of the National Cancer Institute 2011. [DOI] [PubMed] [Google Scholar]
- 21.Schad M, Kowalchuk R, Beriwal S, et al. How might financial pressures have impacted brachytherapy? A proposed narrative to explain the declines in cervical and prostate brachytherapy utilization. Brachytherapy 2019;18:780–786. [DOI] [PubMed] [Google Scholar]
- 22.Bauer-Nilsen K, Hill C, Trifiletti DM, et al. Evaluation of Delivery Costs for External Beam Radiation Therapy and Brachytherapy for Locally Advanced Cervical Cancer Using Time-Driven Activity-Based Costing. Int J Radiat Oncol Biol Phys 2018;100:88–94. [DOI] [PubMed] [Google Scholar]
- 23.Ma TM, Harkenrider MM, Yashar CM, et al. Understanding the underutilization of cervical brachytherapy for locally advanced cervical cancer. Brachytherapy 2019;18:361–369. [DOI] [PubMed] [Google Scholar]
- 24.Georg D, Kirisits C, Hillbrand M, et al. Image-guided radiotherapy for cervix cancer: high-tech external beam therapy versus high-tech brachytherapy. Int J Radiat Oncol Biol Phys 2008;71:1272–8. [DOI] [PubMed] [Google Scholar]
- 25.Petereit DG, Frank SJ, Viswanathan AN, et al. Brachytherapy: where has it gone? J Clin Oncol 2015;33:980–2. [DOI] [PMC free article] [PubMed] [Google Scholar]
- 26.Han K, Viswanathan AN. Brachytherapy in Gynecologic Cancers: Why Is It Underused? Curr Oncol Rep 2016;18:26. [DOI] [PubMed] [Google Scholar]
- 27.Bates JE, Thaker NG, Parekh A, et al. Geographic access to brachytherapy services in the United States. Brachytherapy 2022;21:29–32. [DOI] [PubMed] [Google Scholar]
- 28.Hanks GE, Herring DF, Kramer S. Patterns of care outcome studies. Results of the national practice in cancer of the cervix. Cancer 1983;51:959–67. [DOI] [PubMed] [Google Scholar]
- 29.Coia L, Won M, Lanciano R, et al. The Patterns of Care Outcome Study for cancer of the uterine cervix. Results of the Second National Practice Survey. Cancer 1990;66:2451–6. [DOI] [PubMed] [Google Scholar]
- 30.Bandera L, La Face B, Antonioli C, et al. Survival and toxicity of radical radiotherapy (with or without brachytherapy) for FIGO stage I and II cervical cancer: a mono-institutional analysis. Eur J Gynaecol Oncol 2014;35:121–7. [PubMed] [Google Scholar]
- 31.Karlsson J, Dreifaldt AC, Mordhorst LB, et al. Differences in outcome for cervical cancer patients treated with or without brachytherapy. Brachytherapy 2017;16:133–140. [DOI] [PubMed] [Google Scholar]
- 32.Corn BW, Hanlon AL, Pajak TF, et al. Technically accurate intracavitary insertions improve pelvic control and survival among patients with locally advanced carcinoma of the uterine cervix. Gynecol Oncol 1994;53:294–300. [DOI] [PubMed] [Google Scholar]
- 33.Viswanathan AN, Moughan J, Small W Jr., et al. The quality of cervical cancer brachytherapy implantation and the impact on local recurrence and disease-free survival in radiation therapy oncology group prospective trials 0116 and 0128. Int J Gynecol Cancer 2012;22:123–31. [DOI] [PMC free article] [PubMed] [Google Scholar]
- 34.Colson-Fearon D, Viswanathan AN. Updated Trends In Brachytherapy Utilization In The United States From 2004 To 2020. 2023 American Brachytherapy Society Annual Meeting, June 2023. [Google Scholar]
- 35.American College of Surgeons. Cancer programs. National Cancer Data Base. Available at: http://www.facs.org/cancer/ncdb/ [Google Scholar]
- 36.Lerro CC, Robbins AS, Phillips JL, et al. Comparison of cases captured in the national cancer data base with those in population-based central cancer registries. Ann Surg Oncol 2013;20:1759–65. [DOI] [PubMed] [Google Scholar]
- 37.Noone AM, Lund JL, Mariotto A, et al. Comparison of SEER Treatment Data With Medicare Claims. Med Care 2016;54:e55–64. [DOI] [PMC free article] [PubMed] [Google Scholar]
- 38.Surveillance, Epidemiology, and End Results Program. Population characteristics. Available at: http://seer.cancer.gov/registries/characteristics.html
- 39.Doll KM, Rademaker A, Sosa JA. Practical Guide to Surgical Data Sets: Surveillance, Epidemiology, and End Results (SEER) Database. JAMA Surg 2018;153:588–589. [DOI] [PubMed] [Google Scholar]
Associated Data
This section collects any data citations, data availability statements, or supplementary materials included in this article.
Supplementary Materials
Data Availability Statement
Research data are available upon request from the Surveillance, Epidemiology, and End Results Program, at https://seer.cancer.gov/.