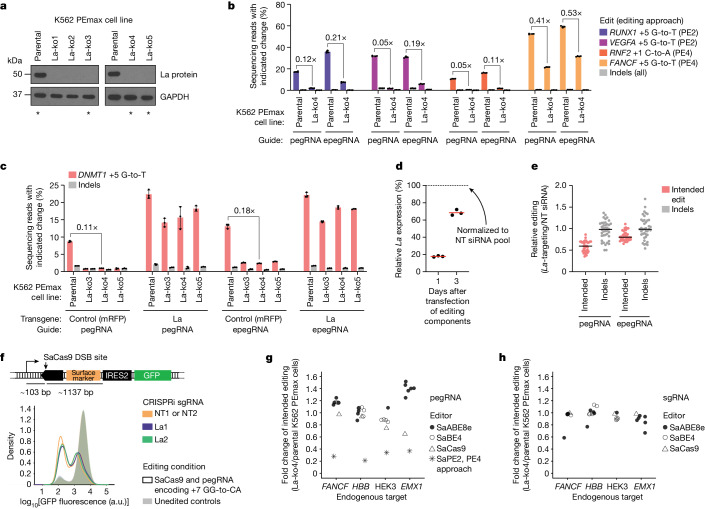
Fig. 2. La promotes prime editing across edit types and genomic loci.
a, Western blot analysis of K562 cells constitutively expressing PEmax (K562 PEmax parental) and clones with genetic disruption of La (La-ko1 through La-ko5). Asterisks indicate cell lines used in this study. See also Extended Data Fig. 3d. b, Percentages of prime editing outcomes at indicated genomic loci. pegRNAs and epegRNAs (evopreQ1) were delivered as plasmids without or with MLH1dn (PE2 or PE4, respectively). c, Percentages of prime editing outcomes with or without ectopic expression of La. Expression plasmids for La or mRFP control were delivered alongside plasmids encoding pegRNA or epegRNA (evopreQ1). The PE2 approach was used. d, Quantification of RNAi-mediated La depletion. RT–qPCR from HEK293T cells. Data normalized to ACTB and presented relative to the non-targeting (NT) siRNA pool. e, Fold changes in prime editing outcomes across ten PE3 edits (substitutions, insertions and deletions) at five genomic loci in HEK293T cells with or without La depletion. Editing percentages are presented in Extended Data Fig. 3h. f, Top, schematic of the MCS reporter, including distances between the predicted SaCas9 cut site and sequences required for GFP expression. Bottom, flow cytometry analysis of MCS reporter cells with and without CRISPRi-mediated La depletion after induction of SaCas9-mediated DSB and unedited controls. Quantification presented in Extended Data Fig. 4a. g,h, Fold changes in editing outcomes induced with pegRNA (g) or sgRNA (h) using SaABE8e, SaBE4, SaCas9 or SaPE2 (PE4 approach, g only) in La-ko4 relative to parental K562 PEmax cells (intended edits only). Editing percentages presented in Extended Data Fig. 4c–f. Editing components were delivered by plasmid transfection in b,c and e–h. Data and error bars in b and c indicate the mean ± s.d. (n = 4 and 3 independent biological replicates, respectively). Horizontal bars in d and e indicate geometric means (n = 3 independent biological replicates) and medians of fold changes (10 edits, each with n = 4 independent biological replicates plotted individually), respectively. Data in g and h represent ratios of means for individual editing outcomes (n = 3 independent biological replicates for each outcome).

