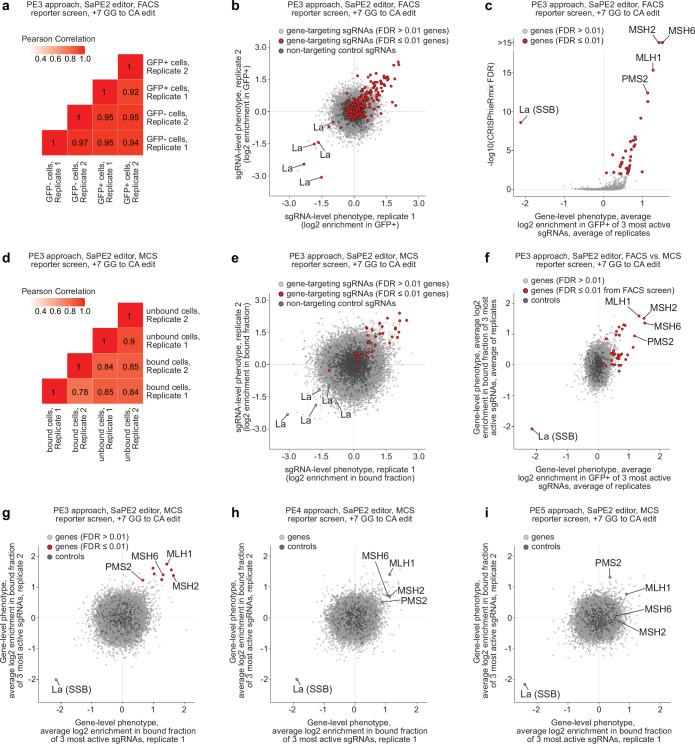
Extended Data Fig. 2. Results of genome-scale CRISPRi screens performed with FACS and MCS reporters.
a, Pearson correlations of read counts per sgRNA between each pair of samples isolated from the genome-scale FACS screen performed with the PE3 approach. b, sgRNA-level phenotypes from each replicate of the genome-scale FACS screen. Phenotypes represent enrichment of normalized sgRNA counts in GFP+ over GFP- populations after prime editing. c, Gene-level phenotypes (average of replicates) and per gene FDRs from the genome-scale FACS screen. FDRs determined by CRISPhieRmix16. For MSH2 and MSH6, CRISPhieRmix reports an FDR of 0, which we adjusted for plotting. d, Pearson correlations of read counts per sgRNA between each pair of samples isolated from the genome-scale MCS screen performed with the PE3 approach. e, sgRNA-level phenotypes from each replicate of the genome-scale MCS screen performed with the PE3 approach. Compare to b for screen-to-screen differences in technical variability. f, Gene-level phenotypes (average of replicates) from genome-scale FACS and MCS screens performed with the PE3 approach. g-i, Gene-level phenotypes from each replicate of MCS reporter screens performed with the PE3 (g), PE4 (h) and PE5 (i) approaches. sgRNAs targeting genes identified as hits (FDR ≤ 0.01, CRISPhieRmix) from the associated screen are indicated in red in b and e. Genes identified as hits (FDR ≤ 0.01, CRISPhieRmix) from the associated screen in c and g and from the FACS screen in f are indicated in red.

