Abstract
Aims
Echocardiography is a cornerstone in cardiac imaging, and left ventricular (LV) ejection fraction (EF) is a key parameter for patient management. Recent advances in artificial intelligence (AI) have enabled fully automatic measurements of LV volumes and EF both during scanning and in stored recordings. The aim of this study was to evaluate the impact of implementing AI measurements on acquisition and processing time and test–retest reproducibility compared with standard clinical workflow, as well as to study the agreement with reference in large internal and external databases.
Methods and results
Fully automatic measurements of LV volumes and EF by a novel AI software were compared with manual measurements in the following clinical scenarios: (i) in real time use during scanning of 50 consecutive patients, (ii) in 40 subjects with repeated echocardiographic examinations and manual measurements by 4 readers, and (iii) in large internal and external research databases of 1881 and 849 subjects, respectively. Real-time AI measurements significantly reduced the total acquisition and processing time by 77% (median 5.3 min, P < 0.001) compared with standard clinical workflow. Test–retest reproducibility of AI measurements was superior in inter-observer scenarios and non-inferior in intra-observer scenarios. AI measurements showed good agreement with reference measurements both in real time and in large research databases.
Conclusion
The software reduced the time taken to perform and volumetrically analyse routine echocardiograms without a decrease in accuracy compared with experts.
Keywords: echocardiography, systolic function, deep learning, machine learning, reproducibility, observer variability
Graphical Abstract
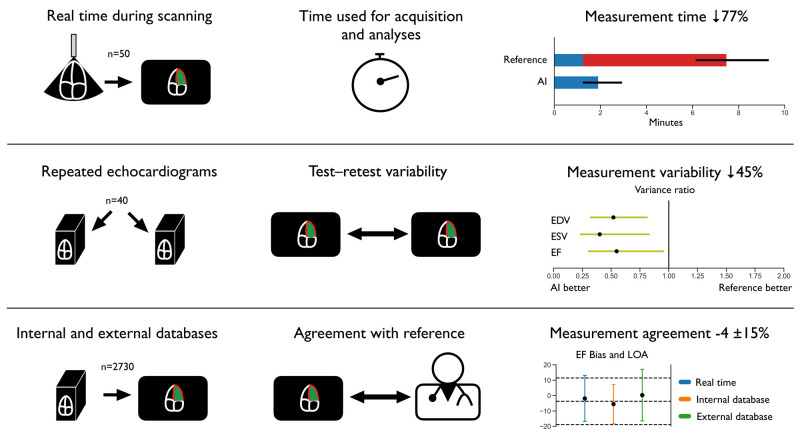
Structured Graphical Abstract.
Impact of implementing artificial intelligence-supported measurements of left ventricular volumes and ejection fraction in echocardiography. AI, artificial intelligence; EDV, end-diastolic volume; EF, ejection fraction; ESV, end-systolic volume; LOA, limits of agreement; n, number of subjects.
Introduction
Echocardiography is a cornerstone in cardiac imaging. Left ventricular (LV) ejection fraction (EF), the proportion of blood ejected during systole, is the single most used and well-studied echocardiographic parameter of LV systolic function and a key variable for guideline-directed decisions of treatment strategies and prognostication in patients with heart failure, myocardial infarction, valvular disease, arrhythmias, and anti-cancer treatment.1–6 Volumetric LV measurements should also be taken into account when evaluating LV function.7 A low LV EF may be accompanied by a large volume, while a very high EF may be characterized by a very small LV volume.7,8 However, present methods for quantification of LV EF are time-consuming with significant inter-observer variability which challenges clinical interpretation.9 Due to the tedious and repetitive work, quantitative measurements of LV volumes and EF are not always performed and rarely performed in repeated cardiac cycles. In busy clinical work, LV volumes and EF measurements may be replaced by a visual semi-quantitative assessment, hampered by even larger observer-related variability and lower sensitivity to detect LV dysfunction.10 Thus, to improve the clinical value of echocardiography, it is mandatory to improve reproducibility and the proportion of accurately quantified measurements of LV volumes and EF. This has the potential to benefit millions of patients worldwide.11
It has recently been shown that deep convolutional neural networks, a subcategory of artificial intelligence (AI) algorithms, allow for automatic measurements of LV volumes and EF.12–15 We have developed a method for fully automatic analyses of LV volumes at end-diastole and end-systole as well as EF from apical four- and two-chamber views.16 The method can automatically perform all tasks needed within milliseconds and is thus able to run in real time during echocardiographic scanning as well as to retrospectively extract the same quantitative measurements from large databases. In the current study, we extended this algorithm with the development of dedicated segmentation networks for end-diastolic and end-systolic frames as well as a procedure for averaging three cardiac cycles in two view planes.
The aims of the study were to evaluate whether the novel AI method could be used to improve quantification of LV volumes and EF by reducing the acquisition and processing time and test–retest variability while providing measurements in agreement with reference. Study objectives were to evaluate if assessment of LV volumes and EF by the AI method would reduce acquisition and processing time when used in real time compared with standard clinical workflow, provide measurements with improved test–retest reproducibility compared with inter- and intra-observer analyses, and provide good agreement with echocardiographic reference methods in large internal and external databases when all recordings were acquired by experienced users.
Methods
Study populations
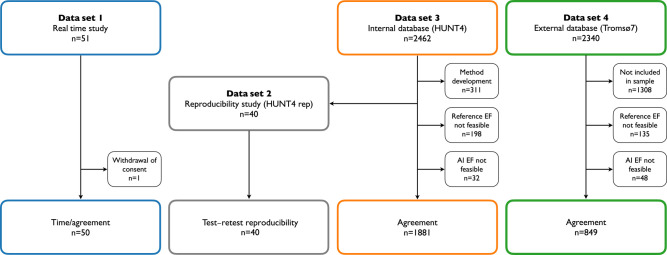
The study design and the study populations are illustrated in Figure 1. The total acquisition and processing time and agreement with manual reference measurements were evaluated in a prospective trial (Data set 1) of 50 consecutive patients where the AI measurement support software was used in real time during echocardiographic scanning and compared with standard diagnostic procedure. Test–retest reproducibility of AI and reference measurements was compared retrospectively in a data set (Data set 2) of 40 participants. Agreement with reference measurements was further evaluated in a large internal database (Data set 3) from the fourth wave of the Trøndelag Health Study (HUNT4) including 2462 participants from the echocardiographic substudy (HUNT4Echo) and a large external database (Data set 4) including a random sample of 1032 participants from the seventh survey of the Tromsø Study (Tromsø7). Full details are shown in the Supplementary Material.
Figure 1.
Study design. Flowchart showing distribution of subjects in the different substudies. Abbreviations: AI, artificial intelligence; EF, ejection fraction; HUNT, Trøndelag Health Study; n, number of subjects.
Overview of imaging data and reference measurements
Data sets 1 and 2 consisted of repeated echocardiograms where each subject was scanned twice by two different operators without time delay, while Data sets 3 and 4 included single echocardiograms only. All echocardiographic examinations were performed using GE Vivid E95 scanners (GE HealthCare, Horten, Norway), with M5S or 4Vc phased-array transducers, except in Data set 4 (Tromsø7) where Vivid E9 was used. Measurements of LV volume and EF were done in apical four-chamber view and apical two-chamber view. The reference measurements were obtained using Simpson’s biplane method in all data sets, except for Data set 4 where a semi-automatic, tracking-based method (GE Healthcare, ‘AutoEF’) was used with manual adjustments. Three-dimensional (3D) echocardiograms were available from Data sets 1 and 3 and analysed using the LVQ package. Additional details are shown in the Supplementary Material.
Echocardiographic details of the different data sets
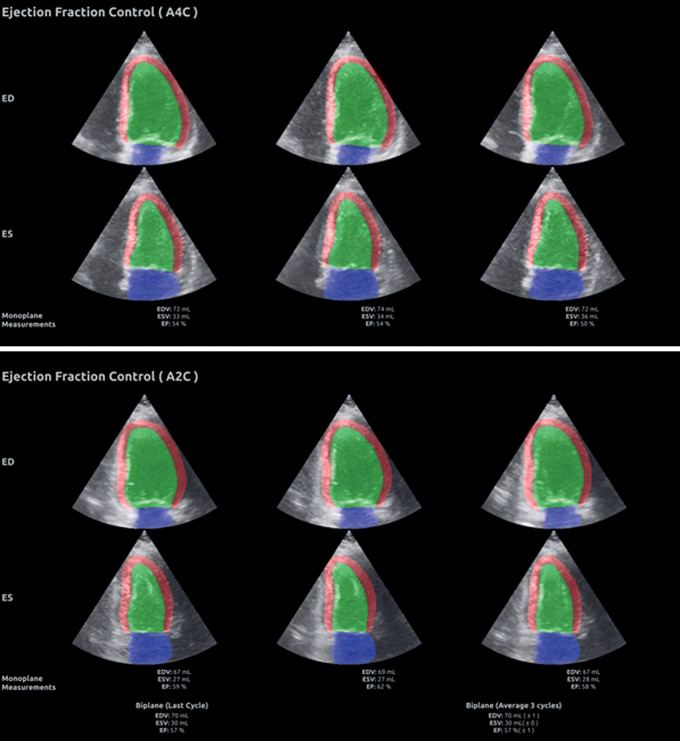
The repeated echocardiograms in Data set 1 were performed by three cardiologist experts in echocardiography (E.H., B.G., and H.D.) selected based on their hospital position. In random order, one of the experts performed the AI-supported examination without any preliminary training. The 2D B-mode images were streamed from the ultrasound scanner to a separate computer running the AI measurement support software in real time, overseen by the operator (Video 1). Immediately after, one of the other experts performed the second acquisition blinded to all details from the first examination, and subsequently, measurements of LV volumes and EF were obtained offline. For the AI-assisted examination, time registration started with placement of the transducer on the chest and ended when both the four-chamber view and the two-chamber view recordings and measurements were approved and stored. Correspondingly, the time used for acquisitions and analyses was measured for the reference examination. Time needed to record the two apical views was registered (from transducer was placed on the chest until both recordings were stored). In a separate sitting, time required for offline manual measurements, from the start of analysis of the first recording until approval of biplane results, was registered and added to the acquisition time to quantify the total acquisition and processing time. Figure 2 shows the user interface that displayed the segmentation masks on top of the B-mode image for three consecutive cardiac cycles, as well as the automatically calculated volumes and EF during scanning. As the AI method was used for study purposes only, no patients were put at risk.
Figure 2.
Summary screen of the segmentation masks with LV volumes and EF measurements. The upper panel shows the segmentation masks with measurements of LV volumes at end-diastole and end-systole as well as EF for three consecutive cardiac cycles obtained from apical four-chamber view. The lower panel shows the similar results for apical two-chamber view. At the bottom of the lower panel, the AI measurements based on biplane recordings are shown.
Details regarding acquisition of echocardiographic data in Data set 2 (the test–retest reproducibility study) and Data set 3 (HUNT4Echo) have recently been published.17,18 The repeated echocardiograms in Data set 2 were analysed by four experienced operators, while two experienced sonographers obtained the reference measurements in Data set 3. The image data in Data set 4 were acquired by one sonographer and one cardiology fellow (M.S.) performed all reference measurements. The 3D recordings in Data sets 1 and 3 were analysed by the same operators as stated above.
Further, two internal cardiologist experts reanalysed a sample of 100 echocardiograms from Data set 3 (B.G. and E.H.), and two external cardiologist experts reanalysed a similar sample of 100 echocardiograms from Data set 4 (A.R. and S.M.). Full details are shown in the Supplementary Material.
Details of the AI measurement method
The AI-based measurement method in this study builds upon the work presented in Smistad et al.16 For the measurements performed in real time (Data set 1), a dedicated view classification network was used to automatically identify the view plane of the recording.19 Automatic view classification was not used in the remaining data sets, where the AI measurements were performed in the same recordings that were used for reference measurements, except for the reproducibility data set (Data set 2) where the recordings measured by the majority of the four operators were used.
Additionally for all AI measurements, we used two convolutional neural networks in sequence: a timing network and a segmentation network. The segmentation network was built on the U-net architecture described in Leclerc et al. and Smistad et al.13,20,21 The ultrasound image was used as input and the network classified the pixels as corresponding to the LV cavity, the left atrial cavity, LV myocardium, or background. An automatic tracing of the endocardial border was generated from the output of the network and made available for inspection by the clinician. Although it is possible to measure all frames of every recording, the validation was focused on aggregated end-diastolic and end-systolic measurements from three cardiac cycles in two view planes in line with the recommendations.22 The biplane volumes were calculated by the method of disk summation using automatic tracings from all possible combinations of three cardiac cycles in two view planes. LV EF was calculated from the averaged end-diastolic volumes (EDV) and end-systolic volumes (ESV) (see Supplementary Material).
Subjects whose recordings were utilized for training of the segmentation networks were excluded from the analyses (Figure 1). The method was validated on the data sets by direct application without further adjustment. Additional details are provided in the Supplementary Material. Importantly, no changes were made to the AI software during the study period.
Statistical analyses
Data distribution was evaluated by inspection of histograms and quantile–quantile plots. Normally distributed continuous data are presented as mean (SD), while non-normally distributed data are presented as median [interquartile range (IQR)]. Proportions are presented as numbers and percentages. As the acquisition and processing time in Data set 1 was skewed, we compared the groups by Wilcoxon signed-rank test.
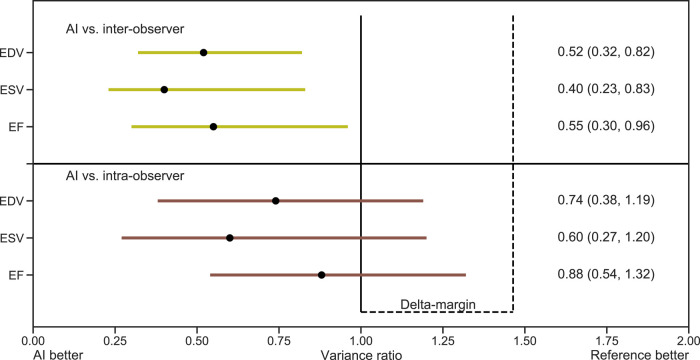
For the inter- and intra-observer scenarios in Data set 2, each subject’s mean variance was calculated from all squared differences divided by two. Variance ratios were sampled with replacement 100,000 times for the generation of bootstrap estimates of 95% confidence intervals (CI) for the superiority and non-inferiority analyses (corresponding to two one-sided tests with α = 0.025). The chosen number of bootstrap samples was based on the trade-off between high number of iterations and computation time. For the non-inferiority testing, we specified a delta margin of 46% increase in variance, corresponding to a 21% increase in standard error of measurement (SEM), as acceptable given the advantage of reduced total time for acquisition and processing. The delta margin was based on the observed between examinations intra-observer SEM from our sample of four observers in Data set 2, where the highest SEM was 32, 42, and 21% higher than the mean SEM for EDV, ESV, and EF, respectively. The minimal detectable change was calculated by 2.77 × SEM.
Comparison of methods in Data sets 1, 3, and 4 were performed by Bland–Altman analyses with limits of agreement (LOA). For the expert reanalysis data in Data sets 3 and 4, the mean of two experts’ measurements was used as reference. Comprehensive details are shown in the Supplementary Material.
Statistical analyses were performed in Python (Python Software Foundation, Delaware, USA) using open-source packages Pandas, NumPy, and SciPy. A P < 0.05 was considered statistically significant.
Ethical approval
All parts of the study were approved by the Regional Committee for Medical and Health Research Ethics (REK) (Real-time, REK 2019/1059; HUNT4, REK 2018/2416; Tromsø7, 2009/2536). All participants provided their written informed consent prior to inclusion, with specific details of the AI method in Data set 1 and with broad consents in Data sets 2–4. The study was conducted in compliance with the ethical principles of the Declaration of Helsinki. Personal data security and data handling were approved by the institutional personal data officers and handled according to regulations. The National Association of Heart and Lung Diseases was involved in all aspects of the study.
Results
The baseline characteristics of the study populations are shown in Table 1. Mean age ranged from 56 to 61 years, and females constituted 34–54% of the population in the different data sets. Further, cardiac diseases such as coronary heart disease and atrial fibrillation ranged 2.5–32% and 5.1–20%, respectively. The AI measurements were feasible in 100, 98, and 95% of the manually measured recordings from Data sets 1–2, 3, and 4, respectively. The main echocardiographic measurements by AI and reference are summarized according to the originating data sets in Table 2. Mean LV EDV and EF were ≤132 mL and ≥53% by echocardiographic reference method in all data sets, respectively.
Table 1.
Basic characteristics of the study population
| Data set 1 | Data set 2 | Data set 3 | Data set 4 | |
|---|---|---|---|---|
| (real time) | (HUNT4 rep) | (HUNT4) | (Tromsø7) | |
| Number of subjects | 50 | 40 | 1881 | 849 |
| Age, years | 60.6 (16.9) | 61.5 (12.7) | 61.0 (12.8) | 56.1 (8.8) |
| Female sex | 17 (34.0%) | 19 (47.5%) | 921 (49.0%) | 460 (54.2%) |
| Height, cm | .. | 172.4 (9.2) | 172.5 (9.2) | 171.0 (9.4) |
| Weight, kg | .. | 84.3 (16.1) | 78.2 (14.1) | 78.7 (15.1) |
| Systolic BP, mmHg | 138.2 (18.5) | 131.2 (17.7) | 130.7 (18.4) | 128.3 (20.4) |
| Diastolic BP, mmHg | 83.7 (11.6) | 74.5 (10.6) | 75.3 (9.9) | 75.4 (10.9) |
| Heart rate, bpm | 76.5 (16.0) | 71.6 (12.4) | 68.7 (12.0) | 67.2 (11.0) |
| Coronary heart disease | 16 (32.0%) | 1 (2.5%) | 83 (4.4%) | 60 (7.1%) |
| Atrial fibrillation/flutter | 8 (16.0%) | 8 (20.0%) | 279 (14.8%) | 43 (5.1%) |
| Hypertension | 20 (40.0%) | 13 (32.5%) | 331 (17.6%) | 165 (19.4%) |
| Heart failure | 5 (10.0%) | 2 (5.0%) | 50 (2.7%) | 10 (1.2%) |
| Valvular disease | 12 (24.0%) | 4 (10.0%) | 60 (3.2%) | .. |
| Diabetes mellitus | 7 (14.0%) | 5 (12.5%) | 59 (3.1%) | 36 (4.2%) |
| COPD/asthma | 6 (12.0%) | 4 (10.0%) | 115 (6.1%) | 140 (16.5%) |
Data are presented as mean (SD) or numbers (%) as relevant.
BP, blood pressure; COPD, chronic obstructive pulmonary disease; HUNT, Trøndelag Health Study; rep, test–retest reproducibility.
Table 2.
Echocardiographic measurements by AI measurement support software and reference in the different data sets
| Data set 1 | Data set 2 | Data set 3 | Data set 4 | |
|---|---|---|---|---|
| (real time) | (HUNT4 repa) | (HUNT4) | (Tromsø7) | |
| EDV AI, mL | 120.5 (38.6) | 106.7 (26.6) | 100.6 (26.7) | 96.9 (24.5) |
| ESV AI, mL | 61.2 (31.6) | 49.2 (17.0) | 46.9 (15.4) | 43.5 (14.0) |
| EF AI, % | 50.9 (9.7) | 54.2 (7.3) | 53.6 (6.8) | 55.4 (6.4) |
| EDV reference, mL | 132.1 (41.1) | 115.8 (30.5) | 108.9 (32.7) | 90.4 (23.8) |
| ESV reference, mL | 65.2 (36.3) | 50.4 (18.9) | 44.7 (17.2) | 40.8 (13.5) |
| EF reference, % | 52.8 (10.7) | 57.1 (6.2) | 59.1 (6.6) | 55.1 (7.1) |
| EDV differenceb, mL | −11.6 (17.5) | −9.1 (8.4) | −8.3 (14.4) | 6.5 (14.0) |
| ESV differenceb, mL | −4.0 (14.6) | −1.2 (6.0) | 2.2 (8.8) | 2.7 (11.2) |
| EF differenceb, % | −1.9 (7.6) | −2.9 (4.0) | −5.5 (6.5) | 0.3 (8.6) |
Mean (SD) for absolute values of measurements grouped by data set.
AI, artificial intelligence; EDV, end-diastolic volume; EF, ejection fraction; ESV, end-systolic volume; HUNT, Trøndelag Health Study; rep, test–retest reproducibility.
aValues are averages of all available measurements by each method for all subjects.
bPaired differences calculated as AI minus reference.
Acquisition and processing time
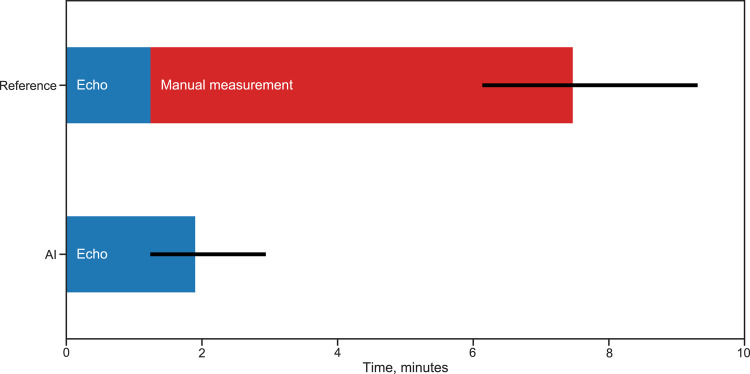
The time used for the combination of echocardiographic image acquisition and analyses of LV volumes and EF in Data set 1 was significantly reduced by the AI measurement support software (Figure 3). The total acquisition and processing time per patient was median (IQR) 1.9 min (1.2–2.9) for the AI-assisted examination and 7.5 min (6.1–9.3) for the reference examination. Median (IQR) reduction was 5.3 min (4.0–7.9), corresponding to 77% (65–85%) of the time saved using real time AI measurements compared with manual measurements. Additionally, the total acquisition and processing time was lower using AI in 49 of 50 patients (P < 0.001). It was a minor increase in acquisition and processing time for the LV volume and EF measurements of median (IQR) 0.5 min (−0.3 to 1.6) when AI measurements were implemented, whereas a large time reduction was achieved by eliminating the need for post-acquisition analyses.
Figure 3.
Acquisition and processing time by AI measurements compared with standard clinical workflow. Median acquisition and processing time for evaluation of left ventricular volumes and ejection fraction in our sample of 50 subjects examined both with standard clinical methodology (reference) and with real time AI support (AI). Error bars represent interquartile range. The time required for post-acquisition manual measurements is relieved as quality-controlled quantitative measurement results are available at the end of the AI-supported examination.
Variability of test–retest measurements
Figure 4 shows that the AI measurements were superior to reference measurements of LV volumes and EF in Data set 2 with respect to test–retest variability between different operators (inter-observer scenario). Additionally, the AI measurements were non-inferior to test–retest measurements within operators (intra-observer scenario) using the delta margin of 1.46. In the latter, the finding of variance ratios below 1 indicated a tendency towards superiority of AI measurements even in the intra-observer scenario, but this was not statistically significant. The minimal detectable changes for manual measurements of LV EDV in the inter- and intra-observer scenarios were 42.7 and 35.8 mL. The corresponding values for LV ESV were 25.8 and 21.1 mL, while for LV EF, the corresponding values were 16.2 and 12.8% points. By the AI method, all the corresponding minimal detectable changes were lower (EDV 30.8 mL, ESV 16.3 mL, and EF 12.0% points, respectively).
Figure 4.
Test–retest reproducibility of AI measurements compared with manual measurements. Test–retest reproducibility presented as variance ratios with bootstrap CI for AI measurements compared with reference. The horizontal lines and numbers in parentheses represent 95% CI for superiority. The upper (right) ends of the horizontal lines represent 97.5% one-sided CI for non-inferiority. Upper panel: All 95% CI were below the variance ratio of 1.0, indicating superiority of AI compared with the inter-observer scenarios. Lower panel: The upper ends of the CI were between 1.0 and the prespecified margin of 1.46, indicating non-inferiority of AI compared with the intra-observer scenarios. Abbreviations: AI, artificial intelligence; EDV, end-diastolic volume; EF, ejection fraction; ESV, end-systolic volume.
Agreement in real time and large internal and external databases
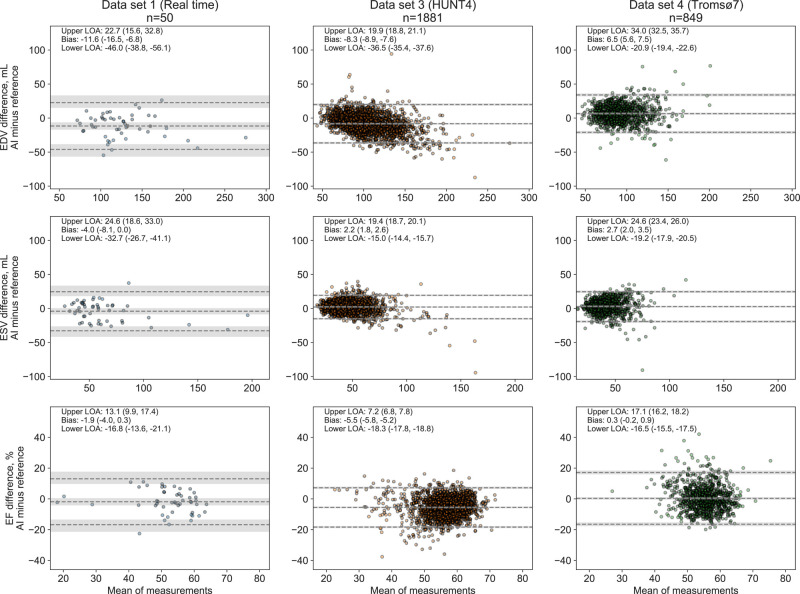
The averaged differences between AI measurements and reference ranged from −11.6 to 6.5 mL for LV EDV, −4.0 to 2.7 mL for LV ESV, and −5.5 to 0.3% points for EF (where negative values indicate underestimation by AI). Supplementary data online, Figure S4 demonstrates the high correlation of LV volume measurements by the two echocardiographic methods in Data sets 1, 3, and 4, as well as the low proportion of participants with reduced EF in Data set 4.
The agreement of AI measurements with reference in the different data sets is presented in Figure 5. In the real time study, there were no signs of association of the agreement between methods and the size of the measures, while there was a tendency for underestimation of large volumes in Data set 3 and overestimation of large volumes in Data set 4, compared with the reference measurements. A total of 334 subjects from Data sets 1, 3, and 4 had LV EF <50%. As shown in the Supplementary Material, the biases and LOA for LV volumes and EF in this group were mainly in line with the previously presented results, while the LOA for the ESV measurements in the population studies were somewhat wider, and AI measurements overestimated EF (9.1% points) in Data set 4.
Figure 5.
Agreement of the AI measurement support software and echocardiographic reference measurements of left ventricular volumes and ejection fraction in real time, internal, and external databases. Estimates of bias and LOA are presented as numbers and stapled lines. Numbers in parentheses and shaded areas correspond to 95% CI. Abbreviations: LOA, limits of agreement, otherwise as in Figures 1 and 4.
Agreement with 3D echocardiography
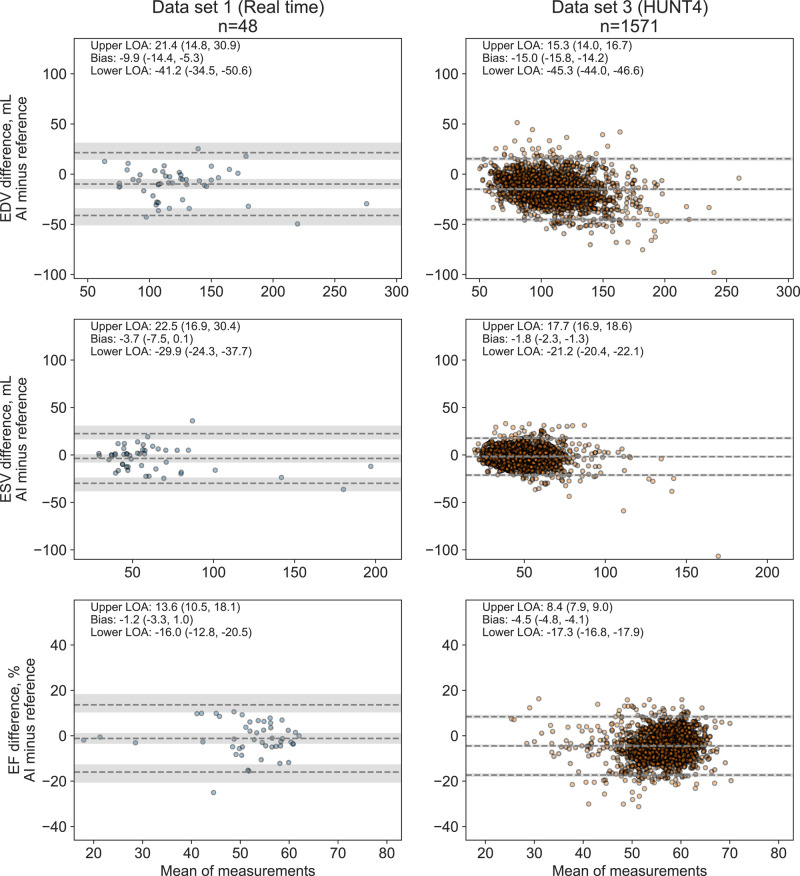
The agreement of AI measurements from 2D echocardiography with reference measurements from 3D echocardiography was in line with the 2D results. Shortly, AI measurements were somewhat underestimated compared with 3D references with biases in Data sets 1 and 3 for EDV (10 and 15 mL, respectively), ESV (4 and 2 mL, respectively), and EF (1 and 4% points, respectively). Bland–Altman plots of the comparison are provided in Figure 6.
Figure 6.
Agreement between AI measurements from 2D echocardiography and reference measurements from 3D echocardiography. Abbreviations: as in Figures 1, 4, and 5.
Comparison with expert readers in Data sets 3 and 4
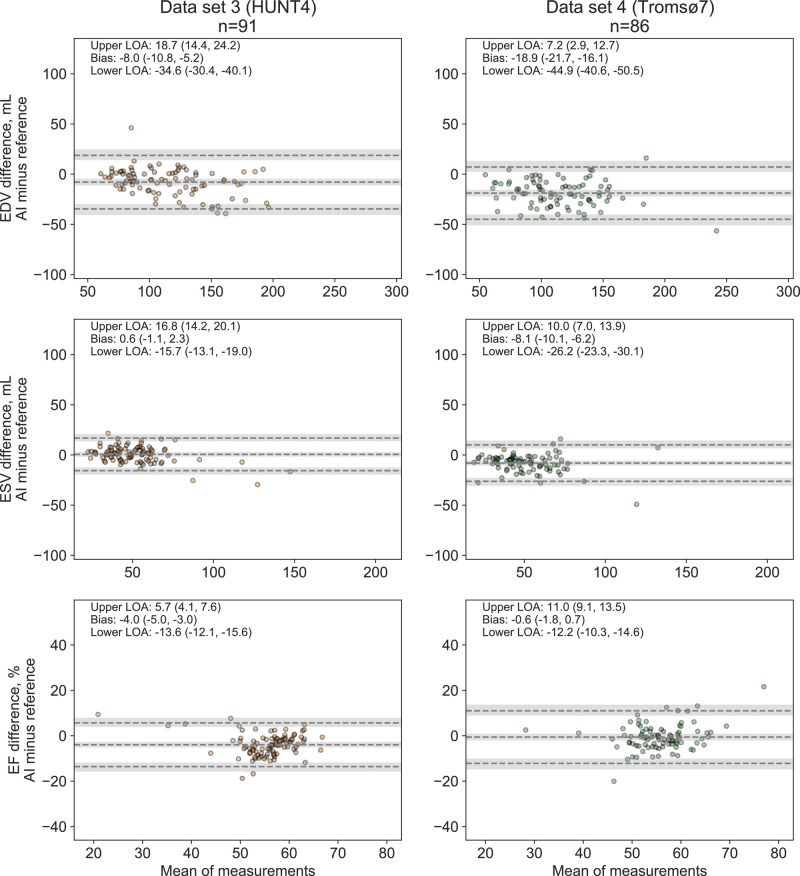
The agreement of the AI measurements with the experts’ measurements in the reanalysis subsamples from Data sets 3 and 4 is shown in Figure 7. Compared with the expert reference, the AI measurements underestimated LV EDV with 8.0 and 18.9 mL in Data sets 3 and 4, respectively. The corresponding biases for LV EF were −4.0 and −0.6% points. Interestingly, of the 50 largest outliers in Data sets 3 and 4 combined, 9 were rejected by one of the experts due to insufficient image quality, and for 28 (68%) of the 41 remaining subjects, the expert reanalyses were closer to the AI measurement than the original reference. The few remaining outliers in Figure 7 were mainly due to the AI method failing to identify the anatomy of the LV (e.g. inclusion of the left atrium or right ventricle as left ventricular myocardium). All were easily identifiable in hindsight by human operator quality control (see Supplementary data online, Figure S6).
Figure 7.
Agreement between the AI measurements and averaged expert measurements of left ventricular volumes and ejection fraction in the reanalysis subsamples. Abbreviations: as in Figures 1, 4, and 5.
Discussion
This is to the best of our knowledge among the most comprehensive validation studies of AI measurements of LV volumes and EF and the first to evaluate the use of fully automatic segmentation of myocardial structures combined with automatic measurements to provide real time measurements of LV volumes and EF during echocardiographic acquisition. The main findings are presented in the Graphical Abstract. First, by using the AI measurements of LV volumes and EF in real time, 77% (5.3 min) of the time used for the combination of echocardiographic acquisition and interpretation was saved. Second, the AI measurements demonstrated superior reproducibility of LV volumes and EF compared with inter-observer measurements and were non-inferior to repeated measurements within experienced operators. Furthermore, the AI measurements were feasible and well aligned to reference measurements of LV volumes and EF in real time and large cross-sectional population studies. Additionally, the comparison with 3D echocardiography showed agreement well aligned to the 2D results. We believe these findings show the great potential of AI measurements of important echocardiographic parameters in real time.
AI measurements of LV volumes and EF in real time
It has previously been shown by us and others that automatic measurements of archived echocardiograms are feasible and can provide acceptable agreement with manual reference measurements.12,23–25 To our knowledge, no previous studies have tested the use of AI measurements in real time during echocardiographic scanning with immediate feedback to the operator who can decide whether to approve the measurements or adjust the recording. A few studies have evaluated AI measurements of LV volumes and EF using commercial software on hand-held ultrasound devices, as well as semi-automatic AI-supported measurements in post-acquisition analyses.26–29 Importantly, the concept of finalizing the measurements during echocardiographic scanning allows for optimization of the recordings with minimal time delay based on the direct feedback provided to the user. One important issue that often limits interpretation and measurements in clinical echocardiography is image artefacts, which may be overlooked during image acquisition but have a negative impact on the accuracy of quantitative measurements. As the segmentation masks and measurements by the novel AI software are shown to the operator for every cardiac cycle, the recordings can be adjusted to ensure best possible image quality for consistent and accurate measurements. Once the exam is finished, such adjustments may interfere with in-hospital workflow and have a significantly larger cost.
We showed a highly significant reduction in the total acquisition and processing time of 77% (median 5.3 min) by using real time AI measurements of LV volumes and EF compared with standard care. Importantly, this may increase the proportion of examinations with adequate quantitative image analysis and thus impact clinical practice. Increasing the proportion of properly quantified echocardiograms is mandatory to increase its diagnostic yield and thereby improve the care for large patient groups across the world.
Variability of LV measurements by AI and manual references
Manual measurements of EF are associated with considerable inter-observer variability with LOA rarely below ±15% points in reanalyses of the same images.29–31 Data from test–retest scenarios including separate recordings are rarely presented. In Data set 1, we evaluated the agreement between methods when measurements were done in two separate echocardiograms. The presented LOA for volumetric measurements were acceptable, considering previous findings showing that repeated analyses of the same recordings underestimate the more clinically meaningful inter-observer variability of separate examinations with ∼40%.9 The biases and LOA were numerically lower when 3D echocardiography was used as reference in the real time study. However, these differences were clinically not meaningful.
The results from Data set 2 showed superior test–retest reproducibility of AI measurements in inter-observer scenarios. This adds to the findings by others who have reported reduced variability of AI measurements compared with standard care.23,24 The clinical impact of these studies is further supported by reports of even higher variability by visual assessment of EF,10 and due to time constraints, the recommended approach of measuring LV EF and volumes in more than one cardiac cycle is rarely performed in the everyday clinic.22 As AI measurements were performed in three cardiac cycles as opposed to single-cycle reference measurements, the observed time reduction is even more impressive. The delta margin used in the analyses was based on the variability between the four operators. Even if we had specified a stricter delta margin, this would not have altered the conclusions, as shown by Figure 4.
Inter-observer variability also challenges the development and validation of the segmentation networks underlying the AI measurements used in this study (see Supplementary Material). There is no clear consensus on how to trace the endocardial border, and it may be difficult to differentiate between compact myocardium and trabeculations.22 The initial version of the AI software was trained on data from the open CAMUS data set, which in our opinion included too much of the trabeculations and papillary muscles into the myocardium, with subsequent underestimation of LV volumes.13,16 This also highlights the importance of ensuring the representativeness of the training data and the challenges of manual measurements of LV volumes and EF.
The findings of different biases of volumetric AI measurements vs. reference in the different databases were expected and indicate systematic differences between the observers performing the reference measurements. The finding of somewhat wider LOA for LV EF in the external Data set 4 compared with the internal data set may be due to observer variability but also to the fact that measurements were performed using a different method (AutoEF). In the expert reanalyses of a subsample of Data set 4 using Simpson’s method, the width of the LOA for LV EF was ±11.6% points compared with ±16.8% points in the original full Data set 4 and not significantly wider than in the expert reanalyses of the internal Data set 3. However, as this was a selected subsample, comparison should be done with caution. These findings indicate good generalizability of the AI measurements to the external data set and that the excess random variation in Data set 4 may be partly explained by different operators performing the reference measurements and the use of different methods for measurements.32
Considering the observer variability of manual measurements, the between-data set biases were within the ranges of what could be expected by a well-functioning AI software. In Data set 2 (test–retest reproducibility), mean LV EF measured by the four observers ranged from 53.5 to 60.1%, and the AI measurements were within this range. Similar findings were also made for LV volumes. The relatively high minimal detectable changes observed in Data set 2 may relate to inclusion of a significant number of individuals with atrial fibrillation, obesity, and challenging image quality.17 In the expert reanalyses in Data sets 3 and 4, mean LV EDV was within 7 mL from the AI measurement for three of four experts, while the fourth expert measured on average 32 mL larger volumes. Overall, agreement with expert measurements was good, with mean LV EF as measured by the four separate experts ranging from 6% points higher to 1% points lower than the AI measurements.
Comparing the current results to previous studies presenting agreement as mean, median, and 95th percentile of absolute differences, as well as root mean square error, we found that the agreement of AI measurements of LV volumes and EF with reference was better than presented in two of three relevant studies12,23 and similar to Ouyang et al.24 which only presented AI measurements of EF based on a single four-chamber view (see Supplementary data online, Table S1). Other studies have also shown that AI-supported measurements may be feasible and beneficial in the clinical workflow, although these results are not directly comparable to the current study.25,33
We believe that the presented or similar deep learning algorithms will be implemented into clinic in a short time. The advantages of the presented AI measurements relate to the ability to run in real time, easy evaluation by the operator, robust measurements, and significant time saving for the combination of echocardiographic scanning and measurements. Prior to broad implementation, future studies should evaluate the method across the spectrum of cardiac diseases, LV function, and image quality.
Limitations
A limitation of the study is the relatively low proportion of subjects with large LV volumes and/or low EF, severe valvular or myocardial diseases, or non-normal anatomy. However, the data were promising indicating no signs of reduced feasibility or lower agreement when LV volume exceeded 200 mL even though the numbers were low. Another minor limitation is that the reference measurements in the external Data set 4 were performed using a semi-automatic method. However, expert reanalyses of a subsample of this cohort were performed by the recommended Simpson’s biplane method.
One of the three experts involved in Data set 1 had also annotated half of the training data for the segmentation network, which may have influenced the agreement between operators in this data set. However, none of the experts performing reanalyses in the internal and external data sets was involved in generation of training data. As all echocardiographic imaging data are vendor-specific, future studies must evaluate the performance of the AI measurements on recordings made by scanners from other vendors. It would be expected that the time savings by the presented method would have been less if other automatic or semi-automatic methods were used as reference. Still, we believe that the presented method represents a significant step forward as measurements from three consecutive cardiac cycles can be evaluated in real time by the operator during scanning. Thus, this method complies better with the recommendations than other available methods.
Finally, the lack of validation of the AI measurements with respect to cardiac magnetic resonance imaging (MRI) is a limitation. Cardiac MRI has generally been considered a reference method for volumetric measurements. The minor underestimation of AI measurements from 2D echocardiography was less than several previous studies comparing 2D echocardiography with 3D echocardiography or cardiac MRI but well aligned to a recent publication by our group highlighting the importance of guideline-directed chamber-specific recordings when performing 2D echocardiography.18,34,35 However, the comparison with 3D showed similar results as for 2D echocardiography and adds strength to the results.
Conclusions
We present one of the most comprehensive validation studies of AI measurements of LV volumes and EF of today, proving (i) a significantly reduced acquisition and processing time of 77% (median 5.3 min) for echocardiographic acquisition and measurements when used in real time, (ii) superior test–retest variability in inter-observer scenarios and non-inferior variability in intra-observer scenarios, and (iii) excellent feasibility in large internal and external databases with good agreement with reference within the domain of LV EF 45–60%. The results support the implementation of fully automatic real time AI measurements of LV volumes and EF during echocardiographic acquisition to improve patient care but future studies should evaluate performance of the method across the spectrum of cardiac diseases, LV systolic function, and image quality.
Supplementary data
Supplementary data are available at European Heart Journal - Cardiovascular Imaging online.
Supplementary Material
Acknowledgements
The HUNT Study is a collaboration between the HUNT Research Centre, Nord-Trøndelag County Council, Central Norway Health Authority, and the Norwegian Institute of Public Health.
Contributor Information
Sindre Olaisen, Centre for Innovative Ultrasound Solutions, Department of Circulation and Medical Imaging, Norwegian University of Science and Technology, Prinsesse Kristinas Gate 3, 7030 Trondheim, Norway.
Erik Smistad, Centre for Innovative Ultrasound Solutions, Department of Circulation and Medical Imaging, Norwegian University of Science and Technology, Prinsesse Kristinas Gate 3, 7030 Trondheim, Norway; Medical Image Analysis, Health Research, SINTEF Digital, Trondheim, Norway.
Torvald Espeland, Centre for Innovative Ultrasound Solutions, Department of Circulation and Medical Imaging, Norwegian University of Science and Technology, Prinsesse Kristinas Gate 3, 7030 Trondheim, Norway; Clinic of Cardiology, St.Olavs Hospital, Trondheim University Hospital, Prinsesse Kristinas Gate 3, 7030 Trondheim, Norway.
Jieyu Hu, Centre for Innovative Ultrasound Solutions, Department of Circulation and Medical Imaging, Norwegian University of Science and Technology, Prinsesse Kristinas Gate 3, 7030 Trondheim, Norway.
David Pasdeloup, Centre for Innovative Ultrasound Solutions, Department of Circulation and Medical Imaging, Norwegian University of Science and Technology, Prinsesse Kristinas Gate 3, 7030 Trondheim, Norway.
Andreas Østvik, Centre for Innovative Ultrasound Solutions, Department of Circulation and Medical Imaging, Norwegian University of Science and Technology, Prinsesse Kristinas Gate 3, 7030 Trondheim, Norway; Medical Image Analysis, Health Research, SINTEF Digital, Trondheim, Norway.
Svend Aakhus, Centre for Innovative Ultrasound Solutions, Department of Circulation and Medical Imaging, Norwegian University of Science and Technology, Prinsesse Kristinas Gate 3, 7030 Trondheim, Norway; Clinic of Cardiology, St.Olavs Hospital, Trondheim University Hospital, Prinsesse Kristinas Gate 3, 7030 Trondheim, Norway.
Assami Rösner, Department of Cardiology, University Hospital of North Norway, Tromsø, Norway; Institute for Clinical Medicine, UiT, The Arctic University of Norway, Tromsø, Norway.
Siri Malm, Institute for Clinical Medicine, UiT, The Arctic University of Norway, Tromsø, Norway; Department of Cardiology, University Hospital of North Norway, UNN Harstad, Tromsø, Norway.
Michael Stylidis, Department of Cardiology, University Hospital of North Norway, Tromsø, Norway; Department of Community Medicine, UiT, The Arctic University of Norway, Tromsø, Norway.
Espen Holte, Centre for Innovative Ultrasound Solutions, Department of Circulation and Medical Imaging, Norwegian University of Science and Technology, Prinsesse Kristinas Gate 3, 7030 Trondheim, Norway; Clinic of Cardiology, St.Olavs Hospital, Trondheim University Hospital, Prinsesse Kristinas Gate 3, 7030 Trondheim, Norway.
Bjørnar Grenne, Centre for Innovative Ultrasound Solutions, Department of Circulation and Medical Imaging, Norwegian University of Science and Technology, Prinsesse Kristinas Gate 3, 7030 Trondheim, Norway; Clinic of Cardiology, St.Olavs Hospital, Trondheim University Hospital, Prinsesse Kristinas Gate 3, 7030 Trondheim, Norway.
Lasse Løvstakken, Centre for Innovative Ultrasound Solutions, Department of Circulation and Medical Imaging, Norwegian University of Science and Technology, Prinsesse Kristinas Gate 3, 7030 Trondheim, Norway.
Havard Dalen, Centre for Innovative Ultrasound Solutions, Department of Circulation and Medical Imaging, Norwegian University of Science and Technology, Prinsesse Kristinas Gate 3, 7030 Trondheim, Norway; Clinic of Cardiology, St.Olavs Hospital, Trondheim University Hospital, Prinsesse Kristinas Gate 3, 7030 Trondheim, Norway; Department of Medicine, Levanger Hospital, Nord-Trøndelag Hospital Trust, Kirkegata 2, 7600 Levanger, Norway.
Funding
The study was funded by grants from the Norwegian University of Science and Technology, the Research Council of Norway, Central Norway Regional Health Authority, St. Olavs Hospital Universitetssykehuset i Trondheim, Helse Nord-Trøndelag, and Simon Fougner Hartmanns Familiefond.
Data availability
Measurement data are available from the public repository NTNU Open Research Data, https://dataverse.no/dataverse/ntnu (https://doi.org/10.18710/ZDSD2H). Due to limitations in the CIUS consortium agreement, the full software can not be made publicly available at this time.
References
- 1.Fried LP, Kronmal RA, Newman ABBild DE, Mittelmark MB, Polak JFet al. Risk factors for 5-year mortality in older adults: the Cardiovascular Health Study. JAMA 1998;279:585–92. [DOI] [PubMed] [Google Scholar]
- 2.Emond M, Mock MB, Davis KB, Fisher LD, Holmes DR, Chaitman BRet al. Long-term survival of medically treated patients in the Coronary Artery Surgery Study (CASS) registry. Circulation 1994;90:2645–57. [DOI] [PubMed] [Google Scholar]
- 3.McDonagh TA, Metra M, Adamo M, Gardner RS, Baumbach A, Böhm Met al. 2021 ESC guidelines for the diagnosis and treatment of acute and chronic heart failure. Eur Heart J 2021;42:3599–726. [DOI] [PubMed] [Google Scholar]
- 4.Vahanian A, Beyersdorf F, Praz F, Milojevic M, Baldus S, Bauersachs Jet al. 2021 ESC/EACTS guidelines for the management of valvular heart disease. Eur Heart J 2022;43:561–632. [DOI] [PubMed] [Google Scholar]
- 5.Zeppenfeld K, Tfelt-Hansen J, de Riva M, Winkel BG, Behr ER, Blom NAet al. 2022 ESC guidelines for the management of patients with ventricular arrhythmias and the prevention of sudden cardiac death. Eur Heart J 2022;43:3997–4126. [DOI] [PubMed] [Google Scholar]
- 6.Lyon AR, López-Fernández T, Couch LS, Asteggiano R, Aznar MC, Bergler-Klein Jet al. 2022 ESC guidelines on cardio-oncology developed in collaboration with the European Hematology Association (EHA), the European Society for Therapeutic Radiology and Oncology (ESTRO) and the International Cardio-Oncology Society (IC-OS). Eur Heart J 2022;43:4229–361. [DOI] [PubMed] [Google Scholar]
- 7.Marwick TH. Ejection fraction pros and cons: JACC state-of-the-art review. J Am Coll Cardiol 2018;72:2360–79. [DOI] [PubMed] [Google Scholar]
- 8.Kerkhof PL. Characterizing heart failure in the ventricular volume domain. Clin Med Insights Cardiol 2015;9s1:11–31. [DOI] [PMC free article] [PubMed] [Google Scholar]
- 9.Thorstensen A, Dalen H, Amundsen BH, Aase SA, Stoylen A. Reproducibility in echocardiographic assessment of the left ventricular global and regional function, the HUNT study. Eur J Echocardiogr 2010;11:149–56. [DOI] [PubMed] [Google Scholar]
- 10.Cole GD, Dhutia NM, Shun-Shin MJ, Willson K, Harrison J, Raphael CEet al. Defining the real-world reproducibility of visual grading of left ventricular function and visual estimation of left ventricular ejection fraction: impact of image quality, experience and accreditation. Int J Cardiovasc Imaging 2015;31:1303–14. [DOI] [PMC free article] [PubMed] [Google Scholar]
- 11.Reeves RA, Halpern EJ, Rao VM. Cardiac imaging trends from 2010 to 2019 in the Medicare population. Radiol Cardiothorac Imaging 2021;3:e210156. [DOI] [PMC free article] [PubMed] [Google Scholar]
- 12.Zhang J, Gajjala S, Agrawal P, Tison GH, Hallock LA, Beussink-Nelson Let al. Fully automated echocardiogram interpretation in clinical practice. Circulation 2018;138:1623–35. [DOI] [PMC free article] [PubMed] [Google Scholar]
- 13.Leclerc S, Smistad E, Pedrosa J, Ostvik A, Cervenansky F, Espinosa Fet al. Deep learning for segmentation using an open large-scale dataset in 2D echocardiography. IEEE Trans Med Imaging 2019;38:2198–210. [DOI] [PubMed] [Google Scholar]
- 14.Ghorbani A, Ouyang D, Abid A, He B, Chen JH, Harrington RAet al. Deep learning interpretation of echocardiograms. NPJ Digit Med 2020;3:10. [DOI] [PMC free article] [PubMed] [Google Scholar]
- 15.Jafari MH, Girgis H, Van Woudenberg N, Liao Z, Rohling R, Gin Ket al. Automatic biplane left ventricular ejection fraction estimation with mobile point-of-care ultrasound using multi-task learning and adversarial training. Int J Comput Assist Radiol Surg 2019;14:1027–37. [DOI] [PubMed] [Google Scholar]
- 16.Smistad E, Ostvik A, Salte IM, Melichova D, Nguyen TM, Haugaa Ket al. Real-time automatic ejection fraction and foreshortening detection using deep learning. IEEE Trans Ultrason Ferroelectr Freq Control 2020;67:2595–604. [DOI] [PubMed] [Google Scholar]
- 17.Letnes JM, Eriksen-Volnes T, Nes B, Wisløff U, Salvesen Ø, Dalen H. Variability of echocardiographic measures of left ventricular diastolic function. The HUNT study. Echocardiography 2021;38:901–8. [DOI] [PubMed] [Google Scholar]
- 18.Eriksen-Volnes T, Grue JF, Hellum Olaisen S, Letnes JM, Nes B, Løvstakken Let al. Normalized echocardiographic values from guideline-directed dedicated views for cardiac dimensions and left ventricular function. JACC Cardiovasc Imaging 2023;[published online ahead of print, 2023 Jan 14]. doi: 10.1016/j.jcmg.2022.12.020 [DOI] [PubMed] [Google Scholar]
- 19.Ostvik A, Smistad E, Aase SA, Haugen BO, Lovstakken L. Real-time standard view classification in transthoracic echocardiography using convolutional neural networks. Ultrasound Med Biol 2019;45:374–84. [DOI] [PubMed] [Google Scholar]
- 20.Smistad E, Østvik A, Haugen BO, Løvstakken L. 2D left ventricle segmentation using deep learning. In: IEEE International Ultrasonics Symposium (IUS). Washington, DC, USA, 2017, p.1–4.
- 21.Smistad E, Salte IM, Østvik A, Leclerc S, Bernard O, Lovstakken L, et al. Segmentation of apical long axis, four- and two-chamber views using deep neural networks. In: 2019 IEEE International Ultrasonics Symposium (IUS). Glasgow, UK, 2019, p.8–11.
- 22.Lang RM, Badano LP, Mor-Avi V, Afilalo J, Armstrong A, Ernande Let al. Recommendations for cardiac chamber quantification by echocardiography in adults: an update from the American Society of Echocardiography and the European Association of Cardiovascular Imaging. Eur Heart J Cardiovasc Imaging 2015;16:233–70. [DOI] [PubMed] [Google Scholar]
- 23.Tromp J, Seekings PJ, Hung CL, Iversen MB, Frost MJ, Ouwerkerk Wet al. Automated interpretation of systolic and diastolic function on the echocardiogram: a multicohort study. Lancet Digit Health 2021;4:e46–e54. [DOI] [PubMed] [Google Scholar]
- 24.Ouyang D, He B, Ghorbani A, Yuan N, Ebinger J, Langlotz CPet al. Video-based AI for beat-to-beat assessment of cardiac function. Nature 2020;580:252–6. [DOI] [PMC free article] [PubMed] [Google Scholar]
- 25.He B, Kwan AC, Cho JH, Yuan N, Pollick C, Shiota Tet al. Blinded, randomized trial of sonographer versus AI cardiac function assessment. Nature 2023;616:520–4. [DOI] [PMC free article] [PubMed] [Google Scholar]
- 26.Asch FM, Mor-Avi V, Rubenson D, Goldstein S, Saric M, Mikati Iet al. Deep learning-based automated echocardiographic quantification of left ventricular ejection fraction: a point-of-care solution. Circ Cardiovasc Imaging 2021;14:e012293. [DOI] [PubMed] [Google Scholar]
- 27.Papadopoulou S-L, Sachpekidis V, Kantartzi V, Styliadis I, Nihoyannopoulos P. Clinical validation of an artificial intelligence-assisted algorithm for automated quantification of left ventricular ejection fraction in real time by a novel handheld ultrasound device. Eur Heart J Digital Health 2022;3:29–37. [DOI] [PMC free article] [PubMed] [Google Scholar]
- 28.Hjorth-Hansen AK, Magelssen MI, Andersen GN, Graven T, Kleinau JO, Landstad Bet al. Real-time automatic quantification of left ventricular function by hand-held ultrasound devices in patients with suspected heart failure: a feasibility study of a diagnostic test with data from general practitioners, nurses and cardiologists. BMJ Open 2022;12:e063793. [DOI] [PMC free article] [PubMed] [Google Scholar]
- 29.Knackstedt C, Bekkers SC, Schummers G, Schreckenberg M, Muraru D, Badano LPet al. Fully automated versus standard tracking of left ventricular ejection fraction and longitudinal strain: the FAST-EFs multicenter study. J Am Coll Cardiol 2015;66:1456–66. [DOI] [PubMed] [Google Scholar]
- 30.Hoffmann R, Barletta G, von Bardeleben S, Vanoverschelde JL, Kasprzak J, Greis Cet al. Analysis of left ventricular volumes and function: a multicenter comparison of cardiac magnetic resonance imaging, cine ventriculography, and unenhanced and contrast-enhanced two-dimensional and three-dimensional echocardiography. J Am Soc Echocardiogr 2014;27:292–301. [DOI] [PubMed] [Google Scholar]
- 31.Hovland A, Staub UH, Bjørnstad H, Prytz J, Sexton J, Støylen Aet al. Gated SPECT offers improved interobserver agreement compared with echocardiography. Clin Nucl Med 2010;35:927–30. [DOI] [PubMed] [Google Scholar]
- 32.Myhr KA, Pedersen FHG, Kristensen CB, Visby L, Hassager C, Mogelvang R. Semi-automated estimation of left ventricular ejection fraction by two-dimensional and three-dimensional echocardiography is feasible, time-efficient, and reproducible. Echocardiography 2018;35:1795–805. [DOI] [PubMed] [Google Scholar]
- 33.Li H, Wang Y, Qu M, Cao P, Feng C, Yang J. EchoEFNet: multi-task deep learning network for automatic calculation of left ventricular ejection fraction in 2D echocardiography. Comput Biol Med 2023;156:106705. [DOI] [PubMed] [Google Scholar]
- 34.Wood PW, Choy JB, Nanda NC, Becher H. Left ventricular ejection fraction and volumes: it depends on the imaging method. Echocardiography 2014;31:87–100. [DOI] [PMC free article] [PubMed] [Google Scholar]
- 35.Dorosz JL, Lezotte DC, Weitzenkamp DA, Allen LA, Salcedo EE. Performance of 3-dimensional echocardiography in measuring left ventricular volumes and ejection fraction: a systematic review and meta-analysis. J Am Coll Cardiol 2012;59:1799–808. [DOI] [PMC free article] [PubMed] [Google Scholar]
Associated Data
This section collects any data citations, data availability statements, or supplementary materials included in this article.
Supplementary Materials
Data Availability Statement
Measurement data are available from the public repository NTNU Open Research Data, https://dataverse.no/dataverse/ntnu (https://doi.org/10.18710/ZDSD2H). Due to limitations in the CIUS consortium agreement, the full software can not be made publicly available at this time.


