Abstract
The prediction of rock porosity and permeability is crucial for assessing reservoir productivity and economic feasibility. However, traditional methods for obtaining these properties are time-consuming and expensive, making them impractical for comprehensive reservoir evaluation. This study introduces a novel approach to efficiently predict rock porosity and permeability for reservoir assessment by leveraging real-time machine learning models. Utilizing readily available drilling parameters, this approach offers a cost-effective alternative to traditional time-consuming methods to predict formation petrophysical parameters in real-time. The data set used in this study was collected from two vertical wells located in the Middle East. It encompasses drilling parameters such as the rate of penetration (ROP), gallons per minute (GPM), revolutions per minute (RPM), strokes per minute (SPP), torque, and weight on bit (WOB), along with the corresponding measurements of porosity (ϕ) and permeability (k) obtained through core analysis. Three machine learning models, namely, decision trees (DTs), random forest (RFs), and support vector machines (SVMs), were employed and evaluated for their effectiveness in predicting porosity and permeability. The results demonstrate promising performance across the different data sets. All three models achieved correlation coefficients (R) higher than 0.91 in predicting porosity. The RF model exhibited accurate predictions of permeability, achieving R values surpassing 0.92 in the various data sets. While the DT model displayed slightly lower performance, with the R-value decreasing to 0.88 in the testing data set, the SVM model suffered from overfitting, with R values dropping to 0.83 in the testing data set. The novelty of this work lies in the successful application of machine learning models to the real-time prediction of reservoir properties, providing a practical and efficient solution for the oil and gas industry. By achieving correlation coefficients exceeding 0.91 and showcasing the models’ efficacy in a dynamic testing data set, this study paves the way for improved decision-making processes and enhanced exploration and production activities. The innovative aspect lies in the utilization of drilling parameters for timely and cost-effective estimation, transforming conventional reservoir evaluation methods.
Introduction
In reservoir characterization and hydrocarbon exploration, the assessment of permeability (k) and porosity is crucial.1−3 The productivity and economic feasibility of a reservoir are greatly influenced by these two characteristics. Porosity is the measurement of pore spaces within a rock formation and directly affects the storage capacity of fluids in a reservoir. Accurate porosity estimation enables informed decisions on well placement and enhanced oil recovery design. Permeability defines the ability of a rock formation to transmit fluids, impacting flow rates and fluid movement within the reservoir. Estimating the permeability is vital for evaluating reservoir productivity and designing effective production strategies. High permeability enhances hydrocarbon recovery, while low permeability poses challenges for commercial production.1−4
There are several methods available for estimating the rock porosity and permeability, for example, experimental core analysis, where core samples extracted from the reservoir are subjected to laboratory tests such as permeability measurements using steady-state or unsteady-state flow techniques.5−7 Porosity is measured directly using techniques such as helium porosimetry, mercury intrusion porosimetry, or gas expansion methods.8 Well logs, such as neutron porosity logs, density logs, and sonic logs, can be used to estimate the porosity. These logs measure various physical properties of the rock formation and provide indirect indications of porosity.9−11 Well logs, including resistivity logs, nuclear magnetic resonance (NMR) logs, and acoustic logs, can provide indirect indications of the permeability. These logs capture different properties related to the fluid flow characteristics in the reservoir and can be used to estimate permeability.12−14 Well testing such as pressure drawdown or buildup tests, can provide valuable information for estimating permeability through different pressure and rate transient analyses.15,16 Seismic techniques, such as acoustic impedance inversion, can be employed to estimate the porosity indirectly. By analyzing the seismic response of the reservoir, porosity information can be inferred based on the rock properties and fluid content.17,18
The real-time assessment of the porosity and permeability plays a pivotal role in reservoir management and hydrocarbon exploration. The ability to swiftly and precisely determine these geological characteristics is essential for timely, well-informed decisions that directly influence reservoir production and economic feasibility. Porosity, reflecting the void spaces within a rock formation, directly impacts the fluid storage capacity. The continuous evaluation of porosity in real time assists in optimizing well placement and dynamically devising effective enhanced oil recovery solutions. Likewise, the real-time assessment of permeability, representing a rock formation’s fluid transport capability, is vital for evaluating reservoir productivity and implementing effective production methods. The ability to consistently observe and adjust these parameters in real time empowers operators to promptly adapt their drilling and production approaches, in line with evolving reservoir conditions. This flexibility in decision-making contributes to optimizing hydrocarbon recovery, minimizing operational risks, and ensuring the overall success of reservoir exploration and development initiatives. Moreover, the real-time assessment of the porosity and permeability is essential for enhancing the efficiency of reservoir management. It facilitates the immediate identification of shifts in reservoir properties, enabling proactive modifications to drilling operations, well completions, and production strategies. This proactive stance proves particularly valuable in dynamic reservoir settings, where conditions can evolve rapidly and conventional methods involving time-consuming laboratory investigations may fall short.
The accurate prediction of porosity and permeability is challenging due to the inherent heterogeneity of subsurface formations. Traditional methods, such as core analysis, well logging, and seismic methods, are time-consuming and expensive, making it impractical to obtain measurements at every location in a reservoir. This is where the application of machine learning and data-driven models becomes highly valuable.
Literature Review: ML Applications
Machine learning (ML) algorithms offer promising solutions for different problems by analyzing vast amounts of data and identifying complex patterns and relationships that may not be apparent to human analysts.19−21 By training the models on a data set that includes both input parameters and corresponding output measurements, the algorithms can learn the underlying patterns and create predictive models capable of estimating formation properties. Different authors discussed the application of machine learning in predicting formation porosity and permeability.22−29
Tian et al. (2021) presented a novel approach for predicting permeability by utilizing a hybrid ML method.22 They incorporated the quartet structure generation set (QSGS) algorithm and pore network modeling to capture the intricate relationship between pore structure parameters and permeability. The hybrid Genetic Algorithm-Artificial Neural Network (GA-ANN) method was employed to leverage the extracted feature sets and improve the accuracy of the permeability prediction. This study contributes to the development of advanced techniques for assessing and understanding the permeability characteristics of porous media. However, the proposed hybrid ML method for the permeability prediction may be limited in its generalizability to different types of porous media.
In 2019, Ahmadi and Chen conducted a comprehensive comparison of various machine-learning models to predict porosity and permeability in oil reservoirs using petrophysical logs.24 These models included artificial neural networks, genetic algorithms, fuzzy decision trees, imperial competitive algorithms (ICA), particle swarm optimization (PSO), and hybrid approaches. Similarly, in 2020, Wood introduced an optimized nearest-neighbor, machine-learning, and data-mining network to predict porosity, permeability, and water saturation using well-log data.25 The proposed algorithm effectively evaluates multiple well-log curves, providing accurate petrophysical predictions and valuable insights through extensive data mining. By standardizing the well-log representation and utilizing the data-matching algorithm, the network enables the estimation of effective permeability and water saturation (Ke, Sw) from data sets that incorporate standard well logs, lithofacies, and stratigraphic information. However, input of well-logged data is expensive and time-consuming. Sun et al. 2021 applied machine learning to the identification of porosity and permeability while drilling-based logging while drilling combined with conventional wireline logging.23
Matinkia et al. (2023) present intelligent hybrid approaches for permeability estimation in rocks of the Fahlian formation by fusing a multilayer perceptron network with heuristic algorithms (SSD, GA, and PSO) as a function of conventional well logging data.30 Enhancing prediction accuracy involves preparing data, choosing features, and removing outliers. MLP-GA is computationally efficient, whereas MLP-SSD performs marginally better. The study highlights how hybrid algorithms can be applied to heterogeneous formations and highlights how the new MLP-SSD method outperforms other hybrid techniques in terms of the permeability estimate. The study’s limitations are due to its focus on a specific formation, which may limit its applicability to different geological settings, and the fact that the models need well logging data as input. Kalule et al. (2023) use 2D slices from 3D micro-CT images to predict porosity and permeability in carbonate rocks using a stacked ensemble machine learning approach.31 The promise of merging ensemble learning and image analysis approaches is demonstrated by the stacked model algorithm’s ability to predict rock attributes. The main limitations of this study are the longer processing time of stacked models in comparison to individual models and the difficulties in making real-time forecasts in underground formations.
Tian et al. (2022) combine ensemble machine learning with digital rock petrophysics to enhance the permeability forecasting in subsurface porous media.32 The study calculated the permeability of dynamically generated porous samples using the lattice Boltzmann method (LBM), taking into account critical characteristics such as porosity, tortuosity, fractal dimension, average pore diameter, and coordination number as inputs for the prediction (Table 1).
Table 1. Summary of Recent Applications of Machine Learning Models to Predict Petrophysical Parameters.
| reference | tools | inputs | outputs | notes |
|---|---|---|---|---|
| Tian et al.22 | hybrid GA-ANN method | pore structure parameters | permeability | generalizability, requirement for pore structure parameters |
| Ahmadi and Chen24 | ANN, GA, ICA, and PSO | well logging data | porosity, permeability | required well logging data, not real time during drilling operations |
| Wood25 | optimized data-matching algorithm, the transparent open box (TOB) learning network | well logging data | porosity, permeability, and water saturation | required well logging data, not real time during drilling operations |
| Sun et al.23 | SVM, RF, and GBDT | logging while drilling and well logging data | porosity and permeability | required well logging data, not real time during drilling operations |
| Matinkia et al.30 | multilayer perceptron network | well logging data | permeability | required well logging data, not real time during drilling operations |
| Kalule et al.31 | deep neural networks (DNN) than gradient boosting | 3D micro-CT images | porosity and permeability | laboratory scale, not real time during drilling operations |
| Tian et al.32 | support vector machine, artificial neural network, decision tree, random forest, gradient-boosting machine, and Bayesian ridge regression | porosity, tortuosity, fractal dimension, average pore diameter, and coordination number | permeability | input data are based on synthetic data |
| Current Study | DT, RF, and SVM | readily available drilling parameters | porosity and permeability | readily available drilling parameter, realtime prediction |
On the other hand, the availability of drilling parameters such as rate of penetration, flow rates, torque, and weight on the bit can provide valuable insights into the geological properties of the formation. These parameters, when combined with the appropriate machine learning algorithms, can serve as inputs to predict porosity and permeability. Hence, the objective of this study is to predict the rock permeability and porosity using the readily available drilling parameter for real-time estimation with no additional cost.
Methodology
Data Description
The data set for this study was collected from two vertical wells in the Middle East. The data consist of drilling parameters such as ROP (rate of penetration), GPM (gallons per minute), RPM (revolutions per minute), SPP (strokes per minute), torque, and WOB (weight on bit), in addition to the corresponding porosity (ϕ) and permeability (k) that were measured from the core analysis. Table 2 summarizes the statistical analysis for the collected data set. The data showed a wide range of porosities and permeability. The porosity varied from 5 to 31%. Similarly, the permeability varied from 0.02 to 2700 mD. Figure 1 presents a heatmap illustrating the correlation coefficients (R) between various parameters, visually conveying the strength and direction of linear relationships among them. The correlation coefficient (R), measured on a scale from −1 to 1, signifies the degree of linear association between two variables. Notably, negative correlations were observed between the WOB and torque in relation to both permeability and porosity. Specifically, the WOB exhibited a stronger negative correlation with porosity (R = −0.44) and a slightly weaker correlation with permeability (R = −0.27). Conversely, ROP and GPM displayed positive relationships with porosity and permeability, with R values of 0.37 and 0.18 for ROP in relation to porosity and permeability, respectively. Of note, SPP emerged as the least influential parameter for predicting petrophysical properties. The heatmap utilizes color variations to depict the intensity and direction of these correlations, offering a comprehensive visual representation of the interrelationships among the examined parameters.
Table 2. The Statistical Analysis of the Collected Data.
| ROP | GPM | RPM | SPP | torque | WOB | phi | K | |
|---|---|---|---|---|---|---|---|---|
| mean | 58 | 998 | 120 | 2064 | 10 | 18 | 0.144 | 57 |
| standard deviation | 31 | 291 | 19 | 718 | 2 | 11 | 0.073 | 175 |
| minimum | 20 | 695 | 84 | 1135 | 5 | 0 | 0.05 | 0.02 |
| 25% percentile | 30 | 710 | 101 | 1339 | 9 | 10 | 0.081 | 0.29 |
| 50% percentile | 49 | 1079 | 115 | 2228 | 9 | 18 | 0.142 | 3.90 |
| 75% percentile | 83 | 1312 | 139 | 2746 | 10 | 25 | 0.205 | 29.23 |
| maximum | 159 | 1374 | 141 | 3245 | 18 | 54 | 0.310 | 2726 |
Figure 1.
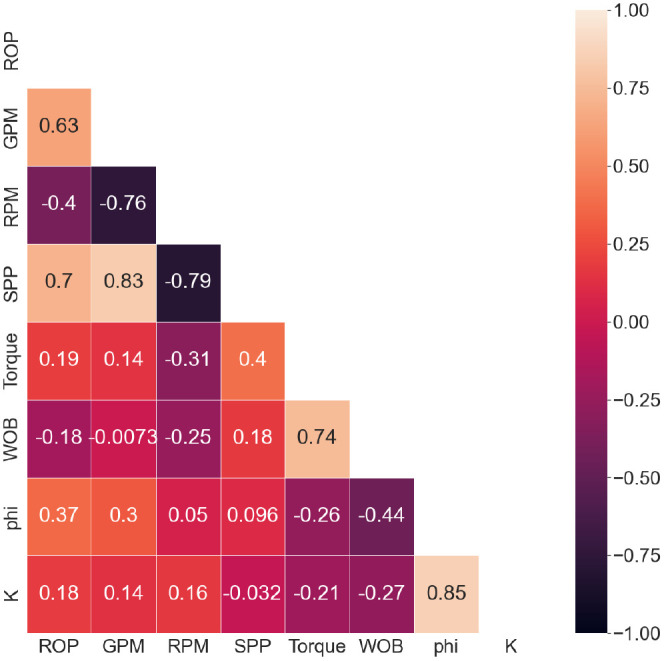
Correlation coefficient heat map between all parameters with each other.
Model Development
Figure 2 presents the model development procedures that involve different steps. After data collection as highlighted in the previous section, the data were preprocessed to ensure that the data are accurate, complete, and representative of the target reservoir. Data preprocessing also includes cleaning the data by removing outliers and handling missing values. To improve data quality and ensure consistency in the data set, all variables were normalized using the min-maximum method, while the permeability data were transferred to log permeability. The ML models were trained using the training set based on Well-1, while Well-2 was used to test and validate the developed models. The training-to-testing data set ratio was set to be 75:25. The ML models’ performance was evaluated using the testing data set by calculating the performance indicators such as root-mean-square error (RMSE) and R-values. The model’s performance was then assessed using independent validation data to compare the predicted values of porosity and permeability with actual values to measure the accuracy, precision, and reliability of the model.
Figure 2.
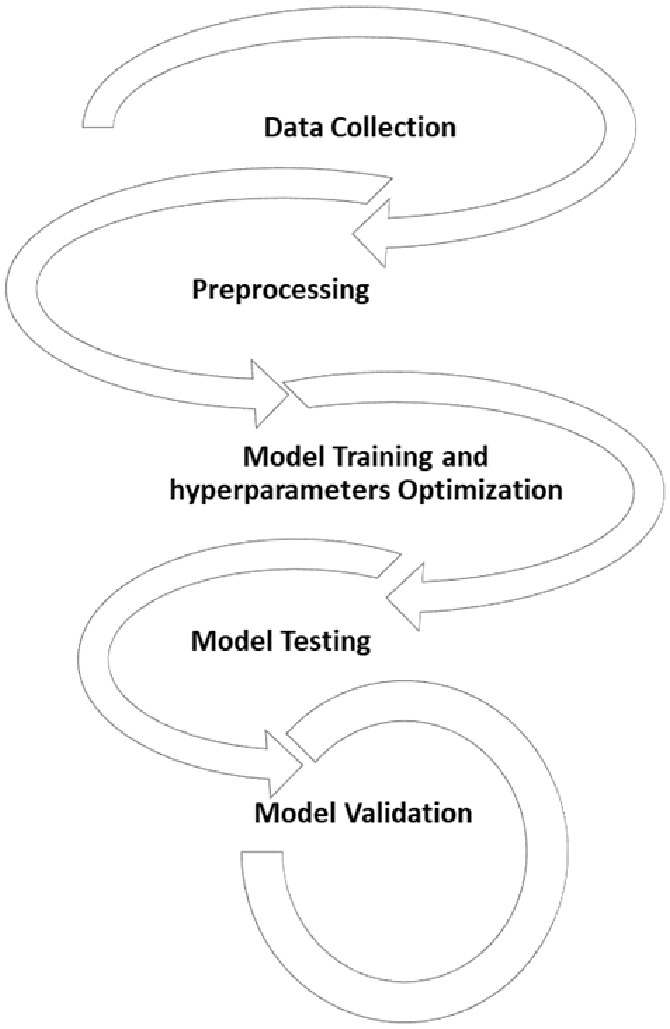
Processes of developing different ML models.
Different machine learning methods were applied in this study including decision trees (DTs), random forests (RFs), and the support vector machine (SVM).
Decision Trees (DTs)
DT is a supervised machine learning algorithm that builds a tree-like model to make decisions or predictions based on input features. It partitions the data based on different attribute values and creates a hierarchical structure of decisions. Each internal node represents a decision based on a specific feature, and each leaf node represents a final decision or prediction. Decision trees are popular due to their interpretability and ability to handle both numerical and categorical data. They can be used for classification and regression tasks. DT has been applied in different supervised machine learning problems.33
Random Forests (RFs)
On the other hand, RF is an ensemble learning method that combines multiple decision trees to make predictions. It constructs a forest of decision trees, where each tree is trained on a random subset of data and features. During prediction, the outputs of all individual trees are averaged or aggregated to obtain the final prediction. RF performance can be improved by optimizing the hyperparameters as summarized in Table 3. Random Forest is known for its robustness, as it reduces overfitting by combining diverse models. It can handle high-dimensional data and provides feature importance rankings, making it useful for classification and regression problems. Random forests are widely used due to their versatility and ability to handle large data sets.34,35
Table 3. Summary of the Different Hyperparameters for the Different ML Methods.
| hyperparameters | range | optimum values |
|---|---|---|
| Decision Tree | ||
| max_depth | 5–25 | 9 |
| max_features | ‘log2’ | ‘auto’ |
| random_state | 1–100 | 1 |
| Random Forests | ||
| max_depth | 5–25 | 23 |
| max_features | ‘log2′, ‘auto’ | ‘log2’ |
| random_state | 1–100 | 1 |
| ‘n_estimators’ | 1–200 | 50 |
| Support Vector Machine | ||
| lambda = | 1 × 10⁻⁶ to 0.1 | 1 × 10⁻⁵ |
| epsilon | 1 × 10⁻⁶ to 1 | 0.00001 |
| kernel option | 1–10 | 3.5 |
| verbose | 1 | 1 |
| C | 50–2000 | 400 |
| kernel | ‘poly’, ‘Gaussian’ | ‘Gaussian’ |
Support Vector Machine (SVM)
SVM is a powerful supervised machine learning algorithm used for classification and regression tasks.36 SVM aims to find an optimal hyperplane that separates data points of different classes or predicts a continuous target variable. The algorithm seeks to maximize the margin between the hyperplane and the closest data points, known as support vectors. SVM can handle both linear and nonlinear classification tasks through the use of kernel functions, which transform the data into higher-dimensional spaces.37 This allows SVM to effectively classify data that may not be linearly separable from the original feature space. SVMs are known for their ability to handle high-dimensional data and for their good generalization performance. SVMs offer flexibility, robustness against outliers, and the ability to capture complex decision boundaries. To optimize these tools different hyperparameters were tuned for each ML technique to improve the model’s performance as summarized in Table 3.38
Results and Discussion
Decision Tree Model Results
The decision tree model was applied to the drilling parameters to develop two models: one to predict the formation porosity and another model to predict the formation permeability with the input parameters consisting of ROP, GPM, RPM, SPP, torque, and WOB for Both models.
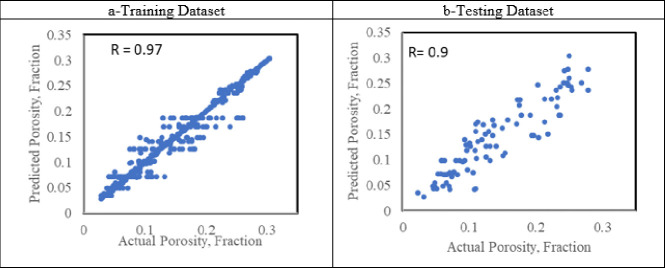
For the porosity model, the optimum hyperparameter for the DT models was selected to be max_depth = 9, max_features = ‘auto’, and random_state = 1. The optimum training testing ratio was found to be 70:30. Figure 3 depicts the predicted porosity from a decision tree (DT) model versus the actual porosity providing valuable insights into the model’s performance and the agreement between predicted and observed porosity values. With an R-value of 0.97, there is a strong positive linear relationship between the predicted and actual porosity. This high R-value indicates that the DT model’s predictions align closely with the actual porosity measurements. An RMSE of 0.02 further supports the accuracy of the DT model’s predictions, where the DT model’s porosity predictions differ from the actual porosity by only 0.02 units. Similarly, in the case of the testing data set, where the R-value was found to be 0.90 with an RMSE equals to 0.03.
Figure 3.
Crossplot porosity results for the DT model for a) training data set and b) testing data set.
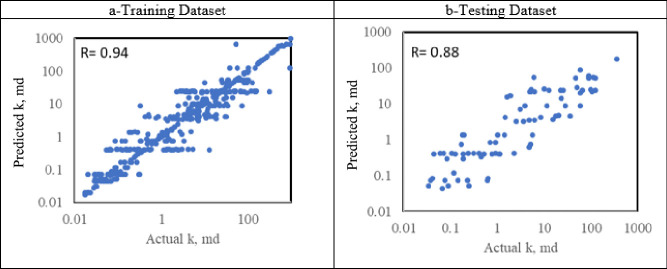
Similarly, the DT method was applied to predict the permeability values from the drilling parameters. The optimum hyperparameters were found to be max_depth = 8, max_features = ‘sqrt’, and random_state = 1 with an optimum training testing ratio of 70:30. Figure 4 presents a cross plot for the actual versus predicted permeability values on logarithmic scales. The DT model performance was slightly lower than the porosity model performance with an R value of 0.94 and an RMSE of 0.39 for the training data set. An overfitting issue was observed in the model where the R values decreased to 0.88 in the testing data set with an RMSE of 0.52.
Figure 4.
Crossplot permeability results for the DT model for a) training data set and b) testing data set.
Random Forest Model Results
Similarly, the RF method was applied to develop two models to predict the formation porosity and permeability from the drilling parameters. For the porosity model, the optimum hyperparameters were found to be ‘max_depth’: 23, ‘max_features’: ‘log2’, ‘n_estimators’: 50 with training to testing ratio of 70:30.
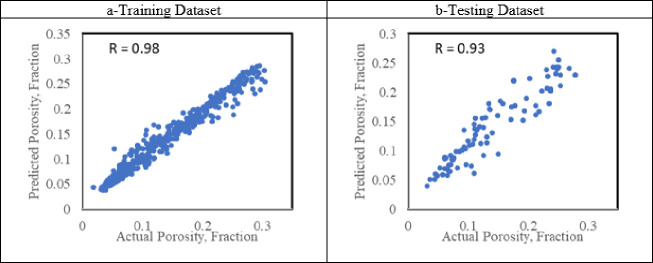
Figure 5 presents the RF results for the training and testing data sets. The figure comparing the predicted porosity from a random forest (RF) model to the actual porosity values provides insights into the model’s performance and the agreement between predicted and observed porosity values. For the training data set, the RF model exhibits a high R-value of 0.98, indicating a strong positive linear relationship between the predicted porosity and actual porosity values. This suggests that the RF model captures the underlying patterns and variability in the training data, resulting in accurate predictions. Additionally, the root-mean-square error (RMSE) of 0.02 indicates that on average, the predicted porosity values deviate from the actual values by only a small amount. When evaluating the model’s performance on the testing data set, the RF model maintains a high R-value of 0.93. Although slightly lower than the training R-value, this still indicates a strong positive linear relationship between the predicted and actual porosity values in the testing data set. The RMSE of 0.02 suggests that the model’s predictions on the testing data set have a similar level of accuracy to those on the training data set.
Figure 5.
Crossplot porosity results for the RF model for a) training data set and b) testing data set.
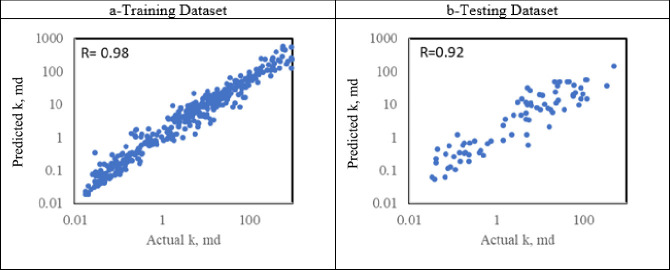
Similarly, the RF method was utilized to forecast permeability values based on drilling parameters. The optimal hyperparameters determined were n_estimators = 150, max_depth = 35, max_features = ‘sqrt,’ and random_state = 1, with a preferred training-to-testing ratio of 70:30. Figure 6 showcases a scatter plot comparing the actual and predicted permeability values by using logarithmic scales. The performance of the RF model exhibited higher performance compared to the DT model, with an R-value of 0.98 with an RMSE of 0.29 for the training data set. The testing data set showed an R-value of 0.92 with an RMSE of 0.22 which confirms the capability of the RF model to predict the permeability from the drilling parameters.
Figure 6.
Crossplot permeability results for the RF model for a) training data set and b) testing data set.
Support Vector Machine Model Results
Similarly, the support vector machine (SVM) method was employed to construct two models for predicting formation porosity and permeability based on drilling parameters. The training/test splitting ratio was used to be 70:30. In addition, the optimum hyperparameters for the SVM model to predict the porosity were found to be lambda = 1 × 10⁻⁵, epsilon = 0.00001, kernel option = 3.5, verbose = 1, C = 400, and kernel = ‘Gaussian’.
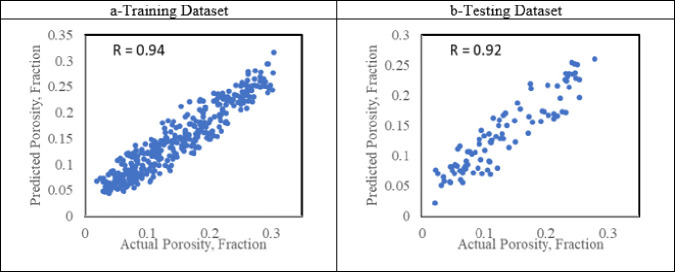
The cross-plot for predicted porosity from SVM versus actual porosity shown in Figure 7 shows the relationship between the predicted and actual porosity values. For the training data set, the R-value of 0.94 indicates a strong positive correlation between the predicted and actual porosity values. This means that the SVM model has captured the underlying patterns and trends in the training data quite well with an RMSE value of 0.03.
Figure 7.
Crossplot porosity results for the SVM model for a) training data set and b) testing data set.
After evaluation of the model performance on the testing data set, a slightly lower R-value of 0.92 was observed. The RMSE value between the actual and predicted porosity values in the testing data set was 0.12 suggesting that, on average, the predicted porosity values deviate from the actual values by 0.12 units, which is slightly higher than the training data set and higher than the other two models.
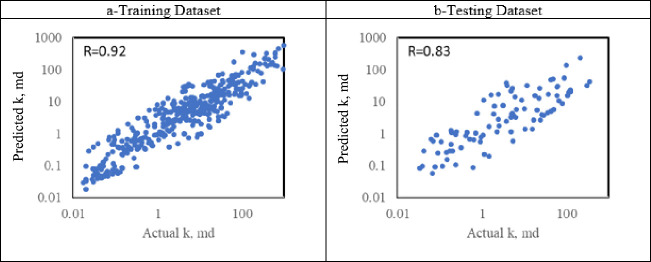
In the permeability model, the SVM hyperparameters were found to be lambda = 0.1, epsilon = 0.01, kerneloption = 10.5, verbose = 1, C = 100, and kernel = ‘Gaussian’. Figure 8 shows the cross plot for the permeability prediction versus the actual values for both training and testing data sets. The SVM model performed slightly less than both DT and RF models with the R value reached 0.83. An RMSE from SVM in the testing data set was 0.61 compared to 0.45 and 0.52 from RF and DT models, respectively.
Figure 8.
Crossplot permeability results for the SVM model for a) training data set and b) testing data set.
Model Validation
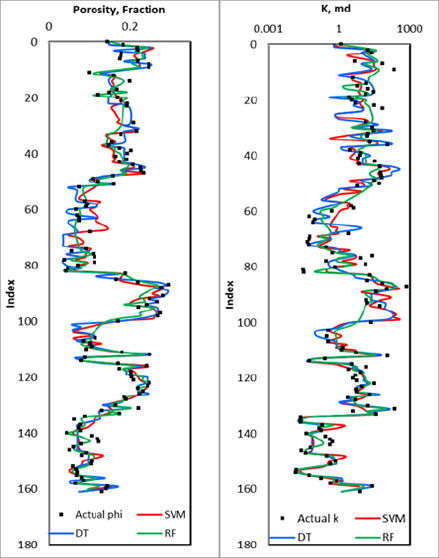
The developed models were then validated with unseen data sets to predict both porosity and permeability from drilling parameters. Figure 9 visualizes the actual properties in black dots versus DT results in the blue line, RF results in the green line, and SVM in the red line. The plot shows that the different models were able to predict the porosity and the permeability correctly with RF having the highest performance compared to DT and SVM which may have overestimated or underestimated the porosity values. In addition, Tables 4 and 5 summarize the model performance indicators for the different data sets.
Figure 9.
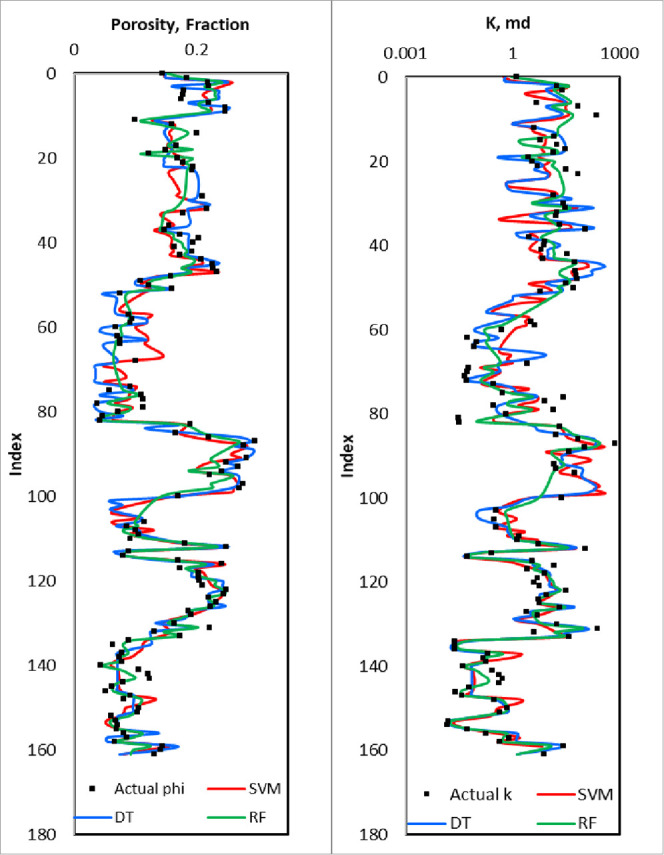
Permeability results for the SVM, DT, and RF models for the validation data set.
Table 4. Performance Indicator Summary for the Different ML Porosity Models in the Different Datasets.
|
R-value |
RMSE |
|||||
|---|---|---|---|---|---|---|
| training | testing | validation | training | testing | validation | |
| DT | 0.97 | 0.91 | 0.93 | 0.02 | 0.03 | 0.03 |
| RF | 0,98 | 0.93 | 0.94 | 0,02 | 0.03 | 0.02 |
| SVM | 0.94 | 0.92 | 0.91 | 0,03 | 0.03 | 0.03 |
Table 5. Performance Indicator Summary for the Different ML Permeability Models in the Different Datasets.
| R-value | RMSE | |||||
|---|---|---|---|---|---|---|
| training | testing | validation | training | testing | Validation | |
| DT | 0.94 | 0.88 | 0.91 | 0.39 | 0.52 | 0.47 |
| RF | 0.98 | 0.92 | 0.93 | 0.29 | 0.47 | 0.43 |
| SVM | 0.92 | 0.83 | 0.90 | 0.45 | 0.60 | 0.48 |
The R-value summary in the bar chart depicts the performance of machine learning porosity models across diverse data sets—training, testing, and validation in Figure 10a. The random forest (RF) model consistently excels, displaying the highest R-values of 0.98 in training, 0.93 in testing, and 0.94 in validation. This highlights its robust ability to establish a positive linear relationship between the predicted and actual porosity values. The decision tree (DT) model closely follows, maintaining strong accuracy across data sets with R-values of 0.97, 0.91, and 0.93. In comparison, the support vector machine (SVM) model, while competitive, slightly lags behind with R-values of 0.94, 0.92, and 0.91 in training, testing, and validation, respectively. Notably, the RF model consistently outperforms both the DT and SVM models, underscoring its efficacy in porosity prediction. However, the observed overfitting in the SVM model, indicated by declining R-values, emphasizes the importance of balancing model complexity and generalizability in applying machine learning to reservoir porosity prediction.
Figure 10.
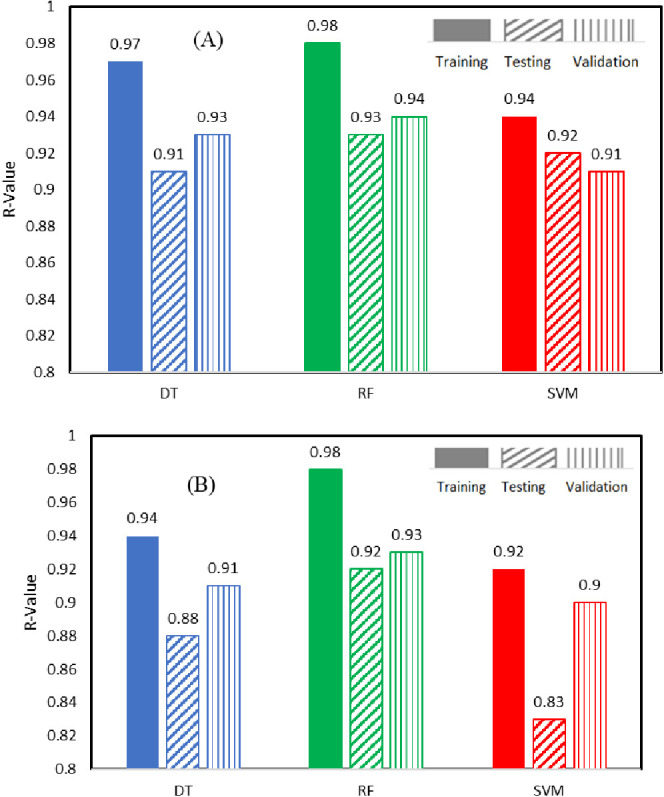
R-value comparison between different models for the different data sets: A) porosity model result; (B) permeability model results.
Similarly, Figure 10b illustrates the R-value summary for permeability models across distinct data sets—training, testing, and validation. In the training data set, the random forest (RF) model stands out with the highest R-value of 0.98, signifying a robust positive linear relationship between predicted and actual permeability values. The decision tree (DT) model follows closely with an R-value of 0.94, demonstrating commendable accuracy during the training phase. However, the support vector machine (SVM) model trails with an R-value of 0.92, indicating a slightly lower performance. Moving to the testing data set, the RF model maintains superior performance with an R-value of 0.92, emphasizing its consistent accuracy in predicting permeability values. The DT model exhibits slightly reduced but still strong performance with an R-value of 0.88, while the SVM model shows a decline with an R-value of 0.83, indicating a noticeable decrease in accuracy. In the validation set, the RF model continues to excel with the highest R-value of 0.93, showcasing its effectiveness in permeability prediction. The DT model closely follows with an R-value of 0.91, indicating its ability to generalize well beyond the training and testing data sets. The SVM model, while competitive, displays a slightly lower R-value of 0.90. The results highlight the consistent superiority of the RF model in predicting permeability values, emphasizing its significance in accurate reservoir characterization.
The observed overfitting in the decision tree (DT) permeability model (R = 0.94 for training, 0.88 for testing) may be attributed to the model’s sensitivity to the specific training data, resulting in less generalizability. The DT model tends to capture noise and outliers in the training data, leading to less robust performance on unseen data. On the other hand, the Random Forest (RF) model’s superior performance can be attributed to its ensemble nature, which combines multiple decision trees to mitigate overfitting. The optimized RF model parameters (max_depth: 23, max_features: ‘log2’, n_estimators: 50) contribute to enhanced accuracy and prevent the overemphasis on individual features. The ensemble approach enables RF to capture complex relationships in the data while maintaining better generalization capabilities.
Moreover, RF’s ability to handle high-dimensional data and capture nonlinear relationships is advantageous in the context of predicting porosity and permeability from drilling parameters. The ensemble of decision trees in the RF collectively contributes to a more robust and accurate prediction by reducing variance and minimizing the risk of overfitting. The methodical approach of cross-validation, hyperparameter tuning, and the ensemble strategy collectively empower RF to outperform other models. The diverse set of decision trees in the RF ensemble effectively balances the model’s bias and variance, resulting in a more reliable and accurate prediction of porosity and permeability in subsurface formations. On the other hand, The SVM model’s overestimation or underestimation of porosity values in the testing data set might be a consequence of its sensitivity to outliers and noise, causing deviations from the true underlying patterns. In contrast, the ensemble approach of RF, with optimized parameters and effective hyperparameter tuning, results in a model that is less prone to overfitting and more capable of making accurate predictions in diverse data sets.
Conclusions
The study aimed to predict porosity and permeability values from drilling parameters by using machine learning techniques. Three different methods, namely, decision trees (DTs), random forest (RF), and support vector machines (SVMs), were applied and evaluated. The following are the main conclusions.
The DT, SVM, and RF models showed promising results in predicting porosity with correlation coefficients higher than 0.91 in the different data sets.
RF model was able to accurately predict the formation permeability with R values higher than 0.92 in the different data sets, while DT showed slightly lower performance where the R-value decreased to 0.88 in the testing data set.
On the other hand, the SVM model indicates an overfitting problem as R values decreased from 0.92 in the training data set to 0.83 for the testing data set.
Overall, the novelty of the current study lies in the comprehensive comparison of machine learning models for predicting reservoir properties directly from drilling parameters. This approach offers a more streamlined and efficient alternative to traditional methods, providing valuable insights into subsurface rock properties that are crucial for decision-making in the oil and gas industry. These results pave the way for future research to refine machine learning models, address overfitting challenges, and explore additional variables for predictions that are even more accurate in diverse geological settings. Generally, the current study contributes to advancing the application of machine learning in reservoir characterization, marking a significant step toward enhanced exploration and production processes.
Acknowledgments
The author acknowledges the College of Petroleum Engineering and Geosciences at the King Fahd University of Petroleum & Minerals for the research support.
Glossary
Nomenclatures
- DT
decision trees
- GA-ANN
Genetic Algorithm-Artificial Neural Network
- GPM
gallons per minute
- ICA
imperialist competitive algorithm
- k
permeability
- Ke
effective permeability
- ML
machine learning
- NMR
nuclear magnetic resonance
- PSO
particle swarm optimization
- R
correlation coefficients
- RF
random forest
- RMSE
root-mean-square error
- ROP
rate of penetration
- RPM
revolutions per minute
- SPP
strokes per minute
- SVM
support vector machines
- Sw
water saturation
- WOB
weight on bit
- ϕ
porosity
The authors declare no competing financial interest.
References
- Amaefule J. O.; Altunbay M.; Tiab D.; Kersey D. G.; Keelan D. K.. Enhanced reservoir description: using core and log data to identify hydraulic (flow) units and predict permeability in uncored intervals/wells. In Paper presented at the SPE Annual Technical Conference and Exhibition, October 3–6, 1993. Paper Number: SPE-26436-MS; OnePetro, 1993. DOI: 10.2118/26436-MS. [DOI] [Google Scholar]
- Aminian K.; Thomas B.; Ameri S.; Bilgesu H.. A new approach for reservoir characterization. In SPE Eastern Regional Meeting; OnePetro, 2002. [Google Scholar]
- Lucia F. J.; Kerans C.; Jennings J. W. Jr. Carbonate reservoir characterization. J. Pet. Technol. 2003, 55 (6), 70–72. 10.2118/82071-JPT. [DOI] [Google Scholar]
- James C.; Oladiran O., Hydrocarbon Effect Correction on Porosity Calculation from Density Neutron Logs Using Vol. of Shale in Niger Delta. In Paper presented at the Nigeria Annual International Conference and Exhibition, Tinapa - Calabar, Nigeria, July 2010. Paper Number: SPE-140618-MS, 2010, 140618. DOI: 10.2118/140618-MS [DOI] [Google Scholar]
- Rushing J.; Newsham K.; Lasswell P.; Cox J.; Blasingame T.. Klinkenberg-corrected permeability measurements in tight gas sands: steady-state versus unsteady-state techniques. In SPE Annual Technical Conference and Exhibition; OnePetro, 2004. [Google Scholar]
- Carles P.; Egermann P.; Lenormand R.; Lombard J.. Low permeability measurements using steady-state and transient methods. In International symposium of the SCA, 2007. [Google Scholar]
- Jannot Y.; Lasseux D. A new quasi-steady method to measure gas permeability of weakly permeable porous media. Rev. Sci. Instrum. 2012, 83 (1), 015113. 10.1063/1.3677846. [DOI] [PubMed] [Google Scholar]
- Ramana Y.; Venkatanarayana B. In An air porosimeter for the porosity of rocks. Int. J. Rock Mech. Min. Sci. 1971, 8 (1), 29–53. 10.1016/0148-9062(71)90037-4. [DOI] [Google Scholar]
- Fischetti A. I.; Andrade A. Porosity images from well logs. J. Pet. Sci. Eng. 2002, 36 (3–4), 149–158. 10.1016/S0920-4105(02)00292-9. [DOI] [Google Scholar]
- Serra O.Well logging handbook; Editions TECHNIP. 2008. [Google Scholar]
- Ellis D. V.; Case C. R.; Chiaramonte J. M. Porosity from neutron logs II: interpretation. Petrophysics 2004, 45, 75–86. [Google Scholar]
- Saner S.; Kissami M.; Nufaili S. A. Estimation of permeability from well logs using resistivity and saturation data. SPE Form. Eval. 1997, 12 (1), 27–31. 10.2118/26277-PA. [DOI] [Google Scholar]
- Al-Ajmi F. A.; Aramco S.; Holditch S. A.. In Permeability estimation using hydraulic flow units in a central Arabia reservoir. In SPE Annual Technical Conference and Exhibition; OnePetro, 2000. [Google Scholar]
- Babadagli T.; Al-Salmi S. A review of permeability-prediction methods for carbonate reservoirs using well-log data. SPE Reservoir Eval. Eng. 2004, 7 (2), 75–88. 10.2118/87824-PA. [DOI] [Google Scholar]
- Oliver D. S. The averaging process in permeability estimation from well-test data. SPE Form. Eval. 1990, 5 (3), 319–324. 10.2118/19845-PA. [DOI] [Google Scholar]
- Oliver D. S. Estimation of radial permeability distribution from well-test data. SPE Form. Eval. 1992, 7 (4), 290–296. 10.2118/20555-PA. [DOI] [Google Scholar]
- Doyen P. M. Porosity from seismic data: A geostatistical approach. Geophysics 1988, 53 (10), 1263–1275. 10.1190/1.1442404. [DOI] [Google Scholar]
- Angeleri G.; Carpi R. Porosity prediction from seismic data. Geophys. Prospect. 1982, 30 (5), 580–607. 10.1111/j.1365-2478.1982.tb01328.x. [DOI] [Google Scholar]
- Gurina E.; Klyuchnikov N.; Zaytsev A.; Romanenkova E.; Antipova K.; Simon I.; Makarov V.; Koroteev D. Application of machine learning to accidents detection at directional drilling. J. Pet. Sci. Eng. 2020, 184, 106519. 10.1016/j.petrol.2019.106519. [DOI] [Google Scholar]
- Noshi C. I.; Schubert J. J.. The role of machine learning in drilling operations; a review. In SPE/AAPG Eastern regional meeting; OnePetro, 2018. [Google Scholar]
- Sircar A.; Yadav K.; Rayavarapu K.; Bist N.; Oza H. Application of machine learning and artificial intelligence in oil and gas industry. Pet. Res. 2021, 6 (4), 379–391. 10.1016/j.ptlrs.2021.05.009. [DOI] [Google Scholar]
- Tian J.; Qi C.; Sun Y.; Yaseen Z. M.; Pham B. T. Permeability prediction of porous media using a combination of computational fluid dynamics and hybrid machine learning methods. Eng. Comput. 2021, 37 (4), 3455–3471. 10.1007/s00366-020-01012-z. [DOI] [Google Scholar]
- Sun J.; Zhang R.; Chen M.; Chen B.; Wang X.; Li Q.; Ren L. Identification of Porosity and Permeability While Drilling Based on Machine Learning. Arab. J. Sci. Eng. 2021, 46 (7), 7031–7045. 10.1007/s13369-021-05432-x. [DOI] [Google Scholar]
- Ahmadi M. A.; Chen Z. Comparison of machine learning methods for estimating permeability and porosity of oil reservoirs via petro-physical logs. Petroleum 2019, 5 (3), 271–284. 10.1016/j.petlm.2018.06.002. [DOI] [Google Scholar]
- Wood D. A. Predicting porosity, permeability and water saturation applying an optimized nearest-neighbour, machine-learning and data-mining network of well-log data. J. Pet. Sci. Eng. 2020, 184, 106587. 10.1016/j.petrol.2019.106587. [DOI] [Google Scholar]
- Erofeev A.; Orlov D.; Ryzhov A.; Koroteev D. Prediction of porosity and permeability alteration based on machine learning algorithms. Transp. Porous Media 2019, 128, 677–700. 10.1007/s11242-019-01265-3. [DOI] [Google Scholar]
- Yang L.; Fomel S.; Wang S.; Chen X.; Chen W.; Saad O. M.; Chen Y. Porosity and permeability prediction using a transformer and periodic long short-term network. Geophysics 2023, 88 (1), WA293–WA308. 10.1190/geo2022-0150.1. [DOI] [Google Scholar]
- Gamal H.; Elkatatny S. Prediction model based on an artificial neural network for rock porosity. Arab. J. Sci. Eng. 2022, 47 (9), 11211–11221. 10.1007/s13369-021-05912-0. [DOI] [Google Scholar]
- Gamal H.; Elkatatny S.; Mahmoud A. A. Machine learning models for generating the drilled porosity log for composite formations. Arab. J. Geosci. 2021, 14 (23), 2700. 10.1007/s12517-021-08807-4. [DOI] [Google Scholar]
- Matinkia M.; Hashami R.; Mehrad M.; Hajsaeedi M. R.; Velayati A. Prediction of permeability from well logs using a new hybrid machine learning algorithm. Petroleum 2023, 9 (1), 108–123. 10.1016/j.petlm.2022.03.003. [DOI] [Google Scholar]
- Kalule R.; Abderrahmane H. A.; Alameri W.; Sassi M. Stacked ensemble machine learning for porosity and absolute permeability prediction of carbonate rock plugs. Sci. Rep. 2023, 13 (1), 9855. 10.1038/s41598-023-36096-2. [DOI] [PMC free article] [PubMed] [Google Scholar]
- Tian J.; Qi C.; Peng K.; Sun Y.; Mundher Yaseen Z. Improved permeability prediction of porous media by feature selection and machine learning methods comparison. J. Comput. Civil Eng. 2022, 36 (2), 04021040. 10.1061/(ASCE)CP.1943-5487.0000983. [DOI] [Google Scholar]
- Barjouei H. S.; Ghorbani H.; Mohamadian N.; Wood D. A.; Davoodi S.; Moghadasi J.; Saberi H. Prediction performance advantages of deep machine learning algorithms for two-phase flow rates through wellhead chokes. J. Pet. Explor. Prod. 2021, 11 (3), 1233–1261. 10.1007/s13202-021-01087-4. [DOI] [Google Scholar]
- Fu B.; Liu M.; He H.; Lan F.; He X.; Liu L.; Huang L.; Fan D.; Zhao M.; Jia Z. Comparison of optimized object-based RF-DT algorithm and SegNet algorithm for classifying Karst wetland vegetation communities using ultra-high spatial resolution UAV data. Int. J. Appl. Earth Observ. Geoinform. 2021, 104, 102553. 10.1016/j.jag.2021.102553. [DOI] [Google Scholar]
- Nallathambi S.; Ramasamy K.. In Prediction of electricity consumption based on DT and RF: An application on USA country power consumption. In 2017 IEEE International Conference on Electrical, Instrumentation and Communication Engineering (ICEICE); IEEE, 2017; pp 1–7.. [Google Scholar]
- Ma Y.; Guo G.. Support vector machines applications; Springer, 2014; Vol. 649. [Google Scholar]
- Patle A.; Chouhan D. S.. In SVM kernel functions for classification. In 2013 International Conference on Advances in Technology and Engineering (ICATE); IEEE, 2013; pp 1–9.. [Google Scholar]
- Ghorbani H.; Wood D. A.; Choubineh A.; Tatar A.; Abarghoyi P. G.; Madani M.; Mohamadian N. Prediction of oil flow rate through an orifice flow meter: Artificial intelligence alternatives compared. Petroleum 2020, 6 (4), 404–414. 10.1016/j.petlm.2018.09.003. [DOI] [Google Scholar]


