Abstract
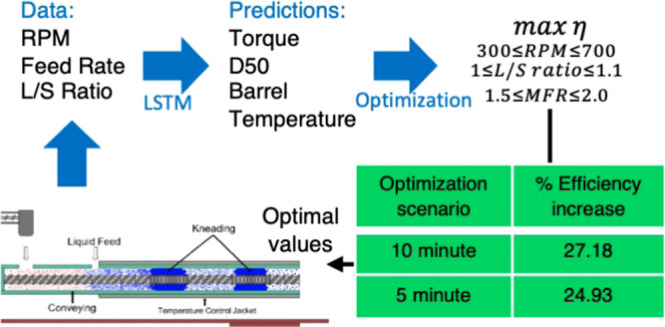
Traditional pharmaceutical manufacturing processes for solid oral dosage forms can be inefficient and have been known to produce a large amount of undesired product. With the progressing trend of achieving carbon neutrality, there is an impetus to increase the energy efficiency of these manufacturing processes while maintaining the critical quality attributes of the product. One of the important steps in downstream pharmaceutical manufacturing is wet granulation, and within that, twin screw granulation (TSG) is a popular continuous manufacturing technique. In this study, the energy efficiency of the TSG process was maximized by combining a long-term memory (LSTM) model with an optimization algorithm. The LSTM model was trained on time-series process data obtained from the TSG experimental runs. The optimization process, with the objective of maximizing energy efficiency, was performed using a stochastic optimization algorithm, and constraints were enforced on the process parameter design space. Experimental runs at the optimal process parameters were conducted on the TSG equipment with updates occurring at predefined intervals depending on the optimization scenarios. The purpose of these experimental runs was to validate the capability of increasing the overall process energy efficiency when operating at the optimized process parameters. A maximum increase of 27% was obtained between two tested optimization scenarios while maintaining the yield of the granules at the end of the twin-screw granulation process.
Keywords: LSTM, real-time optimization, twin screw granulation, time-series prediction, energy optimization, sustainability
Introduction
Over the past decade, there has been a growing trend for process industries to move toward sustainable manufacturing with set targets for greenhouse gases emission reduction, reduction in water use, and reduction in waste generated.1−5 Another factor which helps in increasing the sustainability of manufacturing processes is its association with cost reduction.6 Some of key areas identified by several pharmaceutical companies to help achieve sustainability include adoption of continuous manufacturing, process intensification and process energy intensification.6 Currently the pharmaceutical industry is dominated by batch manufacturing, which can have increased cost implications and carbon foot print.7 Thus, several pharmaceutical companies are exploring continuous manufacturing as a viable alternative. The United States Food and Drug Administration (US-FDA) has also promoted the development and implementation of continuous manufacturing with its recent guidelines.8
Continuous pharmaceutical manufacturing (CPM) can be considered as an aspect of process intensification which aims to improve product quality and reduce energy consumption and waste generation. CPM can mitigate costs by reducing inventory and equipment footprint and improving time-to-market of product, compared to batch manufacturing. CPM also typically has the advantage of minimization of risks during processing and also reduction in the usage of other hazardous chemicals. Currently, several companies such as Janssen, Vertex, and Pfizer have deployed CPM in downstream pharmaceutical solid oral dosage manufacturing and have commercially approved products. Several unit operations in this overall process are energy intensive and implementing them can slowdown the company’s sustainability efforts. Thus, it is important to look into the energy usage and effectiveness of these processes.
An important and energy intensive step in the downstream CPM is wet granulation. Wet granulation is the process of converting finely formulated powder blends into granules with the help of a liquid binder. In continuous manufacturing, it is commonly performed using a twin-screw granulator (TSG). A TSG consists of two corotating screws enclosed in a barrel. These corotating screws help convey the material along the length of the granulator while also imparting shear onto the flowing powders. This applied mechanical energy aids conveying the granulating mixture, liquid distribution and mixing in the different zones in the granulator.9,10 The screws of the TSG are modular due to the usage of smaller individual screw elements.11 Three commonly used screw elements are (i) conveying elements which help in the transport of the material,12−14 (ii) kneading elements which help in both liquid mixing and imparting shear on to the powders,12 and (iii) comb-mixer elements which aid in liquid distribution. Hindiyeh et al. 201815 observed that blending and granulation consume about 40% of the total energy usage in downstream oral dosage pharmaceutical manufacturing. Wet granulation is an energy-intensive process, since a large amount of torque needs to be applied to the powder blend to obtain good liquid distribution and final granules. During research, the usual run time of experiments ranges from 10 to 15 min, while manufacturing lines are run longer, usually from 8 to 16 h. This is when monitoring of energy consumption becomes relevant. Vercruysse et al.16 in their 1 h long experiments observed that the torque required by the system gradually kept increasing until the end of their run. This was also accompanied by an increase in the barrel temperature of the granulator. They attributed the increase in the torque values to the sticking of the powders to the screw inside. They expected that the system will eventually reach a steady state torque value if it is run longer. Thus, it becomes vital to reduce the amount of torque required by the system by manipulating the process parameters in an effort to optimize the energy efficiency of the TSG process in real-time, thereby aiding sustainability efforts. Since torque has been shown to be correlated to granule quality attributes, such as particle size and porosity,17,18 the goal of this work is to optimize the energy efficiency of the TSG process while maintaining the critical quality attributes of the granules.
Several attempts have been made to optimize the TSG process especially experimentally where design of experiments were used to either increase the yield19 or to optimize the critical quality attributes (CQAs) of the obtained granules.20 Researchers have also used Monte-Carlo simulations in order to optimize the design space of the TSG process to obtain desired tablet properties.21,22 Currently, no studies have been reported yet which have developed an optimization algorithm for energy efficiency of the TSG. Previous studies have studied the heat transfer within the TSG barrels23 but did not discuss the energy efficiency of the TSG process. There still exists a lack of complete understanding of the quantification of the energy efficiency of the TSG process.
To determine the energy used by the TSG and the energy used toward granulation, several intermediate variables need to be predicted. These intermediates include the torque provided by the motors, energy used to convey the material, temperature of the granules, and TSG barrel to estimate heat transfer and frictional forces. Due the complicated nature of the particulate processes within the TSG, the first-principles-based process model may not be able to predict all variables accurately with time. Thus, there is a need to develop process models using, for instance, machine learning algorithms to learn the complicated interactions between the process parameters and predict the process outcomes and the intermediate variables.
Objectives
In this study, an optimization algorithm is developed to maximize the energy efficiency of the TSG process in real time. First, time series experimental data for the TSG were collected by performing six experimental runs. These data were used to train a long–short-term memory (LSTM) system to predict responses including the torque, barrel temperatures, and granule CQAs. This model accounts for TSG process parameters, such as the L/S ratio, screw speed, powder feed rate, and the feeder weight, as model input variables. Heat transfer and energy efficiency were determined by using the first law of thermodynamics. The predictions of the LSTM were used to calculate the energy efficiency, which was optimized by using a discrete stochastic optimization algorithm. Two optimization scenarios were simulated to find the most optimal strategy, and validation experiments were performed to verify the effectiveness of the optimization algorithm.
Background
LSTM Network
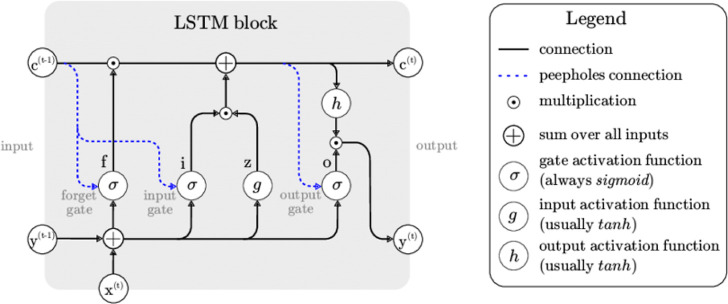
Recurrent neural network (RNN) systems are commonly utilized for modeling time-series data. However, these systems often face difficulties in effectively capturing long-term dependencies effectively. Long-term dependency refers to the ability of a model to learn from information from a distant past or many earlier time steps away.24 To address this issue, LSTM was introduced as a highly powerful RNN system that overcomes the problem of vanishing or exploding gradients. The LSTM unit comprises essential components such as a cell, an input gate, an output gate, and a forget gate.25 The addition of the forget gate enables the LSTM to reset its state, allowing the cell to remember information over arbitrary time intervals. The three gates (input, output, and forget) regulate the flow of information within the cell.26 The LSTM architecture consists of interconnected subnetworks called memory blocks, which retain their states over time and control the information flow through nonlinear gating units. The architecture of an LSTM block, including the gates, input signal x(t), output y(t), activation functions, and connections, is depicted in Figure 1. The output of the block is recurrently connected to both the block input and all of the gates. The presence of peepholes connections allows for further improvement in capturing long-term dependencies by influencing the weights of each gate.25
Figure 1.
Typical LSTM block.26
Differential Evolution
Differential evolution (DE) is a search algorithm based on population and metaheuristics.27 It aims to optimize a problem by continuously enhancing a potential solution through an evolutionary process. These types of algorithms do not rely on specific assumptions about the underlying optimization problem, allowing them to efficiently explore extensive design spaces. DE is widely utilized for optimizing multidimensional real-value functions and operates by using a population of individual solutions. Unlike methods that require gradient information, DE does not necessitate the problem to be differentiable. The algorithm explores the design space by maintaining a population of candidate solutions known as individuals. It generates new solutions by combining existing ones according to a defined procedure. In each iteration, the individuals with the best objective values are retained, contributing to the next iteration’s population. If a new individual’s objective value improves, it becomes part of the population; otherwise, it is discarded. This process continues until a termination criterion is met.28
One of the significant advantage of DE is its simplicity, as it only requires three control parameters for adjustment by the user. These parameters are the population size (NP), where NP must be greater than or equal to 4, the mutation factor (F) ranging from 0 to 2, and the crossover probability (CR) ranging from 0 to 1. In the original DE, these control parameters remained constant throughout the optimization process. The population size has a notable impact on the algorithm’s exploration capability. For problems with numerous dimensions, a larger population size is necessary to effectively search for the multidimensional design space. Generally, a population size of 30–50 is sufficient for most engineering problems. The mutation factor, F, acts as a positive control parameter that scales and regulates the amplification of the difference vector. Smaller values of F result in smaller mutation step sizes, causing the algorithm to converge more slowly. Conversely, larger values of F promote exploration but can lead to overshooting of good optima. Therefore, it is essential to choose a value that balances the local exploration and diversity maintenance. The crossover probability, CR, influences the diversity of DE by determining the number of elements that undergo changes. Increasing the CR introduces more variation into the new population, thereby enhancing exploration. However, it is crucial to find a compromise value that ensures both local and global search capabilities.29
Material and Methods
Materials and Experimental Setup
A bicomponent formulation was used for all experimental runs. The formulation consisted of Acetaminophen (APAP) (Mallinckrodt Pharmaceuticals, North Carolina, USA), dense powder grade, as excipient (85% w/w), and microcrystalline cellulose (MCC) (FMC Corporation, PA, USA), Avicel PH 102 grade, as API (15% w/w). Polyvinylpyrrolidone (PVP) K-30 (Millipore Sigma, MO, USA), 12.5% w/w, dissolved in distilled water was used as the liquid binder. Dry API and excipient were blended using a V-blender (Glatt Air Techniques Inc., New Jersey, USA).
TSG runs were performed using a corotating twin-screw granulator (Thermofisher Scientific, New Jersey, USA). The schematic of the equipment and set up is shown in Figure 2. The TSG consists of screws with a diameter of 11 mm and a length to diameter ratio (L/D) of 40. To collect real-time data, the screw speed, powder feed rate, and L/S ratio were the three process parameters that were varied. Only these three parameters were varied, as these are the only parameters of the TSG process that can be altered without interrupting the process during the optimization runs. The feed rate was varied between 1.5 and 2 kg/h was used for all the experiments to maintain a high fill level and produce good quality granules. The screw speed was varied between 300 and 500 rpm, and the L/S ratio was varied between 1.0 and 1.1. A total of six runs were performed and the process parameters values can be found in Table 1. All other parameters were kept constant for all six runs. All six runs were performed for approximately 30 min each. The screw configuration comprised 2 large-spaced conveying elements (L/D = 1.5), 13 conveying elements (L/D = 1), 6 kneading elements (L/D = 0.25), and 20 two conveying elements. The kneading elements were arranged with a stagger angle of −60° between them. The screw configuration can be represented as 2LPCE, 13CE, 6KE-60, and 22CE.
Figure 2.
Division of the TSG barrels in eight zones. Powder is fed into zone 2, liquid binder is added in zone 3 and the KE elements are present in zone 6.
Table 1. Set-points of Process Conditions for the Experimental Runs Performed to Train the LSTM Model.
| run no. | screw speed (rpm) | L/S ratio | powder feed rate (kg/h) |
|---|---|---|---|
| 1 | 300 | 1.0 | 1.75 |
| 2 | 500 | 1.0 | 1.50 |
| 3 | 500 | 1.0 | 1.75 |
| 4 | 500 | 1.0 | 2.00 |
| 5 | 700 | 1.0 | 1.75 |
| 6 | 700 | 1.1 | 1.75 |
The powder blend was dosed into the TSG using a loss-in-weight feeder (K-Tron KT 20, Coperion K-Tron Pitman, Inc. Sewell, NJ, USA).
Time-series process data were collected from various sources to train the LSTM model. The powder feed rate and the net weight of powder remaining inside were obtained from Coperion’s data recorder software. The screw speed, temperature of various zones within the TSG barrel, and torque values were captured by a camera recording the human–machine interface (HMI) screen of the TSG. The videos were transcribed manually to obtain time-series data. The barrel of the TSG has been divided into eight zones as shown in Figure 2. In-line recording of the granule size distribution (GSD) was performed using Eyecon (Innopharma Laboratories, Dublin, Ireland). The collected data were collated and time synchronized such that the time-series data were reported at 5 s interval for all parameters under consideration.
Energy Efficiency Calculations
The energy efficiency of the twin screw granulation can be defined as the ratio of the work done by the granulator system to the total energy supplied to the system. Both of these terms can be calculated by combining process knowledge with the first law of thermodynamics. The first law states that the total change in the internal energy of the system is equal to the sum of work done on the system and the heat exchanged by the system. The change in the internal energy of the system can be captured by the heat of nucleation. The heat exchanged for the system would be the total amount of heat gained by the granules/powders and heat gained by the barrel of the TSG. The torque imparted by the motor through the screws is responsible for all the work done on the system, which includes granulation and conveying of powders. Thus, the heat balance for the TSG equipment was calculated as in eq 1.
| 1 |
Here, Hwetting is the enthalpy of wetting of the granules, Ejacket is the heat exchanged between the granulating powders and the TSG jacket, Egranules is the heat gained by the granules, Wgranulation is the work done on the system for granulation, Escrews is the energy used by the screws to convey the granulating powder mixture, and Emotor is the mechanical energy imparted by the TSG motor.
Wetting is an exothermic processes and the heat dissipated is absorbed by the granules as well as the surrounding jacket.23 It was assumed that all of the wetting occurs in zone 3 and all of the heat dissipated is gained by the granules, leading to an increase in the temperature. Thus, the heat gained by the granules per unit time was calculated as in eq 2.
| 2 |
Here, mgzone3 is the mass of granules present in zone 3, Cpg is the heat capacity of the granules, Tzone3 and Tzone2 are temperatures of the granules in zones 3 and 2 of the TSG barrel, respectively. A value of 0.8 kJ/kg was used for Cpg.
The second assumption made was that in all zones, the torque from the screws is used for granulation, conveying of the powder, and heat generation due to friction. The third assumption made was that the temperature of the granules and the zones of the TSG jacket were the same. This assumption was undertaken as the determination of the temperature of the granules inside the solid barrel of the TSG was not feasible. Thus, the total energy gained by the granules and the jacket per unit time as in eq 3.
| 3 |
Here, mjzonen is the mass of the jacket in zone n, Cpj is the specific heat capacity of the stainless-steel jacket, and ΔTn is the temperature difference between the zone n and zone n – 1. A value of 0.468 kJ/kg was used for Cpj for the stainless steel jacket.
Escrews can be estimated as the work performed by the system to convey the powders and rotate the screws. It is represented in eq 4 as
| 4 |
In eq 4, the first term mg × λ × g indicates the amount of energy required to convey the powders, where λ represents the progress resistance coefficient, and g is the gravitational force constant. λ helps describe the viscous nature of the powder blend and a value of 2.5 was chosen.30 The energy used for the rotating of the screws can be determined from the torque when the TSG is empty and the screws are rotated. Similarly, the total energy of the motor can be calculated from the torque reading of the motor. Thus, substituting all the obtained values in eq 1 and rearranging. Wgranulation can be written as
| 5 |
Heat energy dissipated as well as work done for granulation is reported in Section as calculated in eqs 3 and 5 respectively.
LSTM Model Development
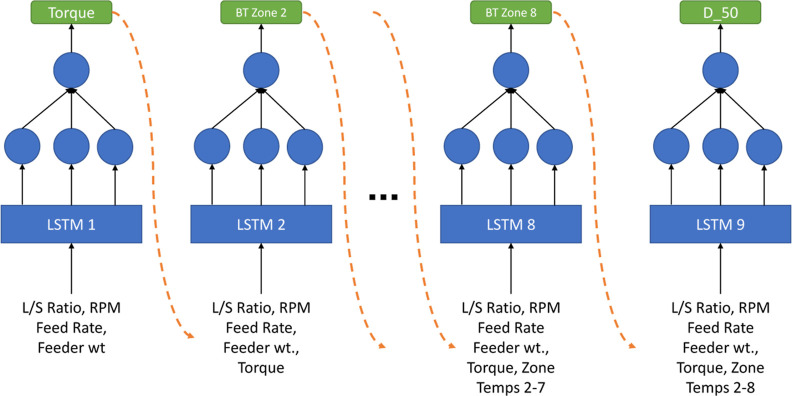
The developed initial LSTM models took time series data of powder feed rate, screw speed, net weight inside the feeder, and L/S Ratio as inputs. All the input data were noisy in nature; thus, a smoothing algorithm was used. A Savitsky–Golay filter with a window of five and a polynomial value of 2 was used. All inputs were scaled using a “MinMaxScaler” from the sklearn.preprocessing Python package.31 The LSTM predicts the torque, median granule diameter (D50), and the temperatures of the barrels as a time-series. Each predicted output was added to the input to predict the next output. Thus, overall nine LSTM models were trained sequentially to predict torque, median granule diameter (D50), and the temperatures of the barrels at zones 2–8. The model structure is shown in Figure 3. All nine LSTM models had the same structure, where the input nodes were connected to a single LSTM layer connected to a final dense connected output layer. The LSTM layer used the “relu” activation function with a L1.L2 bias regularizer with each constant equal to 0.008. The output layer has a “linear” activation function. The Adagrad optimization algorithm was used with a learning rate of 0.125. The metric used to evaluate training for all of the models was the mean squared error (MSE). Each batch of the LSTM model was trained on 210 s of historical data and validated against 30 s of future process data. Each LSTM was trained for a maximum of 1000 epochs with an early stopping patience of 50 epochs, where if no improvement in training was observed for 50 epochs, the model would terminate training. Since, a lower amount of time-series data was available, only 15% of the overall data was used for validation.
Figure 3.
Structure of the LSTM model used to predict the outputs. Each predicted output is added to the inputs to predict the final outcomes of the process (BT: barrel temperature).
Optimization Framework
The energy efficiency of the TSG process is defined as the ratio of the work done for granulation to the total amount of energy supplied by the TSG motor. Using the work of granulation calculated in eq 5, the energy efficiency (η) of the TSG can be defined as seen in eq 6.
| 6 |
The process parameters identified to optimize were the screw speed (SS), powder feed rate (PFR), and the L/S ratio. During the TSG experimental run, the set points of these three variables can be altered without the need to stop and restart the experiment. The objective of the optimization was to maximize η calculated in eq 6 given the constraints for the three process parameters. Most global optimization frameworks help determine the minima of a function compared to the maxima; thus, the objective function for this optimization can be written as follows
| 7 |
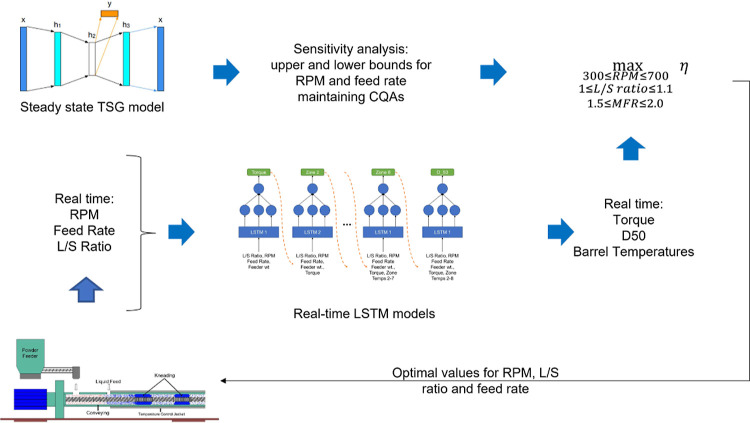
The limits of the constraints were determined by a combination of the design space used for the experiments as well as the assessing the risk of the model using a framework developed in Sampat and Ramachandran.32 The value of the objective function was determined from the predictions of the developed LSTM models and heat balance equations. The objective function was not a continuous function; thus, an optimization algorithm that did not require the calculation of the gradient had to be chosen. Differential evolution algorithm was implemented using the scipy.optimize Python package.33 The “best1bin” strategy was chosen to create trial candidates as it chooses two random members from a population, and their difference is then used to mutate the best member. Here, the best member indicates the member (i.e., the design parameter combination) that results in the lowest objective function value. The best member gets updated as better performing mutated members, that yields lower objective function values, are generated. Each population is determined using a binomial distribution. The population initialization was performed using Latin Hyper Cube sampling as it maximizes the coverage of the available design space. The optimal values of SS, PFR, and L/S obtained from the optimization were used as set-points for process parameters of the TSG, and updated based on the predefined time intervals to increase the energy efficiency. The optimization schema is illustrated in Figure 4. The performance of this algorithm was tested with two scenarios with different optimization intervals. In the first scenario, the optimization was performed at every 10 min, where as in the second scenario, the optimization was performed every 5 min.
Figure 4.
Optimization schema used to maximize the energy efficiency of the TSG process. The predictions from the LSTM model were to calculate η and the optimal values obtained were sent back to the TSG at pre-defined intervals.
Results and Discussion
Experimental Results
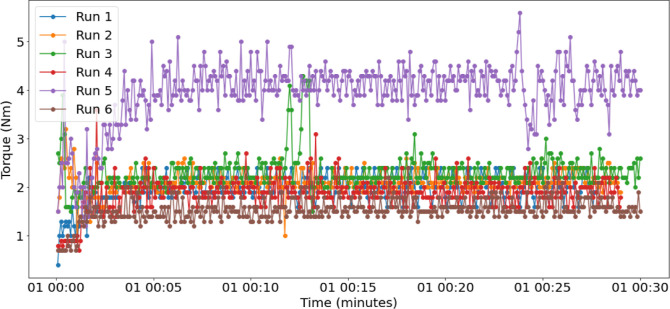
Six TSG experimental runs were performed for about 30 min, and the process outcome data were collected. The torque values for all six runs is shown in Figure 5. The torque values increase gradually for all six runs until they all reach a steady state torque value. The final average values at steady state for each of the six runs vary depending on the process parameters chosen for the process. The process parameters, especially the powder feed rate, L/S ratio, and screw speed help determine the fill level within the barrels of the TSG. The fill level in turn determines the amount of granulation occurring within the TSG. With an increase in the fill level within the TSG barrel, a greater amount of energy is required to convey the granulation powder and liquid mixture. The highest average torque was observed for Run5, which has an screw speed of 700 RPM, powder feed rate of 1.5 kg/h, and L/S ratio of 1. The highest torque was a result of two main factors: the high screw speed and relatively higher fill level within the barrels. The highest fill level would have been obtained for runs 1 and 4 due to the lower screw speed and higher mass flow rate values.
Figure 5.
Variation of torque with time for six experimental runs.
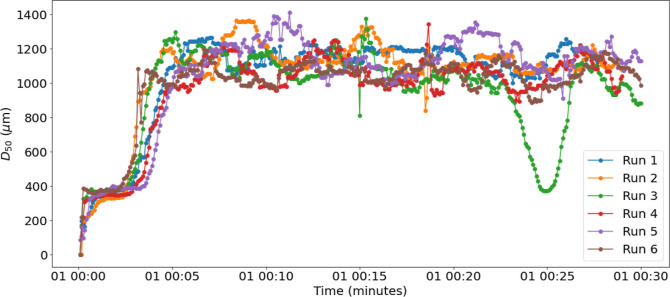
The critical quality attribute (CQA) measured as a part of these experimental runs was the granule size distribution (GSD) of the wet granules was measured using the Eyecon by focusing the beam on a thin layer of granules on a conveyor belt. The GSD reported was used as an in-line indicator for quality determination and whether the granules obtained are within the desired range. A desired range of D50 of the wet output granules was determined based on the final dried GSD sieve analysis and the range obtained was 750–1300 (μm). A comparison of the obtained D50s for different runs with time is shown in Figure 6. It was observed that the average D–50 for all runs was within the derived spectral range and could be used for further processing. The sudden drop at 25th min for run 3 can be associated with a scarce distribution of the granules on the conveyor belt, which could be attributed to a temporary disturbance in the feeders that affected the flow of granules exiting the TSG.
Figure 6.
Variation of the median diameter D50 with time for six experimental runs.
Heat Lost during the TSG Experimental Runs
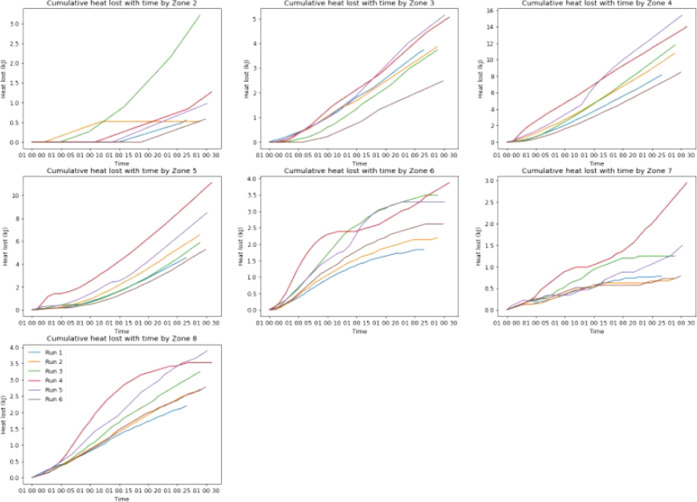
The temperatures for each zone of the TSG were collected at a 5 s interval and were used to calculate the heat loss according to eq 3. The cumulative heat loss with time for each zone was calculated and is presented in Figure 7. The cumulative heat loss values for zones 4 and 5 were the highest compared to other TSG zones. The heat loss in zone 5 was higher due to the presence of kneading elements, which promote mixing and granulation. The heat loss was highest in zone 4 due to large amount of back-mixing which occurs because of the proceeding kneading element zone.9 The heat loss values are also an indication of the amount of frictional losses by the screws. The heat loss is also affected by the amount of fill within the barrels, as the higher fill levels require higher torque, resulting in higher heat loss.
Figure 7.
Cumulative heat loss with time for each zone of the TSG.
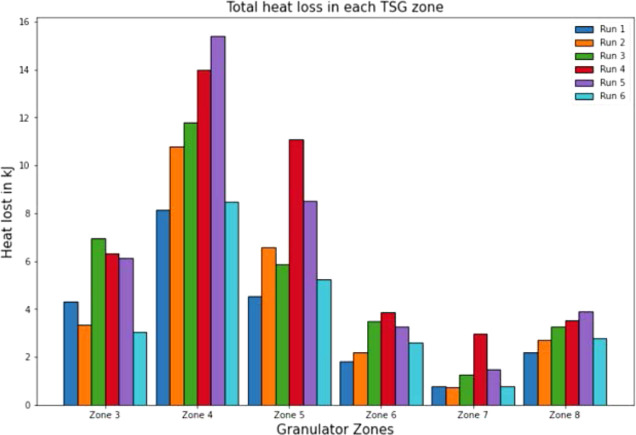
The heat loss calculated for run 4 (500 rpm, 1 L/S, 1.75 kg/h) was higher for all other zones due to the higher fill level based on the process conditions. Figure 8 illustrates the total amount of heat loss by all zones in all experimental runs. Run 5 (700 rpm, 1 L/S, 1.75 kg/h) also reported a higher value of heat loss, which can be attributed to the higher amount of torque required to operate the TSG as seen in Figure 5. The total heat loss for other runs was observed to be lower due to the fill level being lower within the TSG barrels as well as the lower screw speed used. It is also important to look at total heat loss in each zone to understand the effect of different screw elements, as illustrated in Figure 9. The kneading elements are present in zone 5 of the TSG barrel based on the screw configuration. Bulk granulation occurs in this zone, thus having a higher amount of total heat lost. However, the highest heat loss was observed in zone 4 for all six runs. This could be attributed to the large amount of back mixing that occurs within that zone. This back mixing leads to more torque being used to transport the material, leading to excess heat loss. Thus, the prediction of zone temperatures for these two zones is vital for modeling the heat loss for the system.
Figure 8.
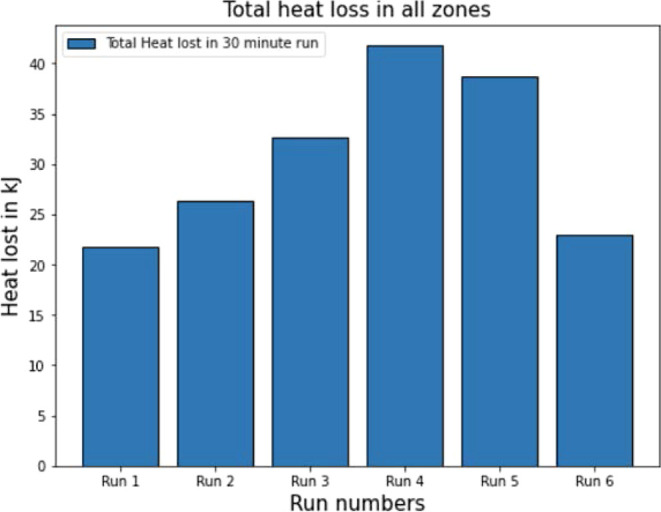
Cumulative heat loss with time for each zone of the TSG.
Figure 9.
Cumulative heat loss with time for each zone of the TSG.
LSTM Model Performance
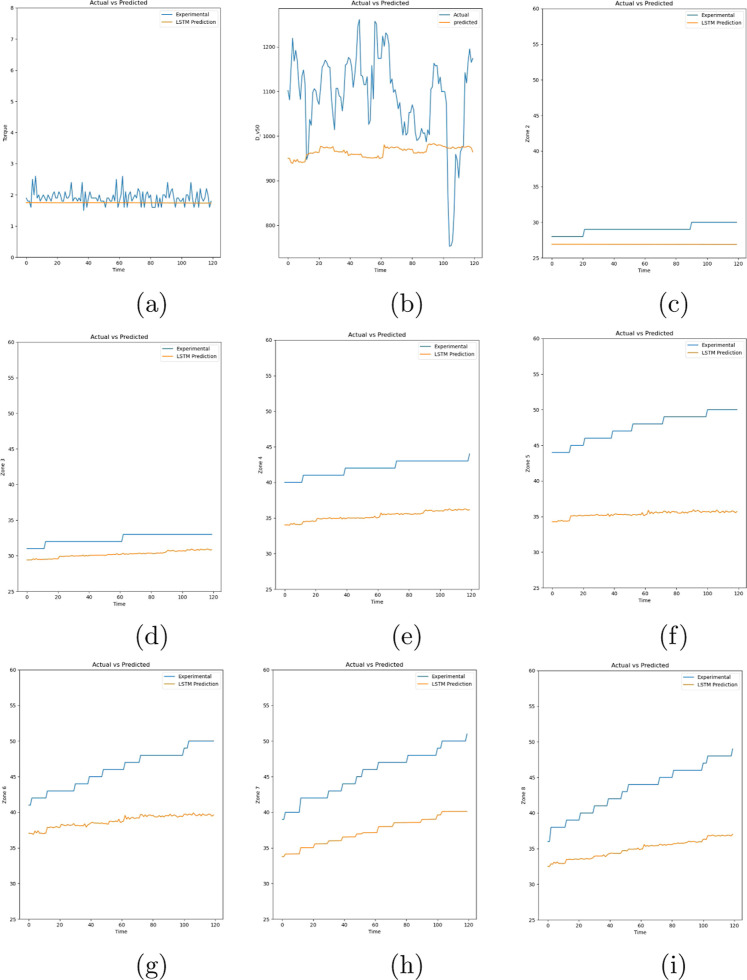
The developed LSTM model structure was used to predict the torque of the system, zone temperatures of the TSG barrels, and D50 of the wet granules at the output of the TSG granulator. During the training of the LSTM model the validation loss, determined by mean squared error (MSE), was used to monitor the performance of the model and callbacks were initialized in order to terminate training if no improvement in the training was observed. This resulted in an LSTM model training that did not show any overfitting characteristics when the training and validation losses were compared. The comparison between the experimental values and the values predicted by LSTM can be seen in Figure 10. The blue lines represent the experimentally recorded values, whereas the orange lines in the subfigures represent the predictions obtained from the LSTM. Calculation of coefficient of determination or R2 was not performed due to the noisy nature of the collected experimental data. Rather the mean average percentage error (MAPE) was determined to understand whether the predictions were close to the experimentally observed values. The MAPE for the torque prediction as seen in Figure 10a was 10.74%, which meant that on average, the prediction values were within 10% of the experimental value. Similarly, the predictions of the temperature of the zones the barrel of the TSG, the MAPE ranged from a low of 2% to a high of 19%. Though some zones had a lower accuracy in predictions, the difference or gain in temperature over time was consistent. The increase was used for calculation of heat loss, thus provided fairly accurate values. The MAPE for the prediction of D50 was 12% making predictions still within the range observed. The overall prediction of the LSTM were smooth compared to experimental data due to the fact that the input data had been smoothened as well as LSTM inherently has some smoothing nature associated with its predictions.26
Figure 10.
Parity plot comparing model prediction to experimental results for the 9 response variables, including torque, granule D50, and barrel temperatures for zones 2–8.
Optimization Results
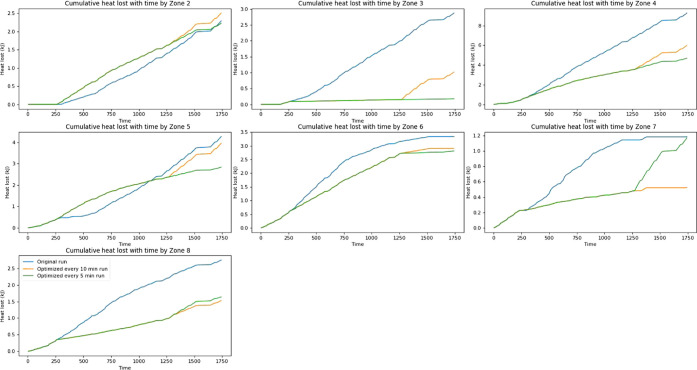
The optimization algorithm was tested under two scenarios: (1) for a 30 min run, optimization was performed at 10 min intervals; (2) for a 30 min run, optimization was performed at 5 min intervals. For both scenarios, the initial process parameters were set at a screw speed of 700 rpm, L/S ratio of 1, and powder feed rate at 1.75 kg/h. These initial parameters were randomly selected based on the criteria of being within the process design space. In the first scenario, there were two optimization points in the 30 min run, i.e., first at 10 min and second at the 20 min mark. The optimization algorithm as described in the methods section was executed at 10 min intervals, and optimal process parameter values were collected to increase the process efficiency of the system. The resulting optimal values for this scenario are shown in Table 2. The optimal values obtained at the first optimization interval indicate that the optimization algorithm tries to increase the fill level within the barrel of the TSG by decreasing the screw speed and adjusting the L/S ratio and powder feed rate marginally. At the second optimization time point, the optimization decreases the screw further, leading to a further increase in the fill level within the barrels. This can also be seen in Figure 11, where the heat loss for the 10 optimization increases in zones 4 and 5. These zones are expected to have a higher amount of fill within the barrels. With the increase in fill level, a higher amount of granulation is expected. This was reflected in the obtained values of work of granulation which increase from 124 to 165 kJ indicating an increase in 33% over the original process conditions. This increase in the work of granulation led to an overall increase in the energy efficiency of the process by 27.18%.
Table 2. Optimal Process Parameters Obtained for Optimization Performed at 10 min Intervals.
| no. | time (min) | screw speed (rpm) | L/S ratio | powder feed rate (kg/h) |
|---|---|---|---|---|
| 1 | 0 | 700 | 1.000 | 1.75 |
| 2 | 10 | 620 | 1.006 | 1.695 |
| 3 | 20 | 550 | 1.098 | 1.714 |
Figure 11.
Comparing the cumulative heat loss with time for each zone of the TSG between the original run and the two optimization scenarios.
In the second scenario, the optimization was performed at a 5 min interval, leading to five optimization time points at 5, 10, 15, 20, and 25 min, respectively. The optimal values for the process parameters obtained at the 5 and 10 min optimization points lower the screw speed and increase the flow rate and the L/S ratio. This behavior is similar to observations in the previous optimization, where the optimization increases the fill level within the barrels, encouraging a higher degree of granulation. However, at the 15 min optimization time point, the optimization changed the process parameters significantly to reduce the amount of powders within barrel. The increased fill level in the previous time steps leads to an increase in the amount of heat loss as seen in Figure 11. The green line in Figure 11 indicates a higher heat loss compared to that of other runs during the initial part of the run and then attempts to decrease the heat loss. At the 20 and 25 min optimization time points, the optimization algorithm starts to alternate between increasing and decreasing the fill level to maintain the heat loss within the TSG. The resulting process parameters from the second optimization are shown in Table 3. Due to large number of changes in fill level, fluctuations led to lesser amount of granulation occurring within the TSG. This was reflected in the increase in granulation work, where the increase was marginally lower than the 10 min optimization at 161.65 kJ, which is 5% lower. Thus, the overall increase in efficiency of the second scenario was 24.93%. The resulting values of work of granulation, energy efficiency improvements for the two optimization scenarios, and the original run are compared in Table 4.
Table 3. Optimal Process Parameters Obtained for Optimization Performed at 5 min Intervals.
| no. | time (min) | screw speed (rpm) | L/S ratio | powder feed rate (kg/h) |
|---|---|---|---|---|
| 1 | 0 | 700 | 1.000 | 1.75 |
| 2 | 5 | 647 | 1.092 | 1.838 |
| 3 | 10 | 530 | 1.075 | 1.858 |
| 4 | 15 | 618 | 1.095 | 1.505 |
| 5 | 20 | 404 | 1.000 | 1.722 |
| 6 | 25 | 467 | 1.024 | 1.734 |
Table 4. Optimal Process Parameters Obtained for Optimization Performed at 5 min Intervals.
| run | work of granulation (kJ) | total energy used (kJ) | % increase in efficiency | yield |
|---|---|---|---|---|
| original run | 124.03 | 3998.4 | 69% | |
| 10 min optimization | 164.78 | 41,769 | 27.18% | 68% |
| 5 min optimization | 161.65 | 41,711 | 24.93% | 76% |
Figure 11 compares the heat loss in each zone of the TSG with the two optimization runs and it can be seen that both the optimization points attempt to decrease the amount of heat being lost in each compartment. The heat loss in zone 5 is higher for the optimization cases than that of the original run due to the increased amount of fill level in the kneading elements leading to a higher degree of granulation. The predictions of process outcomes such as torque and granule quality attribute such as median diameter of the wet granules were also compared to the original runs and are presented in Figure 12. To verify the effectiveness of the optimization algorithm, experiments were carried out by changing the process parameters according to the values obtained from the optimization. The energy efficiency values obtained from the verification experiments were within −4% of the simulated values. The yield of the optimized granulation runs was also determined by using sieve analysis. The yield was defined as the % of dried granules having a diameter between 215 (μm) and 1200 (μm). The yield obtained for the 10 min optimization run was 68%, while for the 5 min optimization run, the yield was around 76%. The yield for the original run was 69%, which meant that the yield actually decreased marginally. The yield for the 5 min optimization run increased on the other hand. Thus, if yield and energy efficiency both are required to be optimized, the 5 min optimization run would be to be employed compared to the 10 min optimization run.
Figure 12.
Dynamic torque and granule D50 change with time of the TSG run.
Conclusions
Decreasing the energy footprint of the complete CPM process is vital for pharmaceutical companies to meet their sustainability targets. In this study, thermodynamic laws combined with process knowledge were used to determine the energy calculations. Additionally, an algorithm to help increase the energy efficiency of a TSG process in real time during a manufacturing run was also developed. The developed framework was able to increase the energy efficiency by 27% over the experimental runs. The results from the optimization were also verified by performing validation experiments.
The developed optimization can be adapted to any unit process in the CPM process. Although the determination of energy efficiency requires process knowledge, the presented algorithm can take into account the new calculations, provide optimal process conditions, and help optimize the energy efficiency of the unit operation. Implementation of such a real-time optimization algorithm is essential for better process performance, product quality, and decreasing the carbon footprint.
Acknowledgments
The authors would like to acknowledge financial support from US Food and Drug Administration through grant DHHS-FDA-U01FD006487. The authors would also like to acknowledge funding from the Department of Energy (DOE) through the University of California Los Angeles (UCLA) and the Clean Energy Smart Manufacturing Innovation Institute (CESMII) via subaward no. 4550GYA102.
Author Present Address
† Current address: Ingredion Incorporated, 10 Finderne Ave, Bridgewater, NJ 00807
Author Contributions
CRediT: Chaitanya Sampat investigation, methodology; Rohit Ramachandran conceptualization, project administration, resources.
The authors declare no competing financial interest.
References
- Roche . Sustainability at Roche, 2021. accessed: 2022–05–23. https://www.roche.com/about/sustainability/.
- Inc, A. Environmental . Social and Governance Report 2021, 2021. accessed: 2022–05–23. https://www.amgen.com/responsibility/environmental-social-and-governance-report.
- Novartis . Novartis in Society, ESG Report 2020, 2020. accessed: 2022–05–23. https://www.novartis.com/sites/novartis_com/files/novartis-in-society-report-2020.pdf.
- Pfizer . Pfizer’s Green Journey, 2021. accessed: 2022–05–23. https://www.pfizer.com/about/responsibility/environmental-sustainability.
- GSK . ESG Performance Report 2020, 2020. accessed: 2022–05–23. https://www.gsk.com/media/6636/esg-performance-summary-2020.pdf.
- Jiménez-González C.; Poechlauer P.; Broxterman Q. B.; Yang B.-S.; Am Ende D.; Baird J.; Bertsch C.; Hannah R. E.; Dell’Orco P.; Noorman H.; et al. Key Green Engineering Research Areas for Sustainable Manufacturing: A Perspective from Pharmaceutical and Fine Chemicals Manufacturers. Org. Process Res. Dev. 2011, 15, 900–911. 10.1021/op100327d. [DOI] [Google Scholar]
- Budzinski K.; Constable D.; D’Aquila D.; Smith P.; Madabhushi S. R.; Whiting A.; Costelloe T.; Collins M. Streamlined life cycle assessment of single use technologies in biopharmaceutical manufacture. New Biotechnol. 2022, 68, 28–36. 10.1016/j.nbt.2022.01.002. [DOI] [PubMed] [Google Scholar]
- US Food and Drug Administration Quality considerations for continuous manufacutring, 2019. accessed: 2022–05–16.
- Kotamarthy L.; Dan A.; Karkala S.; Parvani S.; Román-Ospino A. D.; Ramachandran R. Twin-screw granulation: Mechanistic understanding of the effect of material properties on key granule quality attributes through the analysis of mixing dynamics and granulation rate mechanisms. Adv. Powder Technol. 2023, 34, 104137. 10.1016/j.apt.2023.104137. [DOI] [Google Scholar]
- Kumar A.; Vercruysse J.; Mortier S. T.; Vervaet C.; Remon J. P.; Gernaey K. V.; De Beer T.; Nopens I. Model-based analysis of a twin-screw wet granulation system for continuous solid dosage manufacturing. Comput. Chem. Eng. 2016, 89, 62–70. 10.1016/j.compchemeng.2016.03.007. [DOI] [Google Scholar]
- Seem T. C.; Rowson N. A.; Ingram A.; Huang Z.; Yu S.; de Matas M.; Gabbott I.; Reynolds G. K. Twin screw granulation - A literature review. Powder Technol. 2015, 276, 89–102. 10.1016/j.powtec.2015.01.075. [DOI] [Google Scholar]
- Thompson M. R. Twin screw granulation-review of current progress. Drug Dev. Ind. Pharm. 2015, 41, 1223–1231. 10.3109/03639045.2014.983931. [DOI] [PubMed] [Google Scholar]
- Dhenge R. M.; Cartwright J. J.; Hounslow M. J.; Salman A. D. Twin screw wet granulation: Effects of properties of granulation liquid. Powder Technol. 2012, 229, 126–136. 10.1016/j.powtec.2012.06.019. [DOI] [Google Scholar]
- Van Melkebeke B.; Vervaet C.; Remon J. P. Validation of a continuous granulation process using a twin-screw extruder. Int. J. Pharm. 2008, 356, 224–230. 10.1016/j.ijpharm.2008.01.012. [DOI] [PubMed] [Google Scholar]
- Hindiyeh M.; Altalafha T.; Al-Naerat M.; Saidan H.; Al-Salaymeh A.; Sbeinati L.; Saidan M. N. Process modification of pharmaceutical tablet manufacturing operations: an eco-efficiency approach. Processes 2018, 6, 15. 10.3390/pr6020015. [DOI] [Google Scholar]
- Vercruysse J.; Peeters E.; Fonteyne M.; Cappuyns P.; Delaet U.; Van Assche I.; De Beer T.; Remon J. P.; Vervaet C. Use of a continuous twin screw granulation and drying system during formulation development and process optimization. Eur. J. Pharm. Biopharm. 2015, 89, 239–247. 10.1016/j.ejpb.2014.12.017. [DOI] [PubMed] [Google Scholar]
- Ryckaert A.; Stauffer F.; Funke A.; Djuric D.; Vanhoorne V.; Vervaet C.; De Beer T. Evaluation of torque as an in-process control for granule size during twin-screw wet granulation. Int. J. Pharm. 2021, 602, 120642. 10.1016/j.ijpharm.2021.120642. [DOI] [PubMed] [Google Scholar]
- Dan A.; Vaswani H.; Šimonová A.; Grząbka-Zasadzińska A.; Li J.; Sen K.; Paul S.; Tseng Y.-C.; Ramachandran R. End-point determination of heterogeneous formulations using inline torque measurements for a high-shear wet granulation process. Int. J. Pharm.: X 2023, 6, 100188. 10.1016/j.ijpx.2023.100188. [DOI] [PMC free article] [PubMed] [Google Scholar]
- Mamidi H. K.; Palekar S.; Nukala P. K.; Mishra S. M.; Patki M.; Fu Y.; Supner P.; Chauhan G.; Patel K. Process optimization of twin-screw melt granulation of fenofibrate using design of experiment (DoE). Int. J. Pharm. 2021, 593, 120101. 10.1016/j.ijpharm.2020.120101. [DOI] [PubMed] [Google Scholar]
- Meng W.; Román-Ospino A. D.; Panikar S. S.; O’Callaghan C.; Gilliam S. J.; Ramachandran R.; Muzzio F. J. Advanced process design and understanding of continuous twin-screw granulation via implementation of in-line process analytical technologies. Adv. Powder Technol. 2019, 30, 879–894. 10.1016/j.apt.2019.01.017. [DOI] [Google Scholar]
- Liu H.; Galbraith S.; Ricart B.; Stanton C.; Smith-Goettler B.; Verdi L.; O’Connor T.; Lee S.; Yoon S. Optimization of critical quality attributes in continuous twin-screw wet granulation via design space validated with pilot scale experimental data. Int. J. Pharm.: X 2017, 525, 249–263. 10.1016/j.ijpharm.2017.04.055. [DOI] [PMC free article] [PubMed] [Google Scholar]
- Liu H.; Ricart B.; Stanton C.; Smith-Goettler B.; Verdi L.; O’Connor T.; Lee S.; Yoon S. Design space determination and process optimization in at-scale continuous twin screw wet granulation. Comput. Chem. Eng. 2019, 125, 271–286. 10.1016/j.compchemeng.2019.03.026. [DOI] [Google Scholar]
- Stauffer F.; Ryckaert A.; Van Hauwermeiren D.; Funke A.; Djuric D.; Nopens I.; De Beer T. Heat transfer evaluation during twin-screw wet granulation in view of detailed process understanding. AAPS PharmSciTech 2019, 20, 291. 10.1208/s12249-019-1483-z. [DOI] [PubMed] [Google Scholar]
- Lin T.; Horne B. G.; Tino P.; Giles C. L. Learning long-term dependencies in NARX recurrent neural networks. IEEE trans. neural netw. 1996, 7, 1329–1338. 10.1109/72.548162. [DOI] [PubMed] [Google Scholar]
- Gers F. A.; Schmidhuber J.; Cummins F. Learning to forget: Continual prediction with LSTM. Neural Comput. 2000, 12, 2451–2471. 10.1162/089976600300015015. [DOI] [PubMed] [Google Scholar]
- Van Houdt G.; Mosquera C.; Nápoles G. A review on the long short-term memory model. Artif. Intell. Rev. 2020, 53, 5929–5955. 10.1007/s10462-020-09838-1. [DOI] [Google Scholar]
- Storn R.; Price K. Differential evolution–a simple and efficient heuristic for global optimization over continuous spaces. J. Glob. Optim. 1997, 11, 341–359. 10.1023/A:1008202821328. [DOI] [Google Scholar]
- Bilal; Pant M.; Zaheer H.; Garcia-Hernandez L.; Abraham A. Differential Evolution: A review of more than two decades of research. Eng. Appl. Artif. Intell. 2020, 90, 103479. 10.1016/j.engappai.2020.103479. [DOI] [Google Scholar]
- Georgioudakis M.; Plevris V. A Comparative Study of Differential Evolution Variants in Constrained Structural Optimization. Front. built environ. 2020, 6, 102. 10.3389/fbuil.2020.00102. [DOI] [Google Scholar]
- Yuan J.; Li M.; Ye F.; Zhou Z. Dynamic characteristic analysis of vertical screw conveyor in variable screw section condition. Sci. Prog. 2020, 103, 003685042095105. 10.1177/0036850420951056. [DOI] [PMC free article] [PubMed] [Google Scholar]
- Pedregosa F.; et al. Scikit-learn: Machine Learning in Python. J. Mach. Learn. Res. 2011, 12, 2825–2830. 10.5555/1953048.2078195. [DOI] [Google Scholar]
- Sampat C.; Ramachandran R. Risk Assessment for a Twin-Screw Granulation Process Using a Supervised Physics-Constrained Auto-encoder and Support Vector Machine Framework. Pharm. Res. 2022, 39, 2095–2107. 10.1007/s11095-022-03313-y. [DOI] [PubMed] [Google Scholar]
- Virtanen P.; Gommers R.; Oliphant T. E.; Haberland M.; Reddy T.; Cournapeau D.; Burovski E.; Peterson P.; Weckesser W.; Bright J.; et al. SciPy 1.0: Fundamental Algorithms for Scientific Computing in Python. Nat. Methods 2020, 17, 261–272. 10.1038/s41592-019-0686-2. [DOI] [PMC free article] [PubMed] [Google Scholar]


